Embed Size (px)
Citation preview

1
Postgraduate Course on Clinical
Drug Development
Clinical Biostatistics II
László Tóthfalusi Ph.D.
Department of Pharmacodynamics
Semmelweis University of Medicine

2
Clinical Trial Design
A clinical trial is an experiment which any damn fool
can design and frequently does.
S Senn

3
Clinical Studies and Clinical Trials
Observational study Interventional
Controlled Clinical Study
Randomized
Controlled
Clinical Study
Non randomized
(Cohort)
Descriptive
(no control)
Analytical
(with control)
Correlational
Retrospective Prospective
Cross-sectional
Histrorical
Control Paralell
Control

4
Case series – Metiamide was an H-2 blocker, which was
withdrawn after marketing outside the US because it caused agranulocytosis. Since cimetidine is chemically related to metiamide there was a concern that cimetidine might also cause agranulocytosis.
– The manufacturer asked its sales representatives to recruit physicians to participate in the study. Each participating physician then enrolled the next series of patients for whom the drug was prescribed. Observe there is no control group !

5
Correlation
Trend analysis

6
Observational designs
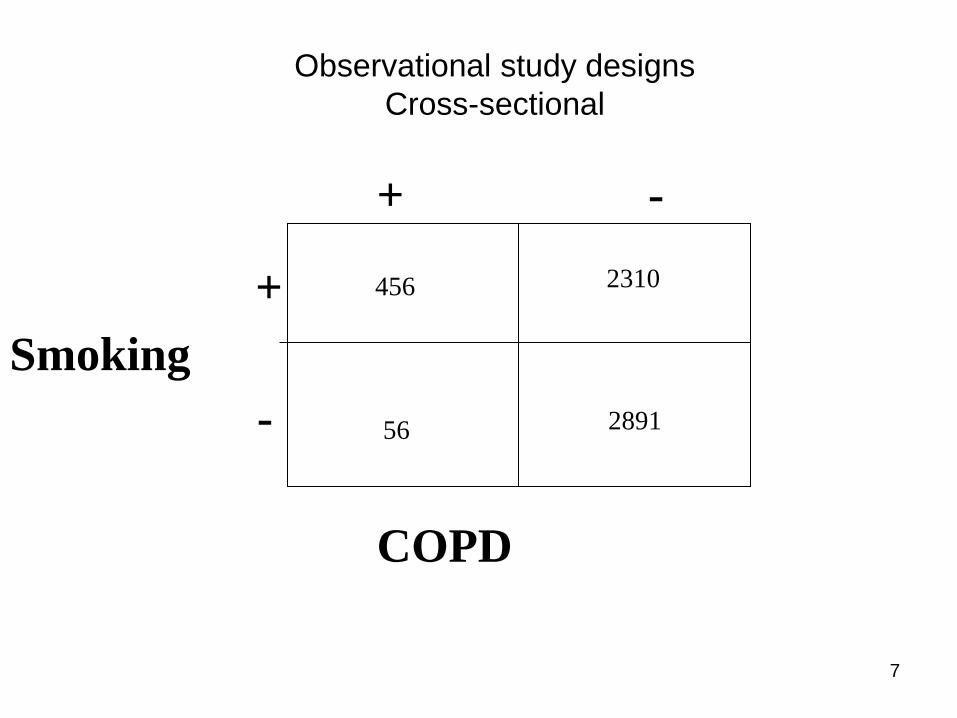
• Cross-sectional: where only ONE set of
observations is collected for every unit in
the study, at a certain point in time,
disregarding the length of time of the study
as a whole
7
Observational study designs
Cross-sectional
Smoking
COPD
-
+
-
+
456 2310
56 2891

8
Longitudinal observational study
Retrospective Past Present Future
Symptoms
Treated
Case Control Treated
Symptoms
Historic Cohort
Non-treated
Non treated

Case-control: Example
9
Breast cancer was diagnosed in both groups
Case – Patient used levonorgestrel
Control – Patient did not use levonorgestrel

10
Prospective experimental designs
Result
Cohort
Randomization Result
Treated
Control
Treated
Control
RCT = Randomized Controled Study
Past Present Future

11
Basic RCT design 1 : Parallel

12
Basic RCT design 2
Two interventions at the same time (split-person design) New topical cream for
psoriasis could be evaluated by being applied to one armand a standard cream
applied to the other arm.
13
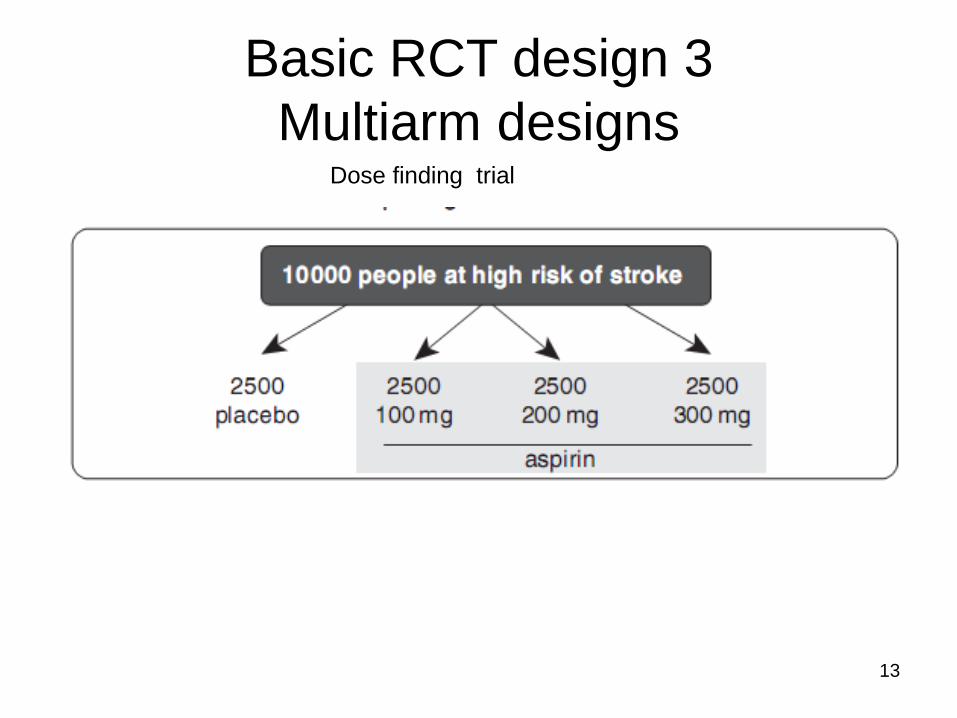
Basic RCT design 3
Multiarm designs Dose finding trial

Basic RCT design 4 - factorial • Factorial clinical trials are experiments that test the effect of more
than one treatment
• The simplest factorial design is the 2 × 2 factorial with two levels of
factor A crossed with two levels of factor B to yield four treatment
combinations
• Factorial designs provide the only way to study interactions between
treatment A and treatment B. This is because the design has
treatment groups with all possible combinations of treatments.
14

Basic RCT Design 5 - Crossover
15
In crossover design each patient serves as his/her own matched control.
Every patient receives both treatment A and B

16
Bias and Variability for assessment of treatment effect.
17
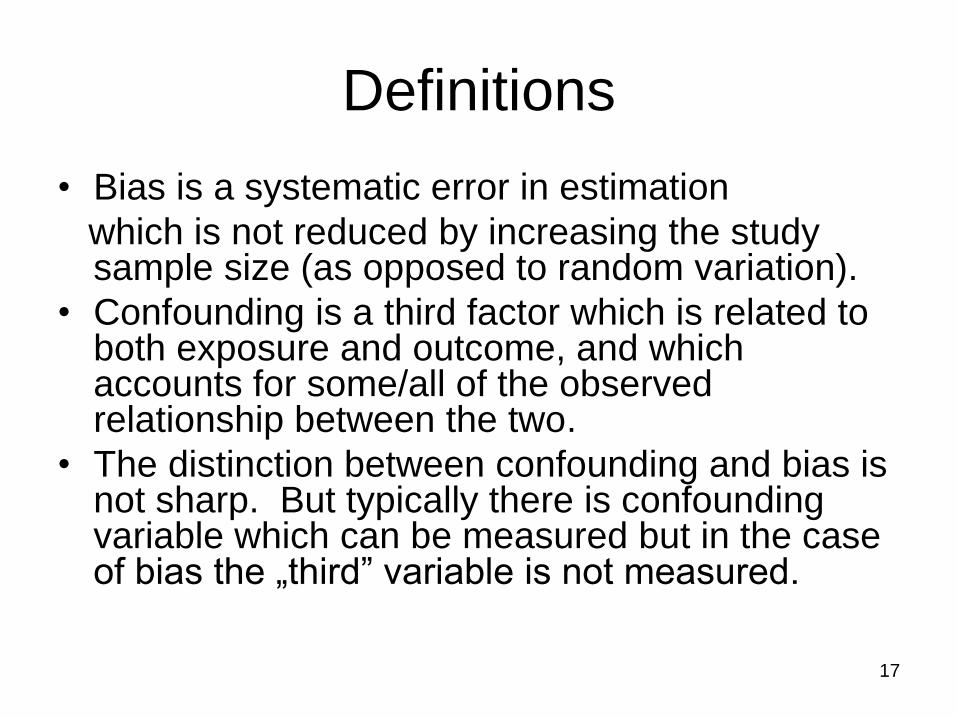
Definitions
• Bias is a systematic error in estimation
which is not reduced by increasing the study sample size (as opposed to random variation).
• Confounding is a third factor which is related to both exposure and outcome, and which accounts for some/all of the observed relationship between the two.
• The distinction between confounding and bias is not sharp. But typically there is confounding variable which can be measured but in the case of bias the „third” variable is not measured.

18
Definitions
• Variability
– the ability to repeat or reproduce similar
response
• bioequivalence trial
• two successful trials
• Generalizability
– results can be generalized from the study
population to target patient population
19
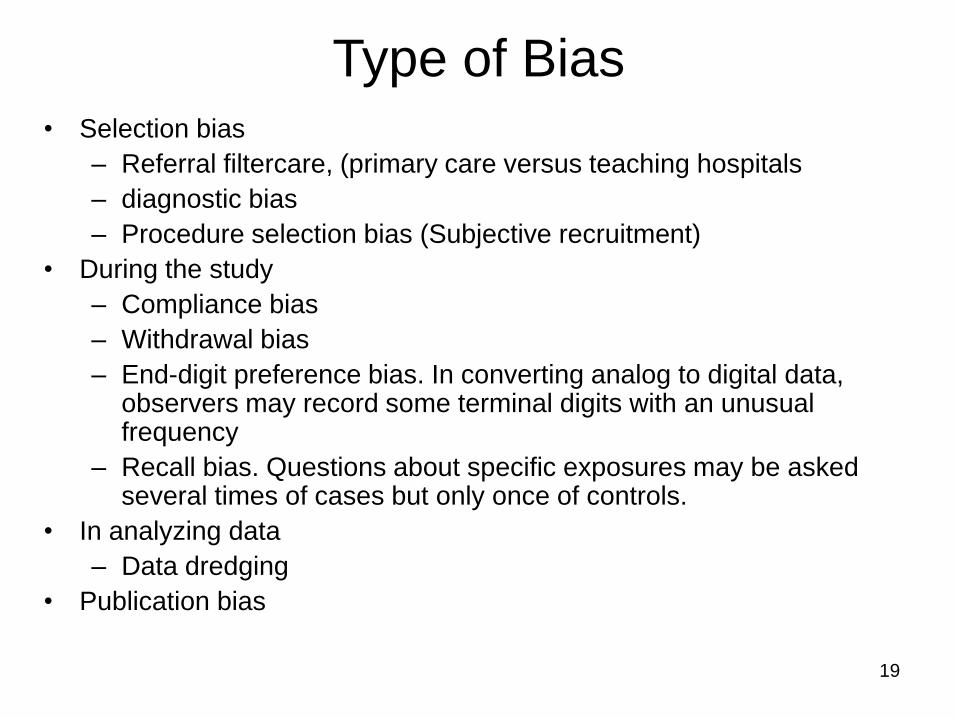
Type of Bias
• Selection bias
– Referral filtercare, (primary care versus teaching hospitals
– diagnostic bias
– Procedure selection bias (Subjective recruitment)
• During the study
– Compliance bias
– Withdrawal bias
– End-digit preference bias. In converting analog to digital data, observers may record some terminal digits with an unusual frequency
– Recall bias. Questions about specific exposures may be asked several times of cases but only once of controls.
• In analyzing data
– Data dredging
• Publication bias

20
Model of the RCT trial
Population
Initial groups
Diagnostic error
Selection bias
Treated Control
Trial period
Selection bias Groups become unbalanced
regarding confounding factors
Compliance and drop out bias
Observation error
Different centers, different protocols

21
Techniques to reduce the bias
• Selection bias
• Selection bias
• Placebo effect
• Subjective evaluation
• Selective compliance
• Carry-over
• Baseline measurement test
treatment
• Randomization
• Single blind
• Double blind
• ITT analysis
• Cross-over design, Wash-
out

22
Value of Randomization
• Balances baseline characteristics
of the treatment groups
– eliminates confounding due to
measured and unmeasured factors
– provides an unbiased comparison
between groups
• Does NOT maintain balance after
randomization

23
Simple (unrestricted) randomization
• Advantages
– Each treatment assignment is completely unpredictable, and probability theory guarantees that in the long run the numbers of patients on each treatment will not be radically different and easy to implement
• Disadvantages
– Unequal groups
• one treatment is assigned more often than another
– Time imbalance or chronological bias
• One treatment is given with greater frequency at the beginning of a trial and another with greater frequency at the end of the trial.
• Simple randomization is not often used, even for large studies

24
Methods of randomization 1.
Static designs Unrestricted Blocked
lymph skin breast
Yes
lymph skin breast
No
U.S.
lymph skin breast
Yes
lymph skin breast
No
Europe
previous exposure
geographic location
site
Stratified
25
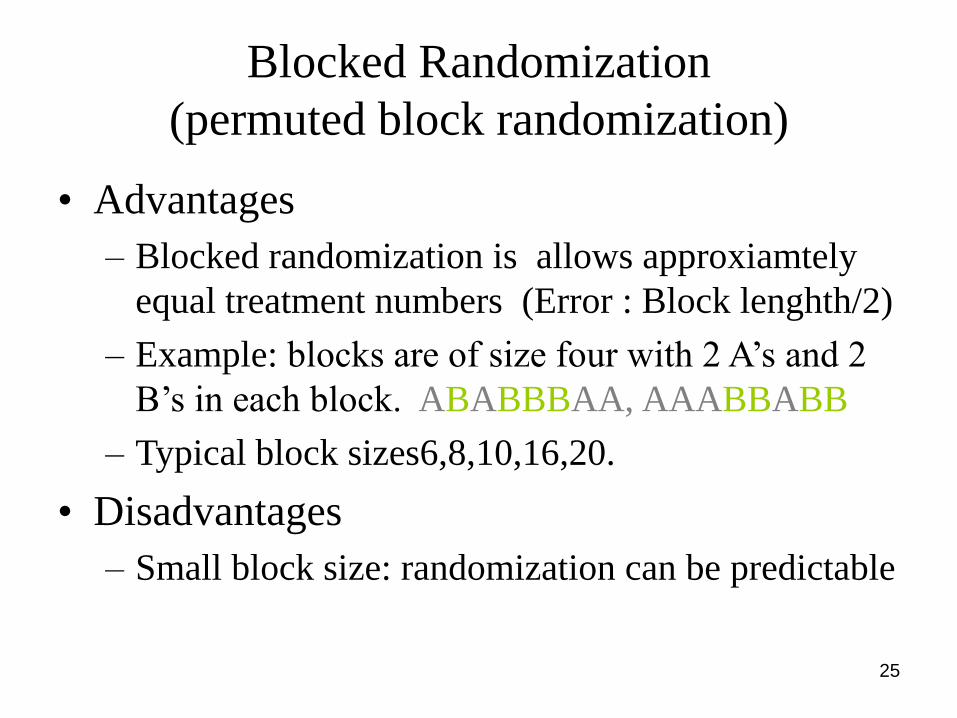
Blocked Randomization
(permuted block randomization)
• Advantages
– Blocked randomization is allows approxiamtely
equal treatment numbers (Error : Block lenghth/2)
– Example: blocks are of size four with 2 A’s and 2
B’s in each block. ABABBBAA, AAABBABB
– Typical block sizes6,8,10,16,20.
• Disadvantages
– Small block size: randomization can be predictable

Stratified randomization
26

27
Stratified randomization based on prognostic factors
– distribution of prognostic factors are
minimized
Age ( years) <=50 Or >50
Stage of disease 1 or 2 Or 3 or 4
Time between diagnosis of cancer and diagnosis of effusions(months)
<=30 Or >30
Menopausal Pre Or Post

28
Stratified randomization
• Advantages
– To make two study groups appear comparable with
regard to specified factors, the power of the study can
be increased by taking the stratification into account
in the analysis
• Disadvantages
– Complex (centralized)
– The prognostic factor used in stratified randomization
may be unimportant and other factors may be
identified later are of more importance
• Alternative:

29
Stratified randomization based on outcome:
Play the winner
The probability of the next treatment
assignment is altered on the basis of the
responses of previous patients enrolled.
• Advantage
– Ethics
• Disavantages
– Blinding ???

30
Bias and bias reduction techniques
Blinding • Maintains balanced groups during
follow-up
• Eliminates
– Unintended effective interventions • Classify similar events differently in
treatment groups
• Different medical interventions
• Problems with “soft” outcomes
– investigator judgement
– participant reported symptoms, scales
– causes bias

31
Intention to Treat Analysis vs. Intention to Treat Analysis
vs.
Per Protocol Analysis Per Protocol Analysis
Per Protocol Analysis:
Only patients who complete the
trial according to protocol
are analyzed.
Often used when examining
adverse events associated
with study drug
Intention to Treat Analysis
All randomized patients with
known outcomes are
included in final data
regardless of whether
they complete trial.
Preserves the value of
randomization.
Bias and bias reduction techniques: Dropouts and solutions

32
ITT- Explanation
• „For example, differential toxicity related to
severity of illness could lead to selection bias.
Similarly, the subjects unable to comply with
medication may be those most at risk of a
negative outcome and their exclusion may bias
the treatment comparison.” (FDA)
• ITT – this is for efficacy evaluation. For safety we
usually define the safety set as the set of
subjects who receive at least one dose of study
medication.

33
Practice of ITT
• Allowable exclusion
– Subjects who violate the inclusion/exclusion
criteria
– Subjects who fail to take at least one dose of
study medication
– Subjects who do not provide any post-
baseline data
• Modified intention-to-treat population
– Antibiotics trials – not target organism

34
Practice of ITT
Comparison of PTT and ITT
• „When the full analysis set and the per-protocol
set lead to essentially the same
conclusions,confidence in the trial results is
increased” (ICH)”
• Explanation:The per-protocol set, however, does
not need to give p≤0.05, but should provide
results which are qualitatively similar in terms of
the direction of the treatment effect and with
effect size not too dissimilar fromthat seen for
the full analysis set

35
Bias and bias reduction
techniques:Missing Data
• „Missing values represent a potential source of bias in a clinical trial. A trial may be regarded as valid, nonetheless, provided the methods of dealing with missing values are sensible, and particularly if those methods are pre-defined in the protocol.” (ICH)
• There are several kind of missing data – missing completely at random
• missingness may depend on observed covariates,
– missing at random
• missingness may depend on observed outcomes (and covariates) but not on unobserved outcomes.
– missing at non random
• missingness depends on unobserved values

36
Handling of Missing Data • Complete cases analysis
– Essentially PPT analysis
• Last observation carried forward (LOCF) – Takes the final observation for each patient and uses it as that
patient’s endpoint in the analysis.
• Success/failure classification – Dropouts being classified as treatment success or failure or
depending on the outcome at the time of dropping out.
• Worst case/best case imputation – This method gives those subjects who withdraw for positive
reasons the best possible outcome value for the endpoint and those who withdraw for negative reasons, the worst value.
• Regression imputation – Predict missing value using a regression model

37
Methods of handling missing data can be
combined
Explanation: for patients without week 16 values, LOCF was used if died
the worst case imputed value (zero metres )
The oucome was the distance (continous)

38
Hierarchy of studies
• I. Descriptive observational studies (no control) – Case report
– Case series
• II Correlational Studies, Surveys
• III. Analytical Observational studies (control) – Cross-sectional studies
– Case-control studies
– Cohort studies
– Hybrid studies
• IV Interventional studies or Clinical Trials – Controlled clinical trials
– Randomized, control clinical trials (RCT)
Weight Bias Confounding

39
Single Consent Prerandomized Design
Eligible patients
Randomize
Do not seek Seek consent
yes, B no, A
consent; give A for B
I
II
Innovative RCT design 1

40
Using phase II data, develop
predictor of response to new drug Develop Predictor of Response to New Drug
Patient Predicted Responsive
New Drug Control
Patient Predicted Non-Responsive
Off Study
Innovative RCT design 2
“Enrichment” Design

41
“Enrichment” Design
• Predictor
– Gene, Biomarker, Response to standard
treatment
• Advantage
– Larger power (larger number of responders)
• Disadvantage
– Trial population ----- Patient population

Validity
• Internal validity if the observed difference in
outcome between the study groups is real and
not due to bias, chance, or confounding.
• External validity refers to how the study
results can be generalized to a broader
population.
42

43
Statistical analysis
Primary and secondary endpoints
• ‘There should generally be only one
primary variable,’ (ICH)
• Primary endpoint. A trial that misses its
primary endpoint but makes various
endpoint but makes various
secondary/post secondary/post- -hoc
endpoints is hoc endpoints is a failed trial

44
The Carvedilol Story
SmithKline and Beecham whishes to register
Carvedilol .
Primary endpoint: Time on treadmill
4 controlled clinical studies are done
Primary endpoint: NS but mortality rate in control
group 7.8% , treated group 3.2%
IT IS REJECTED (in the first round)
.

45
Still there are cases for
multiple endpoints
• „‘A significant benefit for both primary endpoints,
lung function and the symptom based clinical
endpoint, should be demonstrated so that no
multiplicity adjustment to significance levels is
indicated.’ (CPMP (2002): ‘Note for Guidance on
the Clinical Investigation of Medicinal Products
in the Treatment of Asthma’
• Comment:
– No adjustment to the significance level is needed; it
had to be shown significance for both endpoints

46
Multiple endpoints should be ranked
• Variables ranked according to clinical importance „Typical examples are: (i) acute effects in depressive disorders followed by prevention of progression, (ii) reduction of mortality in acute myocardial infarction followed by prevention of other serious events.” (CHMP)
• Ranking determines the order in which the statistical testing is done. No adjustment to the significance level is required, but claims cannot be made beyond the first non-significant result in the hierarchy.
• There is also the possibility of mixing hierarchical considerations with adjustment. For example, in the case of a single primary endpoint and two secondary ndpoints, of equal importance to each other, the primary endpoint would be valuated at a=0.05 while each of the secondary endpoints would use a=0.025

47
Example:Hierarchical testing
• Three primary endpoints, ranked according to their clinical relevance
• In case 1, claims can be made on endpoints 1 and 2
• In case 2 a claim can be made on endpoint 1 only, because as endpoint
• In case 3 is non-significant then we are not allowed to look at endpoin

48
Subgroup analysis
Homogenity of the treatment effect
When assessing interactions, we use a significance level of 0.10
rather than 0.05 due to a lack of power

49
Multi-centre trials
• When the number of patients within each centre is expected to be
very small, it may not be practical to stratify the randomisation by
centre. • Treatment-by-centre interactions
Different centers
ICH E9 (1998):” failure to find an explanation may necessitate further clinical trials”

50
Another example

51
Adjusting for Confounding
Mean fasting glucose levels and standard deviations of a parallel-group
study of two treatments for diabetes type II. Left graph: linear regression of overall
data. Right graph: the same analysis after adjustment for the presence of beta cell
failure or not (fasting glucose > 8 mmol/l).
8
7
6
8
7
6 NS
p<0.05
NS

52
Adjusting for Confounding • Baseline
• „Covariates to be included in the analysis must be pre-specified in the protocol or in the statistical analysis plan.”(CHMP)
• Testing: „‘Statistical testing for baseline imbalance has no role in a trial where the handling of randomisation and blinding has been fully satisfactory.’”
• Posthoc: „It is not advisable to adjust the main analyses for covariates measured after randomisation because they may be affected by the treatments.(ICH)”
• How many covariates and how • „No more than a few covariates should be included in the primary
analysis.’” (CHMP)
• „Methods that select covariates by choosing those that are most strongly associated with the primary outcome (often called ‘variable selection methods’) should be avoided. (CHMP)
53
Adjusting for Confounding 2
• But when
– „if the imbalance is such that the experimental
group has a better prognosis than the control
group, then adjusting for the imbalance is
particularly important. Sensitivity analyses
should be provided to demonstrate that any
observed positive treatment effect is not solely
explained by imbalances at baseline in any of
the covariates.”

54
Designing clinical trial for success..

55
The power of a test and sample
size estimations • The power of a study is the probability to reject of the
null hypothesis when it is false
• Maximising power – calculating sample size
• The bigger the sample, the more powerful the test – but sqrt(N) !.
• The sample size calculation can be summarised thus: – Decide on the minimum size of the effect that would be clinically
useful (or otherwise of interest)
– Based on literature data estimate the variabilty or baseline event rate =risk)
– Decide the significance level α, usually 0.05.
– Decide the power required, usually 80 or 90 per cent.

56
Power – why it depends from sqrt(n) ?
The confidence interval can be approximated in the following form
ConstV
Difference, RR,OR
Survival time
Number of patients
Standard error of
the effect

57
Application of the formula
Power analysis or sample size estimation
V
They are guessed before study
Software
What is a chance of a
successful study
(Depends on: (response) , V (variability)
Alpha =The acceptable risk of a
false positive outcome
Beta = The acceptable risk of a
false positive outcome)
( , )
VPOWER
Guessed or required before
study
Software
How many patients are
needed for the study
( , , %)V N 90
After study V and N is known
Postcheck. Could I have a chance
the detect the clinically important
difference ?
Software

58
Power: Regulatory Expectations
• ICH E9 (1998): ‘Note for Guidance on Statistical
Principles for Clinical Trials’
– „The number of subjects in a clinical trial should always be large
enough to provide a reliable answer to the questions addressed
The probability of type II error is conventionally set at 10 per
cent to 20 per cent; it is in the sponsor’s interest to keep this
figure as low as feasible especially in the case of trials that are
difficult or impossible to repeat.”
– The power based on the per-protocol set and then increase the
sample size requirement to give the number required in the full
analysis set.

59
The power table for BE studies

60
Sample size requirements for
binomial outcome

61
Composite Endpoint
• The
composite
endpoint is
statistically
significant,
because it is
based on
more events

62
Allocation and power
• Total sample sizes for α=0.5, =0.1, mean
difference=1, =3
– 1:1 allocation 380
– 2:1 allocation 429 13% increase
– 3:1 allocation 508 34% increase
– 5:1 allocation 684 80% increase
– Thus, the unbalanced allocation leads to a
substantial increase in sample size and
consequent budget

63
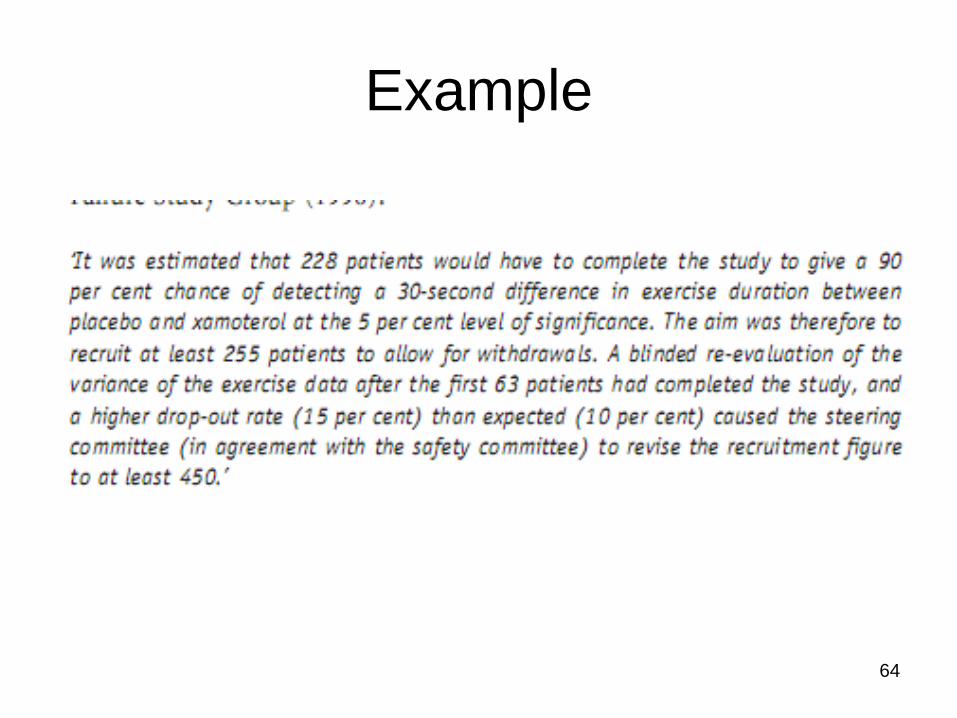
Sample size adjustment
• ICH E9 (1998): ‘Note for Guidance on Statistical Principles for Clinical Trials’ – ‘In long term trials there will usually be an opportunity
to check the assumptions which underlay the original design and sample size calculations. This may be particularly important if the trial specifications have been made on preliminary and/or uncertain information. An interim check conducted on the blinded data may reveal that overall response variances,event rates or survival experience are not as anticipated. A revised sample size may then be calculated using suitably modified assumptions ’
64
Example

65
Adaptive Trials
• Prospective adaption
• Protocol uses data not which is not
available at study start as a basis for
modifications to the trial design.
– Maximize information collected on effective
doses.
– Minimize information collected on non-
effective doses

66
Adaptation of clinical trials
• Prospective adaptation
– By design
– Study protocol
• Concurrent adaptation
– Ad hoc
– Protocol amendments
• Retrospective adaptation
– Prior to database lock and/or unblinding
– Statistical analysis plan

67
Key Adaptive Modifications
• Sample size adjustment
• Change the randomization fraction
– To favor certain treatments
– To begin avoid others
• Add new treatment arms
• Eliminate treatment arms

68
Example – Sample Size Adjustment
• Sample size adjustment using Group sequential
methods
– Plan to enroll up to 1063 patients
– Stop early for efficacy
– Plan to monitor sequentially up to 3 times
– at n = 354, 709, 1063
–
• Now if d = 3 prob of stopping at 709 is 93%
• Now if d = 4 prob of stopping at 354 is 93%

69
Concerns
• Multiple testing procedure
– alpha level should be modified
– a classic prespecified group sequential
stopping rule can be found that is more
efficient than a given adaptive design
• Interim estimates may cause change in
study population (gaining or losing
enthusiasm- bias, patient recruitment)

70
Learning using adaptive designs in exploratory trials has
different context than that in confirmatory trials in
therapeutic drug development

71
Reflection Paper on Methodological Issues in
Confirmatory Clinical Trials with Flexible Design
and Analysis Plan (CHMP , 2006)
• Prior to phase III, in an exploratory setting, flexibility in design is much less of an issue and is indeed to be encouraged.
• A planed adaptation is much more likely to be acceptable than an unplanned adaptation.
• Having several adaptations in a phase III setting is unlikely to be acceptable; it compromises the confirmatory nature of the trial.
• If a change in design is made at an interim stage then lack of consistency between the results before the change and after the change could compromise the ability to draw general conclusions from the trial. It is the sponsor’s responsibility to confirm this consistency.
• Dissemination of information regarding the results from the first part of the trial could cause bias following the change

72
Any question ?
Paper or Plastic ?