Embed Size (px)
Citation preview
Postgraduate dissertation
Identity, belonging and economic
outcomes in England and Wales
Ivelina Hristova
Working Paper Series March 2020
Working Paper 04-20
Social Policy Working Paper 04-20
LSE Department of Social Policy The Department of Social Policy is an internationally recognised centre of research and teaching in
social and public policy. From its foundation in 1912 it has carried out cutting edge research on
core social problems, and helped to develop policy solutions.
The Department today is distinguished by its multidisciplinarity, its international and comparative
approach, and its particular strengths in behavioural public policy, criminology, development,
economic and social inequality, education, migration, non-governmental organisations (NGOs) and
population change and the lifecourse.
The Department of Social Policy multidisciplinary working paper series publishes high quality
research papers across the broad field of social policy.
Department of Social Policy
London School of Economics and
Political Science Houghton Street
London WC2A 2AE
Email: [email protected]
Telephone: +44 (0)20 7955 6001
lse.ac.uk/social-policy
Short sections of text, not to exceed two paragraphs, may be quoted without explicit permission provided that full credit,
including © notice, is given to the source.
To cite this paper:
Hristova, I. Identity, belonging and economic outcomes in England and Wales, Social Policy Working Paper 04-20,
London: LSE Department of Social Policy.
Ivelina Hristova
Abstract The United Kingdom’s 2016 vote to leave the European Union revealed the ways in which issues
of economic inequality were intertwined with those of national identity. However, research relating
to the impact of national identity on labour market outcomes is mixed, while the relationship
between national identity and progression at work has not yet been investigated. Drawing on
Akerlof and Kranton’s theory of identity economics, this paper explores whether having British
identity impacts progression at work for sub-state national and migrant-origin groups in England
and Wales.
Using the ONS Quarterly Labour Force Survey, I estimate logit models comparing the likelihood of
career progression by three identity dimensions – British, sub-state national and migrant-origin,
which is itself influenced by social class. The results suggest that identity-related power relations,
in-group preferences and bias at work may limit career progression. The paper also provides
quantitative evidence for differences in what British identity means in the first place. The novel
approach sheds more light on the differential labour market behaviours of migrant-origin and sub-
state national groups, and adds to a better understanding of Britishness.
Keywords: identity economics, sub-state national and ethnic diversity, progression at work
Author
Ivelina Hristova is a PhD candidate in the Department of Social Policy, London School of Economics and Political Science. Her research is focused on ethno-national identities and labour market inequalities. She holds a MSc in International Migration and Public Policy from LSE and was awarded the Hobhouse Memorial Prize for best overall dissertation in the Department of Sociology Masters’ programmes for the 2017/2018 academic session. Previously, she studied business, finance and economics in the US (UC Berkeley), Germany (University of
Saarland), Spain (University of Alicante) and Bulgaria (Sofia University). Prior to joining the Social Policy department, she worked in public policy settings such as the Office of the President of Bulgaria, the Cabinet of the Deputy Prime Minister and Minister of Labour and Social Policy of Bulgaria, and the UK Department for Business, Energy and Industrial Strategy. Her PhD research is funded by the Economic and Social Research Council. Email: [email protected]
Acknowledgements Particular acknowledgement to Patrick McGovern for his indispensable critical approach to sociology as work, diversity in the labour market and for always challenging me to go one step further, to Lucinda Platt for her invaluable support to access the ONS Secure Access data and advice on the academic approach to identity, and to my English, British and international friends who shared with me their stories of identity and belonging. This work contains statistical data from ONS which is Crown Copyright. The use of the ONS statistical data in this work does not imply the endorsement of the ONS in relation to the interpretation or analysis of the statistical data. This work uses research datasets which may not exactly reproduce National Statistics aggregates.

1 Social Policy Working Paper 04-20
Introduction
In the 2016 referendum that resulted in a vote to leave the European Union (EU), those who feared that the EU membership is threatening their identity were more likely to vote to leave (NatCen, 2017). An unexpected outcome, this vote demonstrates how national identity can feed into making a fundamental collective decision with tremendous economic, political and social implications for the country and its international partners. Yet almost two decades ago Prime Minister Tony Blair stressed how building a modernised and shared British identity is needed to sustain long-term growth, prosperity and stability for the four UK nations and migrant-origin groups (Blair, 2000). Indeed, a recent report warns policy makers that clearly articulated identities can either benefit society as a resource for social change, building social capital and promoting wellbeing, or harm it through social unrest and antisocial behaviour (Foresight Future Identities, 2013). Politicians engaging with the referendum did not appear to recognise the importance of shared identity and its relationship to economic equality and political stability. It is the aim to address this issue. An equal chance to progress at work, the focus of a recent independent Review of race in the workplace (McGregor-Smith, 2017) and a subsequent government research commission (Department for Business, Energy & Industrial Strategy, 2018), is one measure of such economic equality. This paper poses the question: Does having British national identity impact the upward occupational mobility (OM) of sub-state national and migrant-origin groups in England and Wales in the short term? The next section presents academic debate on labour market and identity patterns for migrant-origin and sub-state national groups from which are derived hypotheses for the analysis. The third section outlines the methods and data. The fourth section provides a discussion of results. The final section concludes. Literature review
Identity economics and dimensions
Identity – a person’s sense of self – develops in the context of social difference, in that different
values are prescribed to different groups (Akerlof and Kranton, 2000). Akerlof and Kranton (2000)
elaborate on the identity formation process: first, belonging to a group can result from the
individual’s action (personal sense of belonging). It can also be an externality of others’ action if,
for example, they form their own identity by assigning an individual a subordinate position based
on class or ethnicity, which can result in exclusion, poverty and oppositional identity formation by
those excluded. Further, identity might represent a specific choice at all, e.g. gender or ethnicity. In
addition, categories, including those promoted in public policy, and behavioural prescriptions
relating to specific categories can change, feeding evolution of identity-based preferences.
Belonging to a group is associated with gains or losses that are incorporated in the individual’s
utility function; in line with neoclassical economics, the individual aims to maximise their utility and
therefore – the pay-offs from their identity (ibid). Therefore, Akerlof and Kranton (2000) see the
person’s sense of self as an important economic decision.

Ivelina Hristova 2
Separately, the integration literature recognises the emergence of different patterns of inclusion
and accommodation depending on the respective minority type1 – autonomy and power-sharing for
sub-state national groups such as Scots and Welsh in Britain, and multicultural citizenship for
immigrant groups (Kymlicka, 2010). First, while most UK sub-state national groups (here referred
to national minorities for simplicity) report White-British ethnicity (Appendix 2a), Kymlicka’s
approach to split groups by minority types implies underlying processes defined by characteristics
beyond ethnicity. Second, these patterns seem diverging – devolution vs inclusion. Therefore,
Kymlicka’s (2010) approach and Akerlof and Kranton’s (2000) account of identity economics justify
studying these minority types as different identity dimensions and exploring their labour market
outcomes and patterns of British identity.2 The rest of this section looks at what current research
tells us about labour market and British identity patterns across minority types, and about the
meaning of Britishness.
Labour market outcomes
Migrant-origin minorities
The research evidence on the impacts of national identity on labour market outcomes is currently
mixed. One study on migrant-origin groups in Germany shows, for example, weak evidence for
differential impacts on wages, participation, employment and unemployment between adopting the
majority identity or retaining the ethnic minority one, with some significant differences by gender
(Casey and Dustmann, 2010).
Two points about this study deserve attention. First, in Germany the nation came before the state,
resulting in the formation of exclusive ethnic belonging (Castles et al., 2014, p265). By contrast, in
Britain political integration is seen as arising before national identity formation and was
characterised by the need to tolerate difference and civic belonging (ibid). Germany has been
slowly shifting towards a more inclusive approach of recognising communalities across
communities (Brubaker, 2001), while Britain is gradually moving to a “civic only” concept of identity
that tolerates diversity (Heath and Tilley, 2005). However, historic differences in the starting points
of these processes might still mean that migrant-origin minorities in Germany and Britain
perceptions of and access to the respective majority identities, resulting in differential impacts of
identity on economic outcomes.
Second, differences across ethnic group may be relevant to the specific cases. Migrant-origin
groups in Britain show heterogeneous education and labour market patterns: for example, Indian
and Chinese outperform their White British counterparts in education and slightly underperform in
earnings, employment, unemployment and access to salariat. By contrast, Pakistanis and
Bangladeshis fare substantially worse in labour market outcomes and have also historically had
lower educational outcomes (Algan et al., 2010; Blackwell and Guinea-Martin, 2005; Cheung and
Heath, 2007; Heath et al., 2008).
1 Minority types and groups: the two minority types are migrant-origin and national, each of them containing groups such as Indians and Scots. The English are by far a majority, but in their capacity of a sub-state national group are referred to a national minority for consistency and simplicity. 2 The second/third generations of immigrant groups might not identify as immigrants yet their family migration background might impact their life chances. Immigrant groups will be referred to as migrant-origin minorities.
3 Social Policy Working Paper 04-20
It has been argued that oppositional identity formation depends on the social context, and that
migrant-origin minority groups who form oppositional identities are less likely to be employed in
Britain (Battu and Zenou, 2010). This argument aligns with Akerlof and Kranton’s (2000) theoretical
reasoning that oppositional identities are linked to economic exclusion. The results suggest that not
identifying as British – through the lens of oppositional identity formation might constitute an
economic penalty for migrant-origin groups.
While there is an extensive literature on the factors associated with differential labour market
outcomes across ethnic groups, the impacts of ethnicity and national identity on progression at
work have not to-date been studied, leaving the question of the relationship between identity and
occupational mobility an open one.
Research on ethnic penalties typically uses the white majority as a reference group, presenting
their national identity as representing a dominant culture. While it is a feature of analysis that a
reference group is typically required, considering a category dominant by default may imply that
others are subordinate. In an attempt to avoid such an implicit assumption, I explore dynamics at
two separate identity dimensions – migrant-origin and national.
National minorities
Less attention has been paid to differences between the four UK nations in identity and labour
market penalties, and there is no research on the economic impact of British identity for national
minorities. Yet existing research suggests that in the 1990s Scots experienced better upward
occupational mobility in the South East than the local labour force (Findlay et al., 2009). While
narrowly focused on the performance of one particular national group in a part of England, this
study does provide some indicative evidence for differential outcomes between the UK national
groups. Further, Heitmueller (2004) shows that similar characteristics in England and Scotland
translate differently into job mobility. This indicates that it is fruitful to consider the role of identity
and economic outcomes for national minorities.
Understanding British identity
Research on the UK shows that migrant-origin minorities; identification with the majority increases
in the second generation, showing a pattern of assimilation in terms of British (Heath and
Demireva, 2014; Manning and Roy, 2010; Platt, 2014). Further drivers of feeling (more) British
among immigrants include age at migration, longer residence, and feeling respected and tolerated
(Georgiadis and Manning, 2013; Manning and Roy, 2010). Conversely, those who feel
discriminated against are less likely to identify with Britain (Heath and Demireva, 2014). These
results illustrate how time and positive social experiences feed into the sense of belonging, while
the lack of the latter results in an oppositional identity, an identity which Battu and Zenou (2010)
have associated with employment penalties.
A more detailed look at identification with Britain reveals that migrant-origin minorities are more
likely to feel British than the four sub-state national groups (Nandi and Platt, 2015). Indeed, such a
comparison illustrates the paradox that the ‘target’ national identity for migrant-origin communities,

Ivelina Hristova 4
according to political discourse is one that national minorities do not strongly identify with in the first
place. We can see here at work the accommodation patterns that Kymlicka (2010) talks about:
inclusion for the migrant-origin groups who move into a direction of a stronger association with
Britain, and autonomy for the sub-state national groups who feel less British.
Nandi and Platt (2015) also show that lower educational qualifications and lower socio-economic
status make it more likely for migrant-origin minorities to feel British, and South Asians and African
Christians are more likely to feel British than Arab, White and Chinese.3 Since those who identify
most strongly as British, such as Pakistanis and Bangladeshis, tend to be those who are most
economically marginalised (Algan et al. 2010 Blackwell and Guinea-Martin 2005, Cheung and
Heath 2007, Heath et al. 2008) it is possible that such groups perceive Britishness as representing
power and inclusion.
By contrast, Nandi and Platt (2015) show that for the sub-state national groups, lower educational
qualifications and lower socio-economic status translate into higher likelihood to identify with one of
the four UK nations rather than with being British. These contrasting dynamics behind the
existence of different meanings of Britishness are worth exploring further.
Such dynamics and paradoxes in identity formation are effectively captured in an anecdote into the
different meanings of Britishness (Hirsch, 2018). Hirsch – a woman of mixed heritage born to a
White British father and Ghanaian mother,4 dedicates her first chapter to “The Question”5 (Hirsch,
2018, p33): Where are you from?, that she has been confronted with throughout her life. The
Question leaves her confused: “I can’t be British, can I, if British people keep asking where I’m
from?” (Hirsch, 2018, p33), it takes away the British dimension from her own identity. It did so to
such extent, that aged twenty-one, she left for Africa in the hope that her “broken sense of identity
could become whole” (Hirsch, 2018, p169). Later, she shares a conversation with Tommy
Robinson, the original founder of the English Defence League – a far-right anti-Islam organisation.
Robinson says “Blacks are all right. […] A lot of them act like white people, they are becoming
more and more like us. You know, we have Sikh members too. They love this country. It’s Muslims
that are the problem.” (Hirsch, 2018, p151). In her own words, Hirsch admits “There are so many
layers in the daily texture of feeling othered in Britain […] It operates powerfully against a sense of
belonging in this country” (Hirsch, 2018, p114).
Such experience reveals discrepancies behind the very interpretation of Britishness as a sense of
belonging. It reveals the deep insecurity that Hirsch feels due to the exclusion of Blacks from
history, the confusion that the feeling of belonging to Britain of people of colour is still challenged
(Hirsch, 2018, Chapter 2). Robinson’s claim that Blacks are “all right” because many of them “act
like white people” reveals underlying assimilationist attitude built on the belief in white superiority:
whites are the benchmark for a right behaviour and – respectively, belonging. In the contexts of
Oxford and legal London, Hirsch admits her “awkwardness and unease in the face of a version of
3 Nandi and Platt (2015) look at the impacts of belonging to ethno-religious groups – e.g., Indian and African Muslim are more likely to feel British than the non-Muslim members in their ethnic groups, indicating that religion matters for feeling British. Religion is not available in the dataset I use and therefore is not discussed further, even though this is a potential limitation to the analysis. 4 Note that, Mixed ethnic groups are excluded from my analysis. However, Hirsch tells her story of belonging and otherness through the lens of her Blackness, which makes it relevant to my discussion. 5 Formatting is original.

5 Social Policy Working Paper 04-20
elite, privileged, traditional Britishness” (Hirsch, 2018, p185) and feeling as an “impostor” (Hirsch,
2018, p219). It seems that – while the most natural underlying understanding of Britishness for her
is one of acknowledged contribution and inclusion, her understanding is challenged by
contradictory versions of Britishness as assimilationist or exclusive. Such othering reveals an
unconscious, or conscious, bias that those who look and/or behave differently do not belong.
Hirsch openly talks about the emotional cost of feeling othered, of being denied her sense of
belonging to Britain, and how a coping mechanism was to deny it herself and search for a
substitute identity. Despite being a single story, it accords with the discussion of identity formation
and its pay-offs as theorised by Akerlof and Kranton (2000). It also exemplifies contradictory
understandings of belonging to Britain and the need to look at the British identity dimension from
various perspectives to be able to understand how it relates to migrant-origin and national minority
identities.
In the end, the paradox that Nandi and Platt (2015) suggest that there might actually be no
overarching consensus of what belonging to Britain means, and these discrepancies are defined
by educational and socio-economic divisions between and within the minority types. The
association between national identity and socio-economic status indicates that identity and
economics are empirically linked. But Nandi and Platt’s (2015) analysis challenges Akerlof and
Kranton’s (2000) theory in terms of the causal direction of that association. Since the relationship is
theoretically derived from different propositions, this paper therefore aims to tackle both sides of
the question and also to explore whether success at the labour market feeds into belonging to
Britain.
Hypotheses
The research question that drives this paper is: Does having British national identity impact the
progression at work for national and migrant-origin minorities in England and Wales?
My first hypothesis is that, within the same type of minority – migrant-origin or national, people who
hold a British national identity that can thus be shared with others would have better chances for
progression at work, compared to those who do not identify as British. My second hypothesis is
that the impacts of national identity are mediated by the type of minority group, in that migrant-
origin minorities perform worse than national minorities, whether they identify as British or not. This
leads me to posit (hypothesis 3) a hierarchy based on the interactions of national identity and
minority type, in descending order: national minority – British identity, national minority – non-
British identity, migrant-origin minority – British identity, migrant-origin minority – non-British
identity.
Taking the converse perspective on the causality of the relationship, I also hypothesise (hypothesis
4) that it is also possible for progression at work to increase the likelihood of identifying as British.

Ivelina Hristova 6
Data and methods
Data
I use the ONS Labour Force Survey Five-Quarter Longitudinal Dataset: Secure Access (UK Data
Service, 2018). Respondents to the quarterly Labour Force Survey participate for five quarters,
allowing me to observe changes in the individual circumstances over time. Each quarter, 20% of
the respondents exit the survey and are replaced by new participants. The Five-Quarter
Longitudinal Dataset contains labour market outcomes, socio-demographic characteristics and
migration-related aspects of identity, which renders it most suitable for this analysis. Due to the
sensitivity of some of the variables, I needed to access the secure version of the data and the
research was carried under the ONS Secure Research Service (SRS) conditions.
A total of 23 waves for the period July 2011 – March 2018 were combined to achieve the highest
number of observations while avoiding discontinuity in the data collection methodology. Each
dataset contains 4,670 observations on average. The replies “No answer” and “Does not apply” to
the questions on occupation (used to derive OM), ethnicity, belonging to UK nations, and British
identity were recoded as missing, reducing the initial sample size by more than half, due to the fact
that measures relating to the occupation are not recorded for those not in work. Ethnicity data is
available for England and Wales only. Heterogeneous ethnicity categories (four Mixed categories,
Other Black, Other Asian, and Other ethnic group) and those with less than 10 observations (White
Gypsy) were dropped. The remaining ethnic groups are white British, white Irish, white Other,
Indian, Pakistani, Bangladeshi, Chinese, Black African, Black Caribbean and Arab. For
consistency, observations for mixed national identity (e.g. English-Scottish) were dropped,
providing me with single sub-British national belonging for English, Scottish, Welsh and Northern
Irish. The final sample contains a total of 44,548 observations. Appendix 5 provides further details
on sample construction.
Variables
Key dependent and independent variables are OM, British identity, belonging to a migrant-origin
minority or to a national minority.
OM is defined as progression at work measured through moving up the one-digit ONS Standard
Occupational Classification (SOC) 2010 hierarchy. The difference in occupation between the fifth
and first quarter is taken to construct a binary OM variable (upward for success, demotion/none for
failure). The longitudinal nature of the data allow me to construct measures of change, in this case
specifically upwards mobility, increasing the confidence with which I can make inferences about
the association between OM and identity. There is no OM from the managerial occupations, these
cases predict failure perfectly and were excluded. At the one-digit level SOC is mostly hierarchical,
yet this approach doesn’t capture moves within these broadly defined occupations, e.g. from a
researcher to a senior researcher. The granular four-digit SOC does capture such moves but is
less hierarchical. For example, changing from a business/media occupation (codes 24xx) to a
health occupation (codes 22xx) (ONS, 2010) suggests job mobility – and possibly a change in
profession – that might not correspond to a promotion. Therefore, the one-digit SOC was preferred.

7 Social Policy Working Paper 04-20
A binary variable for belonging to a migrant-origin minority type was constructed, assigning
success to those who identify with an ethnic group different from White British and failure – to
those who identify as White British. Through the lens of international migration, ethnicity can
encompass both settled communities and migrants and is often used in the literature as a mark for
non-white-British origin (Heath et al., 2008). Respectively, White British can be considered a proxy
for a group without a recent migration background.
National identity responses were collected through a multiple-response question, allowing
respondents to choose more than one from English, Scottish, Welsh, Northern Irish, British and
Other, where applicable; national identity variables were then derived (ONS, 2017, 2018b). This
means that there are overlaps between these categories and that they do not add up to 100%
(Appendix 3).
British identity is derived from this question and studied as an identity dimension, separate from a
sense of belonging to one of the UK nations. The derived variable is used as a measure of
belonging to Britain. The identity question is, though, clearly limited and cannot measure the
different values that respondents ascribe to feeling British or the strength of the attachment.
A second measure was constructed indicating belonging to a national minority for those identifying
as English, Scottish, Welsh, or Northern Irish only (1), with those choosing none of these or a
combination coded as 0.
Migrant related controls: Country of birth, years since migration and age at migration were
controlled for.
Economic controls. Occupation dummies control for the fact that a start from a higher occupation
might result in lower chances for progression at work. Industry dummies control for the
concentration of certain occupations within specific industries which in turn might impact the
structure of the occupational hierarchy and, indirectly, OM probabilities. Industry change is
controlled for. Other economic controls include gross hourly pay above the minimum
apprenticeship rate (centred to reduce multicollinearity, and log-transfomed to smooth outliers on
the upper end), total usual hours in main job (centred to reduce multicollinearity), length of time
with current employer, being employed in the private sector, part-time, permanently, having
supervising responsibilities, or looking for a different or additional paid job or business. Two
variables which are often included in analysis of occupational outcome, age when full-time
education was concluded and length of professional experience could not be constructed from the
data.
Other controls. Highest educational qualification is controlled for. A dummy for working in Greater
London or the South East controls for the overrepresentation of migrant-origin minorities and the
different occupational opportunities in these two regions, compared to the rest of England and
Wales. Socio-demographic and household characteristics include gender, age (squared after
regression diagnostics), marital status, change in marital status and accommodation, being the
head of the household, and number of dependent children in household under 19. Region and
accommodation change occurred in less than ten cases and were not controlled for. Wave
Ivelina Hristova 8
dummies control for wave-specific differences. Finally, perceived discrimination, religion and
English as a second language are not available in the dataset.
Initial circumstances might induce the subsequent OM, and controls – except those that capture
change, are for the first participation quarter. Means and standard deviations are presented in
Appendix 3.
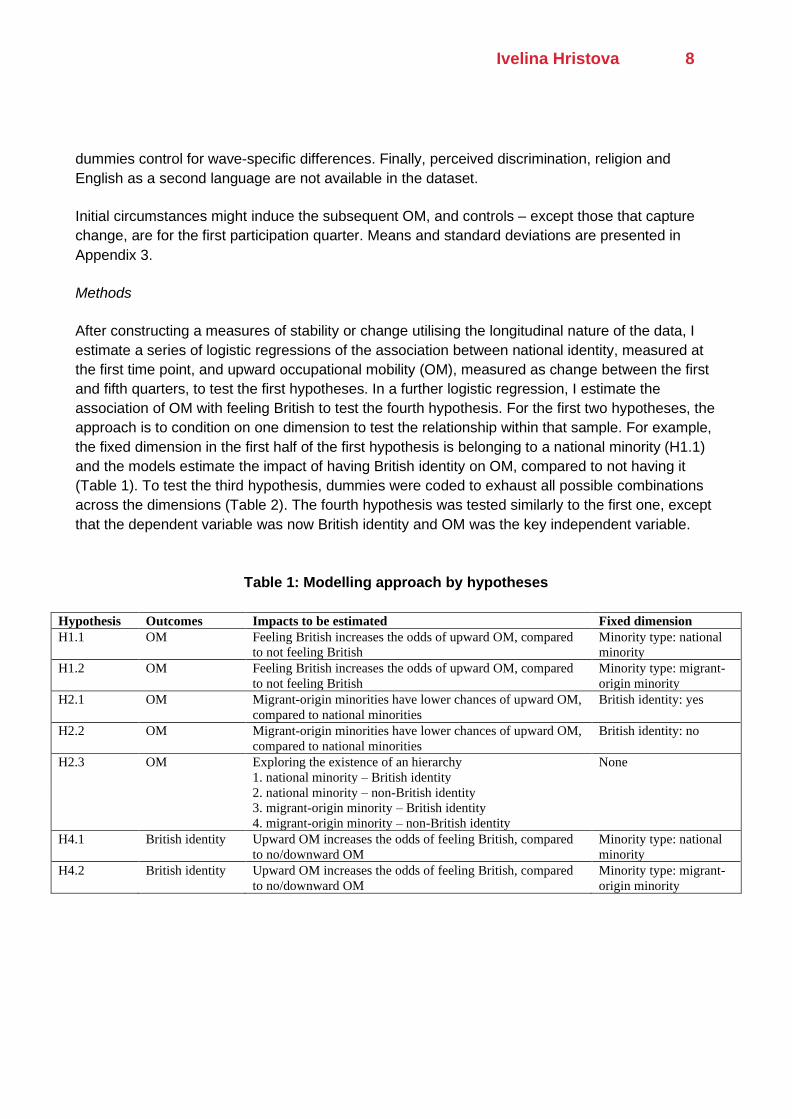
Methods
After constructing a measures of stability or change utilising the longitudinal nature of the data, I
estimate a series of logistic regressions of the association between national identity, measured at
the first time point, and upward occupational mobility (OM), measured as change between the first
and fifth quarters, to test the first hypotheses. In a further logistic regression, I estimate the
association of OM with feeling British to test the fourth hypothesis. For the first two hypotheses, the
approach is to condition on one dimension to test the relationship within that sample. For example,
the fixed dimension in the first half of the first hypothesis is belonging to a national minority (H1.1)
and the models estimate the impact of having British identity on OM, compared to not having it
(Table 1). To test the third hypothesis, dummies were coded to exhaust all possible combinations
across the dimensions (Table 2). The fourth hypothesis was tested similarly to the first one, except
that the dependent variable was now British identity and OM was the key independent variable.
Table 1: Modelling approach by hypotheses
Hypothesis Outcomes Impacts to be estimated Fixed dimension H1.1 OM Feeling British increases the odds of upward OM, compared
to not feeling British Minority type: national minority
H1.2 OM Feeling British increases the odds of upward OM, compared to not feeling British
Minority type: migrant-origin minority
H2.1 OM Migrant-origin minorities have lower chances of upward OM, compared to national minorities
British identity: yes
H2.2 OM Migrant-origin minorities have lower chances of upward OM, compared to national minorities
British identity: no
H2.3 OM Exploring the existence of an hierarchy None
1. national minority – British identity
2. national minority – non-British identity
3. migrant-origin minority – British identity
4. migrant-origin minority – non-British identity H4.1 British identity Upward OM increases the odds of feeling British, compared
to no/downward OM Minority type: national minority
H4.2 British identity Upward OM increases the odds of feeling British, compared to no/downward OM
Minority type: migrant-origin minority
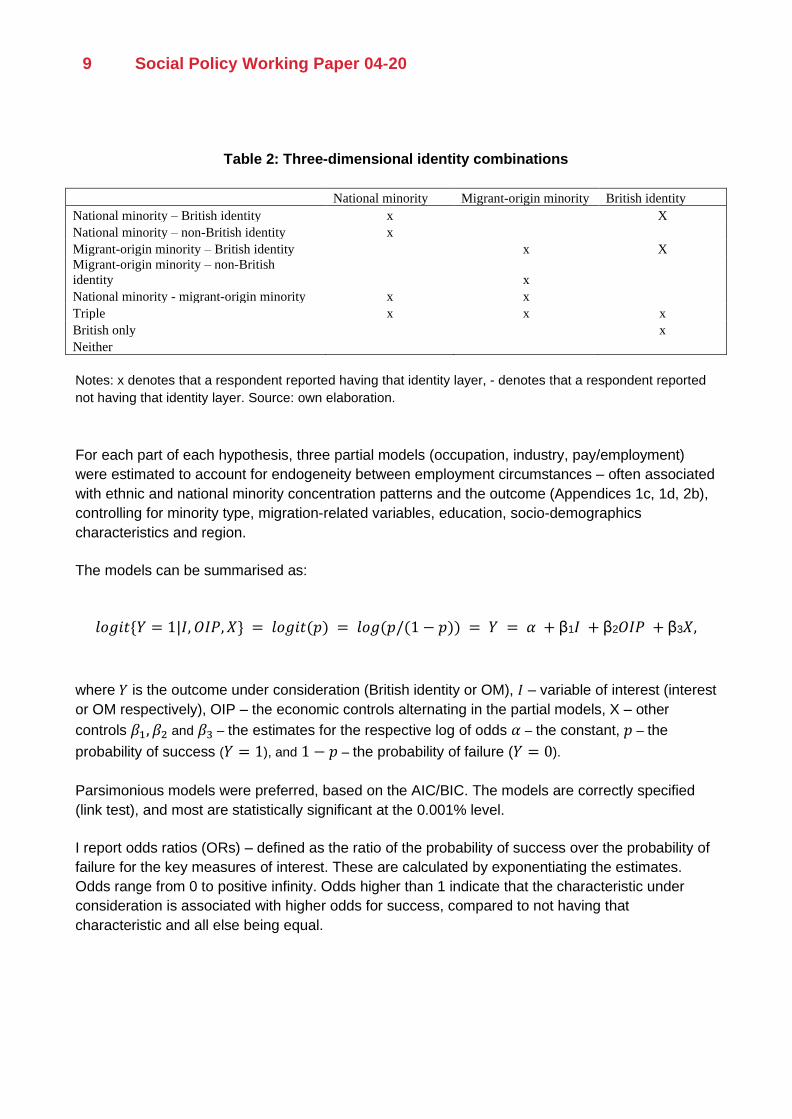
9 Social Policy Working Paper 04-20
Table 2: Three-dimensional identity combinations
National minority Migrant-origin minority British identity National minority – British identity x X National minority – non-British identity x Migrant-origin minority – British identity x X Migrant-origin minority – non-British identity x National minority - migrant-origin minority x x Triple x x x British only x Neither
Notes: x denotes that a respondent reported having that identity layer, - denotes that a respondent reported
not having that identity layer. Source: own elaboration.
For each part of each hypothesis, three partial models (occupation, industry, pay/employment)
were estimated to account for endogeneity between employment circumstances – often associated
with ethnic and national minority concentration patterns and the outcome (Appendices 1c, 1d, 2b),
controlling for minority type, migration-related variables, education, socio-demographics
characteristics and region.
The models can be summarised as:
𝑙𝑜𝑔𝑖𝑡{𝑌 = 1|𝐼, 𝑂𝐼𝑃, 𝑋} = 𝑙𝑜𝑔𝑖𝑡(𝑝) = 𝑙𝑜𝑔(𝑝/(1 − 𝑝)) = 𝑌 = 𝛼 + β1𝐼 + β2𝑂𝐼𝑃 + β3𝑋,
where 𝑌 is the outcome under consideration (British identity or OM), 𝐼 – variable of interest (interest
or OM respectively), OIP – the economic controls alternating in the partial models, X – other
controls 𝛽1, 𝛽2 and 𝛽3 – the estimates for the respective log of odds 𝛼 – the constant, 𝑝 – the
probability of success (𝑌 = 1), and 1 − 𝑝 – the probability of failure (𝑌 = 0).
Parsimonious models were preferred, based on the AIC/BIC. The models are correctly specified
(link test), and most are statistically significant at the 0.001% level.
I report odds ratios (ORs) – defined as the ratio of the probability of success over the probability of
failure for the key measures of interest. These are calculated by exponentiating the estimates.
Odds range from 0 to positive infinity. Odds higher than 1 indicate that the characteristic under
consideration is associated with higher odds for success, compared to not having that
characteristic and all else being equal.

Ivelina Hristova 10
Results
HI: conditioning on minority type
National minorities
I start by considering the effect of Britishness on OM, conditioning on minority type. Table 3 shows
that for national minorities, the ORs for British identity are in the expected direction. That is, having
British identity is associated with higher odds of progression at work, compared to not having it.
However, they are rather small in magnitude and not significant at the 10% level. Therefore, for this
minority type we cannot say that British identity is associated with greater OM.
Table 3: HI: conditioning on minority type
H1.1: National minorities H1.2: Migrant-origin minorities (1) (2) (3) (1) (2) (3) British identity 1.089 1.031 1.046 1.289 1.419* 1.496* (0.081) (0.076) (0.084) (0.272) (0.282) (0.350) Migrant-origin minority type x x X National minority type x x x Occupation x x Industry x x Pay and employment X x Migration related x x X x x x Education x x X x x x Demographics/household/region x x X x x x N 11,692 11,676 9,725 1,905 1,897 1,523 Pseudo R2 0.0874 0.0545 0.0302 0.1247 0.0546 0.0817 Prob > chi2 0.0000 0.0000 0.0000 0.0000 0.0082 0.0046
Notes: partial models: (1) occupation, (2) industry, (3) pay/employment; odds ratios (OR) reported; standard
errors in parentheses; * denotes statistical significance at the 10% level, ** at the 5% level and *** at the 1%
level; x denotes controls included. Source: ONS QLFS 2011-2018.
There might be several explanations for the lack of significance. For example, it is possible that
identifying with one of the UK nations creates a strong feeling of belonging and complementing it
with the British identity does not matter much. Identity is seen as a proxy for a sense of belonging,
and it is possible that identifying with one of the UK nations provides that sense of belonging
sufficient to build social capital and networks, rendering the need to invest in a further identity
unnecessary.
Second, a position of power might be underlying in the national minority identity. Descriptive data
shows that 10% of national minorities are at managerial occupations – compared to only 7% for the
migrant-origin type, in contrast to elementary occupations – with 14% for national minorities and
only 11% for the national ones (Appendix 1c). If higher occupational attainment is considered a
position of power at the labour market, the data speaks of an advantage for national minorities.

11 Social Policy Working Paper 04-20
Further, 64% of national minorities report White British ethnicity (Appendix 2a). While these are
descriptive statistics only, Algan et al. (2010), Blackwell and Guinea-Martin (2005), Cheung and
Heath (2007) and Heath et al. (2008) showed that the White British ethnic group tends to
experience a premium in the labour market. Therefore, such position of power and the existing
ethnic premium might further render British identity irrelevant.
Third, the lack of significance might come down to the very meaning of Britishness. The goodness
of fit for the identity partial models for the national minorities is very low (Table 5), revealing that
the included characteristics do little to explain what British means for national minorities. Finally,
the sub-state national groups might be too heterogeneous. Nandi and Platt (2015) showed that
differences in education and socio-economic status feed into diverging patterns of identification
with Britain, which similarly might render the estimates insignificant.
Migrant-origin minorities
The ORs are again in the expected direction and are much higher in magnitude in comparison to
the ORs for the national minorities (Table 3). However, they are not consistently significant at the
10 per cent level. While not conclusive, therefore, these results suggest that Britishness may have
some impact on the promotion chances for migrant-origin minorities. The comparatively high
goodness of fit of the H4 identity models for migrant-origin minorities (Table 5) additionally
indicates that the individual labour market performance and socio-demographic characteristics help
explain such overarching meaning of Britishness for them.
It was seen that national minorities are predominantly White British and enjoy a labour market
premium. Therefore, despite White British being a measure of ethnicity – considered a different
dimension in my analysis, it might be that existing labour market ethnic penalties induce migrant-
origin minorities to perceive Britishness as a position of power. Moreover, migrant-origin minorities
might lack the strong sense of belonging attributed to being a national minority, and the lower
occupational attainment of minority ethnic groups at high level occupations as in Cheung and
Heath (2007) might not provide a sufficient pool of people for a shared sense of belonging.
Migrant-origin minorities may therefore invest more in an overarching belonging to Britain,
compared to national minorities. Indeed, this is in line with the evidence from descriptive data
(Appendix 1a, 1b) and consistent with Nandi and Platt (2015).
H2: conditioning on Britishness
Those identifying as British
The size and direction of the ORs suggest that, conditioning on feeling British, migrant-origin
minorities have better odds of OM, compared to national minorities. However, the estimates are
not significant for the first two partial models and significant only at the 10% level for the third one.
Therefore, the interpretation is not conclusive. Further, the sign is in the opposite direction to the
one expected in H2: national minorities have better chances for progression at work, being British
and all else being equal. Therefore, this part of H2 is rejected.
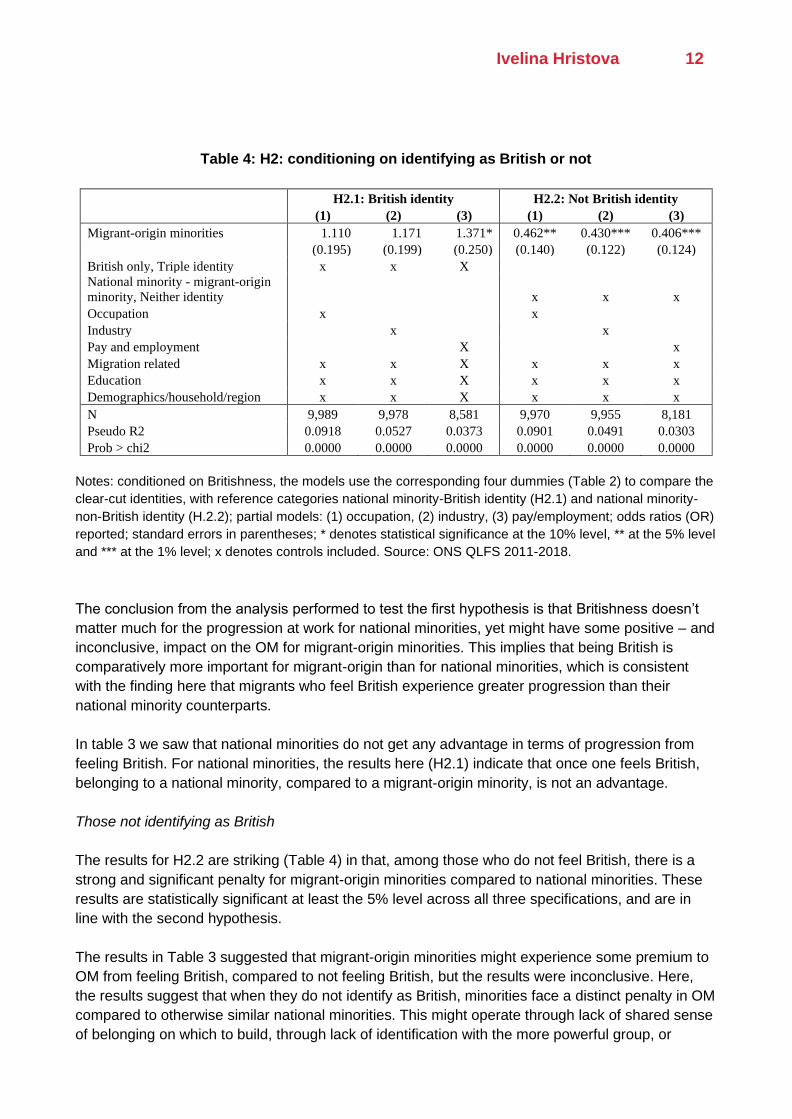
Ivelina Hristova 12
Table 4: H2: conditioning on identifying as British or not
H2.1: British identity H2.2: Not British identity (1) (2) (3) (1) (2) (3) Migrant-origin minorities 1.110 1.171 1.371* 0.462** 0.430*** 0.406*** (0.195) (0.199) (0.250) (0.140) (0.122) (0.124) British only, Triple identity x x X National minority - migrant-origin minority, Neither identity x x x Occupation x x Industry x x Pay and employment X x Migration related x x X x x x Education x x X x x x Demographics/household/region x x X x x x N 9,989 9,978 8,581 9,970 9,955 8,181 Pseudo R2 0.0918 0.0527 0.0373 0.0901 0.0491 0.0303 Prob > chi2 0.0000 0.0000 0.0000 0.0000 0.0000 0.0000
Notes: conditioned on Britishness, the models use the corresponding four dummies (Table 2) to compare the
clear-cut identities, with reference categories national minority-British identity (H2.1) and national minority-
non-British identity (H.2.2); partial models: (1) occupation, (2) industry, (3) pay/employment; odds ratios (OR)
reported; standard errors in parentheses; * denotes statistical significance at the 10% level, ** at the 5% level
and *** at the 1% level; x denotes controls included. Source: ONS QLFS 2011-2018.
The conclusion from the analysis performed to test the first hypothesis is that Britishness doesn’t
matter much for the progression at work for national minorities, yet might have some positive – and
inconclusive, impact on the OM for migrant-origin minorities. This implies that being British is
comparatively more important for migrant-origin than for national minorities, which is consistent
with the finding here that migrants who feel British experience greater progression than their
national minority counterparts.
In table 3 we saw that national minorities do not get any advantage in terms of progression from
feeling British. For national minorities, the results here (H2.1) indicate that once one feels British,
belonging to a national minority, compared to a migrant-origin minority, is not an advantage.
Those not identifying as British
The results for H2.2 are striking (Table 4) in that, among those who do not feel British, there is a
strong and significant penalty for migrant-origin minorities compared to national minorities. These
results are statistically significant at least the 5% level across all three specifications, and are in
line with the second hypothesis.
The results in Table 3 suggested that migrant-origin minorities might experience some premium to
OM from feeling British, compared to not feeling British, but the results were inconclusive. Here,
the results suggest that when they do not identify as British, minorities face a distinct penalty in OM
compared to otherwise similar national minorities. This might operate through lack of shared sense
of belonging on which to build, through lack of identification with the more powerful group, or
13 Social Policy Working Paper 04-20
through an indirect link to discrimination at work. The direct link between discrimination and lack of
promotion seems intuitive. Yet Heath and Demireva (2014) presented evidence that having felt
discriminated decreases the likelihood for ethnic minorities to feel British. Therefore, an indirect link
to discrimination might operate through loss of feeling of belonging – those who felt discriminated
may disengage both from identification with Britishness and from the workplace where they have
negative experiences.
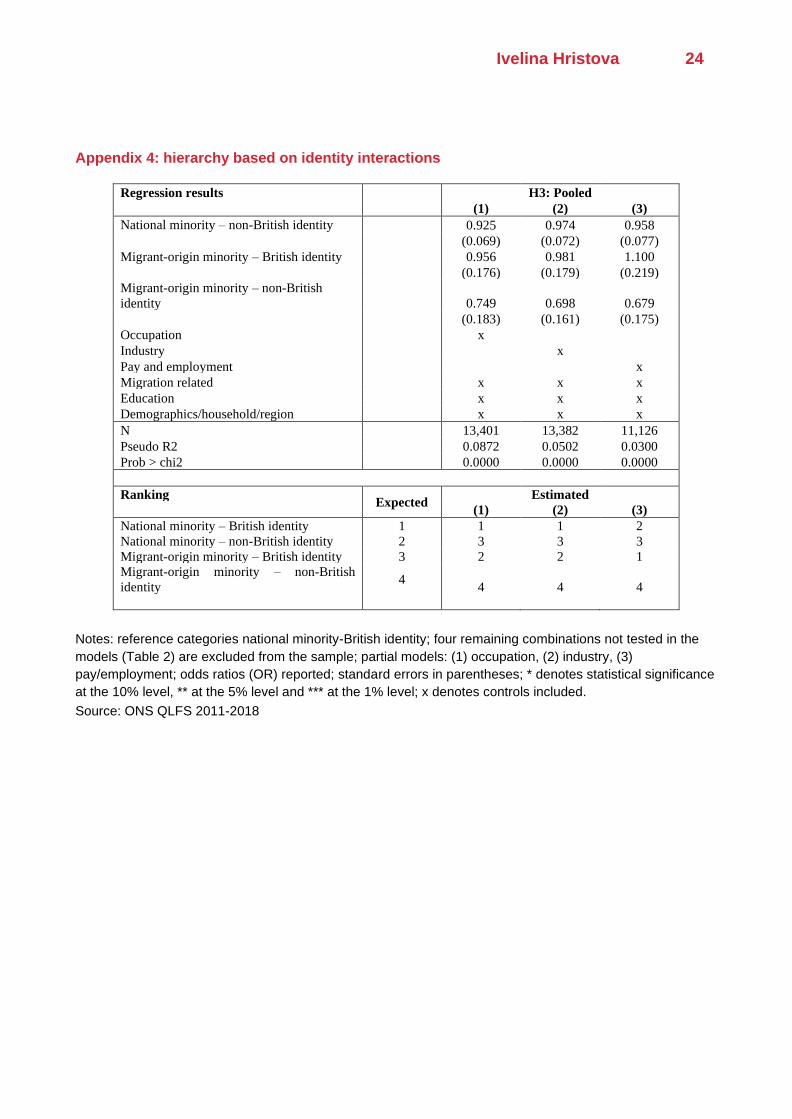
H3: hierarchy based on identity combinations
The results were statistically insignificant and showed no evidence for the existence of a hierarchy
as hypothesised. For reasons of parsimony therefore they are not discussed here, but are included
in Appendix 4.
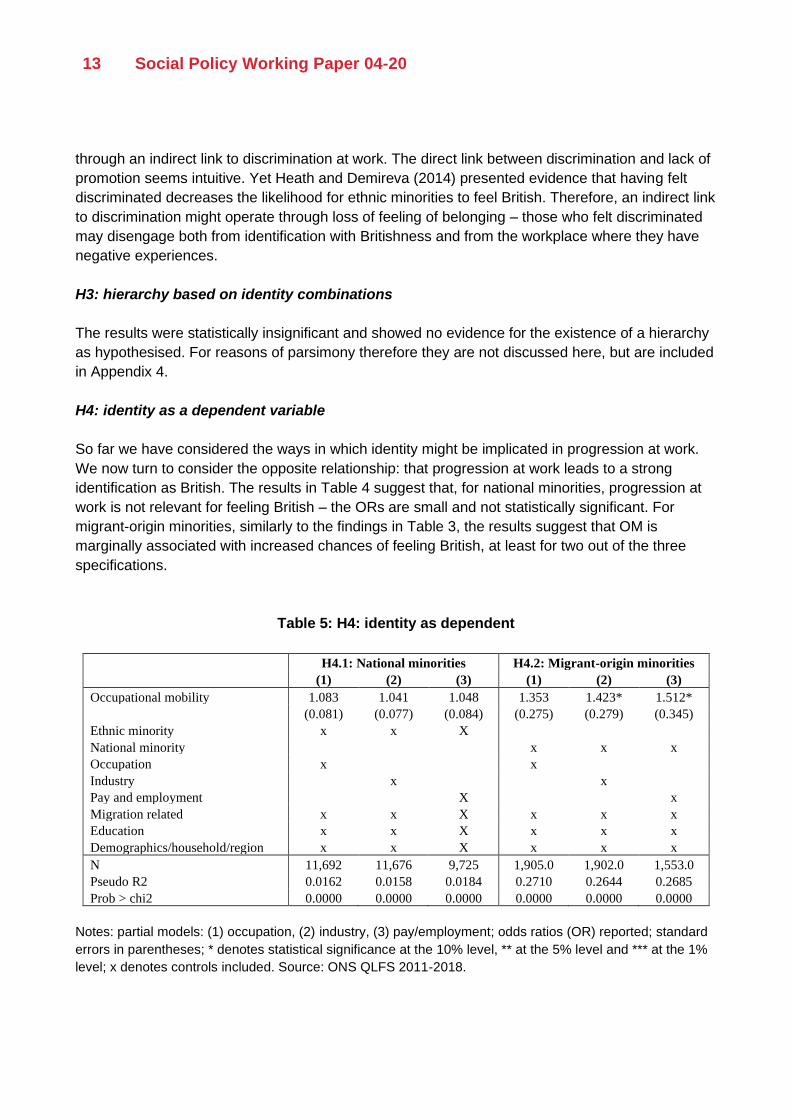
H4: identity as a dependent variable
So far we have considered the ways in which identity might be implicated in progression at work.
We now turn to consider the opposite relationship: that progression at work leads to a strong
identification as British. The results in Table 4 suggest that, for national minorities, progression at
work is not relevant for feeling British – the ORs are small and not statistically significant. For
migrant-origin minorities, similarly to the findings in Table 3, the results suggest that OM is
marginally associated with increased chances of feeling British, at least for two out of the three
specifications.
Table 5: H4: identity as dependent
H4.1: National minorities H4.2: Migrant-origin minorities (1) (2) (3) (1) (2) (3) Occupational mobility 1.083 1.041 1.048 1.353 1.423* 1.512* (0.081) (0.077) (0.084) (0.275) (0.279) (0.345) Ethnic minority x x X National minority x x x Occupation x x Industry x x Pay and employment X x Migration related x x X x x x Education x x X x x x Demographics/household/region x x X x x x N 11,692 11,676 9,725 1,905.0 1,902.0 1,553.0 Pseudo R2 0.0162 0.0158 0.0184 0.2710 0.2644 0.2685 Prob > chi2 0.0000 0.0000 0.0000 0.0000 0.0000 0.0000
Notes: partial models: (1) occupation, (2) industry, (3) pay/employment; odds ratios (OR) reported; standard
errors in parentheses; * denotes statistical significance at the 10% level, ** at the 5% level and *** at the 1%
level; x denotes controls included. Source: ONS QLFS 2011-2018.

Ivelina Hristova 14
The results provide indicative evidence for the existence of different meanings of Britishness in that
the models for the different minority types have strikingly different explanatory power. The
characteristics included in the model account for only a very small share of the variance in
Britishness for national minorities. This might be due to underlying power relations between and
within the four UK nations that pull the meaning of Britishness in different directions and prevent an
overarching understanding of what ‘British’ means. By contrast, the comparatively high explanatory
power for migrant-origin minorities suggest that there tends to be a more homogenous meaning of
Britishness for them.
For migrant-origin minorities, OM seems more important, yet this is inconclusive. Two processes
might be working in opposite directions. First, Georgiadis and Manning (2013) and Manning and
Roy (2010) show that identity formation takes time – OM here is observed within five quarters and
such short timeframe might not be sufficient for an individual to build a strong sense of belonging to
Britain in response to experiencing occupational progression. It is therefore possible for long-term
progression at work may have a significant impact on feeling British, which unfortunately is not
captured in the data.
Summary
The results indicate that feeling British does not matter for progression at work for national
minorities, however it might have some impact on the OM of migrant-origin minorities (H1).
Second, minority type doesn’t impact OM as long as one feels British, yet for those who do not feel
British – belonging to a migrant-origin minority presents an OM penalty compared to belonging to
the national minority type (H2). Third, there is no clear linear hierarchy between interactions of
national identity and minority type (H3). Fourth, OM doesn’t impact feeling British for national
minorities, but there is some indication that it may do for migrant-origin minorities (H4). Finally, the
characteristics included in the model seem to explain Britishness for migrant-origin minorities much
better than for national ones.
In short, the results suggest that feeling belonging to Britain when one already identifies with one of
the four nations does not provide an advantage for progression at work. Belonging to Britain when
from a migrant-origin group seems to matter somewhat more for occupational progression, yet the
evidence is neither strong nor conclusive. However, minorities who do not feel British suffer a clear
and significant disadvantage in progression at work compared to national minorities.
Various explanations are possible. First, there are contradictory meanings of Britishness between
and possibly within minority types – from a powerful sense of belonging to access to power, from
an overarching and inclusive identity to assimilationist identification or to exclusive privilege.
Education, socio-economic status and power inequalities between and within the four UK nations
might feed into different perceptions of what British means, in turn explaining the lack of
overarching explanatory power in the model of Britishness, and accounting for why Britishness has
no significant impact on progression at work for these groups. However, despite some similar
inequalities between migrant-origin groups, they seem to share a more overarching understanding
of Britishness; and belonging to Britain, or rather the lack of it, seems to matter for their
progression at work.
15 Social Policy Working Paper 04-20
This leads to a possible explanation in terms of Britishness facilitating access to power. National
minorities, who are predominantly white majority populations, already enjoy advantages in the
labour market compared to other ethnic groups. Therefore, belonging to a UK nation might already
provide such access to power, rendering additional adherence to Britishness unnecessary.
However, if migrant-origin minorities perceive belonging to Britain as access to power, they might
see more value in investing in such identity.
A strong sense of belonging might also feed into strong social capital and networks, the latter
clearly being a two-way interactive process. Belonging to a UK nation may already offer a strong
sense of shared belonging. By contrast, for migrant-origin minorities group-level identification may
not offer such benefits, due to discrimination and a weaker position within society and they may
feel a strong incentive to invest in British identity.
Overall, by focusing on occupational progression and by using longitudinal data to get close to
identity as a driver of such progression, the results tell a single story that complements existing
academic evidence, suggesting robustness.
Conclusion
This paper has provided an account of the interplay between three dimensions of identity –
migrant-origin, national and British, and how this interplay impacts progression at work. The results
enhance a mixed empirical literature on the economics of identity and suggest the specific
penalties that may be associated with those migrant origin minorities who do not identify with – or
are not included in – the national story. At the same time, national minorities are both opting out of
identification with Britishness and appear to derive no economic benefits from such identification –
at least when occupational progression is considered. These results cannot speak to other forms of
occupational attainment, such as access to jobs or risks of unemployment, and are also limited to
the extent that only those with room to move up can progress, limiting the potential to reveal
benefits among those already high up in the hierarchy. The analysis was also unable to explore the
specific ways identity might play out for women compared to me, and could not examine the role of
religion or language in contributing to the findings presented here. Nevertheless, this paper offers
the first insight into the relationship between identity and occupational progression for both national
and migrant-origin minorities in the UK, revealing the different meanings of Britishness for these
different populations. Policy makers might do well to foster an embracing, empowering and
accessible British identity that can be shared by all through a constructive public narrative. The
analysis suggests that this could bring returns in terms of shared understandings and reciprocal
relations at work, and possibly beyond. Recent political developments show that such actions are
long due.
Ivelina Hristova 16
References
Akerlof, G.A., 1997. Social Distance and Social
Decisions. Econometrica 65, 1005–1027.
https://doi.org/10.2307/2171877.
Akerlof, G.A., Kranton, R.E., 2000. Economics
and Identity. Q. J. Econ. 115, 715–753.
https://doi.org/10.1162/003355300554881.
Algan, Y., Dustmann, C., Glitz, A., Manning, A.,
2010. The Economic Situation of First and
Second-Generation Immigrants in France,
Germany and the United Kingdom*. Econ. J. 120,
F4–F30. https://doi.org/10.1111/j.1468-
0297.2009.02338.x.
Battu, H., Zenou, Y., 2010. Oppositional Identities
and Employment for Ethnic Minorities: Evidence
from England. Econ. J. 120, F52–F71.
Blackwell, L., Guinea-Martin, D., 2005.
Occupational segregation by sex and ethnicity in
England and Wales, 1991 to 2001. Labour Mark.
Trends 113, 501–516.
Blair, T., 2000. Tony Blair’s Britain speech. The
Guardian.
Brubaker, R., 2001. The return of assimilation?
Changing perspectives on immigration and its
sequels in France, Germany, and the United
States. Ethn. Racial Stud. 24, 531–548.
https://doi.org/10.1080/01419870120049770.
Casey, T., Dustmann, C., 2010. Immigrants’
Identity, Economic Outcomes and the
Transmission of Identity across Generations.
Econ. J. 120, F31–F51.
https://doi.org/10.1111/j.1468-0297.2009.02336.x.
Castles, S., de Haas, H., Miller, M.J., 2014. The
Age of Migration, Stephen Castles, Hein de Haas
and Mark J. Miller - Palgrave Macmillan, 5th ed.
Palgrave Macmillan.
Cheung, S.Y., Heath, A.F., 2007. Nice work if you
can get it: ethnic penalties in Great Britain, in:
Unequal Chances: Ethnic Minorities in Western
Labour Markets. pp. 507–550.
Department for Business, Energy & Industrial
Strategy, 2018. Government review to see how
employers are improving ethnic minority
progression in the workplace - GOV.UK [WWW
Document]. URL
https://www.gov.uk/government/news/government
-review-to-see-how-employers-are-improving-
ethnic-minority-progression-in-the-workplace
(accessed 3.21.18).
Findlay, P.A., Mason, C., Houston, D., McCollum,
D., Harrison, R., 2009. Escalators, Elevators and
Travelators: The Occupational Mobility of Migrants
to South-East England. J. Ethn. Migr. Stud. 35,
861–879.
https://doi.org/10.1080/13691830902957676.
Foresight Future Identities, 2013. Future
identities: changing identities in the UK - GOV.UK
(Final Project Report). The Government Office for
Science, London.
Georgiadis, A., Manning, A., 2013. One nation
under a groove? Understanding national identity.
J. Econ. Behav. Organ. 93, 166–185.
https://doi.org/10.1016/j.jebo.2012.10.013
GOV.UK, 2018. National Minimum Wage and
National Living Wage rates 2018 [WWW
Document]. GOV.UK. URL
https://www.gov.uk/national-minimum-wage-rates
(accessed 8.13.18).
GOV.UK, 2017. National Minimum Wage and
National Living Wage rates 2017 [WWW
Document]. GOV.UK. URL
https://www.gov.uk/national-minimum-wage-rates
(accessed 4.25.17).
Heath, A., Demireva, N., 2014. Has
multiculturalism failed in Britain?: Ethnic and
Racial Studies: Vol 37, No 1. Ethn. Racial Stud.
37, 161–180.
https://doi.org/dx.doi.org/10.1080/01419870.2013.
808754.
Heath, A., Tilley, J., 2005. British National Identity
and Attitudes towards Immigration. Int. J.
Multicult. Soc. 7.

17 Social Policy Working Paper 04-20
Heath, A.F., Rothon, C., Kilpi, E., 2008. The
Second Generation in Western Europe:
Education, Unemployment, and Occupational
Attainment [WWW Document].
http://dx.doi.org/10.1146/annurev.soc.34.040507.
134728. URL
http://www.annualreviews.org.gate2.library.lse.ac.
uk/doi/10.1146/annurev.soc.34.040507.134728
(accessed 5.18.17).
Heitmueller, A., 2004. Job Mobility in Britain: Are
the Scots Different? Evidence from the Bhps.
Scott. J. Polit. Econ. 51, 329–358.
Hirsch, A., 2018. Brit(ish), On Race, Identity and
Belonging, 1e ed. Jonathan Cape, London.
HM Government, 2018. The Future Relationship
between the United Kingdom and the European
Union.
Hussen, A., 2018. Canadian Commitment to
Diversity, Immigration and Integration. London
School of Economics and Political Science.
Kymlicka, W., 2010. The rise and fall of
multiculturalism? New debates on inclusion and
accommodation in diverse societies. Int. Soc. Sci.
J. 61, 97–112. https://doi.org/10.1111/j.1468-
2451.2010.01750.x.
Lang, K., Lehmann, J.-Y.K., 2012. Racial
Discrimination in the Labor Market: Theory and
Empirics. J. Econ. Lit. 50, 959–1006.
https://doi.org/10.1257/jel.50.4.959.
Likki, T., Londakova, K., Ter Meer, J., 2017.
Improving the relationship between line managers
and female staff | Equality and Human Rights
Commission. Equality and Human Rights
Commission & The Behavioural Insights Team.
Luthra, R., Platt, L., 2016. Elite or middling?
International students and migrant diversification.
Ethnicities 16, 316–344.
https://doi.org/10.1177/1468796815616155.
Luthra, R., Platt, L., Salamońska, J., 2016. Types
of Migration: The Motivations, Composition, and
Early Integration Patterns of “New Migrants” in
Europe. Int. Migr. Rev.
https://doi.org/10.1111/imre.12293.
Manning, A., Roy, S., 2010. Culture Clash or
Culture Club? National Identity in Britain*. Econ. J.
120, F72–F100. https://doi.org/10.1111/j.1468-
0297.2009.02335.x.
McGovern, P., 2007. Immigration, Labour Markets
and Employment Relations: Problems and
Prospects. Br. J. Ind. Relat. 45, 217–235.
https://doi.org/10.1111/j.1467-8543.2007.00612.x.
McGregor-Smith, 2017. Race in the workplace:
The McGregor-Smith Review - GOV.UK [WWW
Document]. URL
https://www.gov.uk/government/publications/race-
in-the-workplace-the-mcgregor-smith-review
(accessed 3.21.18).
Nandi, A., Platt, L., 2015. Patterns of minority and
majority identification in a multicultural society.
Ethn. Racial Stud. 38, 2615–2634.
https://doi.org/10.1080/01419870.2015.1077986.
NatCen, 2017. British Social Attitudes 35 | Europe
[WWW Document]. URL
http://bsa.natcen.ac.uk/latest-report/british-social-
attitudes-35/europe.aspx (accessed 8.15.18).
ONS, 2018a. Approved Researcher Scheme -
Office for National Statistics [WWW Document].
Off. Natl. Stat. URL
https://www.ons.gov.uk/aboutus/whatwedo/statisti
cs/requestingstatistics/approvedresearcherschem
e (accessed 8.9.18).
ONS, 2018b. Labour Force Survey User Guide
Volume 3: Detail of LFS variables.
ONS, 2017. Labour Force Survey User Guide
Volume 4: LFS standard derived variables.
ONS, 2010. Standard Occupational Classification
2010. Volume 1. Structure and description of unit
groups.

Ivelina Hristova 18
Panjabi, A., 2018. Reflecting Diversity. Natl.
Geogr.
Platt, L., 2014. Is there assimilation in minority
groups’ national, ethnic and religious identity?
Ethn. Racial Stud. 37, 46–70.
https://doi.org/10.1080/01419870.2013.808756.
UK Data Service, 2018. Labour Force Survey
Five-Quarter Longitudinal Dataset, July 2010 -
March 2018: Secure Access [WWW Document].
UK Data Serv. URL
https://discover.ukdataservice.ac.uk/catalogue/?s
n=7909 (accessed 8.9.18).
https:/
19 Social Policy Working Paper 04-20
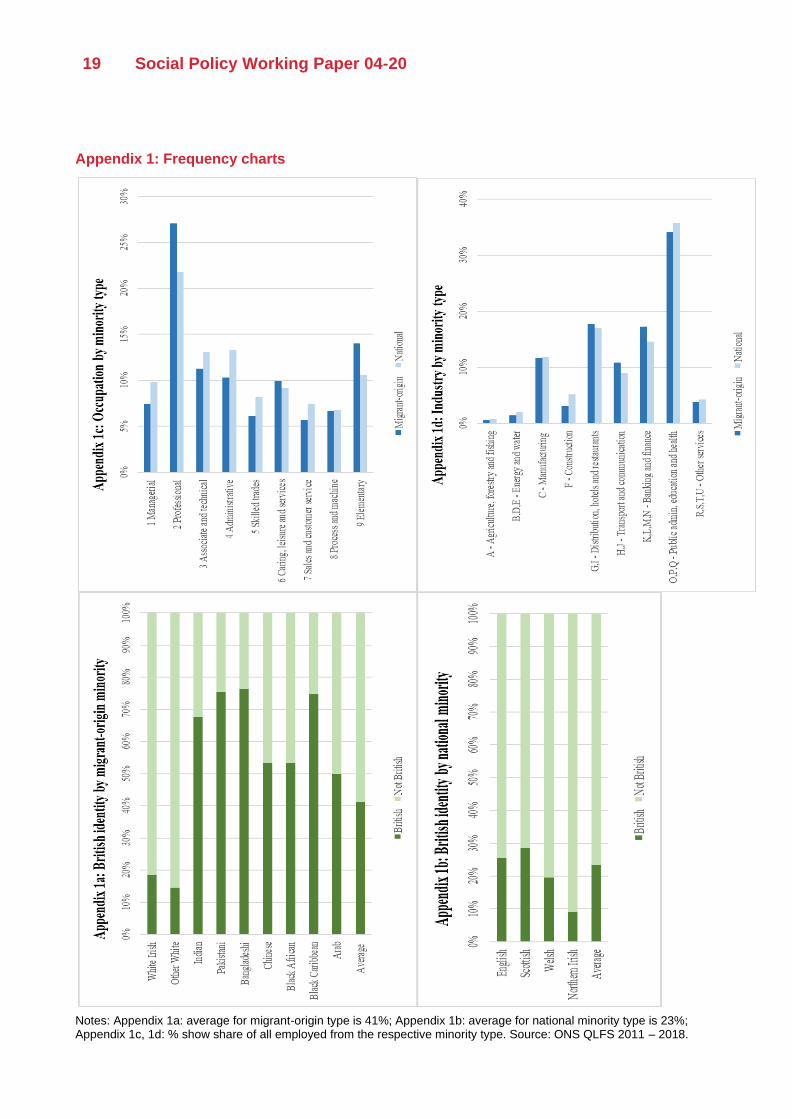
Appendix 1: Frequency charts
Notes: Appendix 1a: average for migrant-origin type is 41%; Appendix 1b: average for national minority type is 23%; Appendix 1c, 1d: % show share of all employed from the respective minority type. Source: ONS QLFS 2011 – 2018.
Ivelina Hristova 20
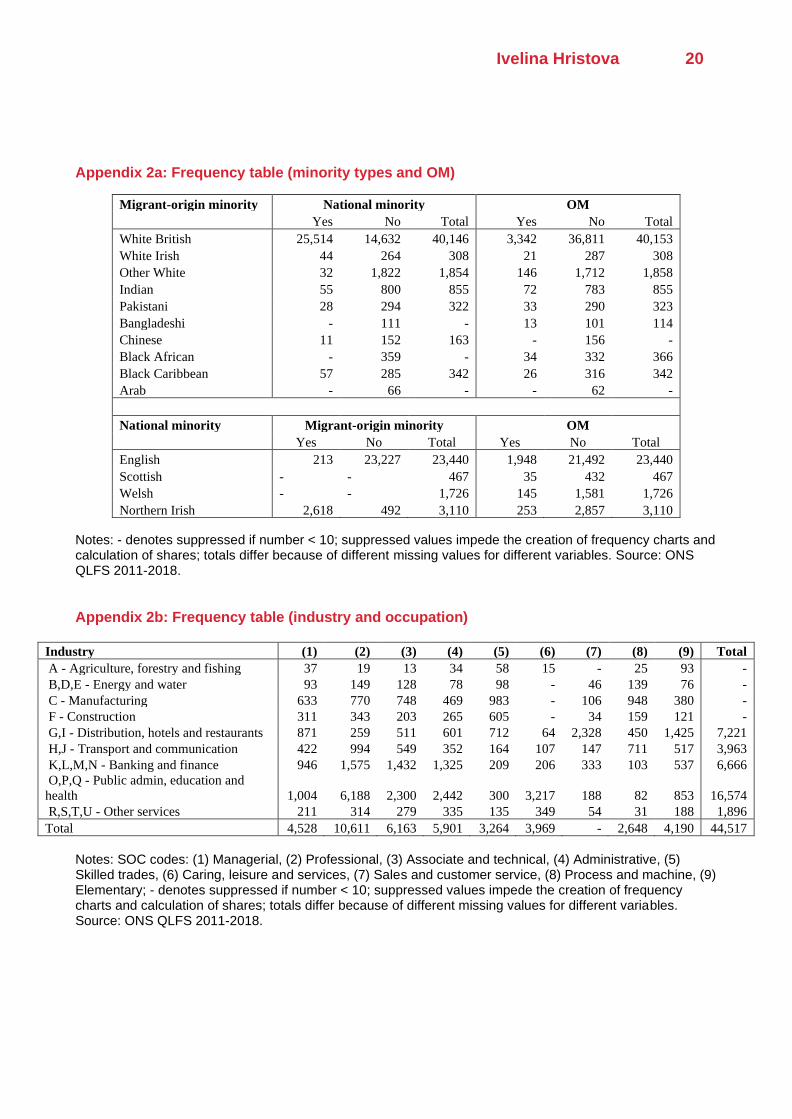
Appendix 2a: Frequency table (minority types and OM)
Migrant-origin minority National minority OM Yes No Total Yes No Total White British 25,514 14,632 40,146 3,342 36,811 40,153 White Irish 44 264 308 21 287 308 Other White 32 1,822 1,854 146 1,712 1,858 Indian 55 800 855 72 783 855 Pakistani 28 294 322 33 290 323 Bangladeshi - 111 - 13 101 114 Chinese 11 152 163 - 156 - Black African - 359 - 34 332 366 Black Caribbean 57 285 342 26 316 342 Arab - 66 - - 62 - National minority Migrant-origin minority OM Yes No Total Yes No Total English 213 23,227 23,440 1,948 21,492 23,440 Scottish - - 467 35 432 467 Welsh - - 1,726 145 1,581 1,726 Northern Irish 2,618 492 3,110 253 2,857 3,110
Notes: - denotes suppressed if number < 10; suppressed values impede the creation of frequency charts and calculation of shares; totals differ because of different missing values for different variables. Source: ONS QLFS 2011-2018.
Appendix 2b: Frequency table (industry and occupation)
Industry (1) (2) (3) (4) (5) (6) (7) (8) (9) Total A - Agriculture, forestry and fishing 37 19 13 34 58 15 - 25 93 - B,D,E - Energy and water 93 149 128 78 98 - 46 139 76 - C - Manufacturing 633 770 748 469 983 - 106 948 380 - F - Construction 311 343 203 265 605 - 34 159 121 - G,I - Distribution, hotels and restaurants 871 259 511 601 712 64 2,328 450 1,425 7,221 H,J - Transport and communication 422 994 549 352 164 107 147 711 517 3,963 K,L,M,N - Banking and finance 946 1,575 1,432 1,325 209 206 333 103 537 6,666 O,P,Q - Public admin, education and health 1,004 6,188 2,300 2,442 300 3,217 188 82 853 16,574 R,S,T,U - Other services 211 314 279 335 135 349 54 31 188 1,896 Total 4,528 10,611 6,163 5,901 3,264 3,969 - 2,648 4,190 44,517
Notes: SOC codes: (1) Managerial, (2) Professional, (3) Associate and technical, (4) Administrative, (5) Skilled trades, (6) Caring, leisure and services, (7) Sales and customer service, (8) Process and machine, (9) Elementary; - denotes suppressed if number < 10; suppressed values impede the creation of frequency charts and calculation of shares; totals differ because of different missing values for different variables. Source: ONS QLFS 2011-2018.
21 Social Policy Working Paper 04-20
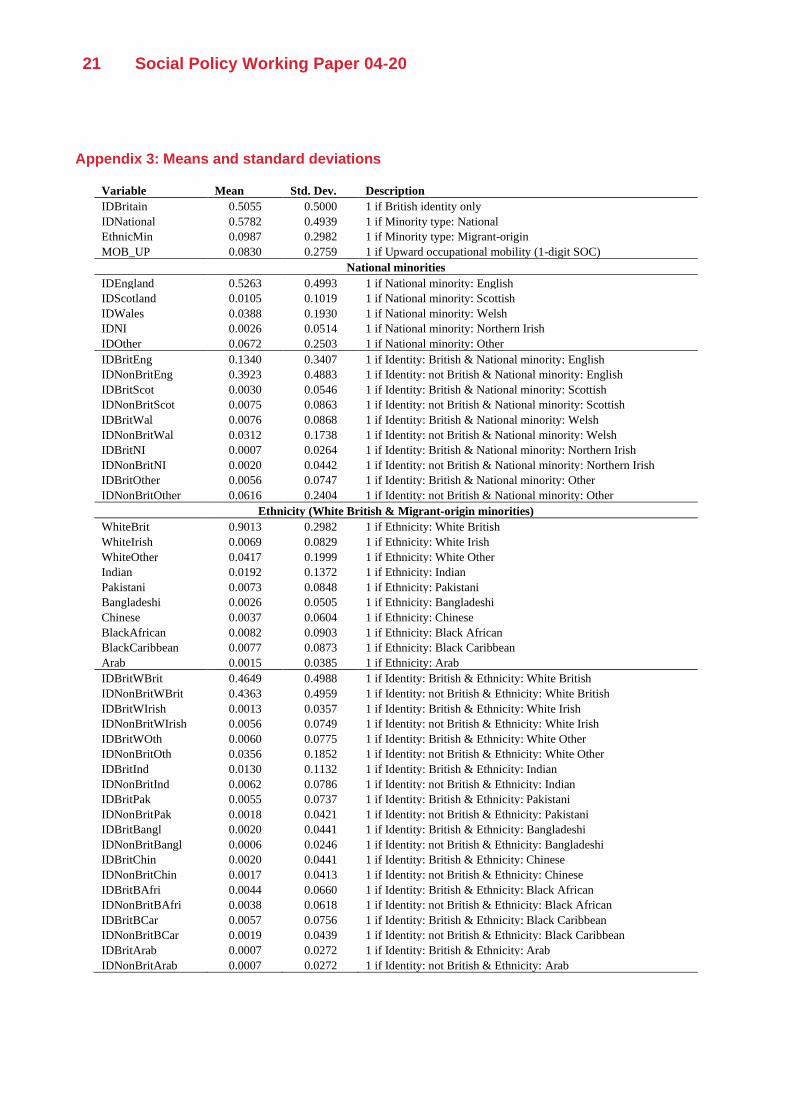
Appendix 3: Means and standard deviations
Variable Mean Std. Dev. Description IDBritain 0.5055 0.5000 1 if British identity only IDNational 0.5782 0.4939 1 if Minority type: National EthnicMin 0.0987 0.2982 1 if Minority type: Migrant-origin MOB_UP 0.0830 0.2759 1 if Upward occupational mobility (1-digit SOC)
National minorities IDEngland 0.5263 0.4993 1 if National minority: English IDScotland 0.0105 0.1019 1 if National minority: Scottish IDWales 0.0388 0.1930 1 if National minority: Welsh IDNI 0.0026 0.0514 1 if National minority: Northern Irish IDOther 0.0672 0.2503 1 if National minority: Other IDBritEng 0.1340 0.3407 1 if Identity: British & National minority: English IDNonBritEng 0.3923 0.4883 1 if Identity: not British & National minority: English IDBritScot 0.0030 0.0546 1 if Identity: British & National minority: Scottish IDNonBritScot 0.0075 0.0863 1 if Identity: not British & National minority: Scottish IDBritWal 0.0076 0.0868 1 if Identity: British & National minority: Welsh IDNonBritWal 0.0312 0.1738 1 if Identity: not British & National minority: Welsh IDBritNI 0.0007 0.0264 1 if Identity: British & National minority: Northern Irish IDNonBritNI 0.0020 0.0442 1 if Identity: not British & National minority: Northern Irish IDBritOther 0.0056 0.0747 1 if Identity: British & National minority: Other IDNonBritOther 0.0616 0.2404 1 if Identity: not British & National minority: Other
Ethnicity (White British & Migrant-origin minorities) WhiteBrit 0.9013 0.2982 1 if Ethnicity: White British WhiteIrish 0.0069 0.0829 1 if Ethnicity: White Irish WhiteOther 0.0417 0.1999 1 if Ethnicity: White Other Indian 0.0192 0.1372 1 if Ethnicity: Indian Pakistani 0.0073 0.0848 1 if Ethnicity: Pakistani Bangladeshi 0.0026 0.0505 1 if Ethnicity: Bangladeshi Chinese 0.0037 0.0604 1 if Ethnicity: Chinese BlackAfrican 0.0082 0.0903 1 if Ethnicity: Black African BlackCaribbean 0.0077 0.0873 1 if Ethnicity: Black Caribbean Arab 0.0015 0.0385 1 if Ethnicity: Arab IDBritWBrit 0.4649 0.4988 1 if Identity: British & Ethnicity: White British IDNonBritWBrit 0.4363 0.4959 1 if Identity: not British & Ethnicity: White British IDBritWIrish 0.0013 0.0357 1 if Identity: British & Ethnicity: White Irish IDNonBritWIrish 0.0056 0.0749 1 if Identity: not British & Ethnicity: White Irish IDBritWOth 0.0060 0.0775 1 if Identity: British & Ethnicity: White Other IDNonBritOth 0.0356 0.1852 1 if Identity: not British & Ethnicity: White Other IDBritInd 0.0130 0.1132 1 if Identity: British & Ethnicity: Indian IDNonBritInd 0.0062 0.0786 1 if Identity: not British & Ethnicity: Indian IDBritPak 0.0055 0.0737 1 if Identity: British & Ethnicity: Pakistani IDNonBritPak 0.0018 0.0421 1 if Identity: not British & Ethnicity: Pakistani IDBritBangl 0.0020 0.0441 1 if Identity: British & Ethnicity: Bangladeshi IDNonBritBangl 0.0006 0.0246 1 if Identity: not British & Ethnicity: Bangladeshi IDBritChin 0.0020 0.0441 1 if Identity: British & Ethnicity: Chinese IDNonBritChin 0.0017 0.0413 1 if Identity: not British & Ethnicity: Chinese IDBritBAfri 0.0044 0.0660 1 if Identity: British & Ethnicity: Black African IDNonBritBAfri 0.0038 0.0618 1 if Identity: not British & Ethnicity: Black African IDBritBCar 0.0057 0.0756 1 if Identity: British & Ethnicity: Black Caribbean IDNonBritBCar 0.0019 0.0439 1 if Identity: not British & Ethnicity: Black Caribbean IDBritArab 0.0007 0.0272 1 if Identity: British & Ethnicity: Arab IDNonBritArab 0.0007 0.0272 1 if Identity: not British & Ethnicity: Arab
Ivelina Hristova 22
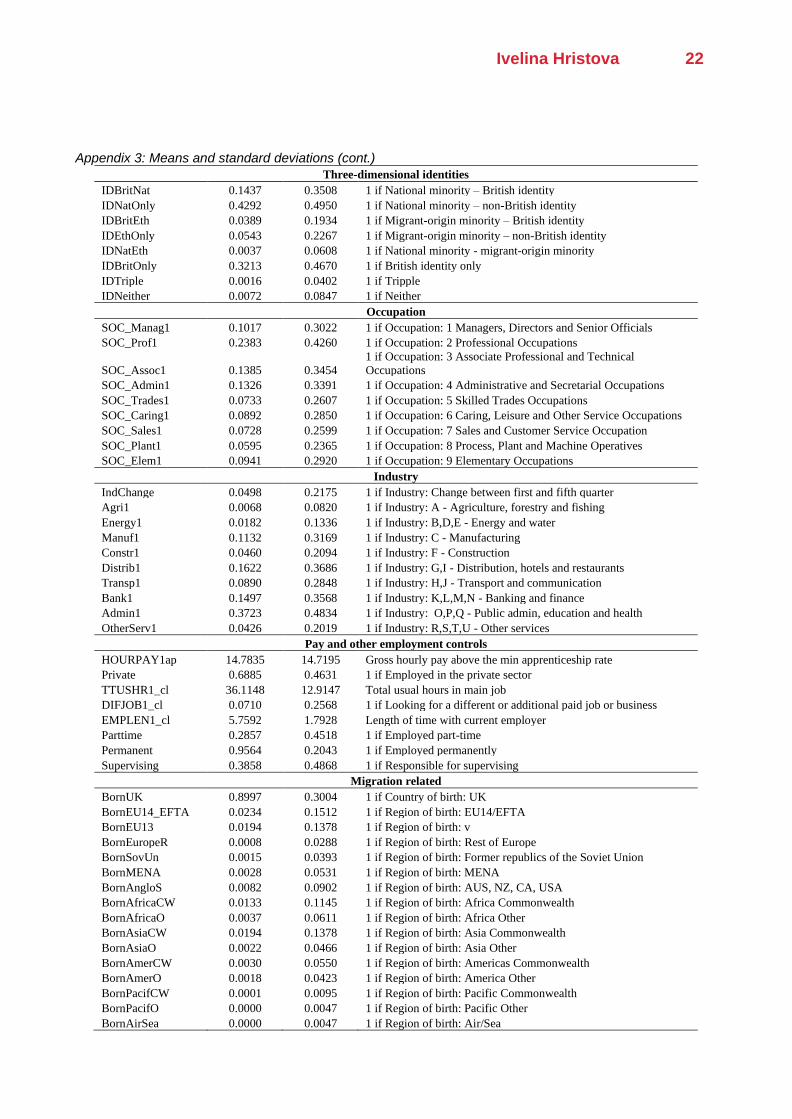
Appendix 3: Means and standard deviations (cont.)
Three-dimensional identities IDBritNat 0.1437 0.3508 1 if National minority – British identity IDNatOnly 0.4292 0.4950 1 if National minority – non-British identity IDBritEth 0.0389 0.1934 1 if Migrant-origin minority – British identity IDEthOnly 0.0543 0.2267 1 if Migrant-origin minority – non-British identity IDNatEth 0.0037 0.0608 1 if National minority - migrant-origin minority IDBritOnly 0.3213 0.4670 1 if British identity only IDTriple 0.0016 0.0402 1 if Tripple IDNeither 0.0072 0.0847 1 if Neither
Occupation SOC_Manag1 0.1017 0.3022 1 if Occupation: 1 Managers, Directors and Senior Officials SOC_Prof1 0.2383 0.4260 1 if Occupation: 2 Professional Occupations
SOC_Assoc1 0.1385 0.3454 1 if Occupation: 3 Associate Professional and Technical Occupations
SOC_Admin1 0.1326 0.3391 1 if Occupation: 4 Administrative and Secretarial Occupations SOC_Trades1 0.0733 0.2607 1 if Occupation: 5 Skilled Trades Occupations SOC_Caring1 0.0892 0.2850 1 if Occupation: 6 Caring, Leisure and Other Service Occupations SOC_Sales1 0.0728 0.2599 1 if Occupation: 7 Sales and Customer Service Occupation SOC_Plant1 0.0595 0.2365 1 if Occupation: 8 Process, Plant and Machine Operatives SOC_Elem1 0.0941 0.2920 1 if Occupation: 9 Elementary Occupations
Industry IndChange 0.0498 0.2175 1 if Industry: Change between first and fifth quarter Agri1 0.0068 0.0820 1 if Industry: A - Agriculture, forestry and fishing Energy1 0.0182 0.1336 1 if Industry: B,D,E - Energy and water Manuf1 0.1132 0.3169 1 if Industry: C - Manufacturing Constr1 0.0460 0.2094 1 if Industry: F - Construction Distrib1 0.1622 0.3686 1 if Industry: G,I - Distribution, hotels and restaurants Transp1 0.0890 0.2848 1 if Industry: H,J - Transport and communication Bank1 0.1497 0.3568 1 if Industry: K,L,M,N - Banking and finance Admin1 0.3723 0.4834 1 if Industry: O,P,Q - Public admin, education and health OtherServ1 0.0426 0.2019 1 if Industry: R,S,T,U - Other services
Pay and other employment controls HOURPAY1ap 14.7835 14.7195 Gross hourly pay above the min apprenticeship rate Private 0.6885 0.4631 1 if Employed in the private sector TTUSHR1_cl 36.1148 12.9147 Total usual hours in main job DIFJOB1_cl 0.0710 0.2568 1 if Looking for a different or additional paid job or business EMPLEN1_cl 5.7592 1.7928 Length of time with current employer Parttime 0.2857 0.4518 1 if Employed part-time Permanent 0.9564 0.2043 1 if Employed permanently Supervising 0.3858 0.4868 1 if Responsible for supervising
Migration related BornUK 0.8997 0.3004 1 if Country of birth: UK BornEU14_EFTA 0.0234 0.1512 1 if Region of birth: EU14/EFTA BornEU13 0.0194 0.1378 1 if Region of birth: v BornEuropeR 0.0008 0.0288 1 if Region of birth: Rest of Europe BornSovUn 0.0015 0.0393 1 if Region of birth: Former republics of the Soviet Union BornMENA 0.0028 0.0531 1 if Region of birth: MENA BornAngloS 0.0082 0.0902 1 if Region of birth: AUS, NZ, CA, USA BornAfricaCW 0.0133 0.1145 1 if Region of birth: Africa Commonwealth BornAfricaO 0.0037 0.0611 1 if Region of birth: Africa Other BornAsiaCW 0.0194 0.1378 1 if Region of birth: Asia Commonwealth BornAsiaO 0.0022 0.0466 1 if Region of birth: Asia Other BornAmerCW 0.0030 0.0550 1 if Region of birth: Americas Commonwealth BornAmerO 0.0018 0.0423 1 if Region of birth: America Other BornPacifCW 0.0001 0.0095 1 if Region of birth: Pacific Commonwealth BornPacifO 0.0000 0.0047 1 if Region of birth: Pacific Other BornAirSea 0.0000 0.0047 1 if Region of birth: Air/Sea

23 Social Policy Working Paper 04-20
Appendix 3: Means and standard deviations (cont.)
BornEU11 0.0175 0.1310 1 if Region of birth: EU13 excluding Malta, Cyprus BornCW 0.0358 0.1857 1 if Region of birth: Commonwealth BornOther 0.0130 0.1132 1 if Region of birth: Other than EU, EFTA, USA, Commonwealth CAMEYR 21.0227 16.0839 Years since first arrival to UK as in first quarter CAMEAGE 21.5253 12.6017 Age at first arrival to the UK as in first quarter
Education HighDegree 0.4404 0.4964 1 if Education: Higher education, degree or equivalent ALevel 0.2374 0.4255 2 if Education: HGCE, A-level or equivalent GCSE 0.2077 0.4057 3 if Education: GCSE grades A*-C or equivalent OtherQual 0.0812 0.2732 4 if Education: Other qualifications NoQual 0.0333 0.1793 5 if Education: No qualification
Demographics/household/region LondonSE 0.3269 0.4691 1 if Region: Greater London/South East (NUTS 1) FEMALE 0.5106 0.4999 1 if Female AGE1 44.9895 12.0872 Age of respondent Single 0.2647 0.4412 1 if Marital status: Single, never married MariedPart 0.6056 0.4887 1 if Marital status: Married, in civil partnership, living with spouse SepDivWid 0.1297 0.3360 1 if Marital status: Divorced, separated, widowed MARSTA_ch 0.0138 0.1167 1 if Marital status: Change between first and fifth quarter FamHead 0.5575 0.4967 1 if Head of family unit FamPart 0.3600 0.4800 1 if Wife or partner of head of family unit FamChild 0.0825 0.2751 1 if Child of head of family unit HDPCH191_cl 0.7322 0.9886 Number of dependent children in household under 19 Owned 0.2618 0.4396 1 if Accommodation: Owned outright Mortgage 0.5511 0.4974 1 if Accommodation: Being bought with mortgage or loan Partrent 0.0070 0.0835 1 if Accommodation: Partly rent Rented 0.1734 0.3786 1 if Accommodation: Rented Rentfree 0.0066 0.0810 1 if Accommodation: Rent free Squatting 0.0000 0.0067 1 if Accommodation: Squatting cohort 11.5519 6.5634 Cohort number in merged dataset
Note: N=44548. Mixed national minorities (e.g. English and Scottish) and mixed migrant-origin minorities
(e.g. White and Asian) excluded; managerial occupations used as a reference category for participation
checks and cases included in descriptive statistics; without managerial occupations: MOB_UP mean is
0.0924, Std. Dev is 0.2896; White Gypsy or Irish Traveller excluded from White Other; mixed minorities
excluded. Source: ONS QLFS 2011-2018.
Ivelina Hristova 24
Appendix 4: hierarchy based on identity interactions
Regression results H3: Pooled (1) (2) (3) National minority – non-British identity 0.925 0.974 0.958 (0.069) (0.072) (0.077) Migrant-origin minority – British identity 0.956 0.981 1.100 (0.176) (0.179) (0.219) Migrant-origin minority – non-British identity
0.749 0.698 0.679
(0.183) (0.161) (0.175) Occupation x Industry x Pay and employment x Migration related x x x Education x x x Demographics/household/region x x x N 13,401 13,382 11,126 Pseudo R2 0.0872 0.0502 0.0300 Prob > chi2 0.0000 0.0000 0.0000 Ranking
Expected Estimated
(1) (2) (3) National minority – British identity 1 1 1 2 National minority – non-British identity 2 3 3 3 Migrant-origin minority – British identity 3 2 2 1 Migrant-origin minority – non-British identity
4 4 4 4
Notes: reference categories national minority-British identity; four remaining combinations not tested in the
models (Table 2) are excluded from the sample; partial models: (1) occupation, (2) industry, (3)
pay/employment; odds ratios (OR) reported; standard errors in parentheses; * denotes statistical significance
at the 10% level, ** at the 5% level and *** at the 1% level; x denotes controls included.
Source: ONS QLFS 2011-2018

25 Social Policy Working Paper 04-20
Appendix 5: Sample construction
Self-employed were excluded from the sample because they have the freedom to choose their own
occupation level and their OM might not be comparable to those of employed individuals.
Moreover, pay is not available for self-employed and such cases are dropped from the models
controlling for pay, yet kept in models that control for occupation and industry. This results in the
fact that these models are run for populations with different characteristics, with the
occupation/industry models including the self-employed, and the pay models – excluding them.
Excluding self-employed from the sample makes such models more comparable. Finally, self-
employment might be associated with different social dynamics at the work place, for example
defined by recruiter/line manager attitudes, implicit bias and (perceived) discrimination. Despite the
fact that these are unfortunately not controlled for in the analysis, evidence suggests that the latter
might results in lower chance to feel British (Heath and Demireva, 2014). Therefore, excluding self-
employed from the sample helped to keep the interpretation related to the social dynamics at the
work more straightforward. However, it is due to mention that migrant-origin minorities in the UK
tend to be overrepresented in entrepreneurship – for example running small shops, and hence – in
self-employment (Castles et al., 2014, p.246), and a disadvantage is that the analysis doesn’t
account for that.
Gross hourly pay for the employed contained values approaching zeros that are clearly below the
legal rates. This might be due to errors in the data reporting. To account for that, cases with values
below the lowest legal rates – the apprenticeship rates for the respective response quarters, were
dropped from the sample. Unfortunately, the apprenticeship rate applies universally without an age
requirement, and age can’t be used to narrow down whether a responded is in apprenticeship or
not. These rates used are as follows: £2.50 (wave 1), £2.60 (waves 2-5); £2.65 (waves 6-9), £2.68
(waves 10-13), £2.73 (waves 14-17), £3.30 (waves 18-21), £3.40 (waves 22-23) (GOV.UK, 2018,
2017).
Additionally, the Secure Access data allowed to control for country of birth, years since migration
and age at migration. A dummy for being born in the UK was created, and the remaining cases
were allocated to 15 dummies for region of birth, depending on continent and (previously) being
part of the Commonwealth. However, disproportionately high number of cases for the foreign-born
population were dropped because of small/zero cells. To account for that, all foreign-born cases
were recoded into five main categories – EU15 plus EFTA except UK, EU13 except Malta and
Cyprus, Commonwealth except Australia and New Zealand, Anglo-Saxon, and Other. Finally,
persistently small cells and regression diagnostics indicated that using the single dummy for being
born in the UK is the best approach, which was adopted.
Questions for years since migration and age at migration are applicable to foreign-born only,
contained missing values for those born in the UK, and adding them to the models made the
sample collapse. However, the literature indicates that both are strongly associated with the feeling
Ivelina Hristova 26
of belonging to the country of destination (Battu and Zenou, 2010; Casey and Dustmann, 2010;
Manning and Roy, 2010). To be able to keep that information in the analysis, the missing values for
those born in the UK were replaced with a fixed logical value. For years since migration, the
missing values were replaced with 70 – the maximum age in the sample, as if a UK-born person
had migrated in the beginning of their life. For age at migration, the missing values were replaced 0
– as if a UK-born person had been brought in as a baby. These choices allowed to keep the
natural behavior of these variables (e.g. more years since migration/earlier age at migration are
associated with higher probabilities to feel British). At the same time, the variation in these
variables came from the original values only (as all recorded cases have the same value).