Embed Size (px)
Citation preview
POSTSECONDARY PERSISTENCE REPORT: 2009-2016 North Carolina Public High School Graduates
EXECUTIVE SUMMARY
CU
RR
EN
T
Individual educational attainment and barriers to attainment are not readily
captured by a single indicator. Educational attainment is a process with multiple
key steps. After completing high school, individuals must enroll in college and
persist in their enrollment until degree completion. In a series of four data
briefs, we use National Student Clearinghouse data to better understand key
transition points and the college-going behaviors of North Carolina public high
school graduates from 2009-2016. Specifically, we will examine:
1. Access: How many students are going to college?
2. Persistence: How many students are still enrolled in postsecondary after
their first year?
3. Success: How many students persist in their postsecondary enrollments to
successfully complete a degree or credential?
4. Postsecondary Pathways and Barriers to Opportunity: What are the most
common pathways through postsecondary? What are the potential barriers
to success suggested by pathways that end in stopout or dropout?
In this report, we focus on the details related to persistence among North
Carolina high school graduates, examining both college persistence and
retention, and how these vary by the students’ demographic and enrollment
characteristics, including timing of enrollment, intensity of enrollment, and
institution of first enrollment.
Key definitions:• Persistence: a student was still enrolled in postsecondary education — at
any institution — in the year after their first enrollment. Persistence can
also be conceptualized as the combination of retention and change.
• Retention: a student was still enrolled in postsecondary education at the
institution of initial enrollment in the year after their first enrollment.
• Change: a student was still enrolled in postsecondary education in the year
after their first enrollment but had moved to a different institution than
where they initially enrolled.
• On-time enrollment: enrollment in a postsecondary institution in the fall
semester immediately following high school graduation.
• Delayed enrollment: enrollment that was not on time but was within two
years of high school graduation.
Des
ign
by
Ad
rial
Des
igns
.co
m
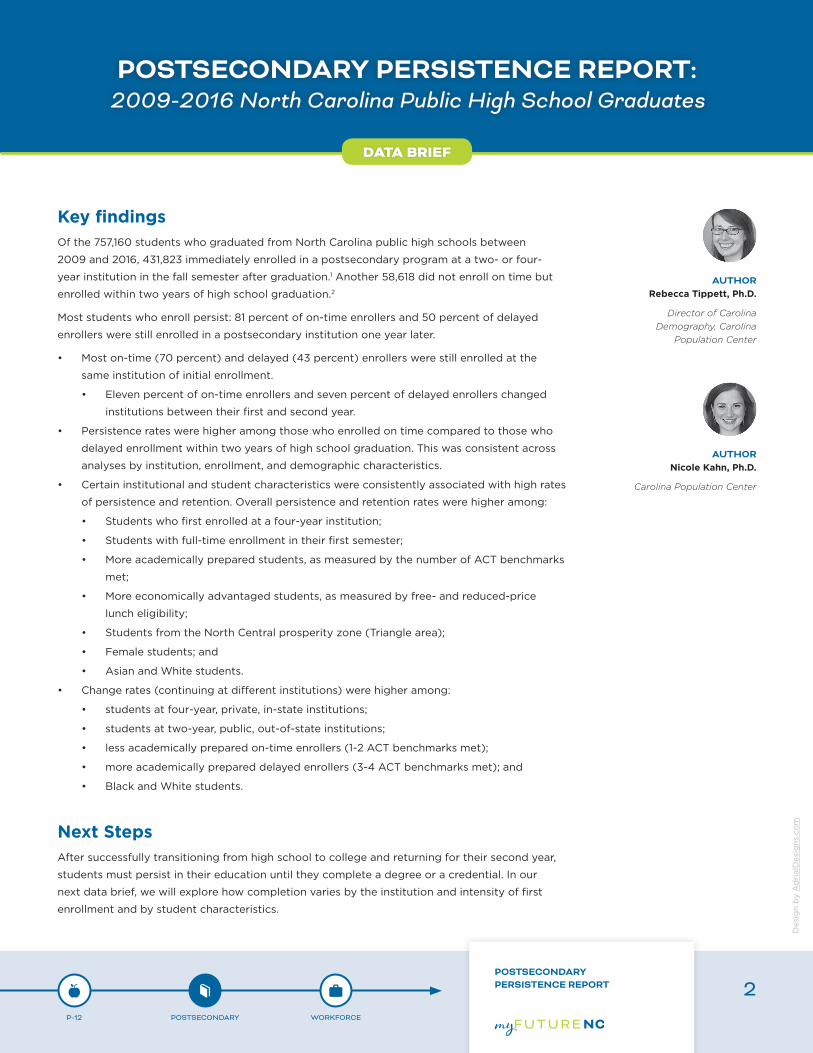
Key findingsOf the 757,160 students who graduated from North Carolina public high schools between
2009 and 2016, 431,823 immediately enrolled in a postsecondary program at a two- or four-
year institution in the fall semester after graduation.1 Another 58,618 did not enroll on time but
enrolled within two years of high school graduation.2
Most students who enroll persist: 81 percent of on-time enrollers and 50 percent of delayed
enrollers were still enrolled in a postsecondary institution one year later.
• Most on-time (70 percent) and delayed (43 percent) enrollers were still enrolled at the
same institution of initial enrollment.
• Eleven percent of on-time enrollers and seven percent of delayed enrollers changed
institutions between their first and second year.
• Persistence rates were higher among those who enrolled on time compared to those who
delayed enrollment within two years of high school graduation. This was consistent across
analyses by institution, enrollment, and demographic characteristics.
• Certain institutional and student characteristics were consistently associated with high rates
of persistence and retention. Overall persistence and retention rates were higher among:
• Students who first enrolled at a four-year institution;
• Students with full-time enrollment in their first semester;
• More academically prepared students, as measured by the number of ACT benchmarks
met;
• More economically advantaged students, as measured by free- and reduced-price
lunch eligibility;
• Students from the North Central prosperity zone (Triangle area);
• Female students; and
• Asian and White students.
• Change rates (continuing at different institutions) were higher among:
• students at four-year, private, in-state institutions;
• students at two-year, public, out-of-state institutions;
• less academically prepared on-time enrollers (1-2 ACT benchmarks met);
• more academically prepared delayed enrollers (3-4 ACT benchmarks met); and
• Black and White students.
Next StepsAfter successfully transitioning from high school to college and returning for their second year,
students must persist in their education until they complete a degree or a credential. In our
next data brief, we will explore how completion varies by the institution and intensity of first
enrollment and by student characteristics.
AUTHOR Rebecca Tippett, Ph.D.
Director of Carolina Demography, Carolina
Population Center
AUTHOR Nicole Kahn, Ph.D.
Carolina Population Center
POSTSECONDARY PERSISTENCE REPORT: 2009-2016 North Carolina Public High School Graduates
DATA BRIEF
P-12 POSTSECONDARY WORKFORCE
POSTSECONDARY PERSISTENCE REPORT 2

Des
ign
by
Ad
rial
Des
igns
.co
m
IntroductionInitial enrollment in a postsecondary program is just the first step toward the goal of
postsecondary degree or certificate attainment. Following enrollment, students must
continue their enrollment to degree completion, typically referred to as persistence.
First-year persistence rates represent the share of students who began a postsecondary
program and who are still enrolled in any postsecondary program one year later. First-year
retention rates represent the share of students who are still enrolled at the same institution
of initial enrollment.
First-year persistence rates are a key indicator, as the first year of postsecondary
enrollment is a critical period: the greatest share of postsecondary dropouts occur during
the first year than any other time.3 There are well-documented differences in student
persistence and retention by:
• Type of program (two-year versus four-year);
• Institutional sector (public versus private);
• Institutional selectivity and academic readiness;
• Intensity of attendance (full-time versus part-time); and
• The sociodemographic characteristics of the student and their family.4
These characteristics are often interrelated. For example, economic disadvantage is
associated with lower academic readiness and such students are more likely to enroll part-
time or at less selective institutions. These students may be more likely to face academic
or financial challenges during their first year, resulting in lower overall persistence.
Retention Versus PersistenceRetention and persistence are both metrics that capture a student’s progress through
postsecondary:
• Institutions retain. Retention rates capture the share of students who continue
enrollment within the same higher education institution or system.
• Individuals persist. Persistence rates capture the share of students who continue
enrollment at any higher education institution in the following year, even if this is a
different institution or system than the one at which the student initially enrolled.
Because retention rates are limited to progress within the same initial institution, they are
lower than persistence rates.
P-12 POSTSECONDARY WORKFORCE
POSTSECONDARY PERSISTENCE REPORT 3
Des
ign
by
Ad
rial
Des
igns
.co
m
FIG. 1: POSTSECONDARY PERSISTENCE AND RETENTION RATES OF NC HIGH SCHOOL GRADUATES WHO BEGAN
POSTSECONDARY (2009-2016)
Trends in Overall Persistence and Retention
KEY FINDINGS:
• Most students who enroll on time persist into their second year of postsecondary
education, and the majority of these are retained at their original postsecondary
institutions.
• Students who delay enrollment are less likely to persist into their second year
compared to those who enrolled on time.
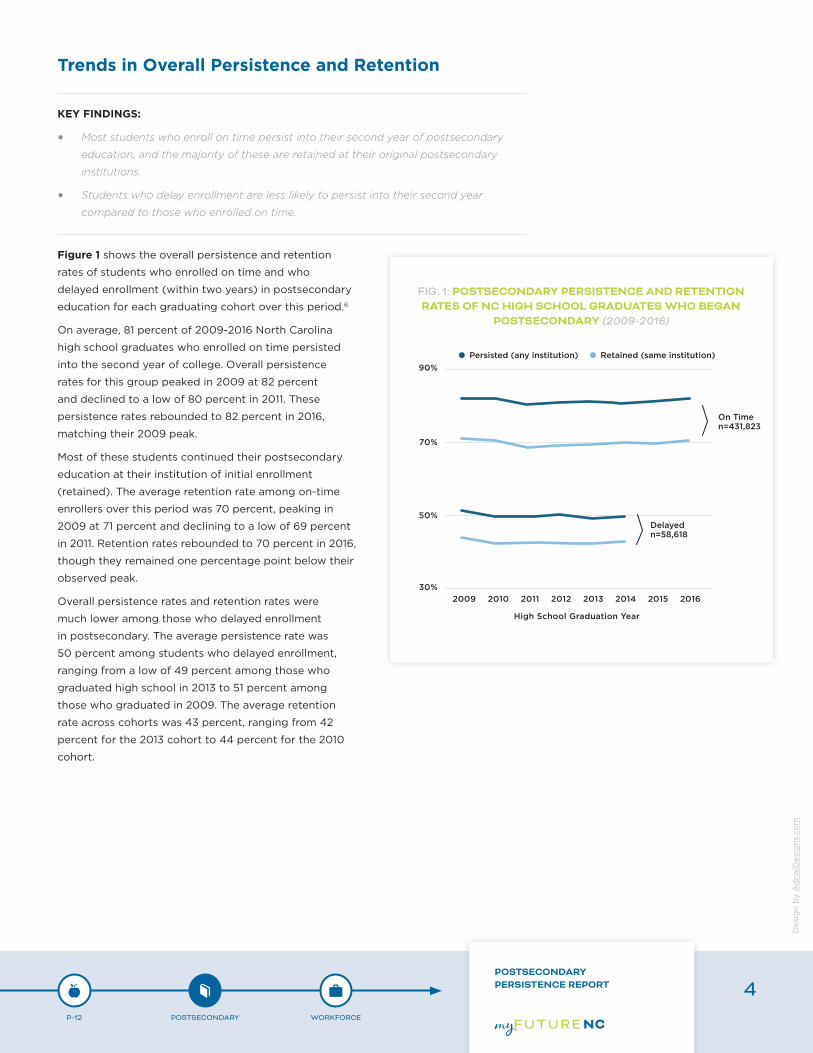
Figure 1 shows the overall persistence and retention
rates of students who enrolled on time and who
delayed enrollment (within two years) in postsecondary
education for each graduating cohort over this period.6
On average, 81 percent of 2009-2016 North Carolina
high school graduates who enrolled on time persisted
into the second year of college. Overall persistence
rates for this group peaked in 2009 at 82 percent
and declined to a low of 80 percent in 2011. These
persistence rates rebounded to 82 percent in 2016,
matching their 2009 peak.
Most of these students continued their postsecondary
education at their institution of initial enrollment
(retained). The average retention rate among on-time
enrollers over this period was 70 percent, peaking in
2009 at 71 percent and declining to a low of 69 percent
in 2011. Retention rates rebounded to 70 percent in 2016,
though they remained one percentage point below their
observed peak.
Overall persistence rates and retention rates were
much lower among those who delayed enrollment
in postsecondary. The average persistence rate was
50 percent among students who delayed enrollment,
ranging from a low of 49 percent among those who
graduated high school in 2013 to 51 percent among
those who graduated in 2009. The average retention
rate across cohorts was 43 percent, ranging from 42
percent for the 2013 cohort to 44 percent for the 2010
cohort.
P-12 POSTSECONDARY WORKFORCE
POSTSECONDARY PERSISTENCE REPORT 4
Des
ign
by
Ad
rial
Des
igns
.co
m
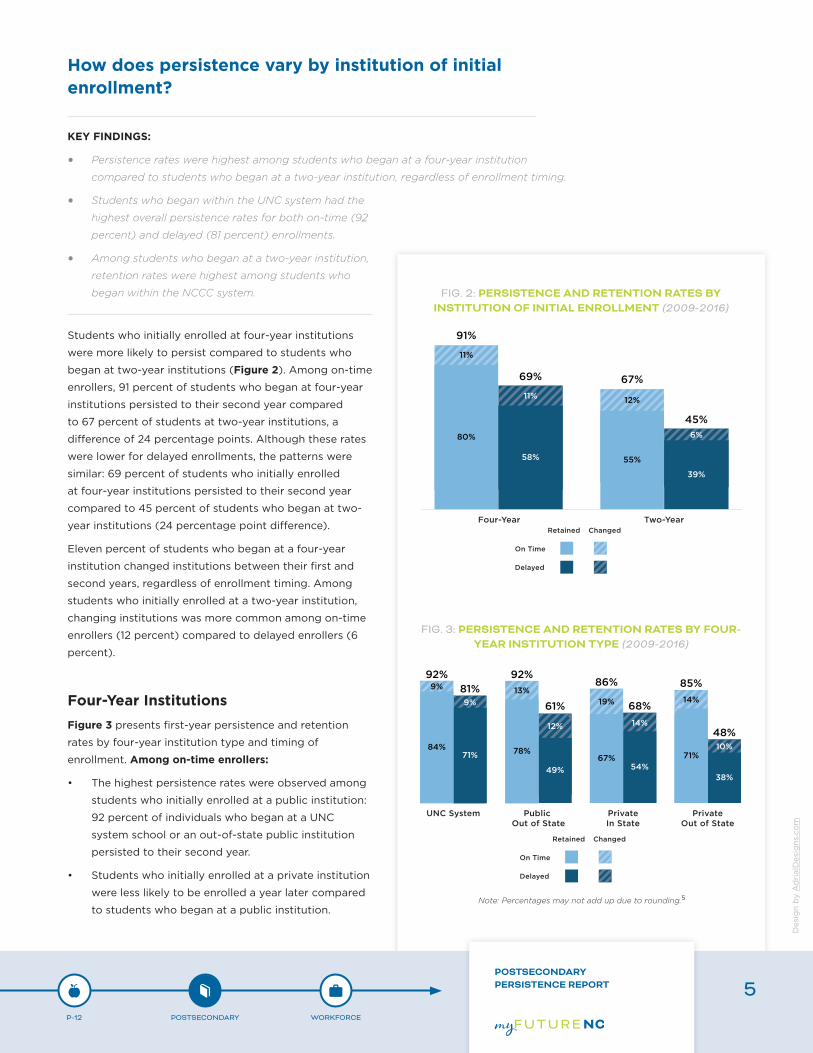
How does persistence vary by institution of initial enrollment?
KEY FINDINGS:
• Persistence rates were highest among students who began at a four-year institution
compared to students who began at a two-year institution, regardless of enrollment timing.
• Students who began within the UNC system had the
highest overall persistence rates for both on-time (92
percent) and delayed (81 percent) enrollments.
• Among students who began at a two-year institution,
retention rates were highest among students who
began within the NCCC system.
Students who initially enrolled at four-year institutions
were more likely to persist compared to students who
began at two-year institutions (Figure 2). Among on-time
enrollers, 91 percent of students who began at four-year
institutions persisted to their second year compared
to 67 percent of students at two-year institutions, a
difference of 24 percentage points. Although these rates
were lower for delayed enrollments, the patterns were
similar: 69 percent of students who initially enrolled
at four-year institutions persisted to their second year
compared to 45 percent of students who began at two-
year institutions (24 percentage point difference).
Eleven percent of students who began at a four-year
institution changed institutions between their first and
second years, regardless of enrollment timing. Among
students who initially enrolled at a two-year institution,
changing institutions was more common among on-time
enrollers (12 percent) compared to delayed enrollers (6
percent).
Four-Year InstitutionsFigure 3 presents first-year persistence and retention
rates by four-year institution type and timing of
enrollment. Among on-time enrollers:
• The highest persistence rates were observed among
students who initially enrolled at a public institution:
92 percent of individuals who began at a UNC
system school or an out-of-state public institution
persisted to their second year.
• Students who initially enrolled at a private institution
were less likely to be enrolled a year later compared
to students who began at a public institution.
FIG. 3: PERSISTENCE AND RETENTION RATES BY FOUR-YEAR INSTITUTION TYPE (2009-2016)
Note: Percentages may not add up due to rounding.5
FIG. 2: PERSISTENCE AND RETENTION RATES BY INSTITUTION OF INITIAL ENROLLMENT (2009-2016)
P-12 POSTSECONDARY WORKFORCE
POSTSECONDARY PERSISTENCE REPORT 5
Des
ign
by
Ad
rial
Des
igns
.co
m
Persistence rates were similar among individuals who began in-state (86 percent) and
out-of-state (85 percent).
• UNC had the highest retention rates of any four-year institution: 84 percent of
students who enrolled on time at a UNC system school were enrolled in the same
school the following year.
• Students who initially enrolled at a private, in-state institution were more likely to
change schools between their first and second year: 19 percent of these students
continued at a different institution.
• Students who began at UNC were the least likely to change schools: Just 9 percent of
students who began at UNC were enrolled at a different institution the following year.
Among delayed enrollers:
• UNC had the highest persistence rates: 81 percent of students with delayed
enrollments who began at a UNC system school were still enrolled one year later, with
71 percent still enrolled at the same school. Students who began at an in-state, private
institution had the next highest persistence rates (68 percent).
• Students who delayed enrollment and began at a four-year private, out-of-state
institution were the least likely to persist. Less than half (48 percent) of these
students were enrolled for a second year.
• Changing institutions was most common among students who delayed enrollments
and began at a private, in-state school (14 percent) or a public, out-of-state school (12
percent).
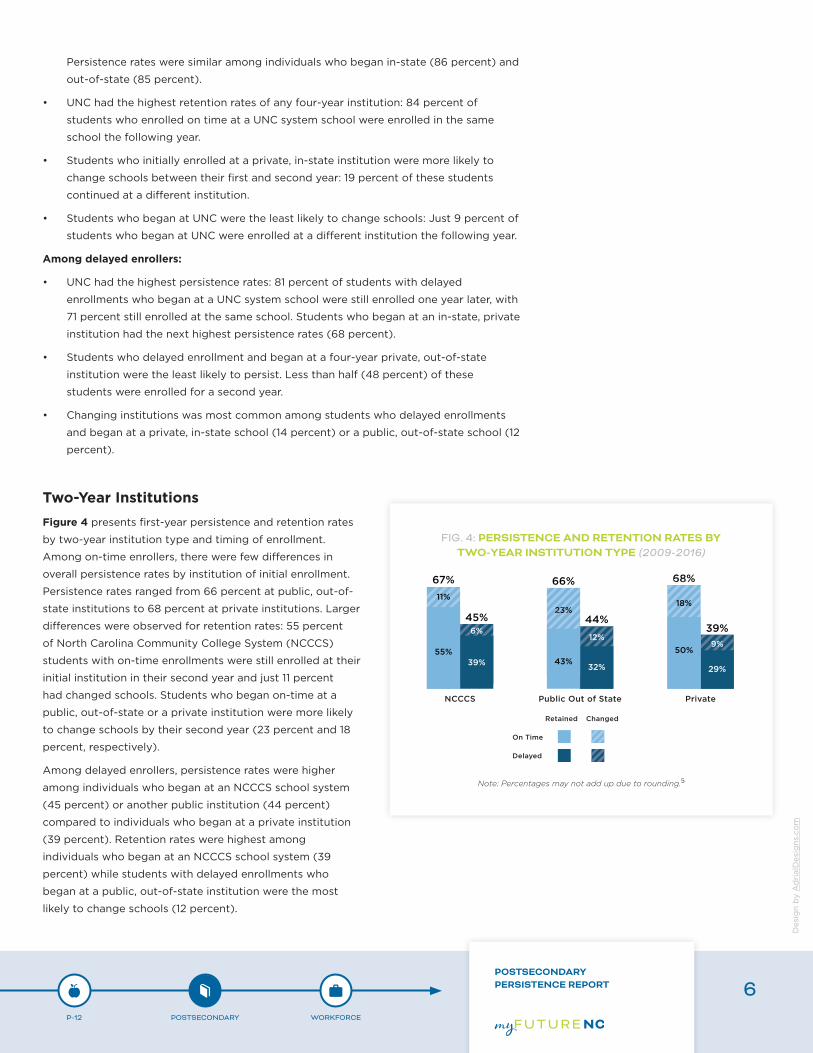
Two-Year InstitutionsFigure 4 presents first-year persistence and retention rates
by two-year institution type and timing of enrollment.
Among on-time enrollers, there were few differences in
overall persistence rates by institution of initial enrollment.
Persistence rates ranged from 66 percent at public, out-of-
state institutions to 68 percent at private institutions. Larger
differences were observed for retention rates: 55 percent
of North Carolina Community College System (NCCCS)
students with on-time enrollments were still enrolled at their
initial institution in their second year and just 11 percent
had changed schools. Students who began on-time at a
public, out-of-state or a private institution were more likely
to change schools by their second year (23 percent and 18
percent, respectively).
Among delayed enrollers, persistence rates were higher
among individuals who began at an NCCCS school system
(45 percent) or another public institution (44 percent)
compared to individuals who began at a private institution
(39 percent). Retention rates were highest among
individuals who began at an NCCCS school system (39
percent) while students with delayed enrollments who
began at a public, out-of-state institution were the most
likely to change schools (12 percent).
FIG. 4: PERSISTENCE AND RETENTION RATES BY TWO-YEAR INSTITUTION TYPE (2009-2016)
Note: Percentages may not add up due to rounding.5
P-12 POSTSECONDARY WORKFORCE
POSTSECONDARY PERSISTENCE REPORT 6
Des
ign
by
Ad
rial
Des
igns
.co
m
FIG. 5: PERSISTENCE AND RETENTION RATES BY INTENSITY OF INITIAL ENROLLMENT (2009-2016)
Note: Percentages may not add up due to rounding.5
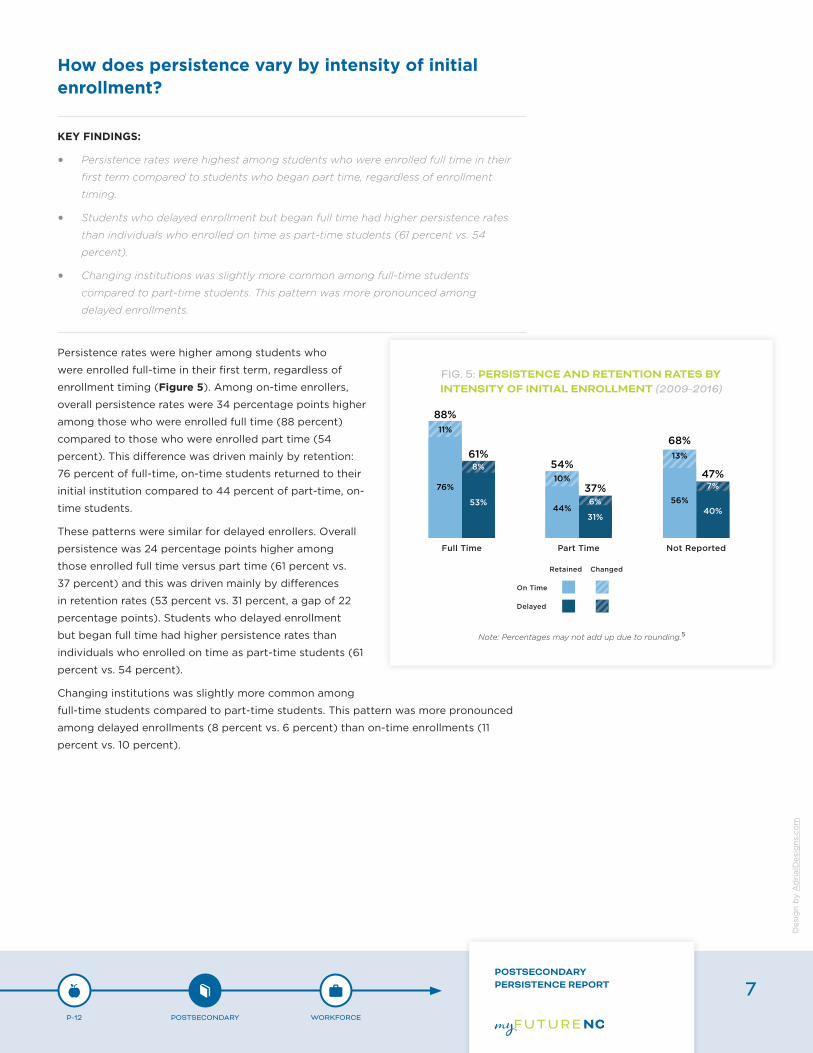
How does persistence vary by intensity of initial enrollment?
KEY FINDINGS:
• Persistence rates were highest among students who were enrolled full time in their
first term compared to students who began part time, regardless of enrollment
timing.
• Students who delayed enrollment but began full time had higher persistence rates
than individuals who enrolled on time as part-time students (61 percent vs. 54
percent).
• Changing institutions was slightly more common among full-time students
compared to part-time students. This pattern was more pronounced among
delayed enrollments.
Persistence rates were higher among students who
were enrolled full-time in their first term, regardless of
enrollment timing (Figure 5). Among on-time enrollers,
overall persistence rates were 34 percentage points higher
among those who were enrolled full time (88 percent)
compared to those who were enrolled part time (54
percent). This difference was driven mainly by retention:
76 percent of full-time, on-time students returned to their
initial institution compared to 44 percent of part-time, on-
time students.
These patterns were similar for delayed enrollers. Overall
persistence was 24 percentage points higher among
those enrolled full time versus part time (61 percent vs.
37 percent) and this was driven mainly by differences
in retention rates (53 percent vs. 31 percent, a gap of 22
percentage points). Students who delayed enrollment
but began full time had higher persistence rates than
individuals who enrolled on time as part-time students (61
percent vs. 54 percent).
Changing institutions was slightly more common among
full-time students compared to part-time students. This pattern was more pronounced
among delayed enrollments (8 percent vs. 6 percent) than on-time enrollments (11
percent vs. 10 percent).
P-12 POSTSECONDARY WORKFORCE
POSTSECONDARY PERSISTENCE REPORT 7
Des
ign
by
Ad
rial
Des
igns
.co
m
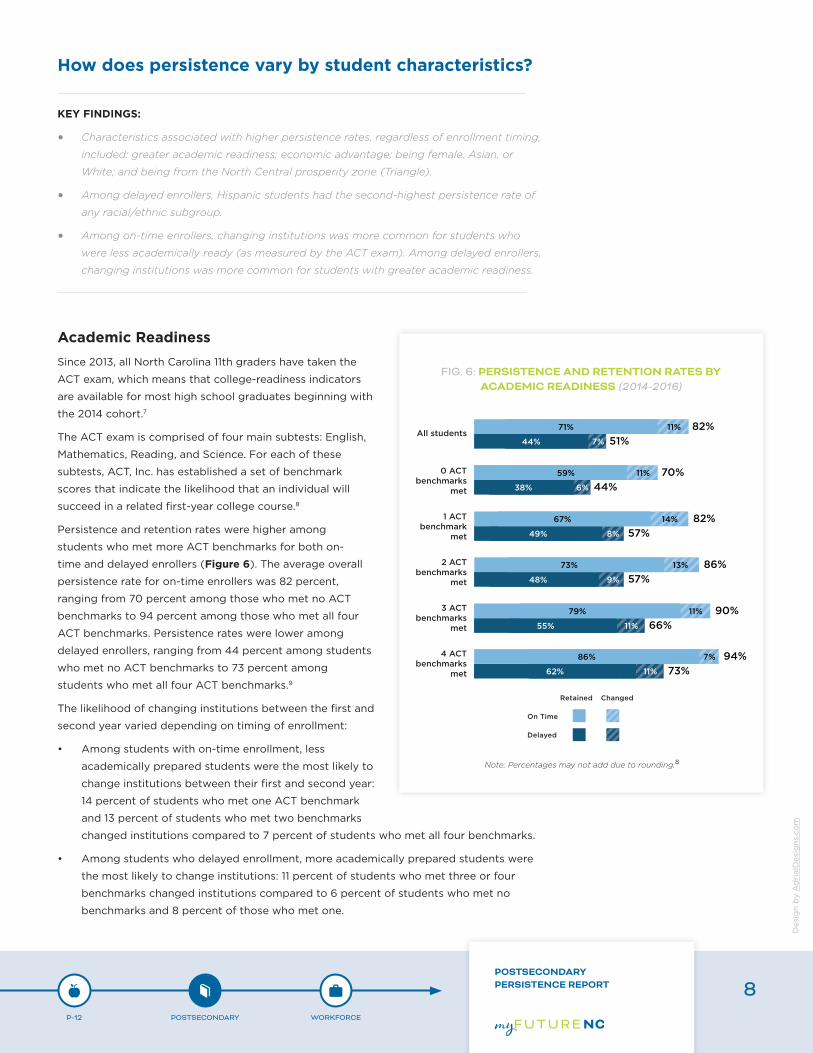
FIG. 6: PERSISTENCE AND RETENTION RATES BY ACADEMIC READINESS (2014-2016)
Note: Percentages may not add due to rounding.8
How does persistence vary by student characteristics?
KEY FINDINGS:
• Characteristics associated with higher persistence rates, regardless of enrollment timing,
included: greater academic readiness; economic advantage; being female, Asian, or
White; and being from the North Central prosperity zone (Triangle).
• Among delayed enrollers, Hispanic students had the second-highest persistence rate of
any racial/ethnic subgroup.
• Among on-time enrollers, changing institutions was more common for students who
were less academically ready (as measured by the ACT exam). Among delayed enrollers,
changing institutions was more common for students with greater academic readiness.
Academic ReadinessSince 2013, all North Carolina 11th graders have taken the
ACT exam, which means that college-readiness indicators
are available for most high school graduates beginning with
the 2014 cohort.7
The ACT exam is comprised of four main subtests: English,
Mathematics, Reading, and Science. For each of these
subtests, ACT, Inc. has established a set of benchmark
scores that indicate the likelihood that an individual will
succeed in a related first-year college course.8
Persistence and retention rates were higher among
students who met more ACT benchmarks for both on-
time and delayed enrollers (Figure 6). The average overall
persistence rate for on-time enrollers was 82 percent,
ranging from 70 percent among those who met no ACT
benchmarks to 94 percent among those who met all four
ACT benchmarks. Persistence rates were lower among
delayed enrollers, ranging from 44 percent among students
who met no ACT benchmarks to 73 percent among
students who met all four ACT benchmarks.9
The likelihood of changing institutions between the first and
second year varied depending on timing of enrollment:
• Among students with on-time enrollment, less
academically prepared students were the most likely to
change institutions between their first and second year:
14 percent of students who met one ACT benchmark
and 13 percent of students who met two benchmarks
changed institutions compared to 7 percent of students who met all four benchmarks.
• Among students who delayed enrollment, more academically prepared students were
the most likely to change institutions: 11 percent of students who met three or four
benchmarks changed institutions compared to 6 percent of students who met no
benchmarks and 8 percent of those who met one.
P-12 POSTSECONDARY WORKFORCE
POSTSECONDARY PERSISTENCE REPORT 8
Des
ign
by
Ad
rial
Des
igns
.co
m
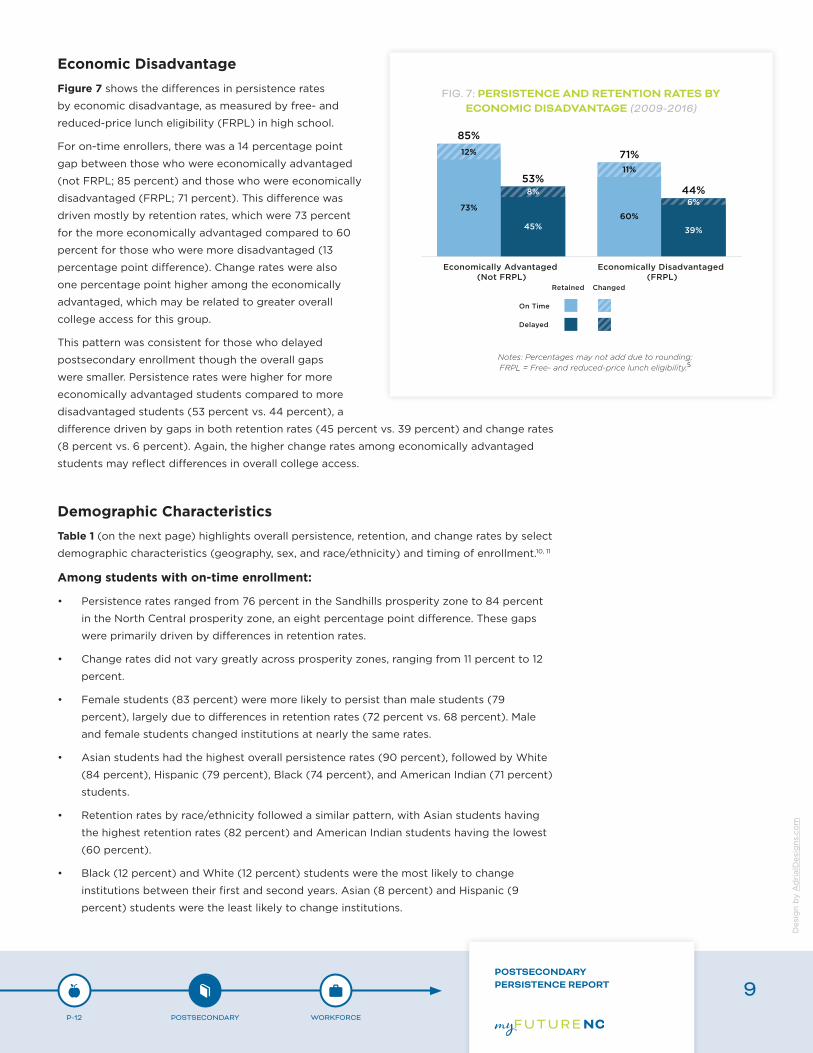
Economic DisadvantageFigure 7 shows the differences in persistence rates
by economic disadvantage, as measured by free- and
reduced-price lunch eligibility (FRPL) in high school.
For on-time enrollers, there was a 14 percentage point
gap between those who were economically advantaged
(not FRPL; 85 percent) and those who were economically
disadvantaged (FRPL; 71 percent). This difference was
driven mostly by retention rates, which were 73 percent
for the more economically advantaged compared to 60
percent for those who were more disadvantaged (13
percentage point difference). Change rates were also
one percentage point higher among the economically
advantaged, which may be related to greater overall
college access for this group.
This pattern was consistent for those who delayed
postsecondary enrollment though the overall gaps
were smaller. Persistence rates were higher for more
economically advantaged students compared to more
disadvantaged students (53 percent vs. 44 percent), a
difference driven by gaps in both retention rates (45 percent vs. 39 percent) and change rates
(8 percent vs. 6 percent). Again, the higher change rates among economically advantaged
students may reflect differences in overall college access.
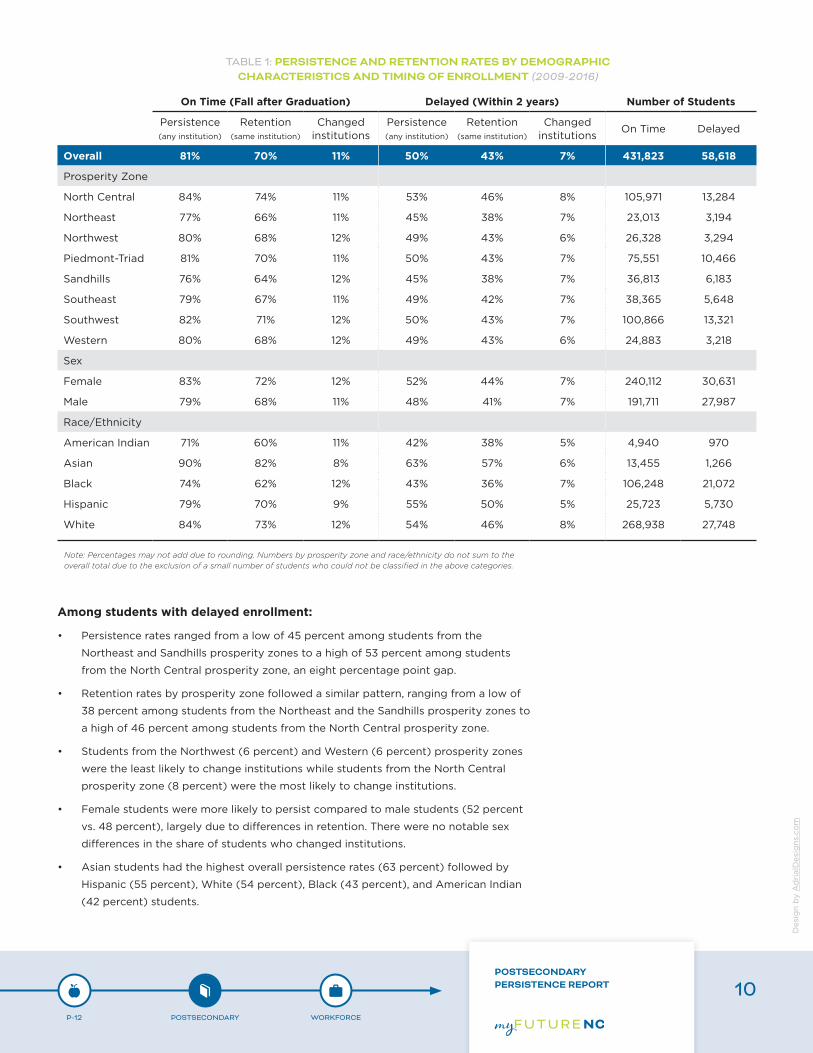
Demographic CharacteristicsTable 1 (on the next page) highlights overall persistence, retention, and change rates by select
demographic characteristics (geography, sex, and race/ethnicity) and timing of enrollment.10, 11
Among students with on-time enrollment:
• Persistence rates ranged from 76 percent in the Sandhills prosperity zone to 84 percent
in the North Central prosperity zone, an eight percentage point difference. These gaps
were primarily driven by differences in retention rates.
• Change rates did not vary greatly across prosperity zones, ranging from 11 percent to 12
percent.
• Female students (83 percent) were more likely to persist than male students (79
percent), largely due to differences in retention rates (72 percent vs. 68 percent). Male
and female students changed institutions at nearly the same rates.
• Asian students had the highest overall persistence rates (90 percent), followed by White
(84 percent), Hispanic (79 percent), Black (74 percent), and American Indian (71 percent)
students.
• Retention rates by race/ethnicity followed a similar pattern, with Asian students having
the highest retention rates (82 percent) and American Indian students having the lowest
(60 percent).
• Black (12 percent) and White (12 percent) students were the most likely to change
institutions between their first and second years. Asian (8 percent) and Hispanic (9
percent) students were the least likely to change institutions.
FIG. 7: PERSISTENCE AND RETENTION RATES BY ECONOMIC DISADVANTAGE (2009-2016)
Notes: Percentages may not add due to rounding; FRPL = Free- and reduced-price lunch eligibility.5
P-12 POSTSECONDARY WORKFORCE
POSTSECONDARY PERSISTENCE REPORT 9
Des
ign
by
Ad
rial
Des
igns
.co
m
Among students with delayed enrollment:
• Persistence rates ranged from a low of 45 percent among students from the
Northeast and Sandhills prosperity zones to a high of 53 percent among students
from the North Central prosperity zone, an eight percentage point gap.
• Retention rates by prosperity zone followed a similar pattern, ranging from a low of
38 percent among students from the Northeast and the Sandhills prosperity zones to
a high of 46 percent among students from the North Central prosperity zone.
• Students from the Northwest (6 percent) and Western (6 percent) prosperity zones
were the least likely to change institutions while students from the North Central
prosperity zone (8 percent) were the most likely to change institutions.
• Female students were more likely to persist compared to male students (52 percent
vs. 48 percent), largely due to differences in retention. There were no notable sex
differences in the share of students who changed institutions.
• Asian students had the highest overall persistence rates (63 percent) followed by
Hispanic (55 percent), White (54 percent), Black (43 percent), and American Indian
(42 percent) students.
On Time (Fall after Graduation) Delayed (Within 2 years) Number of Students
Persistence (any institution)
Retention (same institution)
Changed institutions
Persistence (any institution)
Retention (same institution)
Changed institutions
On Time Delayed
Overall 81% 70% 11% 50% 43% 7% 431,823 58,618
Prosperity Zone
North Central 84% 74% 11% 53% 46% 8% 105,971 13,284
Northeast 77% 66% 11% 45% 38% 7% 23,013 3,194
Northwest 80% 68% 12% 49% 43% 6% 26,328 3,294
Piedmont-Triad 81% 70% 11% 50% 43% 7% 75,551 10,466
Sandhills 76% 64% 12% 45% 38% 7% 36,813 6,183
Southeast 79% 67% 11% 49% 42% 7% 38,365 5,648
Southwest 82% 71% 12% 50% 43% 7% 100,866 13,321
Western 80% 68% 12% 49% 43% 6% 24,883 3,218
Sex
Female 83% 72% 12% 52% 44% 7% 240,112 30,631
Male 79% 68% 11% 48% 41% 7% 191,711 27,987
Race/Ethnicity
American Indian 71% 60% 11% 42% 38% 5% 4,940 970
Asian 90% 82% 8% 63% 57% 6% 13,455 1,266
Black 74% 62% 12% 43% 36% 7% 106,248 21,072
Hispanic 79% 70% 9% 55% 50% 5% 25,723 5,730
White 84% 73% 12% 54% 46% 8% 268,938 27,748
Note: Percentages may not add due to rounding. Numbers by prosperity zone and race/ethnicity do not sum to the overall total due to the exclusion of a small number of students who could not be classified in the above categories.
TABLE 1: PERSISTENCE AND RETENTION RATES BY DEMOGRAPHIC CHARACTERISTICS AND TIMING OF ENROLLMENT (2009-2016)
P-12 POSTSECONDARY WORKFORCE
POSTSECONDARY PERSISTENCE REPORT 10
Des
ign
by
Ad
rial
Des
igns
.co
m
• Asian students also had the highest retention rates (57 percent) followed by
Hispanic students (50 percent). Black students had the lowest retention rates
(36 percent) followed by American Indian students (38 percent).
• White students were the most likely to change institutions (8 percent). American
Indian and Hispanic students were the least likely to change institutions (5
percent for both groups).
ConclusionsPersistence to degree completion is a challenge for both
individual students and the institutions they are attending,
and overall patterns of persistence and retention can
amplify and exacerbate inequalities shown in college
access. Identifying patterns of college access and
persistence among North Carolina high school graduates
is critical to guiding intervention strategies.
The results presented in this brief are consistent with
past research completed using national samples, finding
similar patterns of persistence with respect to four-year
versus two-year, public versus private, academic readiness,
economic advantage, and demographic characteristics.12
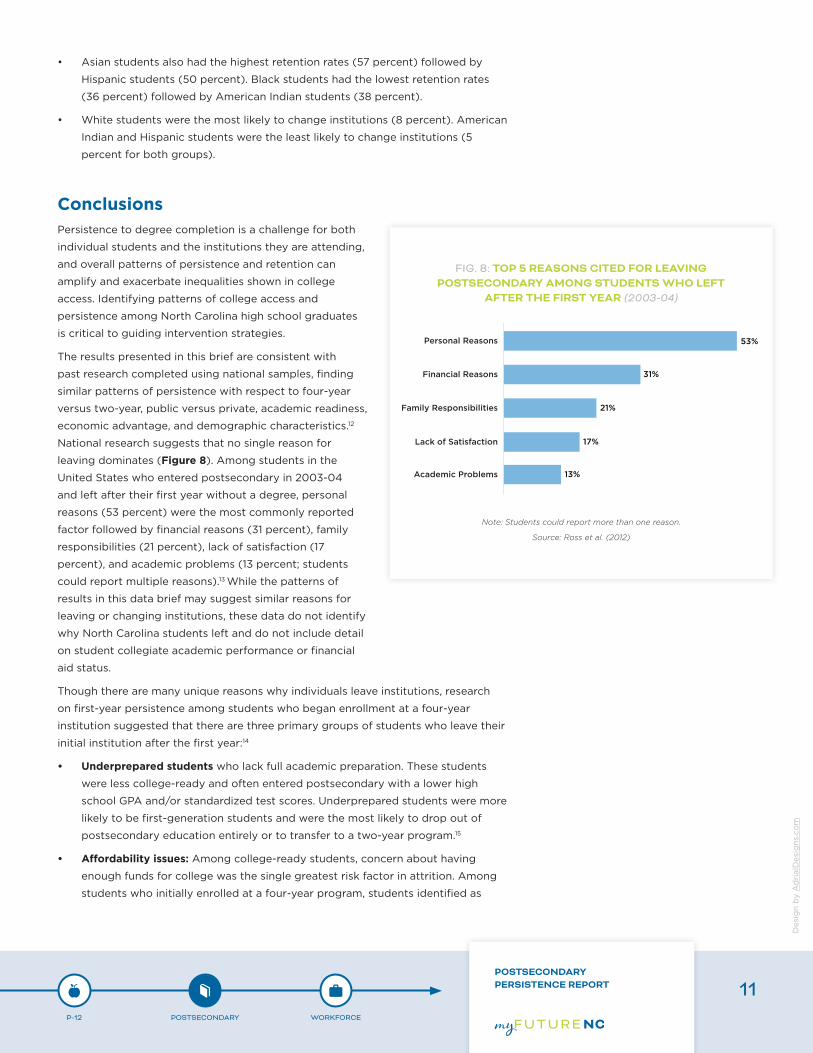
National research suggests that no single reason for
leaving dominates (Figure 8). Among students in the
United States who entered postsecondary in 2003-04
and left after their first year without a degree, personal
reasons (53 percent) were the most commonly reported
factor followed by financial reasons (31 percent), family
responsibilities (21 percent), lack of satisfaction (17
percent), and academic problems (13 percent; students
could report multiple reasons).13 While the patterns of
results in this data brief may suggest similar reasons for
leaving or changing institutions, these data do not identify
why North Carolina students left and do not include detail
on student collegiate academic performance or financial
aid status.
Though there are many unique reasons why individuals leave institutions, research
on first-year persistence among students who began enrollment at a four-year
institution suggested that there are three primary groups of students who leave their
initial institution after the first year:14
• Underprepared students who lack full academic preparation. These students
were less college-ready and often entered postsecondary with a lower high
school GPA and/or standardized test scores. Underprepared students were more
likely to be first-generation students and were the most likely to drop out of
postsecondary education entirely or to transfer to a two-year program.15
• Affordability issues: Among college-ready students, concern about having
enough funds for college was the single greatest risk factor in attrition. Among
students who initially enrolled at a four-year program, students identified as
FIG. 8: TOP 5 REASONS CITED FOR LEAVING POSTSECONDARY AMONG STUDENTS WHO LEFT
AFTER THE FIRST YEAR (2003-04)
Note: Students could report more than one reason.
Source: Ross et al. (2012)
P-12 POSTSECONDARY WORKFORCE
POSTSECONDARY PERSISTENCE REPORT 11
Des
ign
by
Ad
rial
Des
igns
.co
m
leaving their initial institution due to affordability issues were the least likely to drop out
and were the most likely to persist in their postsecondary education by transferring to a
lower-cost institution.
• “Unexpected Underperformers” were students who were academically prepared and
could afford college but then performed poorly. The educational trajectories of these
students were less predictable as the reasons for unexpectedly poor performance were
more variable than purely academic underpreparation or financial concerns and may
include factors such as a lack of non-cognitive college readiness skills, issues in mental or
physical health, interpersonal problems, or other personal or family reasons.
A combination of economic, demographic, and individual characteristics predict persistence
and attrition. As such, there is no single intervention that will fully address challenges of
student persistence. Identifying the likely reasons for leaving and addressing those reasons
means unique programs may be needed for different student populations. For example,
underprepared students may be better served by more comprehensive preparation and
transition programs. For students who are struggling financially, programs that help students
navigate their potential funding mechanisms and connect them with opportunities to learn
and earn (e.g. work study) may be more impactful.16 Interventions for students who leave for
“personal reasons” or who are at risk of being “unexpected underperformers” may be more
varied. These may be institutionally specific and will require more research to fully understand.
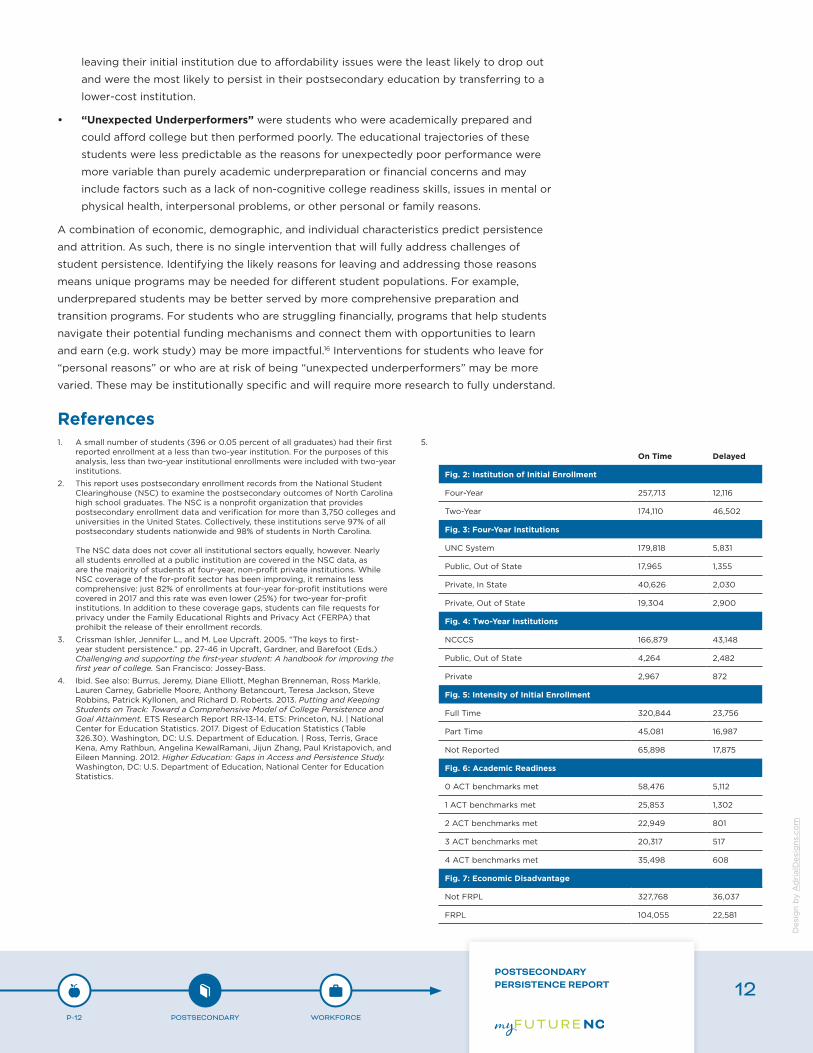
1. A small number of students (396 or 0.05 percent of all graduates) had their first reported enrollment at a less than two-year institution. For the purposes of this analysis, less than two-year institutional enrollments were included with two-year institutions.
2. This report uses postsecondary enrollment records from the National Student Clearinghouse (NSC) to examine the postsecondary outcomes of North Carolina high school graduates. The NSC is a nonprofit organization that provides postsecondary enrollment data and verification for more than 3,750 colleges and universities in the United States. Collectively, these institutions serve 97% of all postsecondary students nationwide and 98% of students in North Carolina. The NSC data does not cover all institutional sectors equally, however. Nearly all students enrolled at a public institution are covered in the NSC data, as are the majority of students at four-year, non-profit private institutions. While NSC coverage of the for-profit sector has been improving, it remains less comprehensive: just 82% of enrollments at four-year for-profit institutions were covered in 2017 and this rate was even lower (25%) for two-year for-profit institutions. In addition to these coverage gaps, students can file requests for privacy under the Family Educational Rights and Privacy Act (FERPA) that prohibit the release of their enrollment records.
3. Crissman Ishler, Jennifer L., and M. Lee Upcraft. 2005. “The keys to first-year student persistence.” pp. 27-46 in Upcraft, Gardner, and Barefoot (Eds.) Challenging and supporting the first-year student: A handbook for improving the first year of college. San Francisco: Jossey-Bass.
4. Ibid. See also: Burrus, Jeremy, Diane Elliott, Meghan Brenneman, Ross Markle, Lauren Carney, Gabrielle Moore, Anthony Betancourt, Teresa Jackson, Steve Robbins, Patrick Kyllonen, and Richard D. Roberts. 2013. Putting and Keeping Students on Track: Toward a Comprehensive Model of College Persistence and Goal Attainment. ETS Research Report RR-13-14. ETS: Princeton, NJ. | National Center for Education Statistics. 2017. Digest of Education Statistics (Table 326.30). Washington, DC: U.S. Department of Education. | Ross, Terris, Grace Kena, Amy Rathbun, Angelina KewalRamani, Jijun Zhang, Paul Kristapovich, and Eileen Manning. 2012. Higher Education: Gaps in Access and Persistence Study. Washington, DC: U.S. Department of Education, National Center for Education Statistics.
5. x
On Time Delayed
Fig. 2: Institution of Initial Enrollment
Four-Year 257,713 12,116
Two-Year 174,110 46,502
Fig. 3: Four-Year Institutions
UNC System 179,818 5,831
Public, Out of State 17,965 1,355
Private, In State 40,626 2,030
Private, Out of State 19,304 2,900
Fig. 4: Two-Year Institutions
NCCCS 166,879 43,148
Public, Out of State 4,264 2,482
Private 2,967 872
Fig. 5: Intensity of Initial Enrollment
Full Time 320,844 23,756
Part Time 45,081 16,987
Not Reported 65,898 17,875
Fig. 6: Academic Readiness
0 ACT benchmarks met 58,476 5,112
1 ACT benchmarks met 25,853 1,302
2 ACT benchmarks met 22,949 801
3 ACT benchmarks met 20,317 517
4 ACT benchmarks met 35,498 608
Fig. 7: Economic Disadvantage
Not FRPL 327,768 36,037
FRPL 104,055 22,581
References
P-12 POSTSECONDARY WORKFORCE
POSTSECONDARY PERSISTENCE REPORT 12
Des
ign
by
Ad
rial
Des
igns
.co
m
6. Students were classified as having an on-time enrollment if they were enrolled in a postsecondary institution in the Fall semester of their high school graduating year. Students were classified as having delayed enrollment if they were not enrolled in a postsecondary institution in the fall semester of their high school graduating year but were enrolled during a fall or spring semester within two years of their graduation. For the purposes of all analyses, certain enrollments were excluded from the evaluation: enrollments that began and ended between May 1st and August 31st (summer enrollments), enrollments shorter than 21 days (e.g., Maymesters and J-terms), and enrollments with a status of “Withdrawn,” “Leave of Absence,” or “Deceased.” For students with simultaneous enrollments at multiple institutions in the same 6-month period (January-June or July-December), enrollment intensity was based on the two terms with the highest enrollment status. Enrollment intensity was considered full-time if at least one term was full-time or three-quarters-time, or if both terms were half-time. Enrollment intensity was considered part-time if both terms were less-than-half-time, one was half-time and the other was less-than-half-time, or one was less-than-half-time and the other was missing. Students who completed a degree or certificate were excluded from the evaluation of persistence. Of the 431,823 students who enrolled in postsecondary on-time, 991 had completed a degree or certificate by the next year. Of the 58,618 students who delayed enrollment into postsecondary, 89 had received a degree or certificate by the next year.
7. 91% of graduates from 2014 to 2016 had scores for all four ACT benchmarks. College-readiness benchmark scores are 18 for the English subtest, 22 for Mathematics and Reading, and 23 for Science.
8. The ACT exam college-readiness benchmarks are established by ACT, Inc. and “represent the level of achievement required for students to have a 50% chance of obtaining a B or higher or about a 75% chance of earning a C or higher in corresponding credit-bearing first-year college courses.” (ACT, Inc. 2010. What Are ACT’s College Readiness Benchmarks?). ACT, Inc.’s College Readiness Benchmarks have been developed based on the actual performance of first-year college students. Through its Course Placement Service, the ACT has collected test score and course grade data on over 90,000 students across 98 two- and four-year institutions. These benchmark outcomes reflect the typical performance of a first-year college student. More information on ACT college readiness standards and benchmarks is available at https://www.act.org/content/act/en/college-and-career-readiness/standards.html.
On Time Delayed
Total Graduates with ACT Scores 163,093 8,340
0 ACT benchmarks met 58,476 5,112
1 ACT benchmark met 25,853 1,302
2 ACT benchmarks met 22,949 801
3 ACT benchmarks met 20,317 517
4 ACT benchmarks met 35,498 608
9. Among delayed enrollers, the persistence rate for those who met only one benchmark was slightly higher than that of those who met two (57.3% vs. 56.3%). This may be attributable to the types of institutions that these students chose to attend or due to smaller sample sizes of delayed enrollers in this analysis. Since 2015 and 2016 graduates have not completed the two-year period for delayed enrollment, delayed enrollments in academic preparedness analyses include only 2014 graduates (n=8,340).
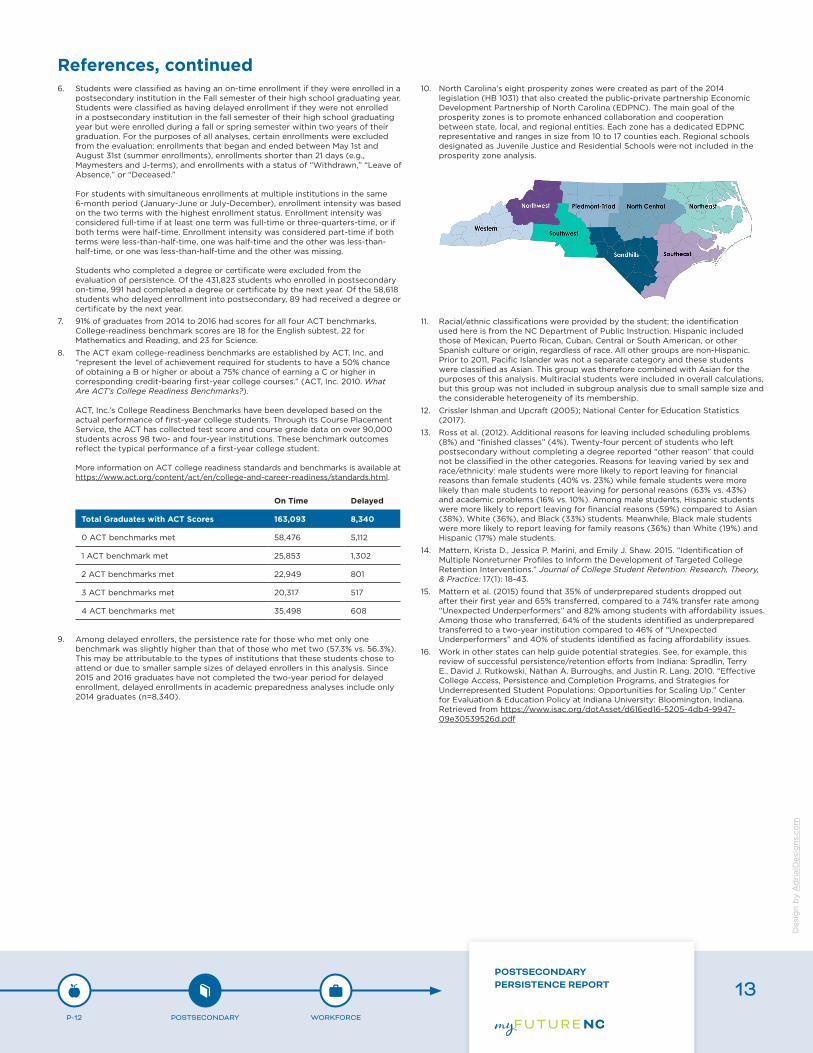
10. North Carolina’s eight prosperity zones were created as part of the 2014 legislation (HB 1031) that also created the public-private partnership Economic Development Partnership of North Carolina (EDPNC). The main goal of the prosperity zones is to promote enhanced collaboration and cooperation between state, local, and regional entities. Each zone has a dedicated EDPNC representative and ranges in size from 10 to 17 counties each. Regional schools designated as Juvenile Justice and Residential Schools were not included in the prosperity zone analysis.
11. Racial/ethnic classifications were provided by the student; the identification used here is from the NC Department of Public Instruction. Hispanic included those of Mexican, Puerto Rican, Cuban, Central or South American, or other Spanish culture or origin, regardless of race. All other groups are non-Hispanic. Prior to 2011, Pacific Islander was not a separate category and these students were classified as Asian. This group was therefore combined with Asian for the purposes of this analysis. Multiracial students were included in overall calculations, but this group was not included in subgroup analysis due to small sample size and the considerable heterogeneity of its membership.
12. Crissler Ishman and Upcraft (2005); National Center for Education Statistics (2017).
13. Ross et al. (2012). Additional reasons for leaving included scheduling problems (8%) and “finished classes” (4%). Twenty-four percent of students who left postsecondary without completing a degree reported “other reason” that could not be classified in the other categories. Reasons for leaving varied by sex and race/ethnicity: male students were more likely to report leaving for financial reasons than female students (40% vs. 23%) while female students were more likely than male students to report leaving for personal reasons (63% vs. 43%) and academic problems (16% vs. 10%). Among male students, Hispanic students were more likely to report leaving for financial reasons (59%) compared to Asian (38%), White (36%), and Black (33%) students. Meanwhile, Black male students were more likely to report leaving for family reasons (36%) than White (19%) and Hispanic (17%) male students.
14. Mattern, Krista D., Jessica P. Marini, and Emily J. Shaw. 2015. “Identification of Multiple Nonreturner Profiles to Inform the Development of Targeted College Retention Interventions.” Journal of College Student Retention: Research, Theory, & Practice: 17(1): 18-43.
15. Mattern et al. (2015) found that 35% of underprepared students dropped out after their first year and 65% transferred, compared to a 74% transfer rate among “Unexpected Underperformers” and 82% among students with affordability issues. Among those who transferred, 64% of the students identified as underprepared transferred to a two-year institution compared to 46% of “Unexpected Underperformers” and 40% of students identified as facing affordability issues.
16. Work in other states can help guide potential strategies. See, for example, this review of successful persistence/retention efforts from Indiana: Spradlin, Terry E., David J. Rutkowski, Nathan A. Burroughs, and Justin R. Lang. 2010. “Effective College Access, Persistence and Completion Programs, and Strategies for Underrepresented Student Populations: Opportunities for Scaling Up.” Center for Evaluation & Education Policy at Indiana University: Bloomington, Indiana. Retrieved from https://www.isac.org/dotAsset/d616ed16-5205-4db4-9947-09e30539526d.pdf
References, continued
P-12 POSTSECONDARY WORKFORCE
POSTSECONDARY PERSISTENCE REPORT 13