Embed Size (px)
Citation preview
N A S A C O N T R A C T O R
R E P O R T
7
POTASSIUM RANKINE CYCLE VAPOR CHAMBER (HEAT PIPE) RADIATOR STUDY
by Ellswo~th E. Gerrels and Robert E. Killen
Prepared by GENERAL ELECTRIC COMPANY
Philadelphia, Pa. 19 10 1
for Lewis Research Center
NATIONAL AERONAUTICS AND SPACE ADMINISTRATION WASHINGTON, D. C. SEPTEMBER' 1971
https://ntrs.nasa.gov/search.jsp?R=19720004957 2018-06-17T23:19:00+00:00Z

~ ~ ~ ~
1. Report No. 2. Government Accession No.
NASA CR-1866 ~~~~~
4. Title and Subtitle
POTASSIUM RANKINE CYCLE VAPOR CHAMBER (HEAT PIPE) RADIATOR STUDY
-~ .. ~ ~~
7. Author(s)
Ellsworth E. Gerrels and Robert E. Killen ___~ ~ - ." . ~~
9. Performing Organization Name and Address
General Electric Company Philadelphia, Pennsylvania 19101
- "" ;___.
2. Sponsoring Agency Name and Address
National Aeronautics and Space Administration Washington, D. C. 20546
___ ~" ~ ~
5. Supplementary Notes
3. Recipient's C a t a l o g No.
5. Report Date September 1971
6. Performing Organization Code
8. Performing Organization Report No.
GESP-7047 ~
10. Work Unit No.
11. Contract or Grant 'No.
NAS 3-10615 13. Type of Report and Period Covered
Contractor Report 14. Sponsoring Agency Code
~. - ___. . .
6. Abstract ~~
A structurally integrated vapor chamber fin (heat pipe) radiator is defined and evaluated as a potential candidate for rejecting waste heat from the potassium Rankine cycle powerplant. Several vapor chamber fin geometries, using stainless steel construction, are evaluated and an optimum is selected. A comparison is made with an operationally equivalent con- duction fin radiator. Both radiators employ NaK-78 in the primary coolant loop. In addi- tion, the Vapor Chamber Fin (VCF) radiator utilizes sodium in the vapor chambers. Pre- liminary designs are developed for the conduction fin and VCF concepts. Performance tests on a single vapor chamber were conducted to verify the VCF design. A comparison shows the conduction fin radiator easier to fabricate, but heavier in weight, particularly as meteoroid protection requirements become more stringent. While the analysis was performed assuming the potassium Rankine cycle powerplant, the results are equally ap- plicable to any system radiating heat to space in the 900' to 1400' F temperature range.
____ 17. Key Words (Suggested by Authoris)) 10. Distribution Statement
Nuclear space power system Unclassified - unlimited Rankine cycle Radiators Heat pipe
~ ~ ~~~
19. Security Classif. (of this report) %Security Classif. (of this page)
Unclassified Unclassified 230 $3.00
F o r Sale by the National Technical Information Service, Springfield, Virginia 22151

FOREWORD
The research descr ibed in th i s repor t was conducted by the General Electr ic Company under NASA contract NAS 3-10615. M r . J a m e s P. Couch of thz Lewis Research Center Space Power Sys tems Div is ion was the NASA Project Manager . The report was or iginal ly issued as Genera l E lec t r ic re- port GESP-7047.
iii

. _. - . . . .. . . " . . " .
r
TABLE OF CONTENTS
Section Page
1
2
3
4
5
INTRODUCTION . 1.1 Study objective . . . . . . . . . . . . . . . 1.2 Report Contents . . . . . . . . . . . . . . . SUMMARY . . . . . . . . . . . . . . . . . . 2 . 1 Introduction . . . . . . . . . . . . . . . . 2.2 Selection of Candidate Vapor Chamber Fin Geometries . . 2 . 3 Optimization of Candidate Concepts . . . . . . . . 2 . 4 Testing of Rectangular Vapor Chamber Fin Geometry . . 2 . 5 Vapor Chamber Fin Radiator Design . . . . . . . . 2 . 6 Conduction Fin Radiator Design . . . . . . . . . 2 . 7 Comparison of the Vapor Chamber and Conduction
Fin Radiators . . . . . . . . . . . . . . . 2 . 8 Conclusion . . . . . . . . . . . . . . . . RADIATOR DESIGN REQUIREMENTS . . . . . . . . . 3 . 1 General Discussion . . . . . . . . . . . . . 3-2 System Specification . . . . . . . . . . . . . 3-3 Meteoroid Criteria . . . . . . . . . . . . . 3-4 Structural Cri ter ia . . . . . . . . . . . . . 3-5 Operational Criteria . . . . . . . . . . . . . 3-6 Vehicle Integration . . . . . . . . . . . . . 3-7 Fabrication . . . . . . . . . . . . . . . . VAPOR CHAMBER CONCEPT DEVELOPMENT . . . . . . VAPOR CHAMBER ANALYSIS . . . . . . . . . . . . 5 . 1 Condenser Evaluation . . . . . . . . . . . .
5 . 1 . 1 Vapor Chamber Analytical Considerations . . . 5 . 1 . 2 Concept Parametric Analysis . . . . . . .
5 . 2 Vapor Chamber Fin Integration Evaluation . . . . . . 5 . 3 Vapor Chamber FinConcept/Radiator Structural Evaluation
5 . 3 . 1 General . . . . . . . . . . . . . . 5 . 3 . 2 Loads . . . . . . . . . . . . . . . 5 . 3 . 3 Assumptions . . . . . . . . . . . . . 5 . 3 . 4 Analysis . . . . . . . . . . . . . . 5 . 3 . 5 Summary of R.esults . . . . . . . . . .
1
1 3
4
4 6 7 8
1 2 12
1 2 15
17
17 17 20 22 23 23 24
25
28
28 30 43 77 86 86 86 87 90
101
I
V
Section
TABLE OF CONTENTS (Cont'd)
Page .
6
7
5.4 Fabrication Evaluation . . . . . . . . . . . . . 101 5.4.1 General . . . . . . . . . . . . . . . 101 5.4.2 Fabrication Techniques . . . . . . . . . . 103
5.5 Vapor Chamber Fin Design Conclusions . . . . . . . 109
VAPOR CHAMBER (HEAT PIPE) TEST PROGRAM . . . . . 113
6.1 Test Objectives and Requirements . . . . . . . 6.2 .1 Vapor Chamber Orientation . . . . . . 6.2.2 Test Vapor Chamber Design and Fabrication 6.2.3 Heat and Calorimeter Design and Fabrication 6.2.4 Test Unit Insulation . . . . . . . . . 6.2.5 Tilt Adjustment . . . . . . . . . . . 6.2.6 Test Unit Setup . . . . . . . . . .
6.3 Vapor Chamber Instrumentation . . . . . . . . 6.3.1 General . . . . . . . . . . . . . 6.3.2 Thermocouple Location . . . . . . . . 6.3.3 Thermocouple Attachment . . . . . . .
6.4 Vapor Chamber Test Assembly Evaluation . . . . 6.4.1 Heat Flux Measurement . . . . . . . 6.4.2 Temperature Drop (AT) Measurement . . .
6.5 Test Description and R.esults . . . . . . . . . 6.5.1 Calibration Test . . . . . . . . . . 6.5.2 Heat Flux and AT Measurements (Phase 2) . 6.5.3 Tilting Test (Phase 3) . . . . . . . . . 6.5.5 Additional Investigations of the Condensing
Temperature Drop . . . . . . . . . . . 6.5.6 Discussion of Tes t Results . . . . . . .
6.2 Test Approach . . . . . . . . . . . . . .
6.5.4 Limiting Heat Flux Test (Phase 4) . . . .
. . 113
. . 114 . . 114
. . 114 . . 118
. . 120
. . 123
. . 123
. . '127 . . 127 . . 128
. . 128
. . 131
. . 131
. . 137 . . 138 . e 138
. . 139
. . 147
. . 148
. . 148 . . 150
RADIATOR DESIGN. ANALYSIS AND FABRICATION . . . . . 154
7.1 General Discussion . . . . . . . . . . . . . . 154 7.2 C.onduction Fin Radiator . . . . . . . . . . . . 154
7.2.1 Conduction Fin Radiator Analysis . . . . . . 154 7.2.2 Conduction Fin Radiator Design . . . . . . . 164 7.2.3 Fabrication and Assembly . . . . . . . . . 168
7.3 Vapor Chamber Fin Radiator . . . . . . . . . . . 174 7.3.1 Vapor Chamber Fin Radiator Analysis . . . . . 174 7.3.2 Vapor Chamber Fin Radiator Design . . . . . 181 7.3.3 Fabrication and Assembly . . . . . . . . . 184
vi
TABLE OF CONTENTS (Cont'd)
Section
8
7.4 Startup Considerations . . . . . . . . . . . . . 192 7.4.1 General . . . . . . . . . . . . . . . 192 7.4.2 Type of Fluid in System . . . . . . . . . 193 7.4.3 Total Fluid Inventory . . . . . . . . . . 194 7.4.4 Fluid Location and Disbursement . . . . . . 196 7.4.5 System/Mission Considerations . . . . . . . 198
RADIATOR COMPARISON AND CONCLUSIONS . . . . . . . 199 8.1 General . . . . . . . . . . . . . . . . . . 199 8.2 Performance (Weight/Area) . . . . . . . . . . . 199 8.3 Fabrication Feasibility . . . . . . . . . . . . . 203 8.4 Required Development Effort . . . . . . . . . . . 203 8.5 Operational Comparison . . . . . . . . . . . . 204 8.6 Conclusions . . . . . . . . . . . . . . . . . . . . . 204
9 REFERENCES . . . . . . . . . . . . . . . . . . 207
APPENDIX A: NOMENCLATURE . . . . . . . . . . . . . . 209
APPENDIX B: TEST PLAN FOR VAPOR CHAMBER RADIATOR . . . . 212
vii

..
LIST OF ILLUSTRATIONS
Figure Page
1-1 1-2 I
2 -1 2 -2 2 -3 2 -4 2 -5 2 -6 2 -7 2 -8
3 -1 3 -2
4 -1 4 -2
5 -1 5 -2
5 -3
5 -4 5 -5 5 -6
5 -7
5 -8
5 -9 5-10 5-11 5-12 5-13 5 -14
Simplified Potassium Rankine Cycle . . . . . . . . . . . . Representative Vapor Chamber Fin Radiator Panel . . . . . . . Simplified Potassium Rankinecycle . . . . . . . . . . . . Vapor Chamber Concept Alternatives . . . . . . . . . . . Vapor Chamber Geometry Evaluation Summary . . . . . . . . Vapor Chamber Fin Test Schematic . . . . . . . . . . . . Vapor Chamber Fin Used in Test . . . . . . . . . . . . . . Vapor Chamber Fin Radiator Design . . . . . . . . . . . . Total Radiator Weight versus Area for Vapor Chamber and Conduction Fin Radiator Design . . . . . . . . . . . . . Conduction Fin Radiators . . . . . . . . . . . . . . . Advanced Rankine Power System (Nominal 300 kWe) . . . . . . Trend in Launch Vehicle Dynamic Loads . . . . . . . . . . Vapor Chamber Concept Alternatives . . . . . . . . . . . Concepts Selected for Further Investigation . . . . . . . . . Concept Parameters Evaluated . . . . . . . . . . . . . Relationship Between the Overall and Individual Survival Probabili t ies (as determined by the binomial distribution for 75 percent chamber survivability) . . . . . . . . . . . . . Relationship Between the Overall and Individual Survival Probability (as determined by the binomial distribution for 85 percent chamber survivability . . . . . . . . . . . . . Basic Heat Pipe . . . . . . . . . . . . . . . . . . . Heat Pipe Limitations . . . . . . . . . . . . . . . . . Required Armor Thickness versus Vapor Chamber . . Consensing Length at Various Chamber Diameters . . . . . . . Fin Efficiency versus Fin Length for Various Thickness Stainless Steel . . . . . . . . . . . . . . . . . . . . . Variation of Radiating Effectiveness with Fin Plate Length (Reference ) . . . . . . . . . . . . . . . . . . . Geometry 1 Specific Weight versus Fin Length (TF = 0.010 in.) . . . Geometry 1 Specific Weight versus Fin Length (TF = 0.020 in.) . . . Geometry 1 Specific Weight versus Fin Length (TF = 0.040 in.) . . . Geometry 1 Specific Weight versus Fin Length (Sodium) . . . . . Geometry 1 Specific Weight versus Fin Length (Cesium) . . . . . Geometry 1 Specific Weight versus Channel Width (Potassium) . .
2 2
4 7 9
1 0 11 13 14
16
18 23
26 27
29
35
36 37 38
45
46
46 49 50 51 52 53 55
viii

LIST OF ILLUSTRATIONS (Cont'd)
Figure Page
5-15 5 -16 5-17 5-18 5-19 5-20 5-2 1 5 -22 5-23 5 -24 5-25 5 -26 5-27
5-28
5-29
5-30
5-3 1
5 -32
5 -33
5 -34 5-35
5-36
5 -37
5-38
5-39 5-40 5-41 5 -42 5 -43
Geometrical Relationships Used for Geometry 2 I . . . . . . ~ . . . ~ . . 56 Geometry 2 Specific Weight versus Channel Width (Sodium). . . ~ . , . . . 57 Geometry 4 Specific Weight versus Fin Length (TF = 0.010 in.) . . . 58 Geometry 4 Specific Weight versus Fin Length (TF = 0.020 in.) . , . . . 59 Geometry 4 Specific Weight versus Fin Length (TF = 0.040 in.) . . . . . 60 Hexagonal Geometry Computer Code Model . . . . . . . . . . . . . 62 Geometry 3 Hexagonal Fin Temperature Profiles (Fin Length = 6 in.) . 64 Geometry 3 Hexagonal Fin Temperature Profiles (Fin Length = 12 in.) . 65 Geometry 3 Hexagonal Fin Temperature Profiles (Fin Length = 18 in.) . 66 Geometry 3 Effect on Specific Weight with Core Height of 0.250 inches . 68 Geometry 3 Effect on Specific Weight with Core Height of 0.50 inches . 69 Geometry 3 Effect on Specific Weight with Core Height of 0.750 inches . 70 Geometry 3 Effect on Specific Weight with Facing Thickness of 0.010 inches a . . . . . . . " . . . . . . . . . . . . 71 Geometry 3 Effect on Specific Weight with Facing Thickness of 0.020 inches . . . . . . . . . . . . . . . . . . . . 7 2 Geometry 3 Effect on Specific Weight with Facing Thickness of 0.010 inches and Core Height of 0.5 inches . . . . . . . . . . 73 Geometry 3 Effect on Specific Weight with Facing Thickness of 0.020 inches and Core Height of 0.5 inches . . . . . . . . . . 74 Geometry 3 Minimum Weight Hexagonal Fins for Core Height of 0.25 and 0.50 inches. . . . . . . . . . . . . . . . . . 75 Axial Vapor Temperature Drop for Hexagonal Configuration with Holes . . . . . . . . . . . . . . . . . . . . . 76 P r imary Duct Concepts Heat Transfer-Both Sides (Penetrating and Nonpenetrating) . . . . . . . . . . . . . . . . . . 78 P r imary Duct Concepts Heat Transfer-One Side (Nonpenetrating) . . . 79 Flow Chart for Computer Program to Evaluate Primary Fluid Duct System Weight Penalty . . . . . . . . . . . . . . . . . 80 Effect of Flow Velocity and Variable Condensing Length on P r imary Duct Weight . . . . . . . . . . . . . . . . . 82 Variation of Primary Fluid Duct Weight as a Function of Duct Width and Vapor Chamber Length . . . . . . . . . . . . . 82 Radiator Weight as a Function of Vapor Chamber Fin Length and P r imary Duct Width . . . . . . . . . . . . . . . . 83 Variation of Radiator Weight with Condensing Length (Geometry 1) . . 83 Vapor Chamber Fin Concepts. . . . . . . . . . . . . . . 86 Aerodynamic Loads Imposed by Two Stage Saturn V . . . . . . . 88 Acceleration Loads Imposed by Two Stage Saturn V . . . . . . . 89 Equivalent Axial Load-Saturn V Launch Vehicle (Two Stage) . . . . 89
ix

LIST OF ILLUSTRATIONS (Cont'd)
Figure Page
5 -44
5-45 5 -46 5-47
5-48 5 -49 5-50 5-51 5-52 5-53 5 -54 5-55 5-56 5-57 5-58 5-59
6 -1 6 -2 6 -3 6 -4 6 -5 6 -6 6 -7 6 -8 6 -9 6-10 6 -11 6 -12 6 -13 6 -14 6-15 6 -16 6 -17 6 -18 6-19 6 -20 6-21 6 -22
Mode Shapes for Panel and General Instability of Stiffened Cylinders in Bending . . . . . . . . . . . . . . . Local Failure Modes . . . . . . . . . . . . . . . Allowable Load on Tubes . . . . . . . . . . . . . . Fin Crit ical Buckling Stress versus Panel Thickness Length and Size . . . . . . . . . . . . . . . . Intercell Buckling Stress versus Facing Thickness and Cell Size Equivalent Load to Cause Intercell Buckling . . . . . . . Stainless Steel Honeycomb Core Density . . . . . . . . . Face Sheet Loading . . . . . . . . . . . . . . . . Fabrication Processes for Vapor Chamber Geometries . . . Geometry 1 Fabrication Techniques . . . . . . . . . . Stress Relationships of Radiator Panel Face Sheets . . . . .
Geometry 2 Fabrication Techniques . . . . . . . . . . Geometry 3 Fabrication Techniques . . . . . . . . . . Geometry 4 Fabrication Techniques . . . . . . . . . . Vapor Chamber Geometry Evaluation Summary . . . . . . Fluid Comparison Finned Cylinder Geometry 1 . . . . . .
. . 91
. . 94
. . 95
. . 95
. . 96
. . 97
. . 98
. 99 . 100 * 104
107 . 107 108 108 110 112
Vapor Chamber Thermal Orientation on Spacecraft . . . . . . . 115 Vapor Chamber Test Orientation . . . . . . . . . . . . . 115 Vapor Chamber (Heat Pipe) Design . . . . . . . . . . . . 116 Disassembled Vapor Chamber (Heat Pipe) . . . . . . . . . . 117 Close-up View of Vapor Chamber Wick . . . . . . . . . . . 117 Assembled Vapor Chamber . . . . . . . . . . . . . . . 118 Uniside Electron Bombardment Heater . . . . . . . . . . . 119 Calorimeter . . . . . . . . . . . . . . . . . . . . 122 Unassembled Test Block Hardware . . . . . . . . . . . . 122 Multifoil Insulation Around Vapor Chamber . . . . . . . . . . 123 Assembled Insulation Test Block on Tilt Stand . . . . . . . . 124 System Block Diagram Vapor Chamber (Heat Pipe) Test . . . . . 125 Vapor Chamber Test Setup . . . . . . . . . . . . . . . 126 Thermocouple Calibration . . . . . . . . . . . . . . . 18 Thermocouple Locations . . . . . . . . . . . . . . . . 129 Arrangement of Thermocouple 1 and Heat Input Surface (to Scale) . . 130
Thermocouple Test Configuration . . . . . . . . . . . . . 131
Insulation Block (1.50 in.) Temperature Distribution . . . . . . 134 Temperature Data for Heat Flux versus AT Tes ts . . . . . . . 141 Startup Data from VCF No . 2 . . . . . . . . . . . . . . 142
Thermocouple Attachment . . . . . . . . . . . . . . . 130
Insulation Block (1.90 in.) Temperature Distribution . . . . . . 134
X

I JST OF ILLUSTRATIONS (Con
Page
6-23 6 -24
6 -25
6 -26
6 -27
6-28 6 -29
6 -30 6-31 6 -32 6 -33
7 -1 7 -2 7 -3 7 -4
7 -5 7 -6 7 -7 7 -8 7 -9 7-10 7-1 7 7-12 7-1 3 7 -14 7-15 7-16 7-17 7-18
7-19
7 -20
Vapor Pressure of Sodium . . . . . . . . . . . . . . . . 142 Evaporative and Vapor Temperature Drop as a Function of Evaporative Heat Flux . . . . . . . . . . . . . . . . . 143 Sun1 of Evaporative and Vapor Temperature Drops as a Function of Evaporator Temperature . . . . . . . . . . . . . . . 143 Axial Vapor Temperature Drop as a Function of Evaporator Temperature . . . . . . . . . . . . . . . . . . . . 145 Maximum Axial Vapor Velocity and Vapor Temperature Drop with Respect to Evaporator Heat Flux . . . . . . . . . . . . 145
Comparison of Calculated Interfacial Resistance with Observed Thermal Resistance . . . . . . . . . . . . . . . . . . 148
Condenser Temperature Drop versus Evaporator Temperature . . . 145
Temperature Data for Ti l t Test (10 degrees) . . . . . . . . . . 149 Deformation of Heat Pipe After Limiting Heat Flux Tes t . . . . . . 150 Temperature Data for Limiting Heat Flux Tes t . . . . . . . . . 151 Condenser Test Results of VCF No . 2 . . . . . . . . . . . . 152
Offset Fin T L ~ C Geometry . . . . . . . . . . . . . . . . 155 Header/Flow Tube Orientation . . . . . . . . . . . . . . 156 Fluid Look Configuration . . . . . . . . . . . . . . . . 157 Conduction Fin Radiator System Weight versus Persent Copper
Conducf.ion Fin Radiator System Weight versus Heat Rejection Area . . 159 Conduction Fin Radiator Weight/Area Relationship (P .. 0.990) . . . 160 Conduction Fin Radiator Weight/Area Relationship (Po - . 0.999) . . 161 Radiator SJ'stern Weight versus Heat Rejection Area ( y . 2.62) . . . . 161 Conducl.jon Fin Radiator Design Layout . . . . . . . . . . . 166 Conduction Fin Radiator Design Details . . . . . . . . . . . 167 Flow Tube/Fin Assen~bly (Step 1) . . . . . . . . . . . . . 170 Conduction Fin Panel Assembly (Step 2 ) . . . . . . . . . . . 170 Assembly of Z Rings and Mating Rings on Fixture (Step 3) . . . . . 171 Radiator Bay Assembly (Steps 4 and 5) . . . . . . . . . . . 172 Mating of Upper and Lower Bays (Step 7) . . . . . . . . . . . 173 Header, Primary Duct: Vapor Chamber orientation . . . . . . . 175 Vapor Chamber Fin Radiator Optimization Results . . . . . . . 176 Effect of Extended Surfaces in Primary Fluid Duct on Vapor Chamber Fin Radiator Weight . . . . . . . . . . . . . . . 178 Vapor Chamber Fin Radiator Weight/Arca with Optimum Xumher of P r imary Duct Fins . . . . . . . . . . . . . . . . . 178 Vapor Chamber Fin Radiator Weights Including Structure . . . . . 179
in Fins . . . . . . . . . . . . . . . . . . . . . . 159
0
xi
LIST OF ILLUSTRATIONS (Cont 'd)
Figure
7-21 7 -22 7 -23 7 -24 7 -25 7 -26 7 -27 7 -28 7 -29 7-30
7 -31
8 -1
Vapor Chamber Radiator Design Layout . . . . . . . . . . . 182 Vapor Chamber Radiator Design Details . . . . . . . . . . . 183 Primary Coolant Duct Fabrication and Assembly (Step 1) . . . . . 185 Vapor Chamber Panel Subassembly . Alternative 1 (Step 2) . . . . 185 Vapor Chamber Panel Subassembly . Alternative 2 (Step 2) . . . 186 Vapor Chamber Panel Subassembly . Alternative 2 (Step 3) . . . . 187 Panel Assembly (Step 4) . . . . . . . . . . . . . . . . 190 Final Assembly (Step 5 and 6) . . . . . . . . . . . . . . 191 Ascent Temperature of Outer Skin . . . . . . . . . . . . 194 Effect of R.adiator Surface Properties on Effective Sink Temperature for 100 n.m. Earth Orbit . . . . . . . . . . . . . . . 195 Vapor Chamber Fin Radiator in Standby Condition . . . . . . . 197
Total Radiator Weight versus area for Vapor Chamber and Conduction Fin Radiators . . . . . . . . . . . . . . . 200
xii
SECTION 1
INTRODUCTION
This study was performed by the General Electric Space Division's Isotope Power Systems
Operation in partial fulfillment of Contract NAS3-10615, Vapor Chamber Radiator
directed by the NASA Lewis Research Center. The major emphasis of the program was
directed towards the development of a vapor chamber fin (heat pipe) radiator for appli-
cation in the potassium Rankine cycle.
The heat rejection system for large unmanned nuclear powerplants constitutes a significant
portion of the overall weight and area of the system. In addition, definite advantages exist
in integrating the radiator design with the launch vehicle. These factors necessitate a
detailed analysis of the radiator system s o as to achieve an attractive power system size
and weight.
1.1 STUDY OBJECTIVE
The primary purpose of this study was to assess the incentives for developing the Vapor
Chamber Fin (VCF) radiator for the potassium Rankine cycle. The alternative is the use
of a conduction fin radiator which is simpler in design and operational characteristics.
The potassium Rankine cycle space powerplant, under development at the Lewis Research
Center, uses an indirect heat rejection process with a heat rejection rate of 1500 kW.
A heat exchanger, shown in Figure 1-1, transfers waste heat from the power conversion
loop to the primary coolant. The primary coolant is circulated through the main radiator
where waste heat is rejected.
The present configuration visualized for the main radiator is an array of tubes through
which coolant flows and to which are attached solid, conducting fins. The vapor chamber
fin concept, under investigation in this study, operates in a different manner. Primary
coolant enters the fluid passages and transfers heat to the vapor chamber evaporator
sections by convection and conduction. A s the evaporator increases in temperature,
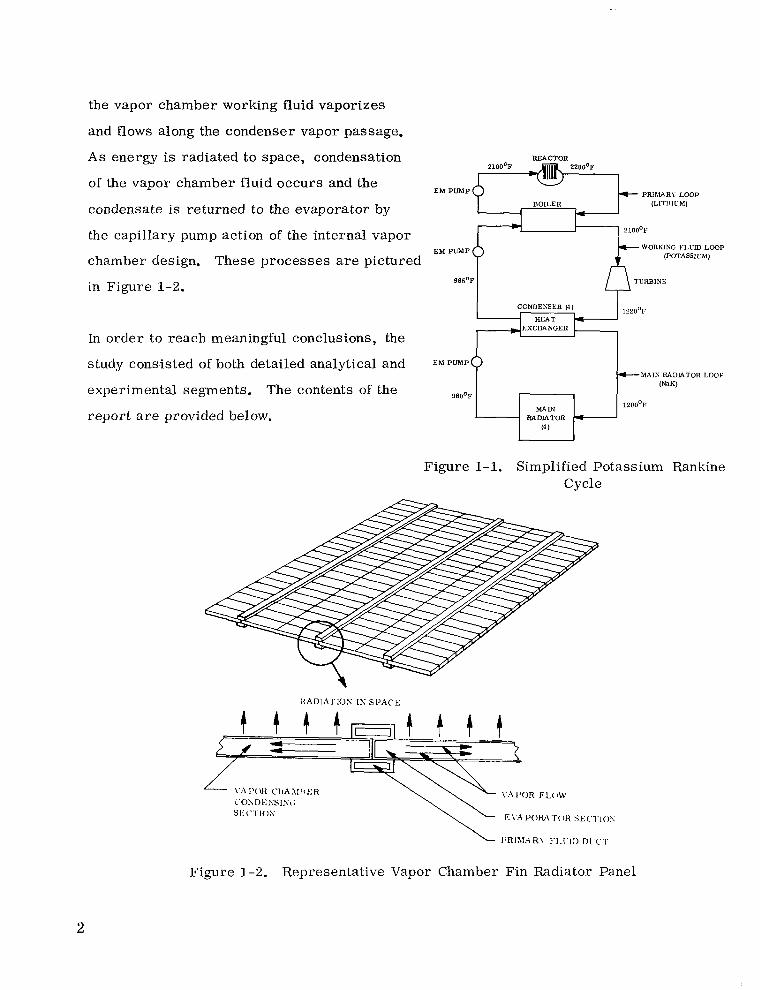
the vapor chamber working fluid vaporizes
and flows along the condenser vapor passage.
A s energy is radiated to space, condensation REACTOR
of the vapor chamber fluid occurs and the ~ ZlOO'F 2200°F ~
EM PUMP PRlhLARY LOOP
condensate is returned to the evaporator by
the capillary pump action of the internal vapor
chamber design. These processes are pictured
BOILER (LITHIUM)
E M PUMP WORKING FLUID LOOP (PUTASSICM)
in Figure 1-2.
In order to reach meaningful conclusions, the
study consisted of both detailed analytical and
experimental segments. The contents of the
report are provided below.
985'F TURBINE
CONLIENSER (4)
HEAT EXCHANGER
1220°F
EM PUMP
" A I N RADIATOR LOOP (NaK)
980°F
hlAm
(4 )
1200%
RADIATOR C=
Figure 1-1. Simplified Potassium Rankine Cycle
Figure 1-2. Representative Vapor Chamber Fin Radiator Panel
2

1 . 2 REPORT CONTENTS
Section 2 of this report contains a summary of the work performed, results obtained, and
conclusions to be made.
Radiator and potassium Rankine cycle powerplant system specifications submitted by NASA
Lewis were used as a design criteria. Design requirements used for the conduction fin and
vapor chamber fin radiators are contained in Section 3.
Section 4 describes the various vapor chamber fin concepts considered for the radiator and
identifies four basic geometries selected for further evaluation.
The thermal, integration, structural and fabrication evaluation of the four selected geome-
t r ies is contained in Section 5. Conclusions and a selection of the preferred vapor chamber
geometry are made.
Section 6 presents the vapor chamber test program performed on the selected geometry. A
test description, test data and conclusions are provided.
The preliminary vapor chamber fin and comparable conduction fin radiator design are pre-
sented in Section 7. Weight, area, performance and fabrication comparisons are made.
The overall study evaluation of results and conclusions are contained in Section 8.
References are tabulated in order of appearance in Section 9. A list of numerical terms
is included in Appendix A. The vapor chamber test plan followed in the program is included
in Appendix B.
3

SECTION 2
SUMMARY
2 . 1 INTRODUCTION
The purpose of this study was to identify an optimum vapor chamber fin (heat pipe) radiator
for the potassium Rankine cycle. It was anticipated that this approach would result in sig-
nificant weight and area savings over the conduction fin radiator presently considered for
this application.
The specifications on which the radiator analyses and final design are based were provided
by NASA. These ground rules, listed in Table 2-1, reflect the current definition of the
potassium Rankine cycle operating conditions for an unmanned mission.
The reference potassium Rankine cycle consists of three fluid loops; a simplified cycle
diagram is shown in Figure 2-1. Liquid NaK (78 wt %K) condenses the potassium vapor
exiting from the turbine in a heat exchanger and subsequently rejects the waste heat to
space in the primary radiator. In this in-
vestigation the radiator was also designed to REA CTOR
provide the main structural support for the
power system during launch. Additional
system radiators for the shield, pumps and
electrical equipment were not a prime con- EM PUMP
sideration in this analysis. 985'F
EM PUMP
BOILER f PRIMARY LOOP
(LITHIUM)
+WORKING F L U m LOOP (POTASSIUM)
CONDENSER f i) 122O'F
This study consisted of both analytical and
experimental efforts. The program was EM PUMP
divided in the following manner: I 980°F 1 I
1. Selection of candidate vapor chamber fin geometries
d l
e h M I N RADIATOR LOOP (NaK)
1200°F
2 . Optimization of each candidate vapor Figure 2-1. Simplified Potassium chamber fin and working fluid Rankine Cycle
4

Table 2-1. Specifications for the Potassium Rankine Radiator System (Unmanned) ~ . ~ ~~~~~~ __ ~ ~- -. . ~
Heat Rejection Rate (initial)
Radiator Fluid
Fluid Inlet Temperature
Fluid Outlet Temperature
Redundancy
Heat Rejection Rate (end-of-life)
Radiator Meteoroid Survival Probability
Radiator Lifetime
Materials
Radiator Sink Temperatures
Launch Vehicle
1536 kWt
NaK - 78
1200°F
980°F
4 panel groups 3 survive
75% of initial
0.99 0.999
20,000 hours 5 years
Stainless steel tube and armor; stainless steel clad copper o r stainless steel fins; iron titanate coating.
300nm equatorial orbit; radiator axis parallel to earth's surface; sun at zenith.
2-stage Saturn V (10 degree half cone angle)
15,000 pounds on 10 degree half cone angle ~ ..
5
3. Selection of optimum vapor chamber fin and working fluid
4. Testing of vapor chamber fin concept
5. Design and optimization of a vapor chamber fin radiator
6 . Design and optimization of a conventional conduction fin radiator
7. Comparison between a vapor chamber fin and a conduction fin radiator.
Each of these tasks are summarized in the following paragraphs.
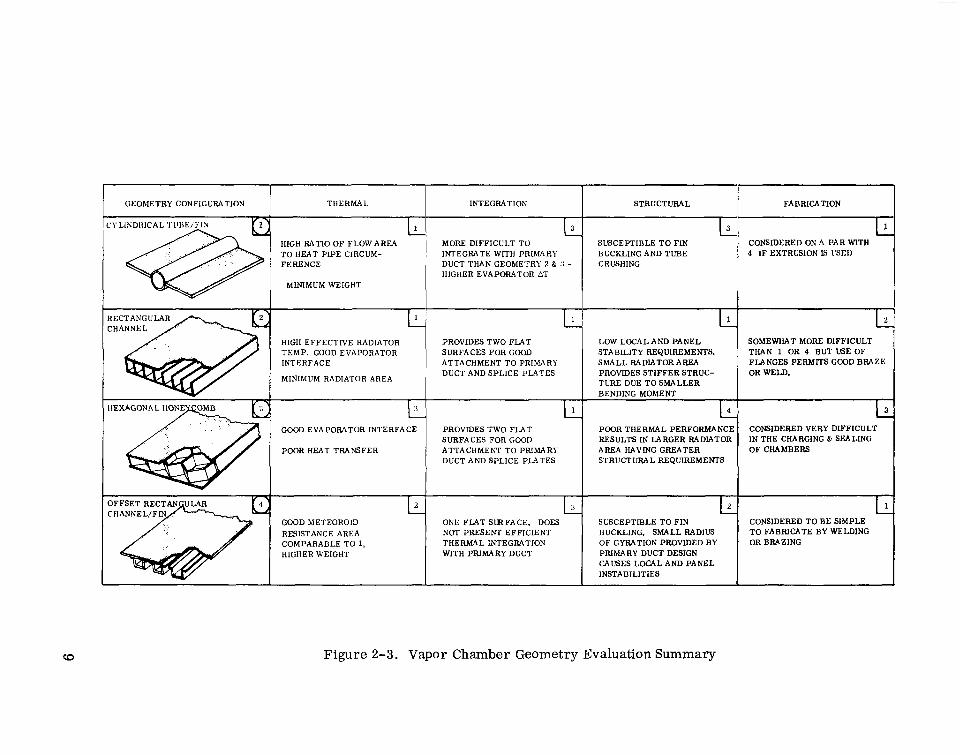
2 . 2 SELECTION O F CANDIDATE VAPOR CHAMBER FIN GEOMETRIES
The intent of this task was to define a number of attractive vapor chamber fin concepts
from which an optimum configuration could be selected. This initial screening was
primarily qualitative in nature.
Thermal efficiency, structural rigidity, sensitivity to meteoroid damage, heat pipe hy-
draulic considerations and fabricability were among the main factors governing the selec-
tion of four candidate designs. These are shown in Figure 2-2 in addition to other concepts
which were reviewed.
Geometry 1 was selected because of the thermal and hydraulic efficiency offered by the
cylindrical design.. The presence of the conduction fin, separating the chambers, added
a degree of flexibility to this design.
The rectangular cross section geometry was chosen as a candidate because it appeared to
offer a sound structure having reasonable fabrication possibilities. A t the same time,
this concept would possess acceptable thermal and hydraulic characteristics.
The hexagonal honeycomb configuration was chosen solely for its load carrying capability.
Each hexagon is pictured as operating as a separate vapor chamber which transfers energy
to adjoining vapor chambers by the condensation process. The magnitude of the thermal
6

I
disadvantage presented by the interior walls could not be easily assessed without the support
of a detailed analytical investigation.
Geometry 4 is,easily fabricated and thermally efficient. The unknown quantity in this
particular design (and Geometry 1) was the structural problems associated with a Large
thin sheet area.
2 . 3 OPTIMIZATION OF CANDIDATE CONCEPTS
The four concepts described in the preceding paragraph were examined parametrically
to assess the optimum geometric values for each design. The evaluation was based on
pounds of radiator per kilowatt of heat rejected. This optimization included the effects of
the primary fluid ducts and vehicle structural considerations as well as the more obvious
thermal, meteoroid protection and fluid flow requirements.
"" - .- .- -
3111nIc
The optimization procedure used a computer program to calculate required wick thickness,
temperature distributions and heat rejection rates. Three working fluids were considered:
cesium, potassium and sodium.
Geometry 2, the rectangular vapor chamber fin concept, was chosen as the most attractive
concept. This decision was based on the low radiator system weight obtainable while work-
ing within the framework of reasonable fabrication techniques. A summary of the geometry
evaluation is shown in Figure 2-3.
Sodium demonstrated superiority over cesium and potassium primarily due to i ts high sur-
face tension and latent heat of vaporization. Cesium was found to constitute a poor fluid
choice for this application (900 - 1200 F range). 0 0
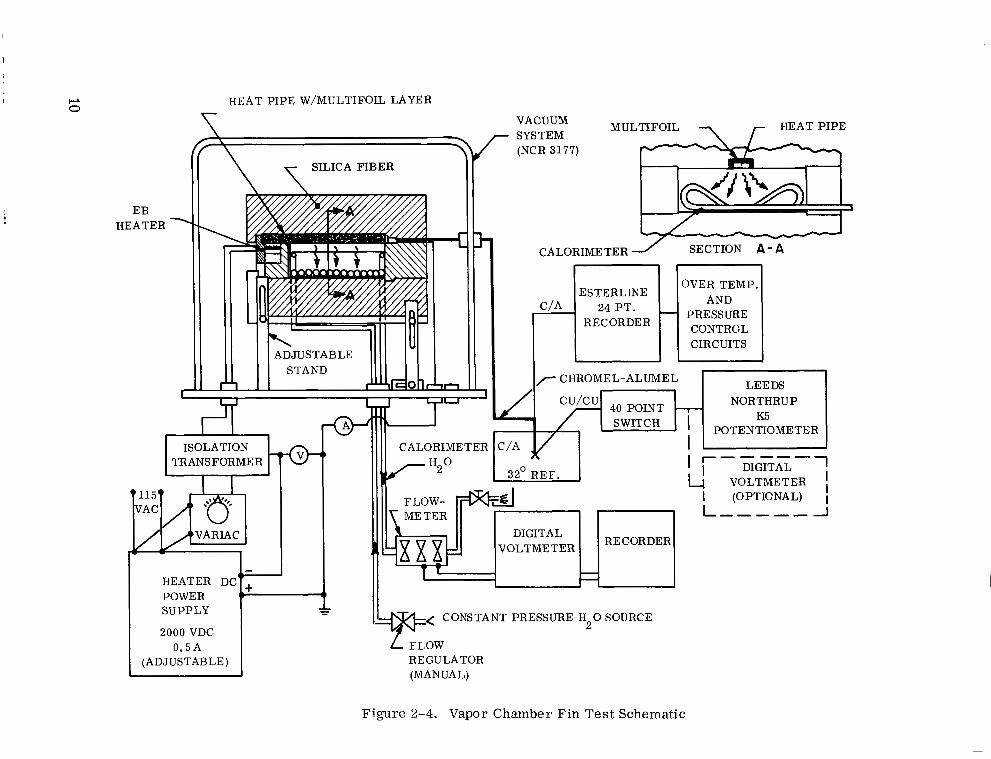
2.4 TESTING OF THE RECTANGULAR VAPOR CHAMBER F I N GEOMETRY
The objective of this portion of the program was to obtain accurate operational data on
the vapor chamber fin design defined by the optimization procedure. A single vapor
chamber fin, which represented the basic building block of a panel, was fabricated. Using
sodium as the working fluid, with a composite wick design, tests were conducted between
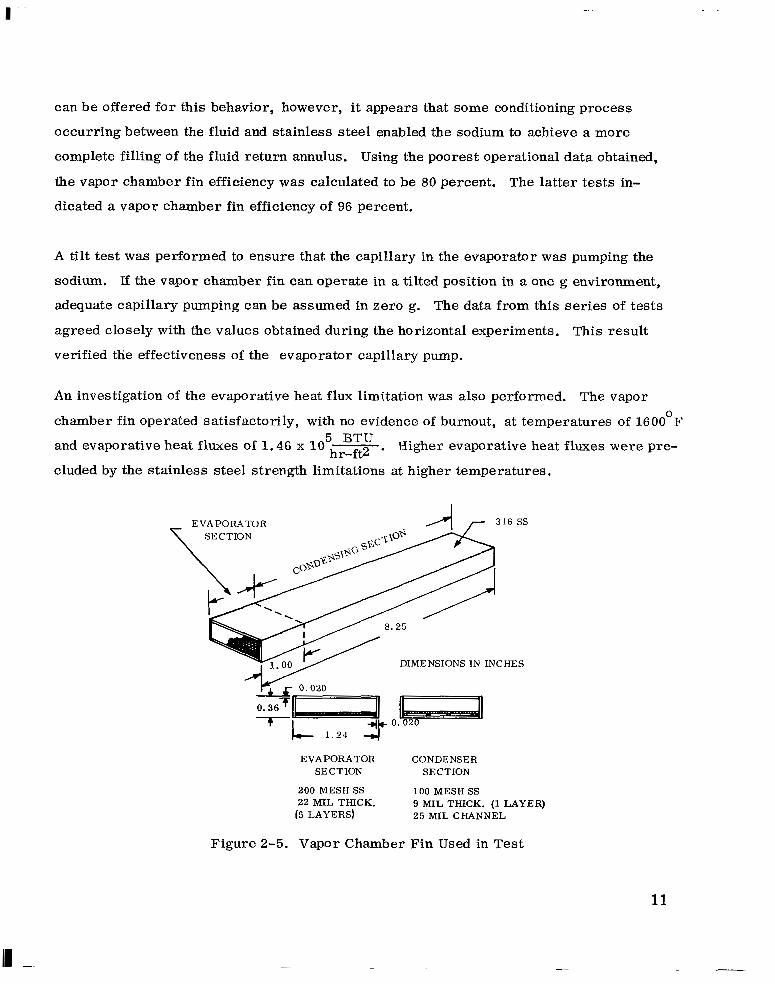
825 and 1600 F. The vapor chamber performed satisfactorily in this regime. The
test setup and vapor chamber design employed is shown in Figures 2-4 and 2-5.
0 0
The observed evaporative and axial vapor temperature drops agreed reasonably well with
predicted values.
The overall condensing temperature drop existing between the condenser vapor space and
heat rejection surface exhibited values substantially higher than predicted by theory.
Subsequent testing with a second vapor chamber showed this temperature drop to be time
dependent. Using the same test facility and identical instrumentation, the condensing AT
decreased from 54 to18 Fa t 1300 F over a 1 0 week period. No positive explanation 0 0 0
8
GEOhlETRY CONFIGllRATION
OFFSET REC
i THERMAL Li INTEGRATION Li STRUCTURAL Li FABRICATION ~
HItiH RATIO OF FLOW AREA MORE DIFFICULT TO SUSCEPTIBLE TO FIN CONSIDERED ON A PAR WITH TO HEAT PIPE CIRCUM- INTEGRATE WITH PRIMARY UUCKLING AND TUBE 4 IF EXTRUSION LS I'SKI) FERENCE DUCT THAN GEOMETRY 2 82 :J - 1 CRUSHING
MINIMUM WEIGHT HIGHER EVAPORATOR AT
HIGH EFFECTIVE RADIATOR TEMP. GOOD EVAPORATOR INTERFACE
MINIMUM RADIATOR AREA
I
GOOD EVAPORATOR INTERFACE
POOR HEAT TRANSFER
lii PROVIDES TWO FLAT
ATTACHMENT TO PRIMARY SURFACES FOR GOOD
DUCT AND SPLICE PLATES
PROVIDES TWO FLAT SURFACES FOR GOOD ATTACHMENT TO PRIMARY DUCT AND SPLICE PLATES
LOW LOCAL AND PANEL STABILITY REQUIREMEWTS. SMALL RADIATORAREA
TURE DUE TO SMALLER PROVIDES STIFFER STRUC-
BENDING MOMENT I
I2 POOR THERMAL PERFORMANCE
AREA HAVING GREATER RESULTS IN LARGER RADIATOR
STRUCTURAL REQUIREMENTS
COOD METEOROID RESISTANCE AREA COMPARABLE TO 1, HIGHER WEIGHT
ONE FLAT SIRFACE. DOES NOT PRESENT EFFICIENT THERMAL INTEGRATION WITH PRIMARY DUCT
SUSCEPTIBLE TO FIN DUCKLING. SMALL RADIUS OF GYRATION PROVIDED BY PRIMARY DUCT DESIGN
INSTABILITIES CAUSES LOCAL AND PANEL
f SOMEWHAT MORE DIFFICULT THAN 1 OR 4 BUT USE OF FIANCES PERMlTS GOOD BRAZE OR WELD.
IN THE CHARGING & SEALING CONSIDERED VERY DIFFICULT
OF CHAMBERS
T O FABRICATE BY WELDING CONSIDERED TO BE SIMPLE
OR BRAZING
Figure 2-3. Vapor Chamber Geometry Evaluation Summary
11 \ \ SILICA FIBER
E B HEATER
HEAT PIPE W/MULTIFOIL LAYER
VACUUM SYSTEM
MULTIFOIL 7 r HEAT PIPE
7 CHROMEL-ALUMEL LEEDS NORTHRUP I
I 11 I I Cu/cu
I K5 40 POINT
W ' POTENTIOMETER CALORIMETER C/A I
4 ) ,/- I I""" DIGITAL 1 VOLTMETER , 32' R E F . I
L"""l FLOW- +%Ed I (OPTIONAL) I
DIGITAL VOLTMETER RECORDER
- - * - - -
H
ISOLATION TRANSFORMER 0-
POWER su PPLY
2000 VDC 0.5A
(ADJUSTABLE)
CALORIMETER SECTION A - A -n ESTERLINE
24 PT. RECORDER
OVER TEMP.
PRESSURE CONTRCL CIRCUITS
* CONSTANT PRESSURE H 2 0 SOURCE
L FLOW REGULATOR (MANUAL)
Figure 2-4. Vapor Chamber Fin Test Schematic
I
can be offered for this behavior, however, it appears that some conditioning process
occurring between the fluid and stainless steel enabled the sodium to achieve a more
complete filling of the fluid return annulus. Using the poorest operational data obtained,
the vapor chamber fin efficiency was calculated to be 80 percent. The latter tests in-
dicated a vapor chamber fin efficiency of 96 percent.
A tilt test was performed to ensure that the capillary in the evaporator was pumping the
sodium. If the vapor chamber fin can operate in a tilted position in a one g environment,
adequate capillary pumping can be assumed in zero g. The data from this series of tests
agreed closely with the values obtained during the horizontal experiments. This result
verified the effectiveness of the evaporator capillary pump.
An investigation of the evaporative heat flux limitation was also performed. The vapor
chamber fin operated satisfactorily, with no evidence of burnout, at temperatures of 1600 F
and evaporative heat fluxes of 1.46 x 10 hx. Higher evaporative heat fluxes were pre-
cluded by the stainless steel strength limitations at higher temperatures.
0
5 BTU
EVAPORATOR 7 316 SS
v o . 020
o . 3 6 f j “L 1.24 3 O . OZO
EVAPORATOR CONDENSER SECTION SECTION
200 MESH S S 100 MESH SS 22 MIL THICK. 9 MIL THICK. (1 LAYER)
(5 LAYERS) 2 5 MIL CHANNEL
Figure 2-5. Vapor Chamber Fin Used in Test
11
2 . 5 VAPOR CHAMBER FIN RADIATOR DESIGN
The vapor chamber fin radiator design was optimized from a system standpoint by a large
scale computer code especially designed for this purpose. Using the rectangular channel
vapor chamber fin geometry, sodium working fluid and stainless steel construction, a series
of minimum weight radiators was designed for meteoroid survival probabilities of 0.99 and
0.999 over lifetimes up to five years.
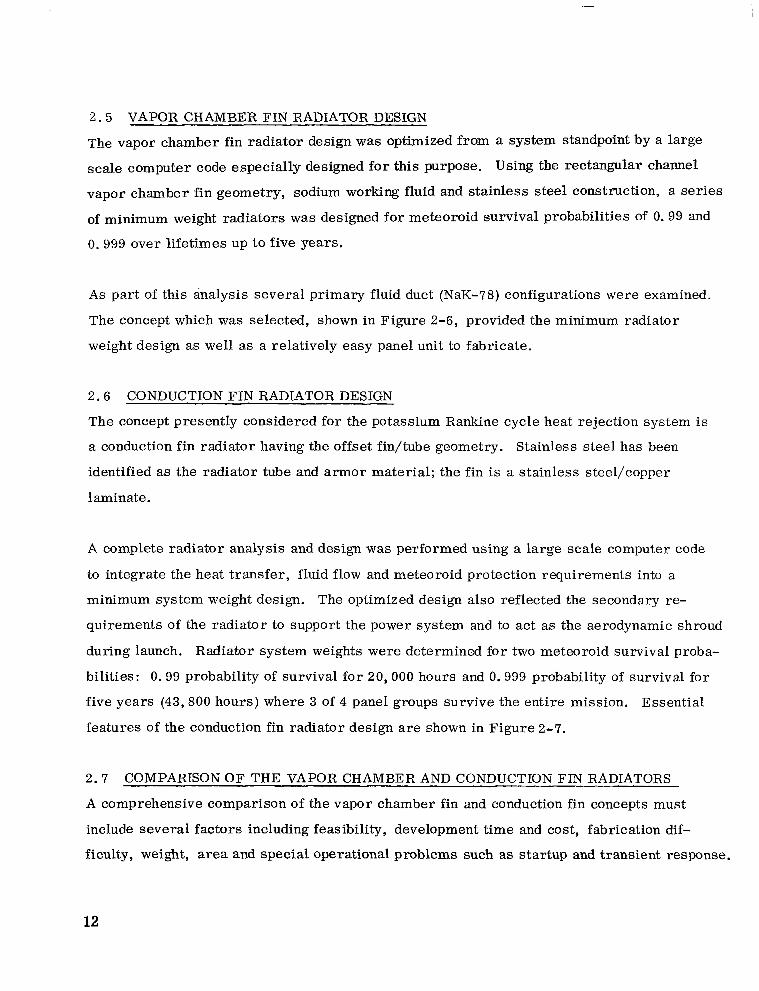
A s part of this analysis several primary fluid duct (NaK-78) configurations were examined.
The concept which was selected, shown in Figure 2-6, provided the minimum radiator
weight design as well as a relatively easy panel unit to fabricate.
2 .6 CONDUCTION FIN RADIATOR DESIGN
The concept presently considered for the potassium Rankine cycle heat rejection system is
a conduction fin radiator having the offset fin/tube geometry. Stainless steel has been
identified as the radiator tube and armor material; the fin is a stainless steel/copper
laminate.
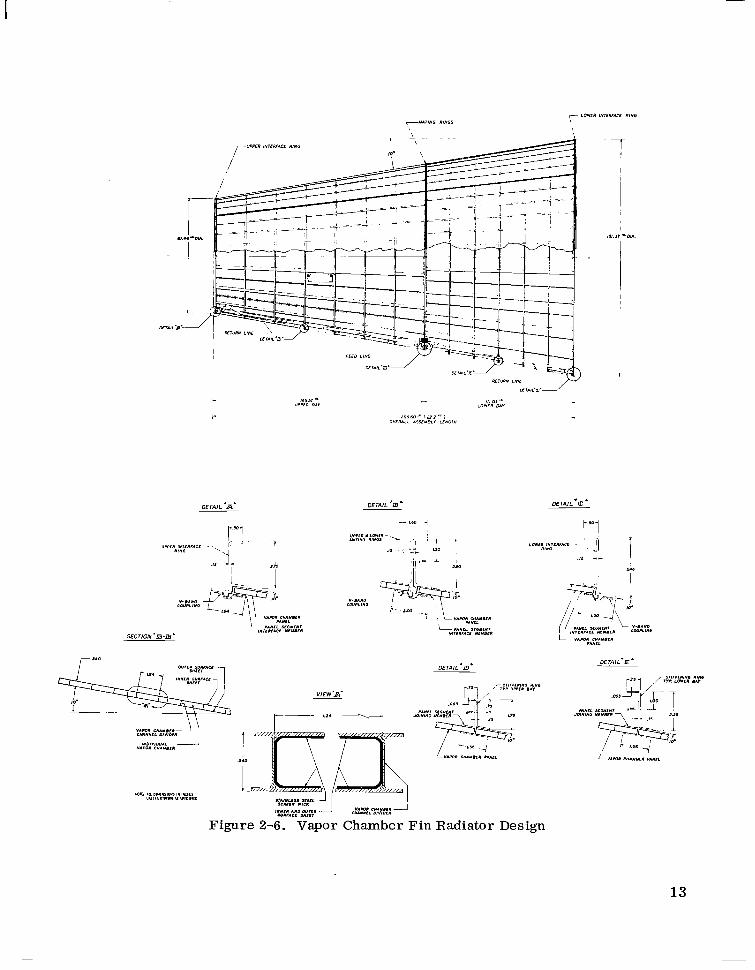
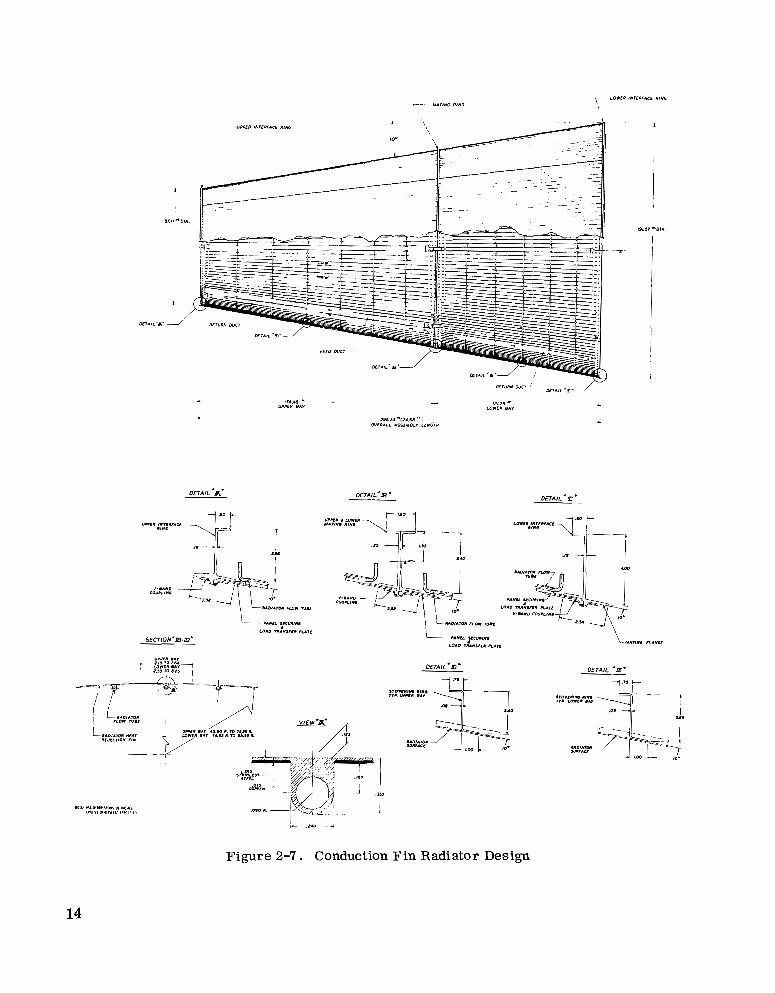
A complete radiator analysis and design was performed using a large scale computer code
to integrate the heat transfer, fluid flow and meteoroid protection requirements into a
minimum system weight design. The optimized design also reflected the secondary re-
quirements of the radiator to support the power system and to act as the aerodynamic shroud
during launch. Radiator system weights were determined for two meteoroid survival proba-
bilities: 0.99 probability of survival for 20,000 hours and 0.999 probability of survival for
five years (43,800 hours) where 3 of 4 panel groups survive the entire mission. Essential
features of the conduction fin radiator design are shown in Figure 2-7.
2.7 COMPARISON OF THE VAPOR CHAMBER AND CONDUCTION FIN RADIATORS
A comprehensive comparison of the vapor chamber fin and conduction fin concepts must
include several factors including feasibility, development time and cost, fabrication dif-
ficulty, weight, area and special operational problems such as startup and transient response.
12
SECT1ON.m-D'
V I E W A '
13
f
Figure 2-7. Conduction Fin Radiator Design
14
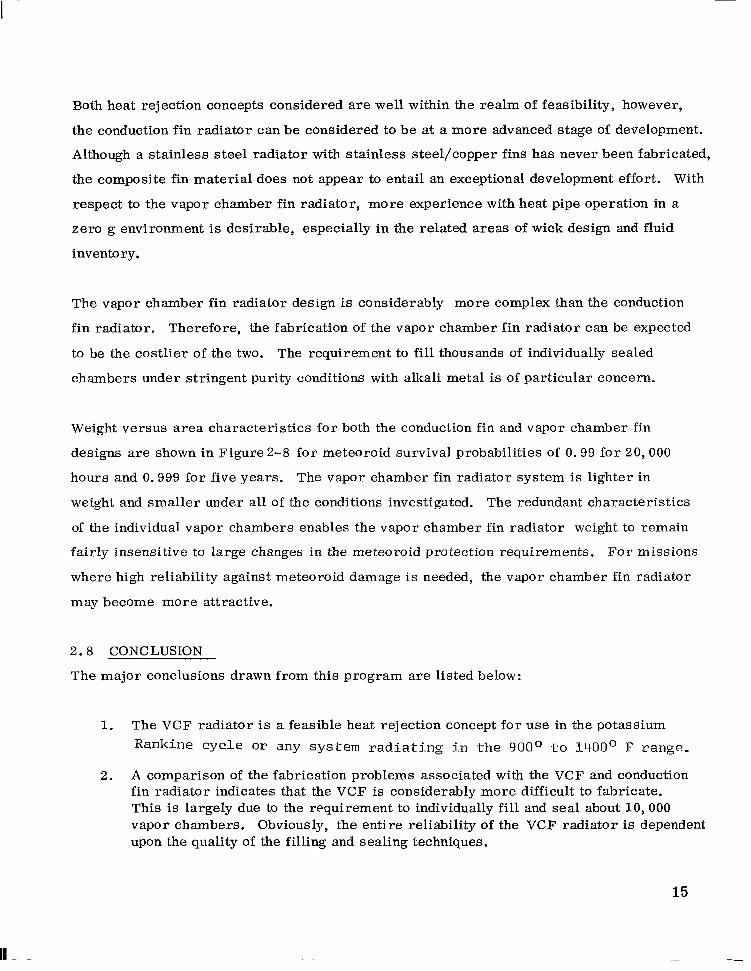
Both heat rejection concepts considered are well within the realm of feasibility, however,
the conduction fin radiator can be considered to be at a more advanced stage of development.
Although a stainless steel radiator with stainless steel/copper fins has never been fabricated,
the composite fin material does not appear to entail an exceptional development effort. With
respect to the vapor chamber fin radiator, more experience with heat pipe operation in a
zero g environment is desirable, especially in the related areas of wick design and fluid
inventory.
The vapor chamber fin radiator design is considerably more complex than the conduction
fin radiator. Therefore, the fabrication of the vapor chamber fin radiator can be expected
to be the costlier of the two. The requirement to fill thousands of individually sealed
chambers under stringent purity conditions with alkali metal is of particular concern.
Weight versus area characteristics for both the conduction fin and vapor chamber fin
designs are shown in Figure2-8 for meteoroid survival probabilities of 0.99 for 20,000
hours and 0.999 for five years. The vapor chamber fin radiator system is lighter in
weight and smaller under all of the conditions investigated. The redundant characteristics
of the individual vapor chambers enables the vapor chamber fin radiator weight to remain
fairly insensitive to large changes in the meteoroid protection requirements. For missions
where high reliability against meteoroid damage is needed, the vapor chamber fin radiator
may become more attractive.
2.8 CONCLUSION
The major conclusions drawn from this program are listed below:
1. The V C F radiator is a feasible heat rejection concept for use in the potassium Rankine cycle o r a n y s y s t e m r a d i a t i n g i n t he 900° to 1400° F range.
2. A comparison of the fabrication problems associated with the V C F and conduction fin radiator indicates that the VCF is considerably more difficult to fabricate. This is largely due to the requirement to individually fill and seal about 10,000 vapor chambers. Obviously, the entire reliability of the VCF radiator is dependent upon the quality of the filling and sealing techniques.
15
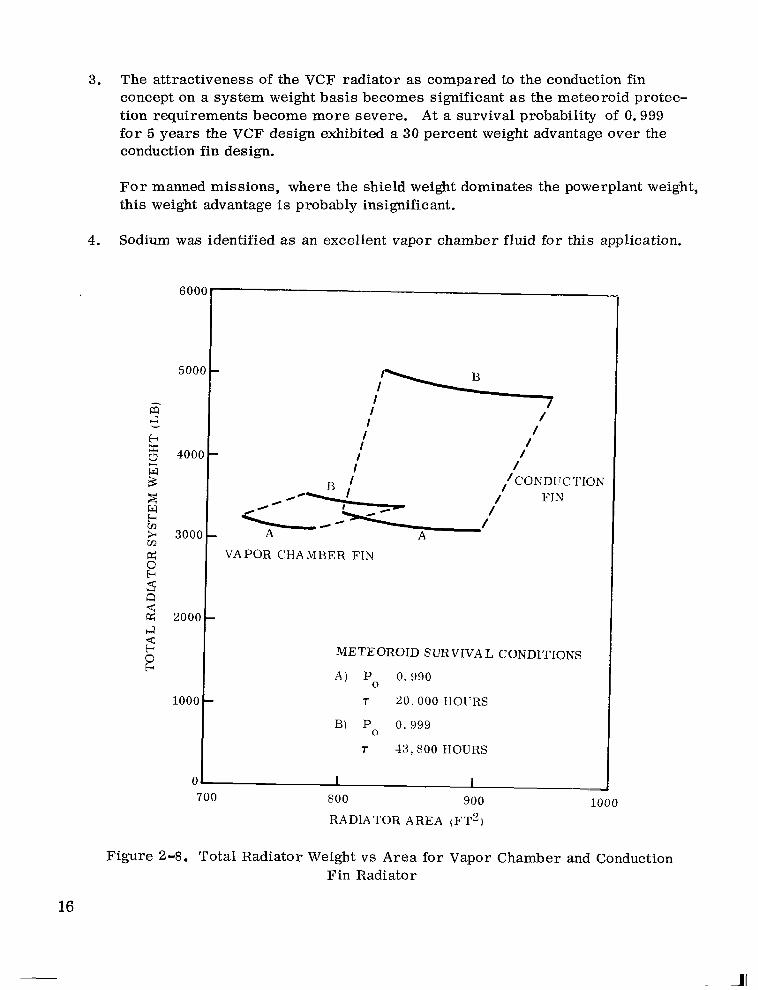
3.
4.
The attractiveness of the VCF radiator as compared to the conduction fin concept on a system weight basis becomes significant as the meteoroid protec- tion requirements become more severe. A t a survival probabiIity of 0.999 f o r 5 years the VCF design exhibited a 30 percent weight advantage over the conduction fin design.
For manned missions, where the shield weight dominates the powerplant weight, this weight advantage is probably insignificant.
Sodium was identified as an excellent vapor chamber fluid for this application.
I I
I I /
I /
METEOROID SURVIVAL CONDITIONS
A ) Po 0. 990
T 20 .000 IIOI'RS
B) Po 0. 999
7 43,800 HOURS
700 800 900
RADIATOR AREA (l;T2) 1000
Figure 2-8. Total Radiator Weight v s Area for Vapor Chamber and Conduction Fin Radi at0 r
16

SEC TION 3
RADIATOR DESIGN REQUIREMENTS
3 . 1 GENERAL DISCUSSION
The potassium Rankine cycle powerplant, under development at the NASA-Lewis Research
Center, transfers waste heat from the condensing fluid, potassium, to the primary liquid
coolant, NaK-78. The primary coolant rejects the waste heat from the system by means of
the main radiator. Other system radiators for the pumps, shield and electrical equipment
were not examined in this study.
The basic requirements of the radiator can be divided into several categories including
thermal performance, structural performance, integration, reliability and fabrication feasi-
bility. These requirements must be satisfied within the framework of achieving an attractive
weight, area and pumping power penalty.
3 .2 SYSTEM SPECIFICATION ”
Design requirements for the main radiator were determined by the cycle conditions of the
300 kWe potassium Rankine cycle as presently conceived by NASA-Lewis. A schematic
drawing of th i s system is shown in Figure 3-1.
Specific design specifications, pertinent to the radiator analyses are shown in Table 3-1.
The main radiator is pictured as a cone cylinder and comprises a section of the aerodynamic
fairing, atop a two stage Saturn V. In addition, the radiator and associated structure pro-
vides structural support for the nuclear powerplant during the launch sequence.
Four independent loops are currently defined for the primary coolant. Ground rules for
this study allowed the failure of one loop due to meteoroid damage over the mission lifetime.
Two meteoroid survival design conditions were investigated: a 0.99 probability of survival
for 20,000 hours and a 0.999 probability of survival for 43,800 hours (5 years).
Stainless steel was stipulated as the radiator material of construction due to i ts compatibility
with liquid metals, fabricability and high strength-to-weight ratio a t launch conditions. The
17
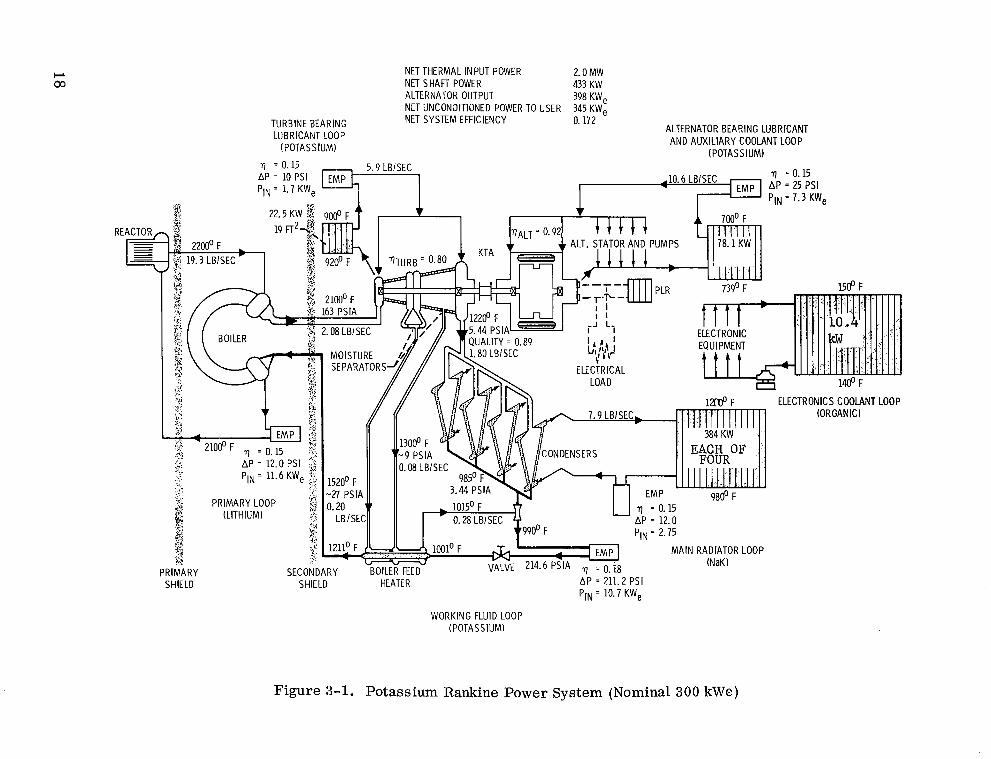
NET THERMAL INPUT POWER NET SHAFT POWER
2.0 MW
ALTERNATOR OUTPUT 433 KW 398 KW ,
NET UNCONDITIONED POWER TO USER 345 KW, NET SYSTEM EFFICIENCY 0. 172 TURBINE BEARING
LUBRICANT LOOP (POTASSIUM)
ALTERNATOR BEARING LUBRlCANl AND AUXILIARY COOLANT LOOP
(POTASSIUM) 7 = 0.15
PIN = 1.7 KW,
PRIMARY SHIELD
MAIN RADIATOR LOOP (NaK)
SECONDARY BOILER RED SHIELD HEATER
WORKING FLUID LOOP (POTASSIUM)
Figure 3-1. Potassium Rankine Power System (Nominal 300 kWe)
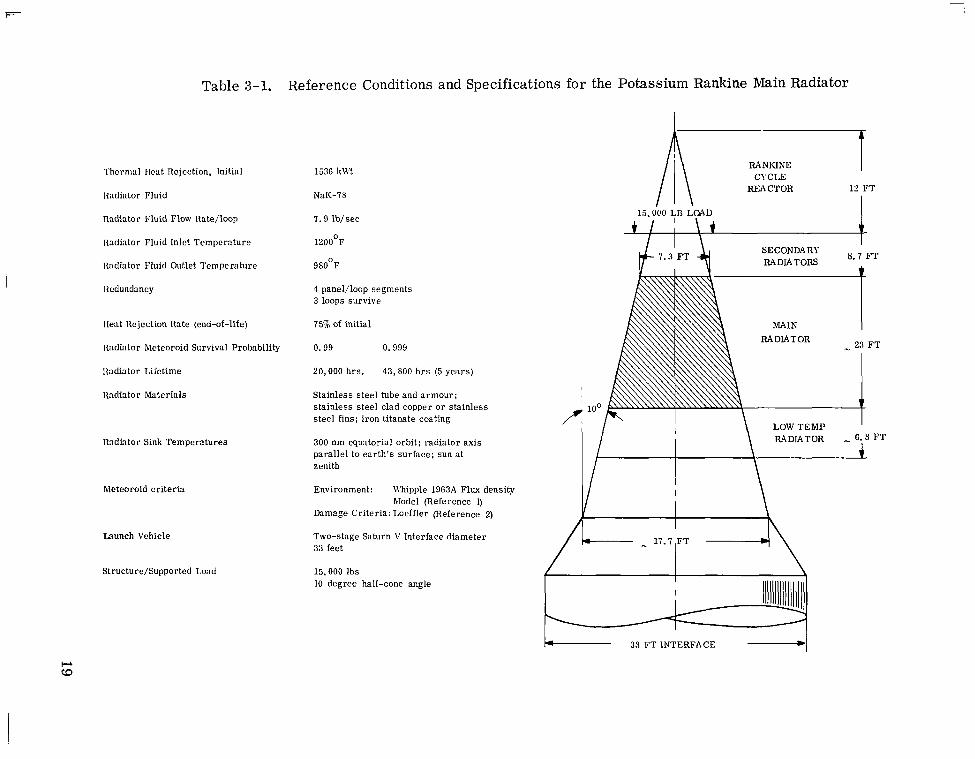
Table 3-1. Reference Conditions and Specifications for the Potassium Rankine Main Radiator
'l'hcrmul Ilcat Rejection, Initial
Radiator Fluid
Radiator Fluid Flow Rate/loop
Radiator Fluid Inlet Temperature
1l:tdiator Fluid Outlet Temperature
Iwhmlancy
Ileut Rejection Rate (end-of-life)
Iladiator Wcteoroid Survival Probability
1l:tdiator Lilctime
Radiator Matcrials
Rndktor Sink Temperatures
Meteoroid criteria
Launch Vehicle
Structure/Supported Load
1536 kWt
NaK-78
7.9 lb/sec
1200°F
980°F
4 panel/loop segments 3 loops survive
75% of initial
0.99 0.999
20,000 hrs . 43,800 h r s (5 years)
Stainless steel tube and armour; stainless steel clad copper or stainless steel fins; iron titanate coating
300 nm equatorial orbit; radiator axis parallel to earth's surface; sun a t zenith
Environment: R'hipple 1963A Flux density
Damage Criteria: Loeffler (Reference 2)
Two-stage Saturn V Interface diameter 33 feet
15.000 Ibs IO degree half-cone angle
Model (Reference I)
I'
RANKINE CYCLE
REACTOR 12 FT I
15, &O LB LOAD
t I I \ t
F T
RADIATOR - 23 F T
.OO
33 FT INTERFACE - I
conduction fin radiator, however, utilized a copper/stainless steel bimetallic fin in order
to raise the fin thermal conductivity.
Also specified was the consideration of three fluids for use in the vapor chambers: cesium,
potassium and sodium. While i t is desirable to limit the choice to one fluid, the possibility
of using two fluids, one in the high and one in the lower temperature section, was considered.
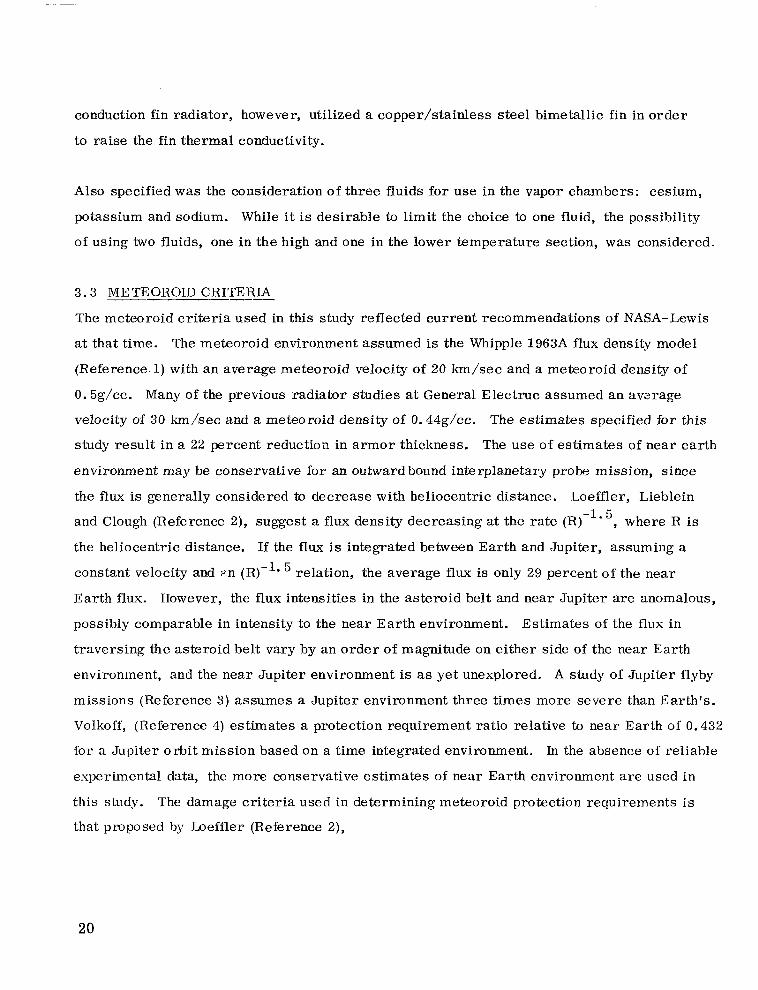
3.3 METEOROID CRITERIA "- The meteoroid criteria used in this study reflected current recommendations of NASA-Lewis
at that time. The meteoroid environment assumed is the Whipple 19638 flux density model
(Reference. 1) with an average meteoroid velocity of 20 km/sec and a meteoroid density of
0.5g/cc. Many of the previous radiator studies at General Electruc assumed an avsrage
velocity of 30 km/sec and a meteoroid density of 0.44g/cc. The estimates specified for this
study result in a 22 percent reduction in armor thickness. The use of estimates of near earth
environment may be conservative for an outward bound interplanetary probe mission, since
the flux is generally considered to decrease with heliocentric distance. Loeffler, Lieblein
and Clough (Reference 2), suggest a flux density decreasing at the rate (R) , where R i s
the heliocentric distance. If the flux is integrated between Earth and Jupiter, assuming a
constant velocity and ;.'n (R)-'* relation, the average flux is only 29 percent of the near
Earth flux. However, the flux intensities in the asteroid belt and near Jupiter are anomalous,
possibly comparable in intensity to the near Earth environment. Estimates of the flux in
traversing the asteroid belt vary by an order of magnitude on either side of the near Earth
environment, and the near Jupiter environment is as yet unexplored. A study of Jupiter flyby
missions (Reference 3) assumes a Jupiter environment three times more severe than Earth's.
Volkoff, (Reference 4) estimates a protection requirement ratio relative to near Earth of 0.432
for a Jupiter orbit mission based on a time integrated environment. In the absence of reliable
experimental data, the more conservative estimates of near Earth environment are used in
this study. The damage criteria used in determining meteoroid protection requirements is
that proposed by Loeffler (Reference 2 ) ,
-1.5
20
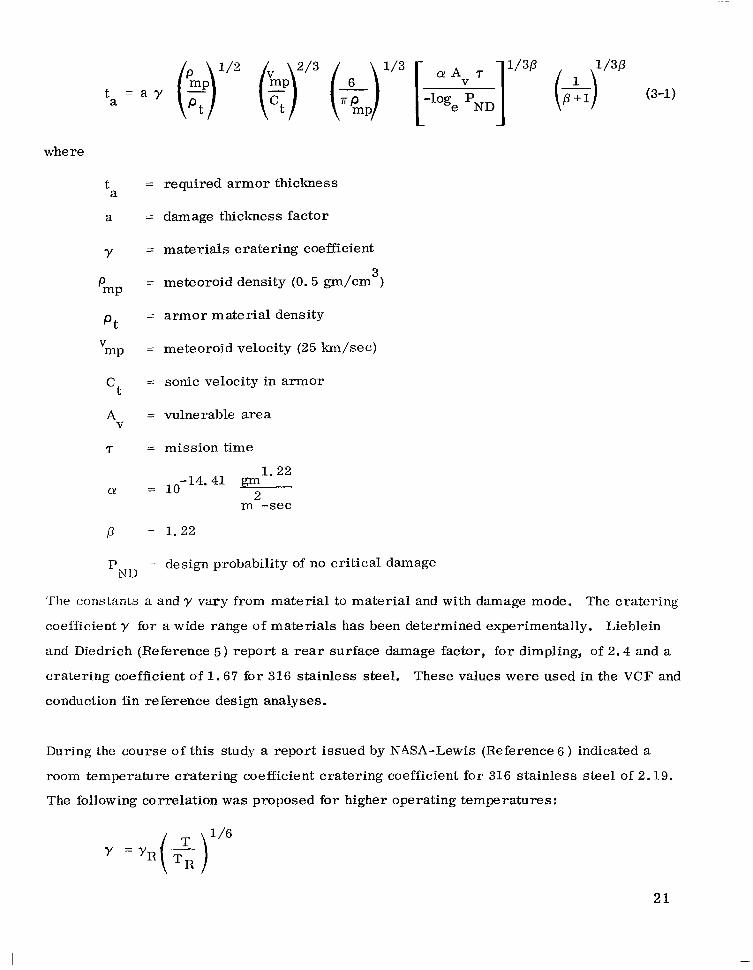
where
t a
a
Y
pmP
P t V mP
Ct
A v
r
a!
P
T)
= required armor thickness
= damage thickness factor
= materials cratering coefficient
= meteoroid density ( 0 . 5 p / c m ) 3
= annor material density
= meteoroid velocity (25 knl/sec)
= sonic velocity in armor
= vulnerable area
= mission time
-14.41 = 10 n
1.22
i: m -sec
" 1.22
ND - design probability of no critical damage
'The constants a and y vary from material to material and with damage mode. The cratering
coefficient y for a wide range of materials has been determined experimentally. Lieblein
and Diedrich (Reference 5 ) report a rear surface damage factor, for dimpling, of 2.4 and a
cratering coefficient of 1.67 for 316 stainless steel. These values were used in the V C F and
conduction fin reference design analyses.
During the course of this study a report issued by NASA-Lewis (Reference 6 ) indicated a
room temperature cratering coefficient cratering coefficient for 316 stainless steel of 2.19.
The following correlation was proposed for higher operating temperatures:
2 1

A t 1200°F the value of y is calculated to be 2.62; designs based on this value are presented
for the conduction fin radiator. However, due to the relative insensitivity of the VCF radiator
design to changes in meteoroid protection requirements, a similar analysis was not performed
for this concept.
3 . 4 - STRUCTURAL CRITERIA
The reference launch vehicle to be utilized with the potassium Rankine cycle i s the two stage
Saturn V. The position of the main radiator o n the vehicle is shown in Table 3-1.
A s listed in Table 3-1, the load supported by the radiator is 15, 000 pounds. This includes
the reactor., shield, power conversion equipment and associated piping.
The maximum loads occurring on the radiator will result from launch conditions. During launch
maxinlunl qcr and maximum axial acceleration conditions exist giving equivalent axial loads
approaching 500,000 pounds. Maximum bending loads occur when the product of dynamic
pressure and angle of attack cp reach a maximum, and the maximum axial loads occur the
instant of first stage engine cutoff. If the launch structure were designed to an axial load
condition only, an unrealistic result would be obtained, since it is obvious that the structure
must also have some lateral stiffness. A difficulty arises in attempting to specify a realistic
load condition for lateral stiffness since it is known that static lateral accelerations during
launch are generally low. One approach is to design to an artificial but conservative condition
such as 12 g axial combined with 5 g lateral. This approach may be reasonable for small PaJT-
loads, but excessively conservative and possibly prohibitive for a payload whose size and
mass are no !onger insignificant compared with the launch vehicle. The load factor must
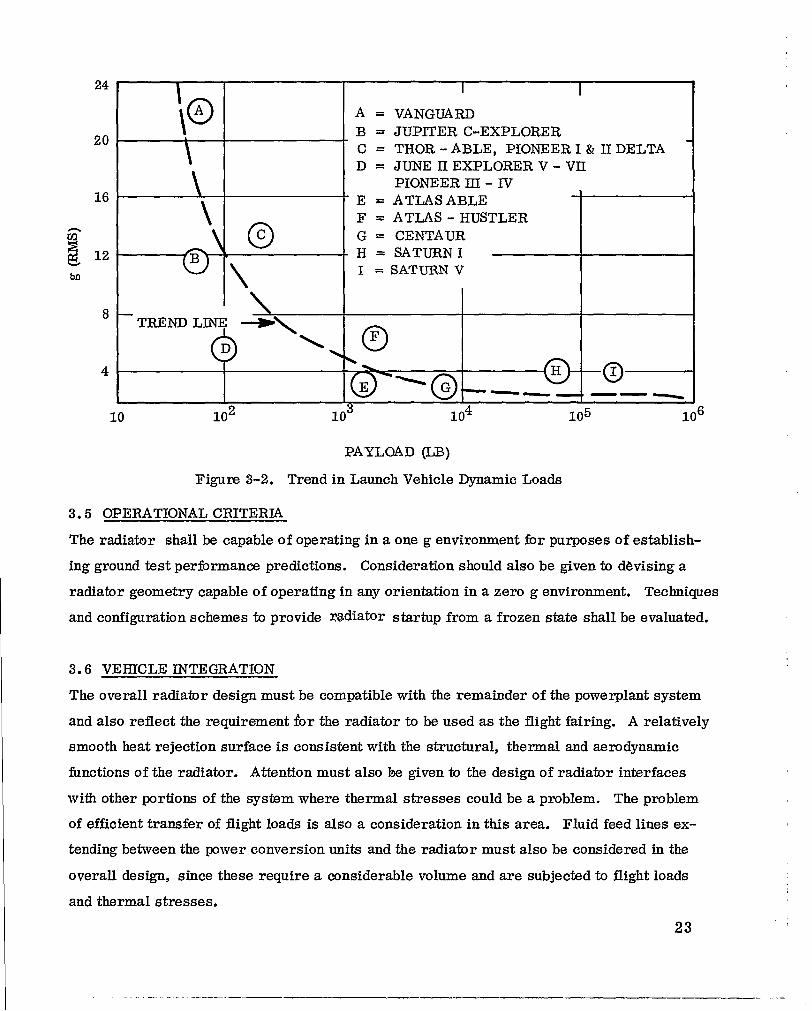
decrease as the pavload size increases, as evidenced by the trend shown in Figure 3-2.
At the maximum qcr condition, the two stage Saturn V has an axial acceleration of 2 . 0 g and
a lateral acceleration of 0.2 g. These conditions are to be utilized in the study.
22
a1 I I
\@
1
A = VANGUARD
20 B = JUPITER C-EXPLORER C = THOR -ABLE, PIONEER I & I1 DELTA D = JUNE II EXPLORER V - VII
-
PIONEER IU - IV 16 1
\ - E = ATLAS ABLE F = ATLAS - HUSTLER G = CENTAUR H = SATURN1 8 12 I = SATURN V -\ @ M
0 \,
* -TREND L
\, 0 4 \
\ 0 E e-0 - "0.""" 10 l o 2 l o 3 lo4 105 l o 6
PAYLOAD &B)
Figure 3-2. Trend in Launch Vehicle Dynamic Loads
3.5 OPERATIONAL CRITERIA
The radiator shall be capable of operating in a one g environment for purposes of establish-
ing ground test performance predictions. Consideration should also be given to devising a
radiator geometry capable of operating in any orientation in a zero g environment. Techniques
and configuration schemes to provide radiator startup from a frozen state shall be evaluated.
3.6 VEHICLE INTEGRATION
The overall radiator design must be compatible with the remainder of the powerplant system
and also reflect the requirement for the radiator to be used as the flight fairing. A relatively
smooth heat rejection surface is consistent with the structural, thermal and aerodynamic
functions of the radiator. Attention must also be given to the design of radiator interfaces
with other portions of the system where thermal stresses could be a problem. The problem
of efficient transfer of flight loads is also a consideration in this area. Fluid feed lines ex-
tending between the power conversion units and the radiator must also be considered in the
overall design, since these require a considerable volume and are subjected to flight loads
and thermal stresses.
23
"
3 . 7 FABRICATION
The radiator design shall be consistent with accepted NASA design practices. Insofar as
possible fabrication practices should be within the present state-of-art. Projections of the
state-of-art should be made with a high degree of confidence within the time frame of the
projected applications.
24
SECTION 4
VAPOR CHAMBER CONCEPT DEVELOPMENT
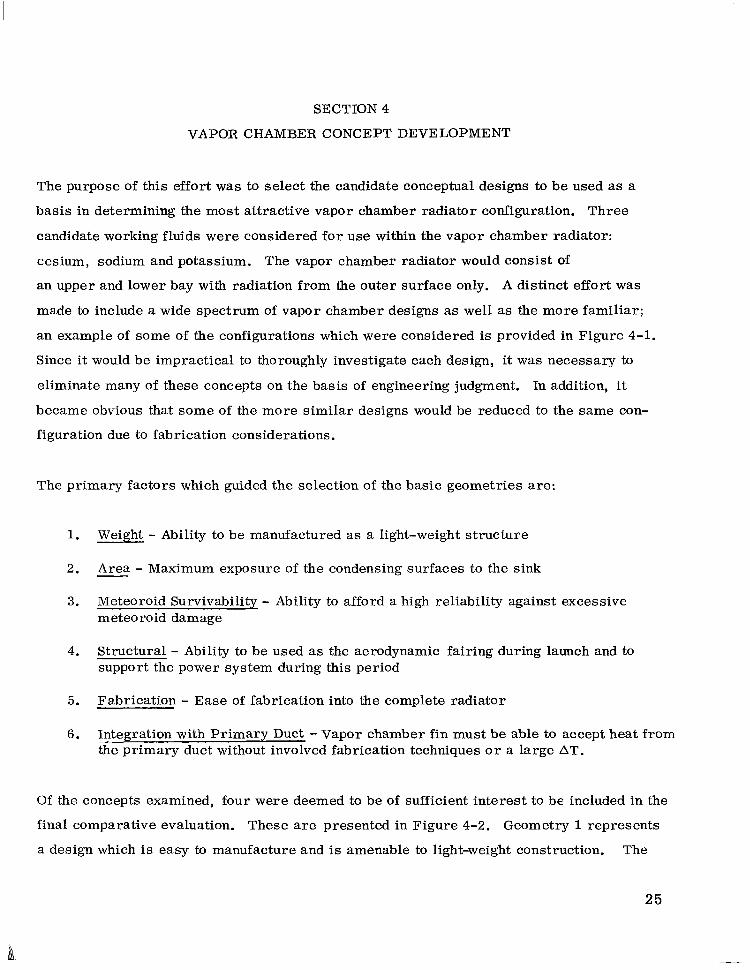
The purpose of this effort was to select the candidate conceptual designs to be used as a
basis in determining the most attractive vapor chamber radiator configuration. Three
candidate working fluids were considered for use within the vapor chamber radiator:
cesium, sodium and potassium. The vapor chamber radiator would consist of
an upper and lower bay with radiation from the outer surface only. A distinct effort was
made to include a wide spectrum of vapor chamber designs as well as the more familiar;
an example of some of the configurations which were considered is provided in Figure 4-1.
Since it would be impractical to thoroughly investigate each design, it was necessary to
eliminate many of these concepts on the basis of engineering judgment. In addition, it
became obvious that some of the more similar designs would be reduced to the same con-
figuration due to fabrication considerations.
The primary factors which guided the selection of the basic geometries are:
1.
2.
3.
4.
5.
6.
Weight - Ability to be manufactured as a light-weight structure
- Area - Maximum exposure of the condensing surfaces to the sink
Meteoroid Survivability - Ability to afford a high reliability against excessive meteoroid damage
Structural - Ability to be used as the aerodynamic fairing during launch and to support the power system during this period
Fabrication - Ease of fabrication into the complete radiator
Integration with Primary Duct - Vapor chamber fin must be able to accept heat from the primary duct without involved fabrication techniques o r a large AT.
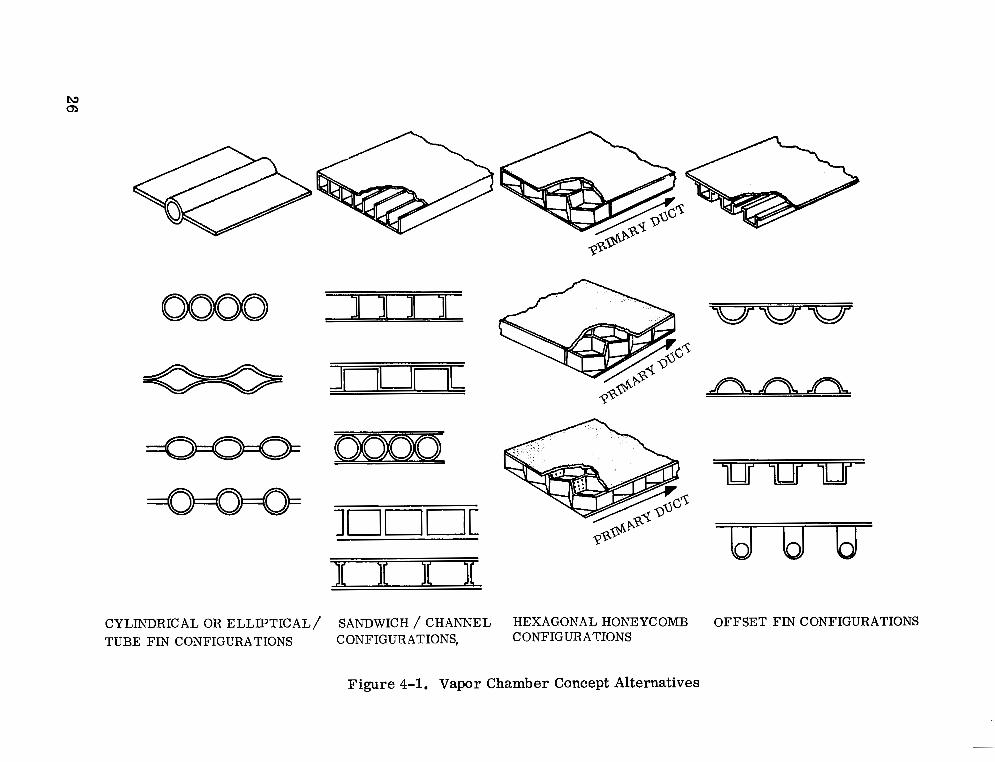
Of the concepts examined, four were deemed to be of sufficient interest to be included in the
final comparative evaluation. These are presented in Figure 4-2. Geometry 1 represents
a design which is easy to manufacture and is amenable to light-weight construction. The
CYLmDRICAL OR ELLIPTICAL/ SANDWICH / CHANNEL HEXAGONAL HONEYCOMB OFFSET FIN CONFIGURATIONS TUBE FIN CONFIGURATIONS CONFIGURATIONS, CONFIGURATIONS
Figure 4-1. Vapor Chamber Concept Alternatives
round flow passage is ideal for all aspects of heat pipe operation, while the conduction fins
are a light weight means of providing radiating area.
Geometry 2 is a design which would operate at a uniform surface temperature, thus reducing
the overall radiator area. In addition, this design provides for a simple interface with the
primary duct.
The obvious advantages of Geometry 3 a r e its structural rigidity and, due to the large number
of cells, its exceptional resistance to significant meteoroid damage. Each hexagonal cell,
however, has its own evaporator and condenser section resulting in several thermal resis-
tances along the length of the fin. Since each cell must be a self-contained unit, fabrication
of this system can be expected to be difficult.
Geometry 4 is similar in some respects to 1, but, has certain structural and fabrication
advantages. The ability of the conduction fins to act as an efficient means of heat transfer
in a vapor chamber radiator is of interest in both of these concepts.
The four geometries chosen for investigation were felt to represent a varied array of
possible design alternatives. Each geometry has its particular advantages and disad-
vantages which justified a thorough study in order to choose the optimum design.
t t t f t t t t t t t t t t t t =cxl=lrll 11111 --=m"
CYLNRICAL~FIN RECTANGULAR CHANNEL HEXAGONAL HONEYCOMB OFFSET RECTANGULAR CHANNEL
Figure 4-2. Concepts Selected for Further Investigation
27
SECTION 5
VAPOR CHAMBER ANALYSIS
The analysis for each geometry was divided into two parts: first, an evaluation of the
condenser section, and secondly, the evaluation of the entire radiator including the primary
fluid ducts, evaporator and condenser sections. In order to make a valid comparison be-
tween concepts, each geometry must be investigated thoroughly over a range of parameters
so as to find the region of attractive design points. Principal areas of investigation and
selected characteristics for final evaluation and comparison were:
1. Thermal performance (weight, area and reliability)
2. Integration with primary duct and radiator interfaces
3. Structural performance
4. Fabrication capability
5.1 CONDENSER EVALUATION
In the first part of the analysis, each condenser geometry was evaluated over the range of
variables shown in Figure 5-1. The criteria used as a basis of evaluation was weight per
kilowatt of heat rejected. In this phase of the study, all system considerations such as
total radiator area, system pumping power and vapor chamber fin/duct interface were
temporarily neglected in order to focus attention on the condenser section weight calcula-
tions. The considerations which were factored into this analysis were:
1. Meteoroid cri teria
2. Thermal performance in terms of fluid flow and heat transfer characteristics
3. Structural integrity under thermal and launch loads.
These subjects are treated individually in the following paragraphs.
28
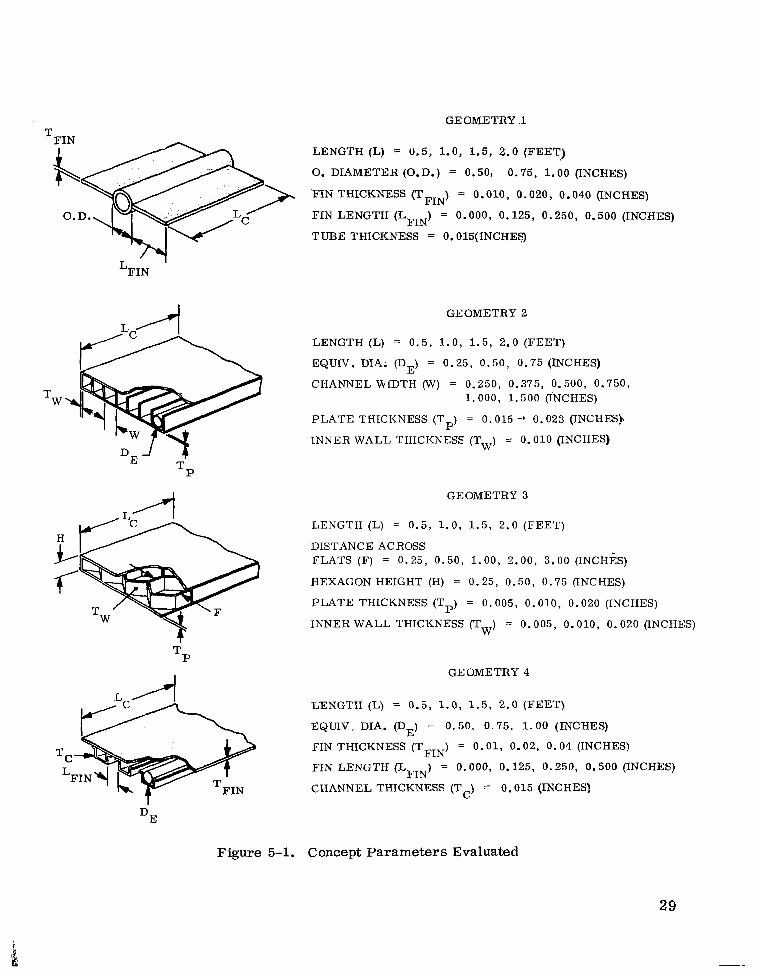
T GEOMETRY .1
LENGTH (L) 0.5 , 1.0, 1.5, 2 . 0 (FEET)
0. DIAMETER (O.D.) = 0.50, 0.75, 1 . 0 0 (INCHES)
'FIN THICKNESS (TFIN) = 0.010, 0.020, 0.040 (INCHES)
FIN LENGTH (LFIN) = 0.000, 0.125, 0.250, 0.500 (INCHES)
TUBE THICKNESS = O.O15(INCHES)
'FIN - 1
GEOMETRY 2
LENGTH (L) = 0 . 5 , 1 . 0 , 1.5, 2.0 (FEET)
EQUIV. DIA; (D ) = 0.25, 0 . 5 0 , 0.75 (INCHES) E CHANNEL WtDTH (W) = 0.250, 0.375, 0.500, 0.750,
TW 1.000, 1.500 (INCHES) PLATE THICKNESS (Tp) = 0.015 -+ 0.023 (INCHES).
INNER WALL THICKNESS (Tw) = 0.010 (INCHES)
GEOMETRY 3
LENGTH (L) = 0.5, 1 . 0 , 1 . 5 , 2.0 (FEET)
DISTANCE ACROSS FLATS (F) = 0.25 , 0 .50 , 1.00, 2.00, 3 . 0 0 (INCHES)
HEXAGON HEIGHT (H) = 0.25, 0.50, 0.75 (INCHES)
PLATE THICKNESS (Tp) = 0.005, 0.010, 0.020 (INCHES)
INNER WALL THICKNESS (T ) = 0.005, 0.010, 0.020 (INCHES) W
T P
GEOMETRY 4
LENGTH (L) = 0 . 5 , 1.0, 1.5, 2.0 ( F E E T )
EQUIV. DIA. (DE) = 0 . 5 0 . 0 . 7 5 . 1 . 0 0 (INCHES)
FIN THICKNESS (TFIN) = 0.01, 0.02, 0.04 (INCHES)
FIN LENGTH (LFIN) = 0.000, 0.125, 0.250, 0.500 (INCHES)
CHANNEL THICKNESS (TC) = 0.015 (INCHES)
Figure 5-1. Concept Parameters Evaluated
29
5.1.1 VAPOR CHAMBER ANALYTICAL CONSIDERATIONS
5.1.1.1 Meteoroid Criteria
A major factor in the design of any active space heat rejection system is consideration of
possible meteoroid damage. The vapor chamber fin approach to radiator design can limit
the amount of meteoroid armor required due to the fact that the number of primary fluid
ducts can be reduced. Puncture of individual vapor chambers is not serious due to the
redundant characteristics of this design.
In a conduction fin radiator, operating at relatively high temperatures, tube spacings
greater than a few inches cannot be tolerated due to the low fin efficiences incurred. This
condition increases the amount of tubes and required meteoroid armor as compared to the
vapor chamber fin concept. Although the vapor chamber fin radiator is less susceptible
to critical meteoroid damage than the conduction fin radiator, the effect of the meteoroid
environment must still be considered in the design.
Several difficulties are apparent in the selection of a design criterion to minimize the
probability of meteoroid penetration. The data obtained from satellite experiments by
various impact sensors and of indirect measurements from zodiacal light and radar
photographic observation of meteors show various discrepancies. Secondly, simulation
of the available data by hypervelocity impact tests is impossible due to the inability of
experimenters to duplicate observed meteoroid velocities. Meteoroid velocities are
reported to average 17 to 20 km/sec while projectile velocities in the order of only 8
km/sec can be achieved in the laboratory. The third problem b e c o m s one of interpreting
and modeling the observed meteoroid flux and hypervelocity impact data into an analytical
expression which can be used for a reliable radiator design. The sporadic nature of meteor-
oid events, the uncertainty involved in the hypervelocity impact testing and the variation of
damage mode with respect to tube and tube liner materials and thicknesses combine to fur-
ther complicate the situation.
30
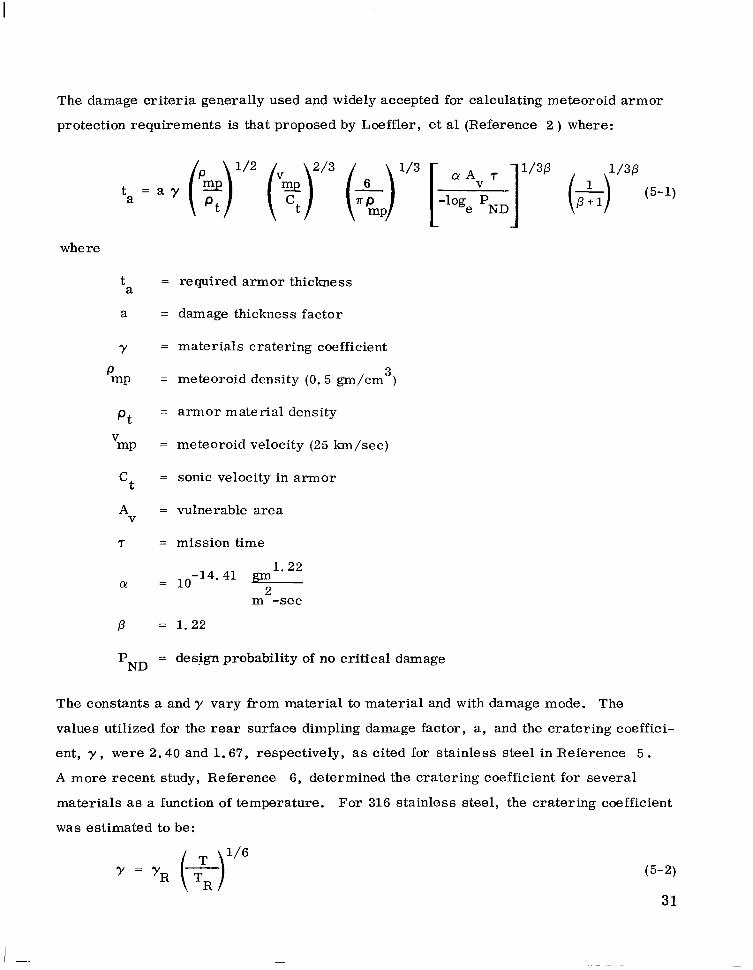
The damage criteria generally used and widely accepted for calculating meteoroid armor
protection requirements is that proposed by Loeffler, et a1 (Reference 2 ) where:
where
t = required armor thickness
a = damage thickness factor
a
Y = materials cratering coefficient P mp = meteoroid density (0.5 gm/cm ) 3
p t = armor material density
mp = meteoroid velocity (25 lun/sec) V
Ct = sonic velocity in armor
A = vulnerable area V
7 = mission time
-14.41 p 1 . 2 2 CY = 10 0
,G
m -see
p = 1.22
PND = design probability of no critical damage
The constants a and y vary from material to material and with damage mode. The
values utilized for the rear surface dimpling damage factor, a, and the cratering coeffici-
ent, y , were 2.40 and 1.67, respectively, as cited for stainless steel in Reference 5 .
A more recent study, Reference 6, determined the cratering coefficient for several
materials as a function of temperature. For 316 stainless steel, the cratering coefficient
was estimated to be:
1/6
= 'R (e) (5-2)
3 1
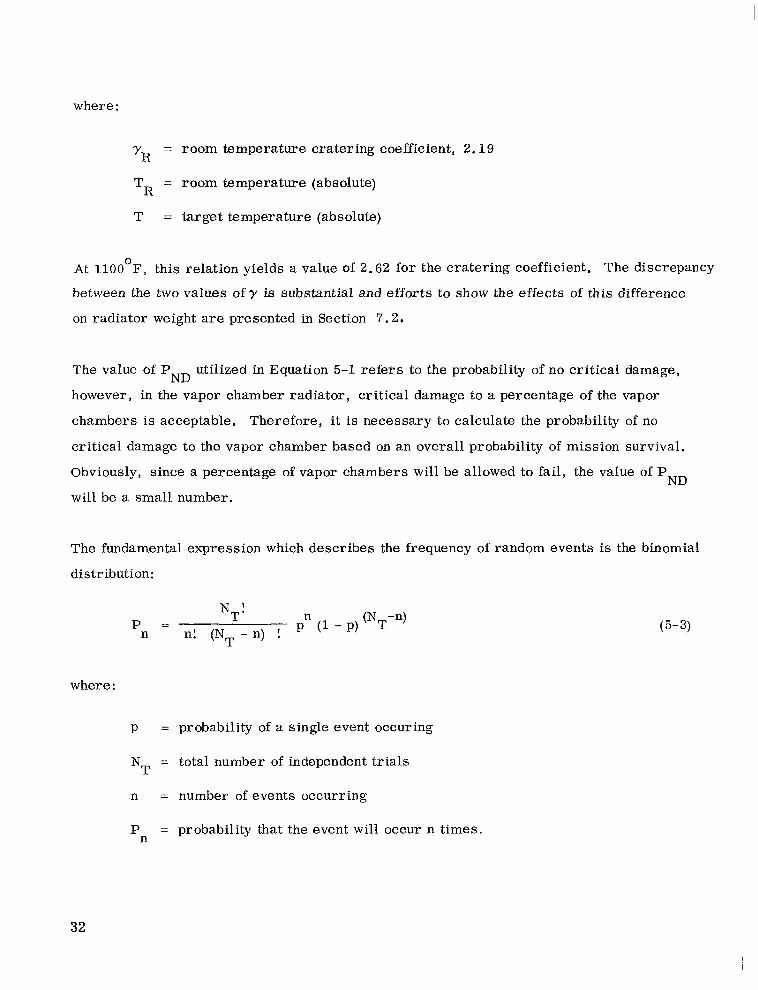
where:
yR = room temperature cratering coefficient, 2.19
TR = room temperature (absolute)
T = target temperature (absolute)
At 1100 F, this relation yields a value of 2.62 for the cratering coefficient. The discrepancy
between the two values of y is substantial and efforts to show the effects of this difference
on radiator weight are presented in Section 7.2.
0
The value of P utilized in Equation 5-1 refers to the probability of no critical damage,
however, in the vapor chamber radiator, critical damage to a percentage of the vapor
chambers is acceptable. Therefore, it is necessary to calculate the probability of no
critical damage to the vapor chamber based on an overall probability of mission survival.
Obviously, since a percentage of vapor chambers will be allowed to fail, the value of P ND
will be a small number.
ND
The fundamental expression which describes the frequency of random events is the binomial
distribution:
P = Pn (1 - PI (NT-n) n n! (NT - n) !
where :
p = probability of a single event occuring
NT = total number of independent tr ials
n = number of events occurring
P = probability that the event wi l l occur n times. n
(5- 3)
32
If this expression is applied to the vapor chamber fin radiator, the following analogies
are apparent:
P - the probability of a single chamber surviving
NT - the total number of chambers
n - the number of chambers which wi l l survive
P - the probability of n chambers surviving n
By summating the expression between n = N and n = NT, the overall probability, P of
N , or more chambers surviving can be obtained: S 0
S
By putting the desired probability of mission success, P total number of chambers,
N and the number of chambers surviving, NS, it is possible to solve for the individual
survival probability, p. The value of P input into Equation 5 . 1 is the overall probability ND of no critical damage. This is obtained by raising the individual survival probability to the
N power. Therefore,
0’
T
T
N T
PND = P (5-5)
The vulnerable area of the vapor chambers was assumed to be the entire vapor chamber
surface area. The area and survival probability term in Equation 5-1 reduces to the follow-
ing :
w h e r e
A = vulnerable area of a single chamber C
33
An investigation was performed with the RSURV computer program to determine the
relationship between p, the individual survival probability, and P the overall survival
probability, for varying survival percentages. Typical results of these studies are illus-
trated in Figures 5-2 and 5-3 for various values of N /N These curves illustrate two
important facts:
0'
S T'
1. When large numbers of chambers are present, small changes in the individual survival probability create large changes in the overall survival probability.
2 . The value of the individual survival probability required to obtain a large overall'survival probability is one or two percent higher than the fraction of chambers which survive.
Previous work has indicated that the optimum fraction of chambers which are allowed to
survive is dependent upon the temperature and design of the radiator; values between 0.8
and 0.9 have been found to be the most advantageous. Due to the low thermal conductivity
of stainless steel and the relatively high operating temperatures, a value of 0.9 was selec-
ted for this study.
5.1.1.2 Vapor Chamber Relationships
The heat pipe (or vapor chamber) is a closed system containing a two-phase fluid and
porous material which makes use of the physical phenomena of evaporation, condensation
and capillary action. With proper design, it is able to transport large quantities of heat
energy over relatively long distances, through small cross sections, with only a modest
temperature drop. Figure 5-4 shows a heat pipe as a closed container, lined with a wick
saturated with liquid; the remaining volume is filled with vapor of the same fluid. Heat
input at the evaporator causes liquid to vaporize resulting in a local pressure increase.
The induced pressure gradient causes the vapor to flow towards the condenser section
where energy is being transferred to the environment. The vapor condenses and fills the
wick; condensate is returned to the evaporator by capillary action. The internal fluid loop
resulting from these processes will continue to function as long as the sum of the pressure
drops incurred in the vapor flow and liquid return is less than the capillary pump pressure
34
1 oL N (NUMBER OF CHAMBERS) T
Figure 5-2. Relationship Between the Overall and Individual Survival Probabilities (as determined by the binomial distribution for 75 percent chamber survivability)
35
.GO -
.50 - ""- 0.85
\ \ \
\ \ \
N (NUMBER O F CHAMBERS) T
Figure 5-3. Relationship Between the Overall and Individual Survival Probability (as determined by the binomial distribution for 85 percent chamber survivability)
SI 0; X I O J SI 0;
N (NUMBER O F CHAMBERS) T
Figure 5-3. Relationship Between the Overall and Individual Survival Probability (as determined by the binomial distribution for 85 percent chamber survivability)
36

0 0 0 0 H E A T
A D D I T I O N H E A T E X T R A C T I O N
*. E V A P O R A T I O N ' :
0 -ef H E A T A D D I T I O N
. C O N D E N S 4 T I O N 1.1
H E A T R E U C V A L I
Figure 5-4. Basic Heat Pipe
rise at the evaporator. The high effectiveness of the heat pipe is due primarily to the
fact that the energy transfer is accomplished in the form of the latent heat of vaporization.
5 .1 .1 .2.1 Vapor Chamber Design
The four basic areas of design of a heat pipe are the vapor flow passage, the capillary
structure and the evaporator and condenser areas. A l l of these depend to some extent
upon the properties of the working fluid being considered. The selection of the working
fluid is extremely important if the heat pipe is to be utilized to its fullest extent. The
main physical properties of interest in a heat pipe fluid are as follows:
1. Vapor pressure - the vapor pressure should be low enough so as to be easily contained at the operating temperature
2. Vapor density - a high vapor density is desirable in order to reduce the required vapor passage flow area.
37
3. Latent heat of vaporization - a high latent heat of vaporization reduces the mass fI ow requirement.
4. Surface tension - the capillary pump pressure rise is directly proportional to the surface tension. A high surface tension allows for longer heat pipes.
5. Vapor viscosity - a low vapor viscosity minimizes the vapor pressure drop.
6. Liquid viscosity - a low value enables a finer capillary structure to be used as well as a longer heat pipe.
7. Thermal conductivity - a high thermal conductivity minimizes the evaporative and condensing temperature drops.
8. Liquid density - the density of the liquid phase should be high to reduce the flow rate of the liquid through the capillary structure.
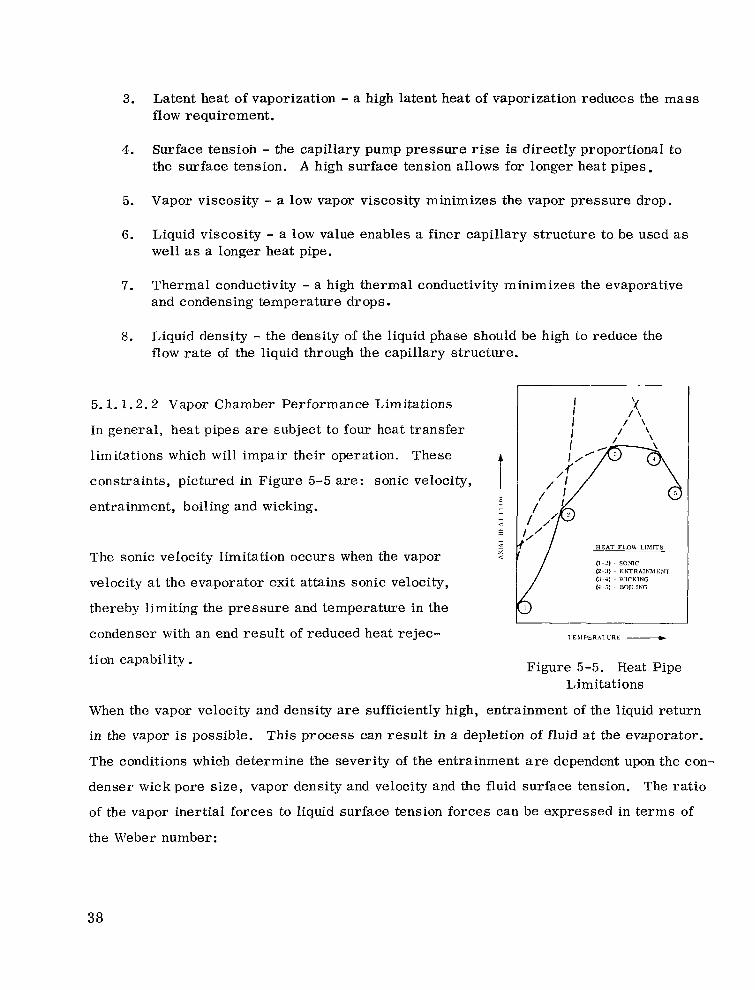
5.1.1.2.2 Vapor Chamber Performance Limitations
In general, heat pipes are subject to four heat transfer
limitations which will impair their operation. These
constraints, pictured in Figure 5-5 are: sonic velocity,
entrainment, boiling and wicking.
The sonic velocity limitation occurs when the vapor
velocity at the evaporator exit attains sonic velocity,
thereby limiting the pressure and temperature in the
condenser with an end result of reduced heat rejec-
tion capability.
/ p ’ I ’ , 2
/ /
Figure 5-5. Heat Pipe Limitations
When the vapor velocity and density are sufficiently high, entrainment of the liquid return
in the vapor is possible. This process can result in a depletion of fluid a t the evaporator.
The conditions which determine the severity of the entrainment are dependent upon the con-
denser wick pore size, vapor density and velocity and the fluid surface tension. The ratio
of the vapor inertial forces to liquid surface tension forces can be expressed in terms of
the Weber number:
38

where
pV = vapor density
V = vapor velocity
d = a characteristic length dependent upon the wick pore size
(5 = surface tension
gc = force-mass conversion constant
When this ratio exceeds 1. 0, entrainment is probable.
Boiling in the heat input section of a heat pipe is undesirable since it interferes with the
capillary action occurring in the wick. Therefore, in a zero g environment, liquid from
the condenser could be prevented from entering the heat input section by the presence of
vapor bubbles in the wick. The onset of boiling is difficult to predict because of the sensi-
tivity of this phenomena with the surface finish of the container and wick. Experimental
work has shown that the alkali metals require heat fluxes in excess of 1 0 BTU/hr-ft to
nucleate. Analytical studies, discussed in Section 7 indicate that evaporator heat
fluxes above 10 are not advantageous in a vapor chamber fin radiator, regardless of
nucleate boiling considerations.
5 2
5
The three limitations discussed above can be regarded as constraints which must be con-
sidered during the design of a heat pipe. The wicking limitation, which relates directly
to the pressure drop balance in the heat pipe, is generally used as a design criteria in
order to minimize the heat pipe weight. The capillary pressure rise is determined by the
choice of wick and fluid. It is then necessary to minimize the vapor passage flow area, the
condenser wick weight and fluid inventory without imposing an excessive pressure drop.
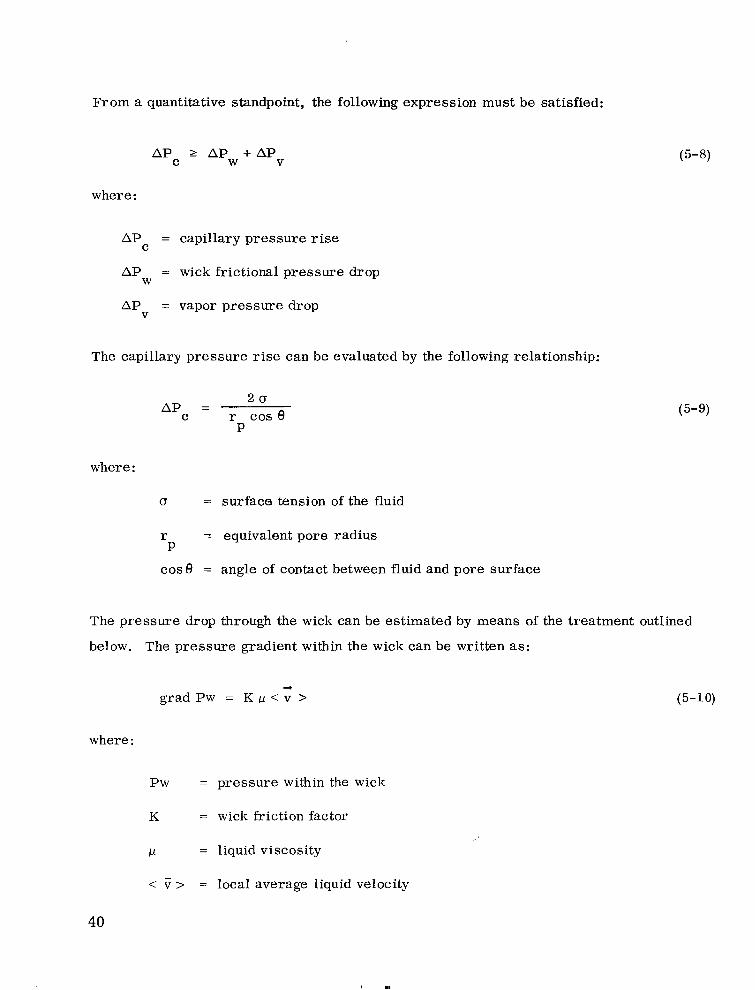
From a quantitative standpoint, the following expression must be satisfied:
A P 2 APw + Dv C
where:
A P = capillary pressure rise
APw = wick frictional pressure drop
C
ApV = vapor pressure drop
The capillary pressure rise can be evaluated by the following relationship:
APc - 2 0
r COS 8 -
P
where :
0 = surface tension of the fluid
r = equivalent pore radius
cos8 = angle of contact between fluid and pore surface
P
The pressure drop through the wick can be estimated by means of the treatment outlined
below. The pressure gradient within the wick can be written as:
grad P w = K p < v > +
where :
P w = pressure within the wick
K = wick friction factor
P = liquid viscosity
< V > = local average liquid velocity
(5-10)
40
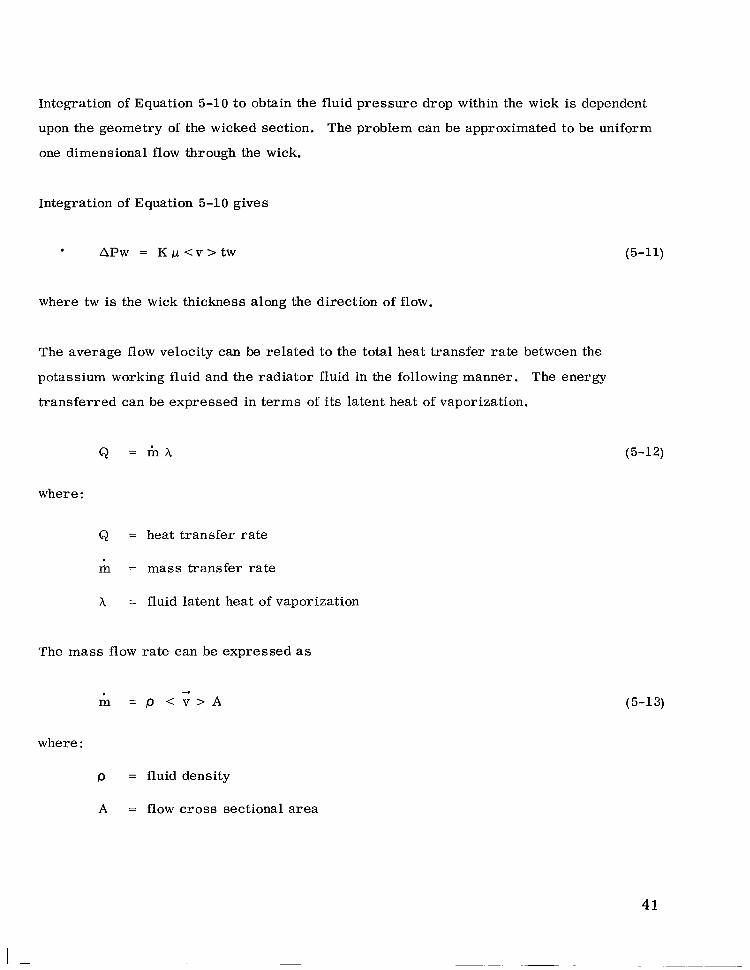
Integration of Equation 5-10 to obtain the fluid pressure drop within the wick is dependent
upon the geometry of the wicked section. The problem can be approximated to be uniform
one dimensional flow through the wick.
Integration of Equation 5-10 gives
where tw is the wick thickness along the direction of flow.
The average flow velocity can be related to the total heat transfer rate between the
potassium working fluid and the radiator fluid in the following manner. The energy
transferred can be expressed in terms of its latent heat of vaporization.
Q = i n k
where :
Q = heat transfer rate
m = mass transfer rate
h = fluid latent heat of vaporization
The mass flow rate can be expressed as
(5-11)
(5-12)
(5-13)
where :
p = fluid density
A = flow cross sectional area
41

Finally, the pressure drop within the wick can now be written as:
(5-13a)
The pressure change in the condenser section may be either a drop or rise, depending upon
the relative magnitude of the frictional losses as compared to the dynamic energy contri-
buted by the decelerating condensing vapor. The expression used to calculate the vapor
pressure drop is:
or
where:
4 1 . l ~ Q Rc A P =
V A
A P V
R C
Q
r V
RC
pV
and
R C
i f R < 1.0 C
i fR > 1 . 0 C
= condenser length
= condenser heat load (defined as a negative quantity)
= vapor space radius
= radiator Reynolds number
= vapor density
= vapor viscosity
Q
(5-14)
(5-14a)
(5-1 5)
42
5 . 1 . 1 . 3 Structural Considerations
The heat rejection system for the advanced Rankine cycle may be designed as an active
load-bearing member attached to some type of supporting substructure. Previous studies
(References 7 and 8) have shown that a more effective arrangement of the heat rejection
system and launch vehicle structure can be achieved by utilizing the radiator system as a
load-bearing aerodynamic fairing. The principal reason for the effectiveness of this approach
is the fact that a substantial amount of structure must be incorporated into the design of the
radiator, in any event, to provide the necessary meteoroid protection and heat conductive
paths to its surfaces. Therefore, a basic ground rule of this study was the requirement
of the radiator to support a 15,000 pound load during launch.
5 . 1 . 2 CONCEPT PARAMETRIC ANALYSIS
The fundamental fluid flow and thermodynamic expressions described above are contained
within the HPIPE computer program. This code was utilized in the analysis of Geometries
1 , 2 and 4 to obtain weight and pressure drop data. Due to the basic differences between
Geometry 3 and the remaining concepts, a separate analysis, discussed in Section 5 . 1 . 2 . 4
was performed for this design.
The criteria used in determining the design values was weight; area was not a considera-
tion at this particular time. Attention was centered on the condensing portion of the vapor
chambers since a primary duct interface configuration had not been selected. However,
an assumption that the evaporator section was one-fourth the length of the condenser section
was made at this time to obtain effects associated with the evaporative AT and wick thickness.
The utilization of the HPIPE computer program proceeded in the following manner:
1. The values of the geometric parameters were input into HPIPE in accordance with the ranges shown in Figure 5-1. Since HPIPE was originally designed for circular geometry, appropriate changes were made in the input values for hydraulic pipe radius and wall thickness so that proper pressure drops and weights could be calculated.
43
2.
3.
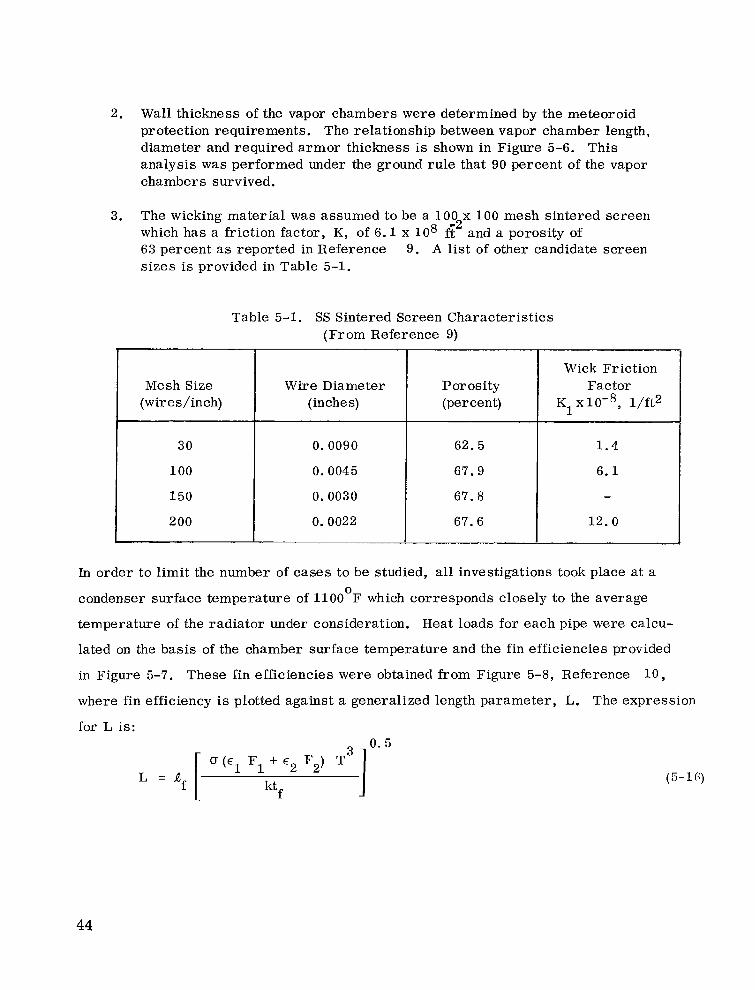
Wall thickness of the vapor chambers were determined by the meteoroid protection requirements. The relationship between vapor chamber length, diameter and required armor thiclmess is shown in Figure 5-6. This analysis was performed under the ground rule that 90 percent of the vapor chambers survived.
The wicking material was assumed to be a 100 x 100 mesh sintered screen which has a friction factor, K, of 6.1 x l o 8 ft and a porosity of 63 percent as reported in Reference 9. A l ist of other candidate screen sizes is provided in Table 5-1.
-2
Table 5-1. SS Sintered Screen Characteristics (From Reference 9)
Mesh Size Wire Diameter (wires/inch) (inches)
30
0.0022 200
0.0030 150
0.0045 100
0.0090
~~ ~~ ~. ~-
Porosity (percent)
62.5
67.9
67.8
67.6
Wick Friction Factor
K1 x l / f t 2
1.4
6.1
12.0
In order to limit the number of cases to be studied, all investigations took place at a
condenser surface temperature of 1100 F which corresponds closely to the average
temperature of the radiator under consideration. Heat loads for each pipe were calcu-
lated on the basis of the chamber surface temperature and the fin efficiencies provided
in Figure 5-7. These fin efficiencies were obtained from Figure 5-8, Reference 10,
where fin efficiency is plotted against a generalized length parameter, L. The expression
for L is:
0
(5-16)
44
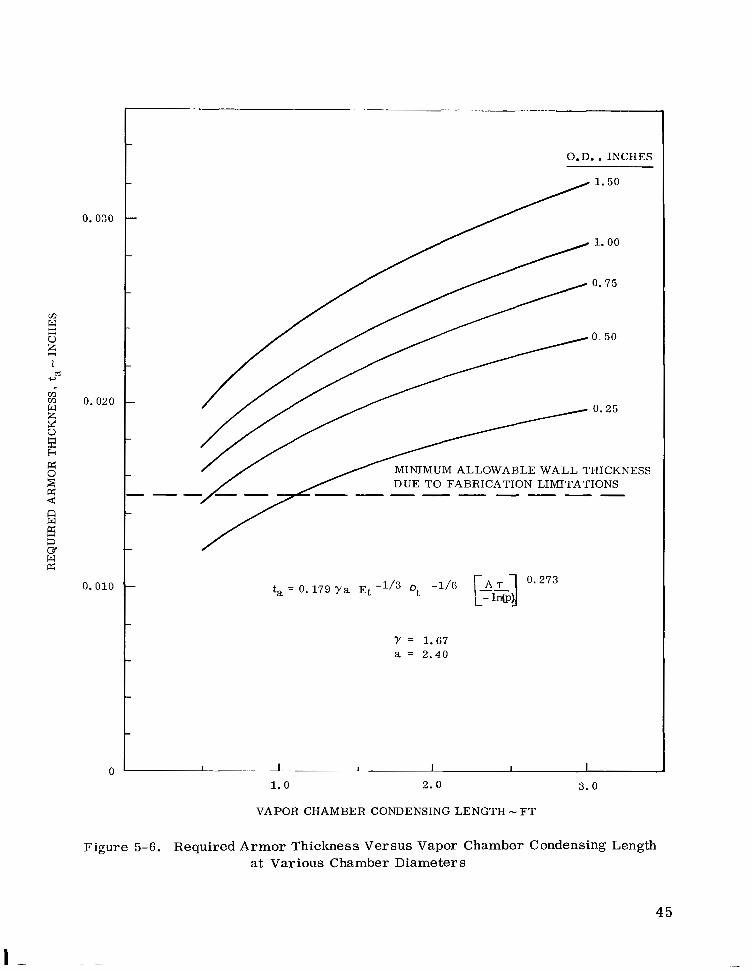
0 . O R O
0.020
0.010
0
r O.D., INCHES
"
/ DUE TO FABRICATION LIMITATIONS MINIMUM ALLOWABLE WALL THICKNESS
Y = 1.67 a = 2.40
1.0 2.0 3 . 0
VAPOR CHAMBER CONDENSING LENGTH - FT
Figure 5-6. Required Armor Thickness Versus Vapor Chamber Condensing Length at Various Chamber Diameters
45
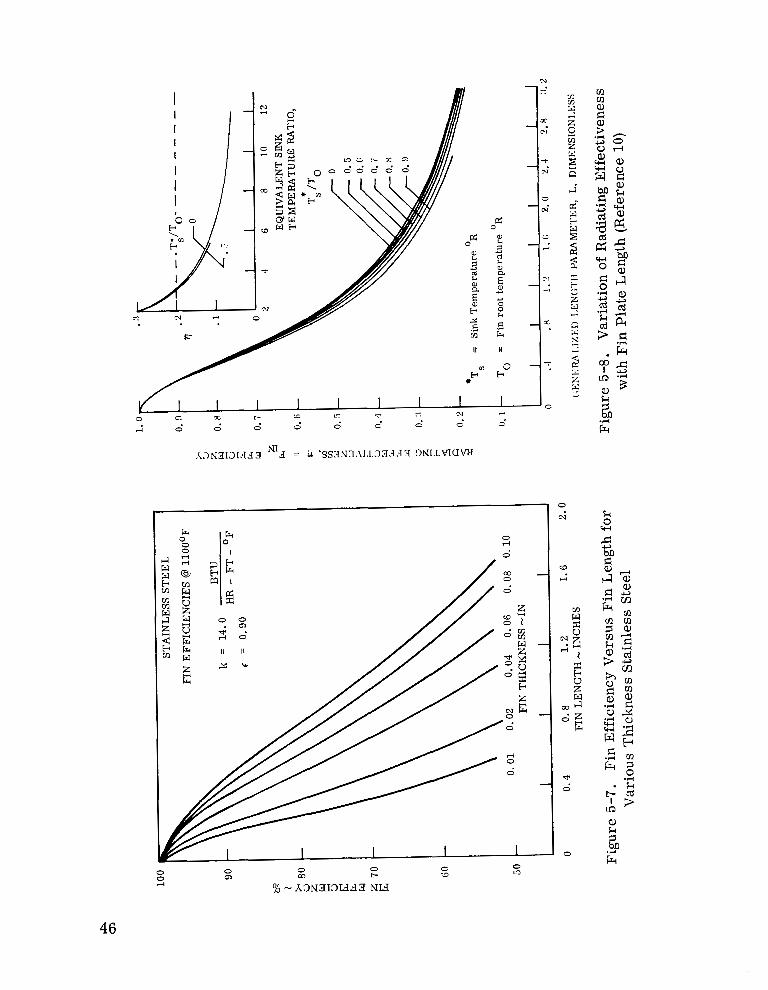
0 m
0 W
0 L1
46
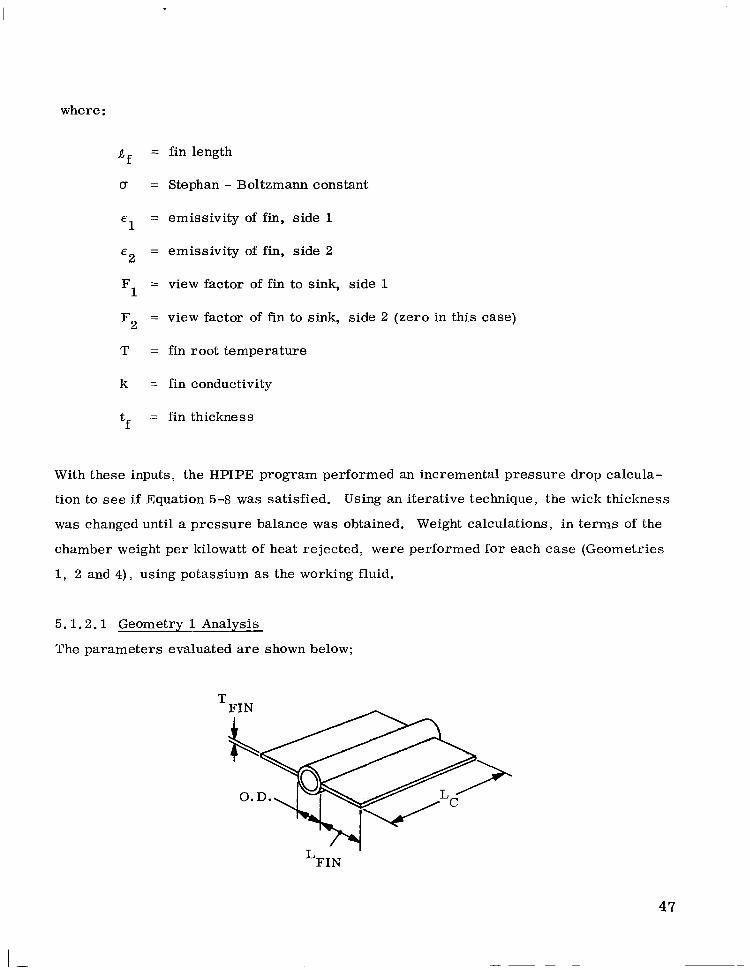
where :
i f - -
( T =
E = 1
E = 2
F1 -
F2 -
-
-
T =
k =
tf - -
fin length
Stephan - Boltzmann constant
emissivity of fin, side 1
emissivity of fin, side 2
view factor of fin to sink, side 1
view factor of fin to sink, side 2 (zero in this case)
fin root temperature
fin conductivity
fin thickness
With these inputs, the HPIPE program performed an incremental pressure drop calcula-
tion to see if Equation 5-8 was satisfied. Using an iterative technique, the wick thickness
was changed until a pressure balance was obtained. Weight calculations, in terms of the
chamber weight per kilowatt of heat rejected, were performed for each case (Geometries
1, 2 and 4), using potassium as the working fluid.
5.1.2.1 Geometry 1 Analysis
The parameters evaluated are shown below;
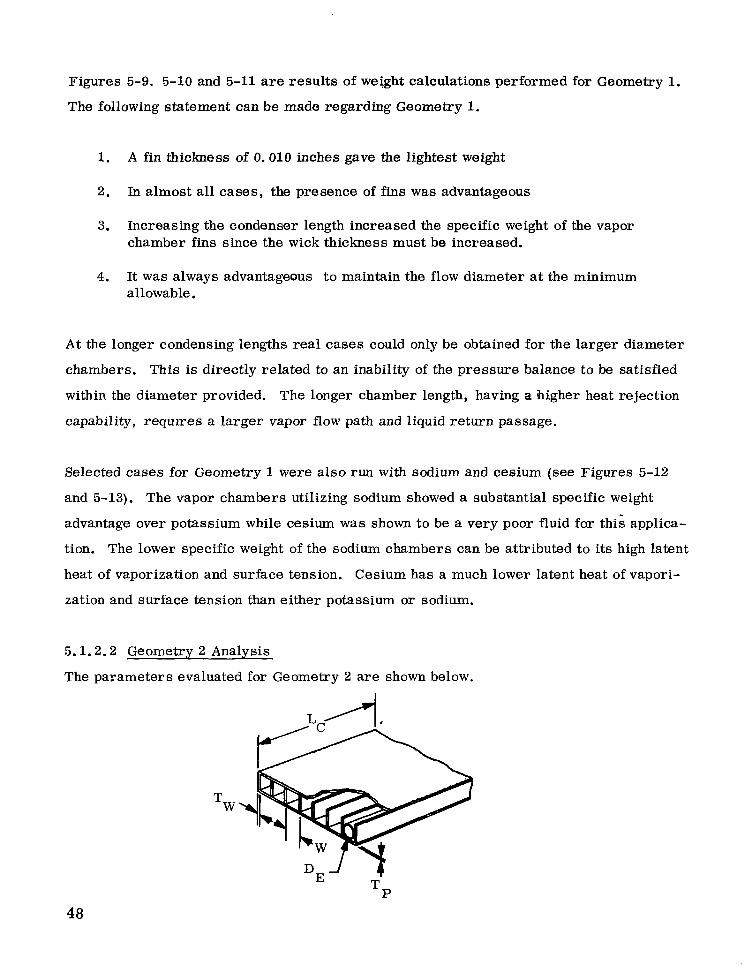
Figures 5-9. 5-10 and 5-11 are resul ts of weight calculations performed for Geometry 1.
The following statement can be made regarding Geometry 1 .
1.
2 .
3.
4.
A fin thickness of 0.010 inches gave the lightest weight
In almost all cases, the presence of fins was advantageous
Increasing the condenser length increased the specific weight of the vapor chamber fins since the wick thickness must be increased.
It was always advantageous to maintain the flow diameter at the minimum allowable.
A t the longer condensing lengths real cases could only be obtained for the larger diameter
chambers. This is directly related to an inability of the pressure balance to be satisfied
within the diameter provided. The longer chamber length, having a higher heat rejection
capability, requlres a larger vapor flow path and liquid return passage.
Selected cases for Geometry 1 were also run with sodium and cesium (see Figures 5-12
and 5-13). The vapor chambers utilizing sodium showed a substantial specific weight
advantage over potassium while cesium was shown to be a very poor fluid for this applica-
tion. The lower specific weight of the sodium chambers can be attributed to its high latent
heat of vaporization and surface tension. Cesium has a much lower latent heat of vapori-
zation and surface tension than either potassium or sodium.
5 . 1 . 2 . 2 Geometry 2 Analysis
The parameters evaluated for Geometry 2 are shown below,
T W
48
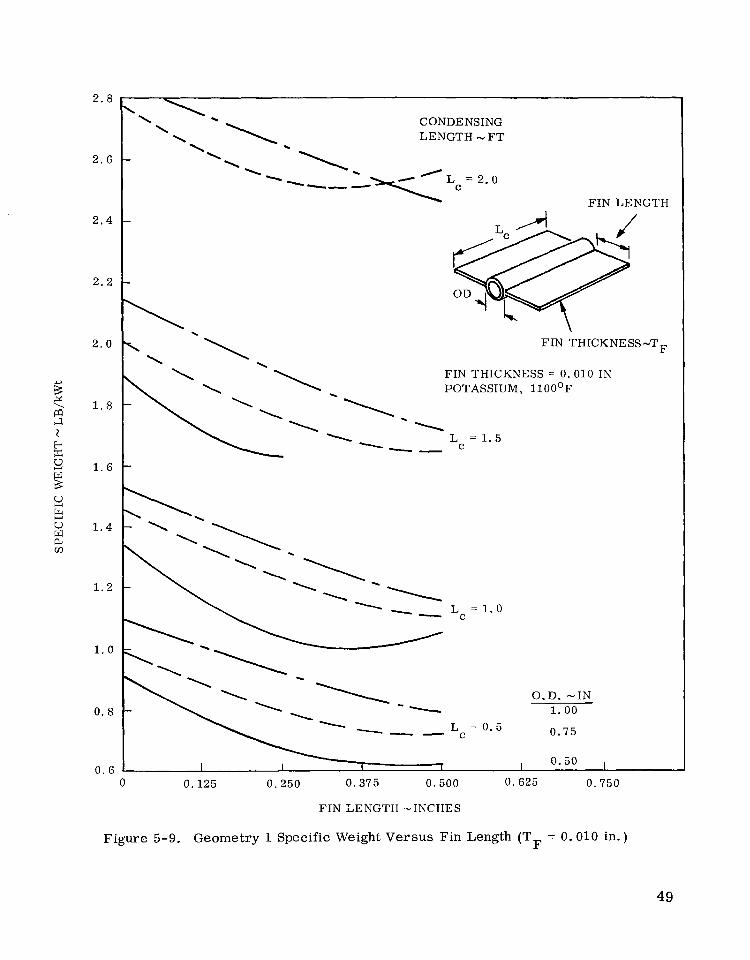
2 .8
2. G
2 . 4
2.2
2 . 0
s "-. 1 . 8 ,x
J. 2
z b
m
$ 1. G
2 u 1.4 W a c13
1 . 2
1.0
0 . 8
0 . G
CONDENSIN( L E N G T H N F
" iT
T
O D 4 1 k \
FIN THICKNESS-TF
FIN THICKNESS = 0.010 IN POTASSIUM, llOO°F
-1 \ L = 1 . 5 "" C
O.D. -IN 1 . 0 0
0.75 "- c L = 0 . 5
I 0.50
0 0.125 0.250 0.375 0.500 0.625 0.750
FIN LENGTH - INCHES
Figure 5-9. Geometry 1 Specific Weight Versus Fin Length (T = 0.010 in.) F
49
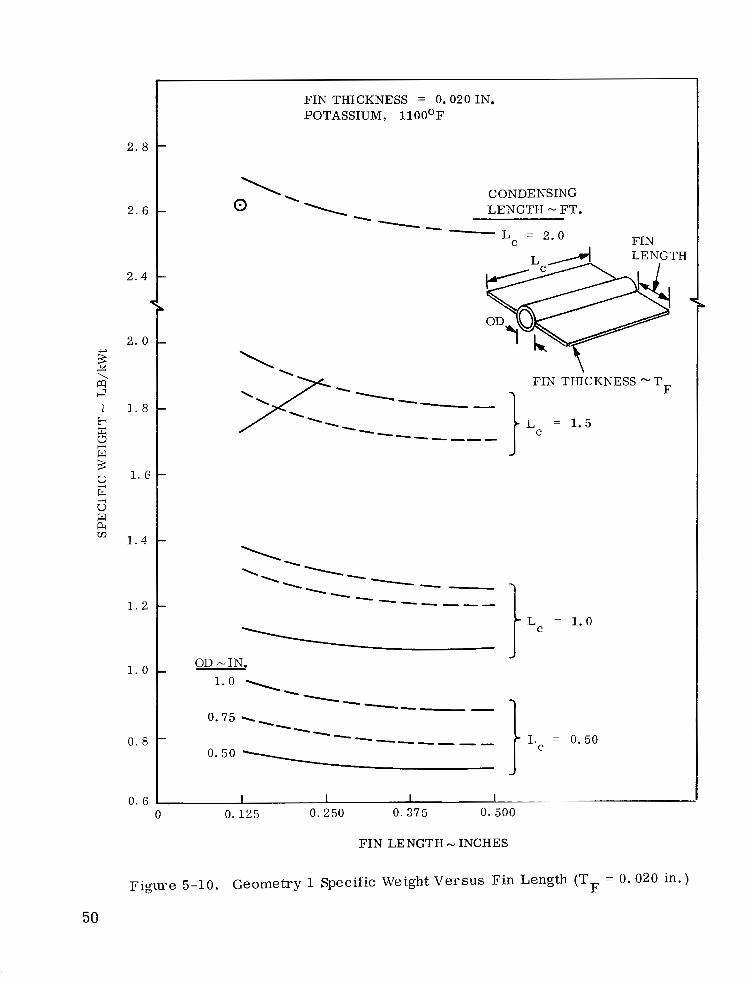
2 . 8
2. G
2.4
2. 0
1. 8
1 .6
1.4
1 . 2
1 . 0
0 . 8
0. G
FIN THICKNESS = 0.020 IN. POTASSIUM, llOO'F
\ 0 \ CONDENSING
1- LENGTH - FT. -" LC = 2.0 FIN
FIN THICKNESS -TF
= 1.5
OD -IN. 1. 0
0.75
0 .50
'i LC = 1.0
I LC = 0.50
0.125 0.250 0.375 0.500
FIN LENGTH - INCHES
Figure 5-10. Geometry 1 Specific Weight V e r s u s Fin Length (T F = 0.020 in.)
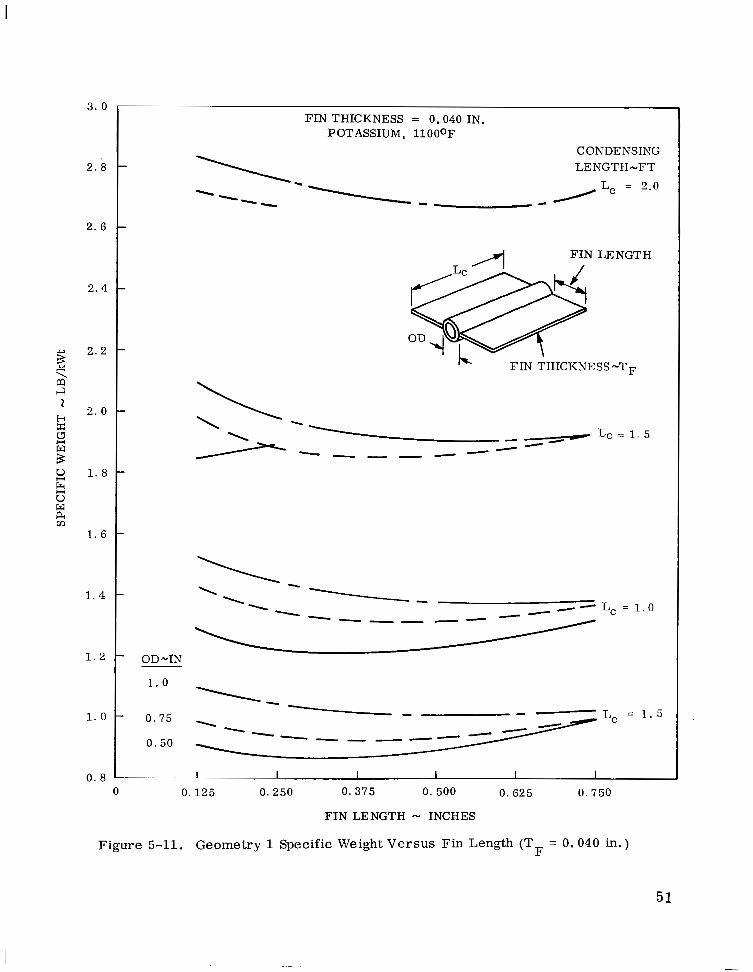
3. 0
2. 8
2. 6
2 . 4
2 . 2
2. 0
1. 8
1. 6
1 . 4
1 . 2
1 . 0
0. 8
OD-ITV
1 . 0
0 .75
0.50
FIN THICKNESS = 0.040 IN. POTASSIUM, llOO°F
CONDENSING LENGTII -FT
\ -" F I N L E N G T H
h FIN THICKNESS-T~
5
\ -" '1 \
- " LC = 1.0 """-
0 0.125 0 .250 0.375 0. 500 0. 625 0 .750
F I N L E N G T H - INCHES
Figure 5-11. G e o m e t r y 1 Spec i f i c Weigh t Ver sus Fin Length (T F = 0.040 in.)
51
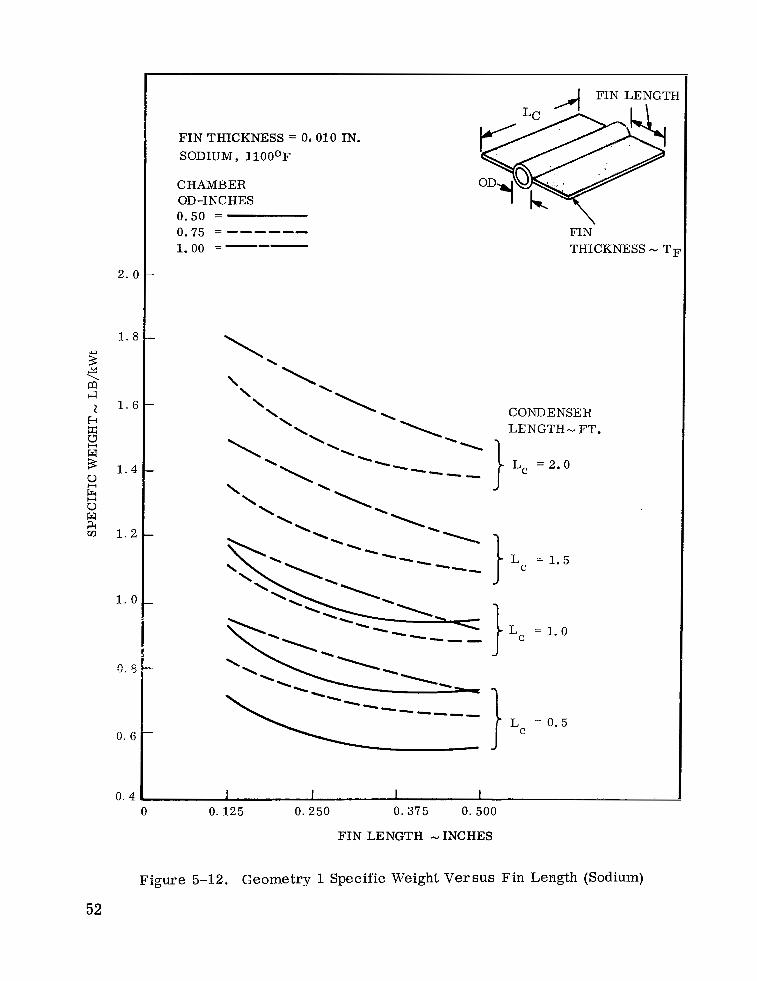
2. 0
1. 8
1. 6
1 .4
1 . 2
1 . 0
0. Ij
0. G
0. 4
FIN THICKNESS = 0.010 IN. SODIUM, llOO°F
C H A M B E R
0.50 = 0.75 = """
1.00 =---
OD-INCHES
F I N THICKNESS - TI
\ \ \ \ \ \ \ \ '\ \
\ '\ 1. '. 1
"" '\ %"
C O N D E N S E R L E N G T H - FT.
LC = 2.0
LC = 1.5
LC = 1.0
LC = 0.5
0 0.125 0.250 0.375 0. 500
FIN LENGTH - INCHES
Figure 5-12. Geometry 1 Specific Weight Ver sus Fin Length (Sodium)
52
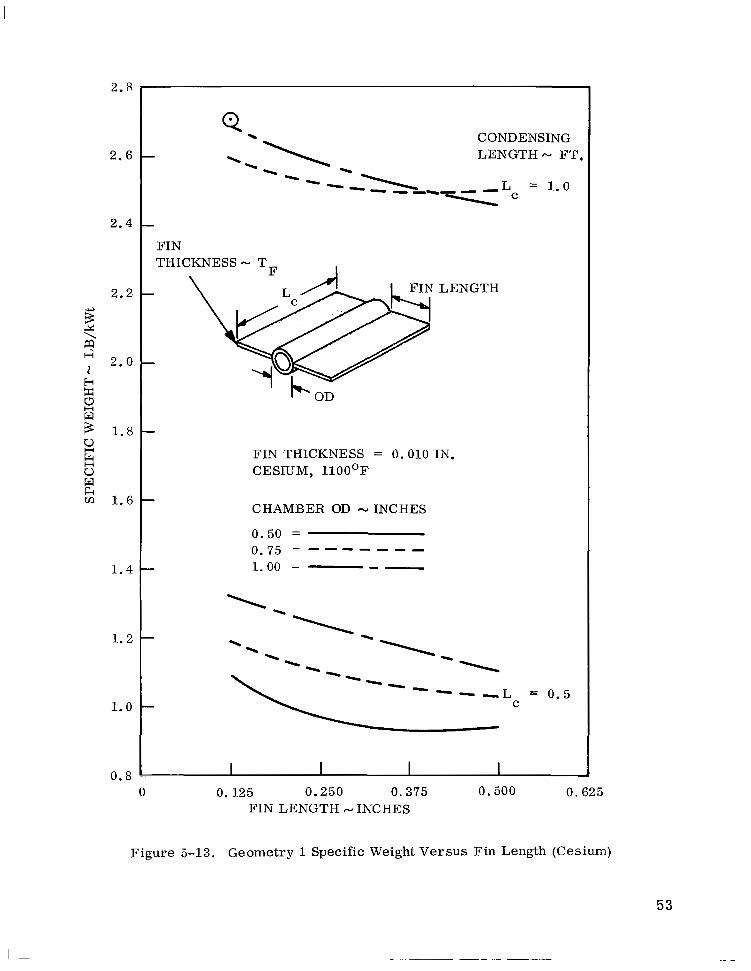
2.8
2.6
2.4
2.2
s X \ a
2.0 2 H m u w 3 1.8
H
E G w 2 1.6
1 . 4
1.2
1.0
0.8
c
?IN CHICKNESS - T, I
FIN THICKNESS = 0.010 IN. CESIUM, llOO'F
CHAMBER OD - INCHES
0.50 = 0.75 = - ------ 1.00 = "
0 0.125 0.250 0.375 0.500 0.625 FIN LENGTH - INCHES
Figure 5-13. Geometry 1 Specific Weight Versus Fin Length (Cesium)
53
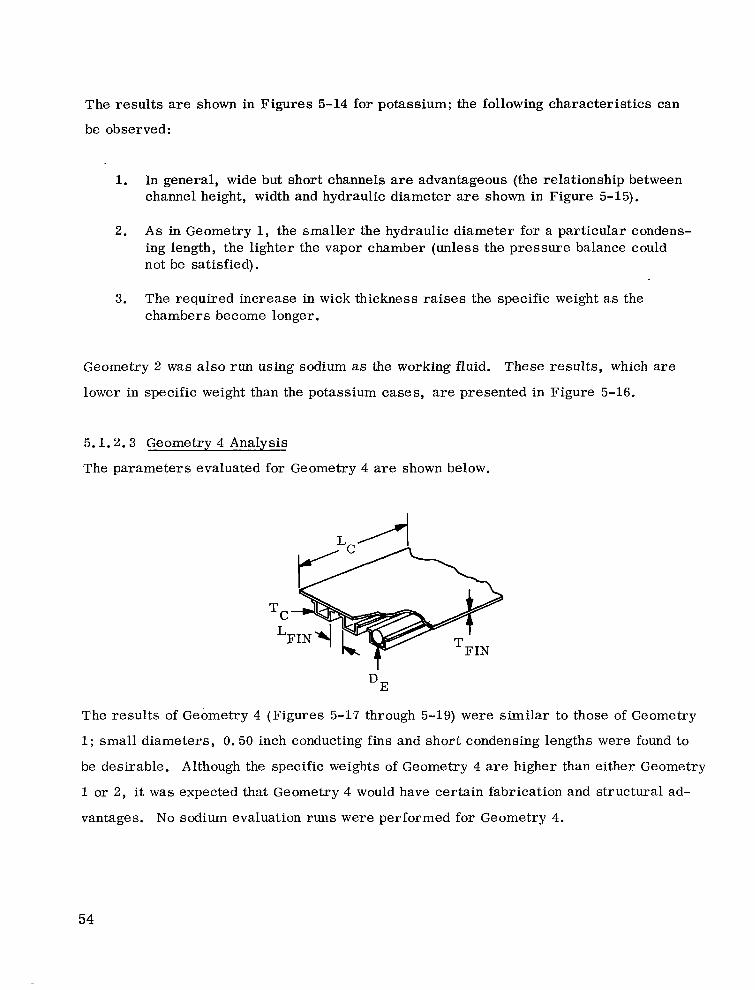
The results are shown in Figures 5-14 for potassium; the following characteristics can
be observed:
1. In general, wide but short channels are advantageous (the relationship between channel height, width and hydraulic diameter are shown in Figure 5-15).
2. A s in Geometry 1, the smaller the hydraulic diameter for a particular condens- ing length, the lighter the vapor chamber (unless the pressure balance could not be satisfied).
3. The required increase in wick thickness raises the specific weight as the chambers become longer.
Geometry 2 was also run using sodium as the working fluid. These results, which are
lower in specific weight than the potassium cases, are presented in Figure 5-16.
5.1.2.3 Geometry 4 Analysis
The parameters evaluated for Geometry 4 are shown below.
The results of Geometry 4 (Figures 5-17 through 5-19) were similar to those of Geometry
1; small diameters, 0.50 inch conducting fins and short condensing lengths were found to
be desirable. Although the specific weights of Geometry 4 are higher than either Geometry
1 or 2, it w a s expected that Geometry 4 would have certain fabrication and structural ad-
vantages. N o sodium evaluation runs were performed for Geometry 4.
54
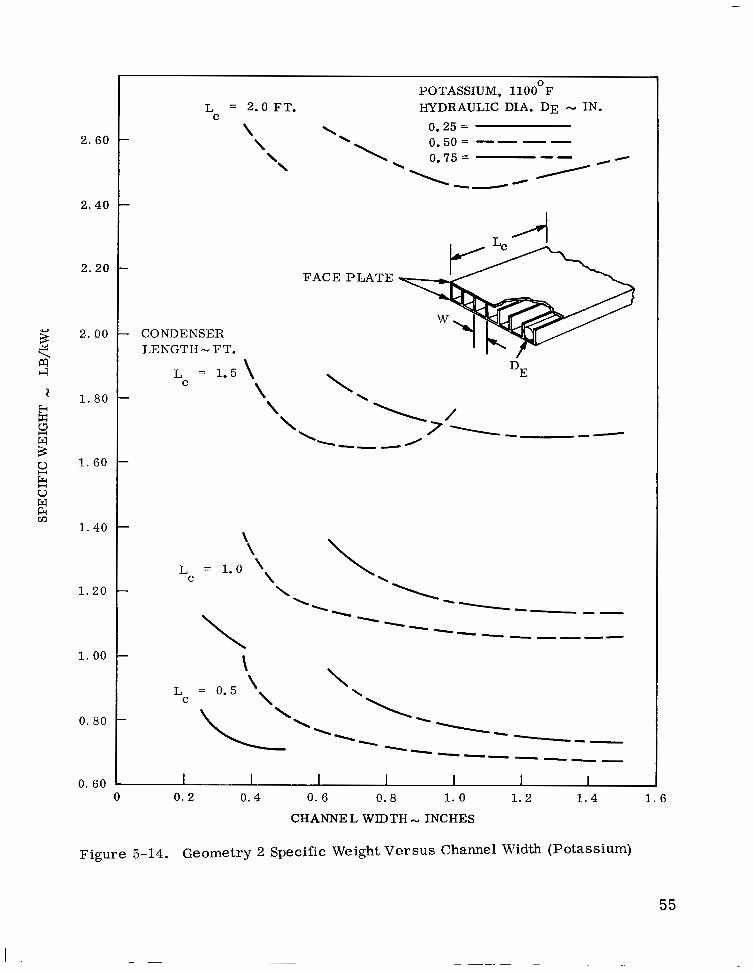
2. 60
2.40
2.20
2. 90
1. 80
1. 60
1.40
1.20
1.00
0. 80
0. 60
P O T A S S I U M , llOO'F L~ = 2.0 FT. HYDRAULIC DIA. DE - IN.
\ '\ 0.25 = \ 0.50 = -- - - '\ \ 0.75 =
\ "
L" 4
F A C E P L A T E
CONDENSER L E N G T H - FT.
L = 1.5 \ C \
DE
\ \
L = 1.0 \ C \ \
\ \
1- "" ""- " """"
0 0. 2 0.4 0. 6 (3.8 1.0 1.2 1.4 1. 6
C H A N N E L W I D T H - I N C H E S
I .
Figure 5-14. Geometry 2 Specific Weight V e r s u s Channel Width (Potassium)
55

1 . 2
1.1
m INCHES w z 1.0 u HYDRAULIC DIAMETER z
DE = EQUIVALENT
H
0.9 - ffi w b
9 0.8 -
2 n 2
0.7 - 4 2 4 0.6 - ffi a *
0.5 -
w = 0.75(
W = 0.625
W = 0.500
w = 0.37:
W = 0.25C
0 0.1 0.2 0.3 0.4 0.5 0.G 0.7 0.8 0.9 1.0 1.1 1 . 2
CHANNEL HEIGHT - INCHES
Figure 5-15. Geometrical Relationships Used for Geometry 2
56
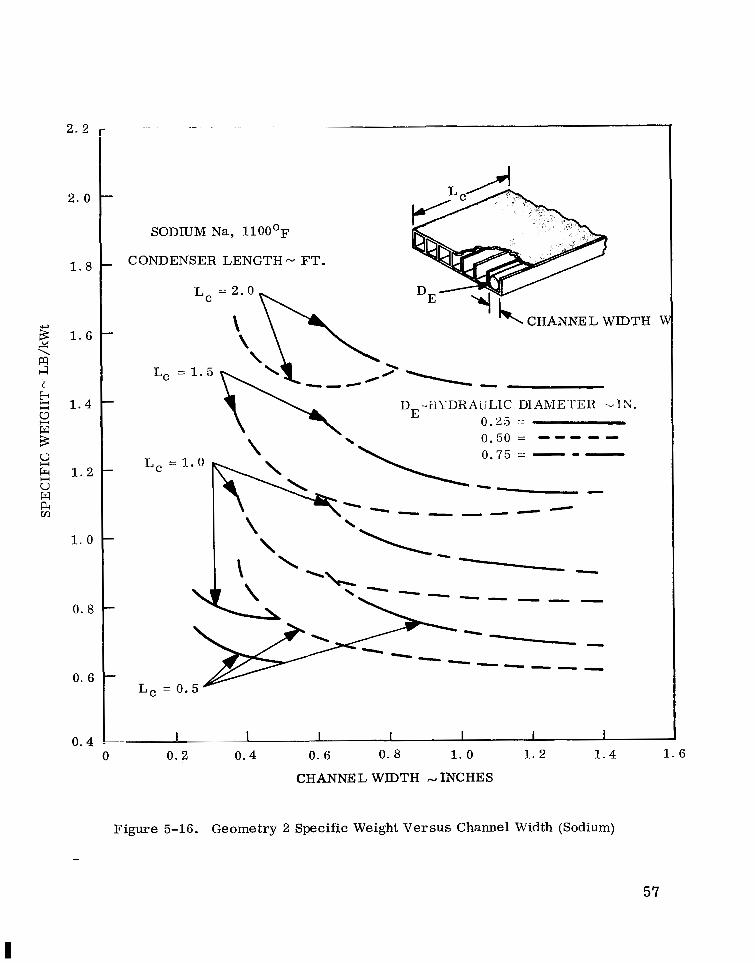
2.2
2. 0
1. 8
1. 6 \ ,v
a b 4
b I
3: 1 . 4 s
2
%
s 9 1.2
w
1. 0
0 . 8
0. 6
0. 4
SODIUM Na, l l O O o ~
CONDENSER LENGTH - FT.
LC = 1 . 0
LC = 0 .
' CHANNEL WIDTH
i-
'"z- """
" ""-
V
1 - -~ I I I I I
0 0. 2 0.4 0. 6 0. 8 1.0 1 . 2 1 . 4 1. 6
CHANNEL WIDTH cI INCHES
Figure 5-16. Geometry 2 Specific Weight Versus Channel Width (Sodium)
57
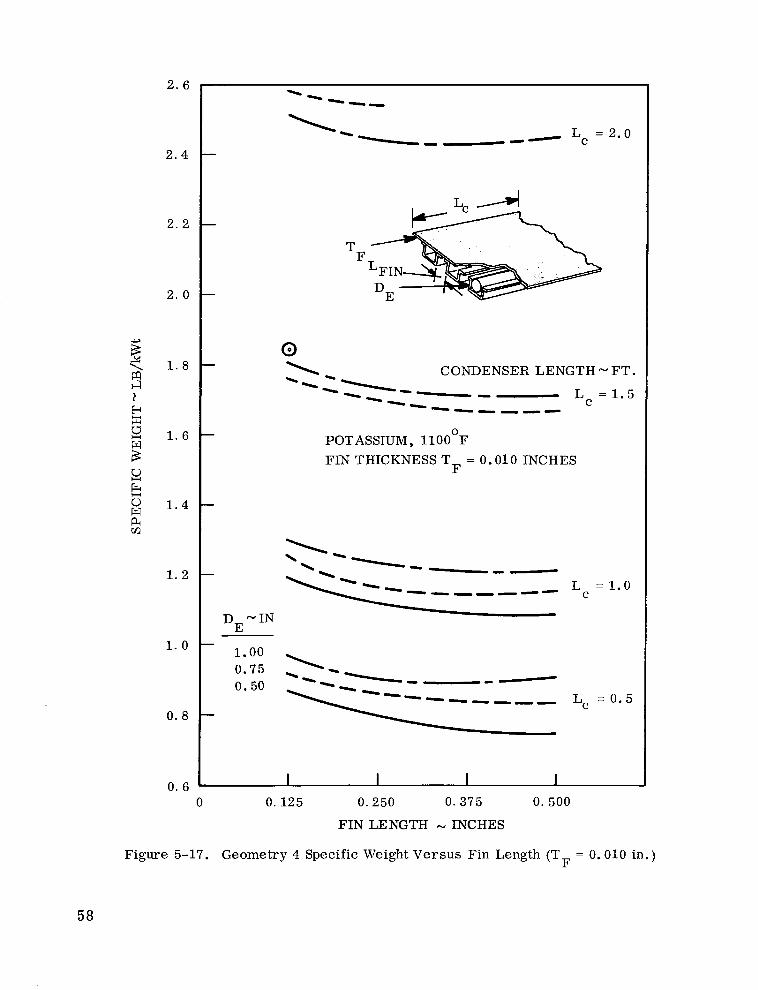
2. 6
2 . 4
2 . 2
2. 0
1 . 8
1. 6
1 . 4
1 . 2
1 . 0
0. 8
0. 6 0
\ ""
1- " -0 - c L = 2.0
T F
@ \ \* CONDENSER LENGTH - FT.
"".", " L = 1 . 5 """"
C
POTASSIUM, llOO°F FIN THICKNESS T = 0.010 INCHES
F
- "- """0-
DEWIN -
"
""""" -
L = 1 .0 C
L = 0 . 5 C
0.125 0.250 0.375 0. 500
FIN LENGTH - INCHES
Figure 5-17. Geometry 4 Specific Weight Versus Fin Length (T = 0,010 in.) F
58
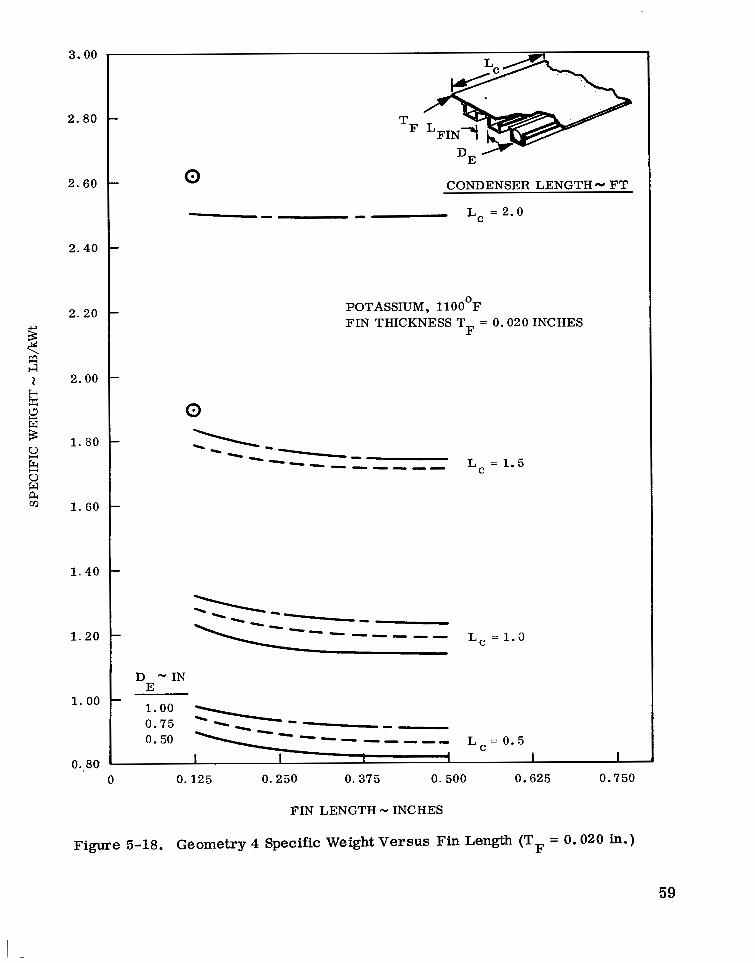
3.00
2.80
2.60
2.40
2.20
2.00
1. 80
1. 60
1 . 4 0
1 .20
1.00
0..80
0
" - LC = 2.0
CONDENSER LENGTH - FT
POTASSIUM, llOO'F FIN THICKNESS TF = 0.020 INCHES
0
> " "- -" ,""", L c = 1 . 5
D - IN E 1.00
0.50 1 0 . 7 5 : - ""- " - ""7 ""9
I I I
0 0.125 0.250 0.375 0.500 0.625 0.750
FIN LENGTH - INCHES
Figure 5-18. Geometry 4 Specific Weight Versus Fin Length (T = 0.020 in-) F
59
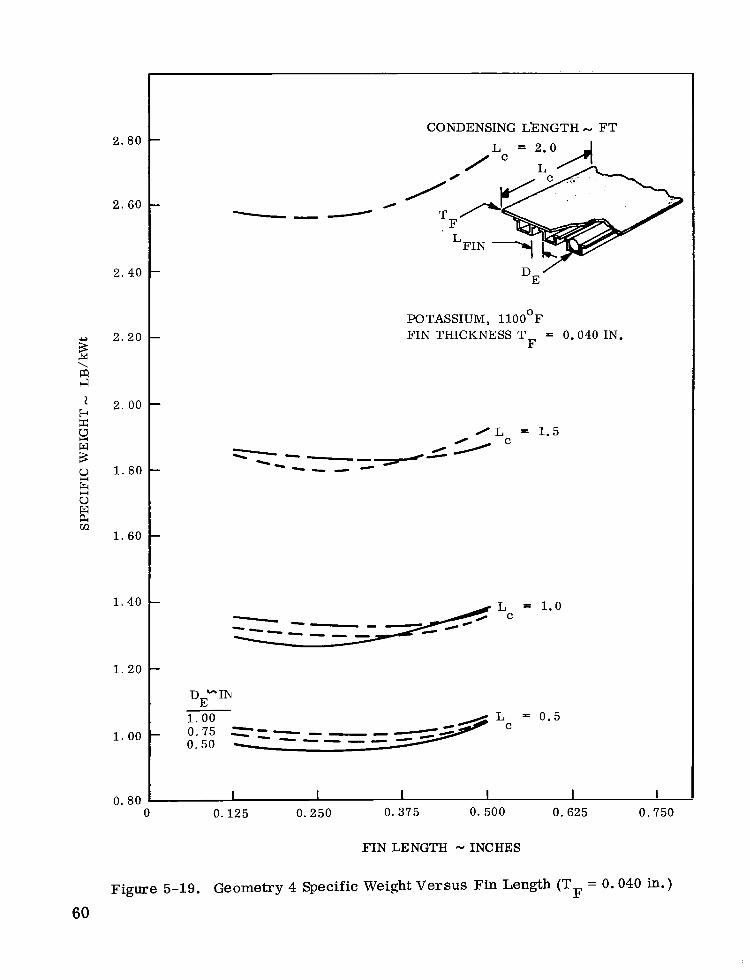
CONDENSING L'ENGTH - FT 2.80
2 .60
2. 40
2.20
2. 00
1. 80
1. 60
1 . 4 0
1 . 2 0
1.00
0. 80
L = 2.0
POTASSIUM, llOO'F FIN THICKNESS T = 0.040 IN.
F
O L = 1.5
- "
1 . 0 0
0.50 z - 0.75 ==- - - -
""L
0 0.125 0.250 0.375 0.500 0.625 0.750
F I N L E N G T H - I N C H E S
Figure 5-19. Geometry 4 Specific Weight Versus Fin Length (T F = 0.040 in. )
60
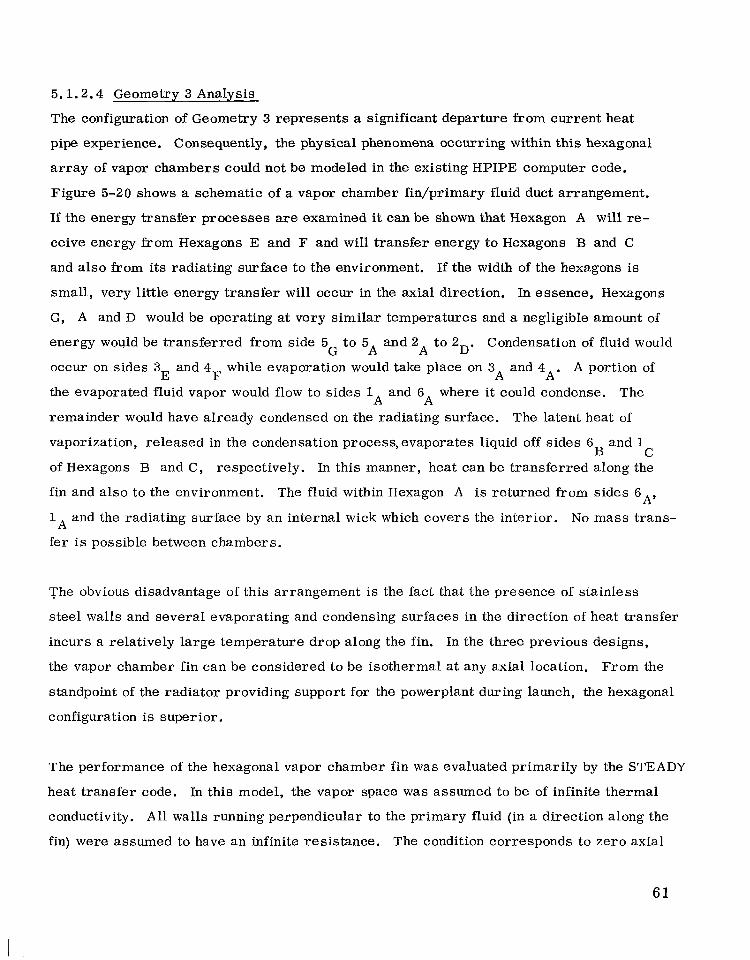
5.1.2.4 Geometry 3 Analysis
The configuration of Geometry 3 represents a significant departure from current heat
pipe experience. Consequently, the physical phenomena occurring within this hexagonal
a r ray of vapor chambers could not be modeled in the existing HPIPE computer code.
Figure 5-20 shows a schematic of a vapor chamber fin/primary fluid duct arrangement.
If the energy transfer processes are examined it can be shown that Hexagon A will re-
ceive energy from Hexagons E and F and will transfer energy to Hexagons B and C
and a l so kom its radiating surface to the environment. If the width of the hexagons is
small, very little energy transfer will occur in the axial direction. In essence, Hexagons
G, A and D would be operating at very similar temperatures and a negligible amount of
energy would be transferred from side 5 to 5 and 2 to 2D. Condensation of fluid would
occur on sides 3 and 4 while evaporation would take place on 3 and 4 A portion of E F A A ' the evaporated fluid vapor would flow to sides 1 and 6 where it could condense. The
remainder would have already condensed on the radiating surface. The latent heat of
vaporization, released in the condensation process,evaporates liquid off sides 6 and 1 B C
of Hexagons B and C, respectively. In this manner, heat can be transferred along the
fin and also to the environment. The fluid within Hexagon A is returned from sides 6 A' 1 and the radiating surface by an internal wick which covers the interior. N o mass trans-
fer is possible between chambers.
G A A
A A
A
The obvious disadvantage of this arrangement is the fact that the presence of stainless
steel walls and several evaporating and condensing surfaces in the direction of heat transfer
incurs a relatively large temperature drop along the fin. In the three previous designs,
the vapor chamber fin can be considered to be isothermal at any axial location. From the
standpoint of the radiator providing support for the powerplant during launch, the hexagonal
configuration is superior,
The performance of the hexagonal vapor chamber fin w a s evaluated primarily by the STEADY
heat transfer code. In this model, the vapor space was assumed to be of infinite thermal
conductivity. A l l walls running perpendicular to the primary fluid (in a direction along the
fin) were assumed to have an infinite resistance. The condition corresponds to zero axial
61

MODEL UNIT CELL
I
I I
I
1 ADIABATIC 'I L LINE
SCREEN
LIQUID SODIUM l l EVAPORATI
CONDENSATION
1 STAINLESS STEEL WALL
Figure 5-20. Hexagonal Geometry Computer Code Model
62

energy transfer. A l l other walls were assumed to consist of three resistances in series:
a O.OO9-inch layer of fluid (condensing surface), a sheet of stainless steel which formed
the hexagon wall and a 0.009-inch layer of fluid which formed the evaporative wall. N o
vapor/liquid interface resistances were included and all heat transfer was assumed to be
by conduction. A liquid layer of 0.009 inches was chosen since this corresponded to the
thickness of a single layer of 100 x 100 mesh sintered screen. In all cases, sodium was
considered to be the working fluid. Parameters evaluated are shown below.
T P
The temperature distribution along the hexagonal vapor chamber fin is not continuous,
but rather, stepwise. For convenience, the results from the STEADY computer program
have been plotted in Figures 5-21 through 5-23 as a continuous function. From these illus-
trations, the following facts are evident:
1. The larger cell sizes incur fewer temperature drops, thereby maintaining a nearly isothermal fin
2. The smaller cell sizes which produce the best structure induce large tempera- ture drops along the fin
3. Varying the wall thickness of the hexagonal core has only a moderate effect on performance.
The heat transfer results of the STEADY computer code were combined with weight cal-
culations for the hexagonal geometry to obtain the specific weight as a function of condens-
ing length, facing thickness, core thickness and cell size.
63

CORE WALL - IN. 0.005
l l n n 1 n nln LA""
1000 .
900 1
I 2 O 0 r
w. " L W
0.020 CELL SIZE = 3.0 IN.
SODIUM, llOO°F FIN LENGTH = 6.0 IN.
CORE HEIGHT
CORE THICKNESS SIZE
-'' FACING THICKNESS 1100 0.005
0.010 0.020
CELL SIZE = 1.5 IN. 1000 L
1100
1000 - 0.005 0.010
0.020
t CELL SIZE = 0.5 IN.
0 1 2 3 4 5 6
DISTANCE ALONG FIN - IN.
Figure 5-21. Geometry 3 Hexagonal Fin Temperature Prof i les {Fin Length = 6 in.)
64

1100
1000
1100
lk 1000 0
?
b 4 900 p: w g 1100 I4 I 3
LOO0
9 0
800
700
- CORE THICKNESS -L'3, FA.CING THICKNESS
0.005 - u.010 L CELL SIZE = 3.0 IN. 0. 0x0
SODIUM, llOO°F FIN LENGTH = 12.0 IN.
0. 0. - CELL SIZE = 1.5 IN. 0.
0.
0.
0. 0 2 4 6 8 10 12
DISTANCE ALONG FIN - IN.
005 010
020
005
010
020
Figure 5-22. Geometry 3 Hexagonal Fin Temperature Profiles (Fin Length = 12 in;)
65
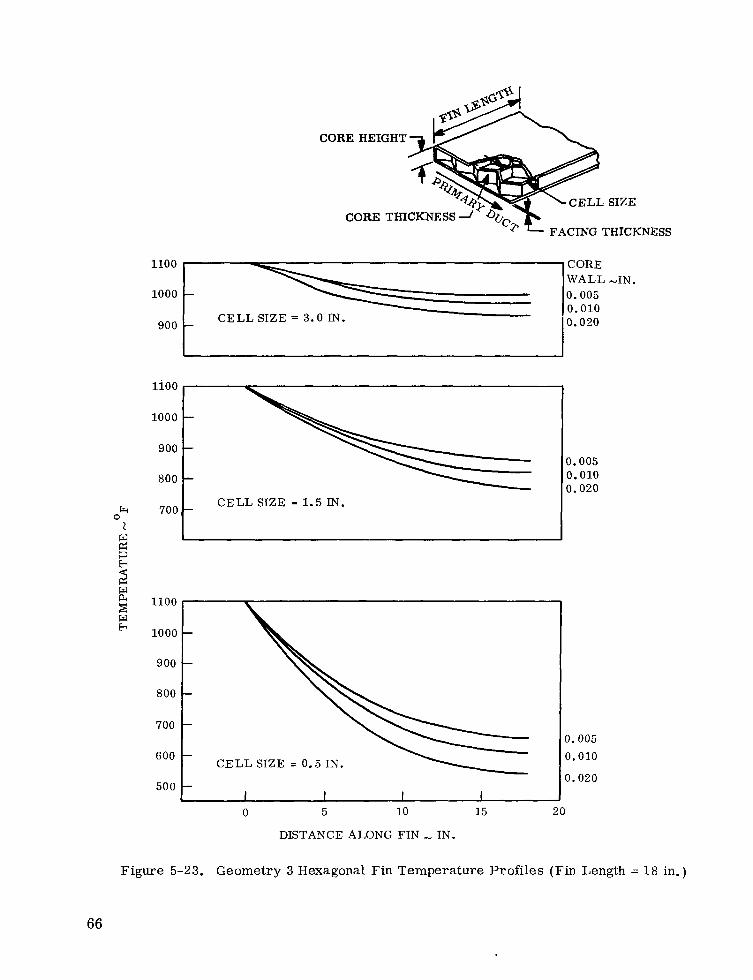
CORE HEIGHT
CORE THICKNESS FACING THICKNESS
CORE THICKNESS -/ *
900 C E L L S I Z E = 3 .0 IN.
CORE W A L L -IN. 0.005 0.010 0.020
iioo
1000 -
900 - 0.005 0.010 0.020
800 - 700 ,-
C E L L S I Z E - 1.5 IN.
1100
1000
- 900
-
800 -
700 -
600 - C E L L S I Z E = 0.5 IN.
500 - I I I I 0 5 10 15 20
DISTANCE ALONG FIN - IN.
0.005
0.010
0.020
Figure 5-23. Geometry 3 Hexagonal Fin Temperature Profiles (Fin Length = 18 in.)
66

Figures 5-24, 5-25 and 5-26 show the specific weight versus the cell size for core heights
of 0.250, 0.500 and 0.750 inches, respectively; for these cases, the core thickness was
kept equal to the facing thickness. Obviously, from a thermal standpoint the lightest cases
wi l l consist of large cell sizes and thin faces and walls.
, By factoring the structural considerations of this design into the problem, a more concise
and meaningful presentation of the results is possible. Initially, the radiator will be sub-
jected to atmospheric pressure while on the launch pad. For large cell sizes and thin fac-
ings, the radiator can become seriously deformed. In order to limit deformation during
this period, the cell facing was allowed to deflect a distance equal to one-half of its thick-
ness. This criteria is considered to be the limit of the elastic region. The following
minimum facing thicknesses were stipulated:
Cell Size (in.)
0.500
1.000
1.500
Facing Thickness (in. )
0.005
0.010
0.020
By imposing these constraints on the results of Figures 5-24, 5-25 and 5-26, a locus of
minimum weight radiators can be defined for each condensing length. This procedure is
indicated on the respective figures.
Since thin core material is desirable from a heat transfer standpoint and relatively thick
facing material is required kom structural considerations, additional cases were generated
in which the facing thickness was varied with a constant core thickness of 0.005 inches.
These cases are shown in Figures 5-27 through 5-30. For each cell size,core height and
vapor chamber length, it is now possible to select the minimum weight case. These results
are shown in Figure 5-31. A t vapor chamber lengths of 0.50 and 1.00 foot, the 0.250 inch
core height is lighter. However, the 0.500-inch core height becomes more advantageous
as the chamber is lengthened due to the need for more heat transfer area. Optimum cell
sizes fell in the range between 0.75 and 1.00 inch. The data for the 2.0-foot vapor chamber
length curves were extrapolated. 67
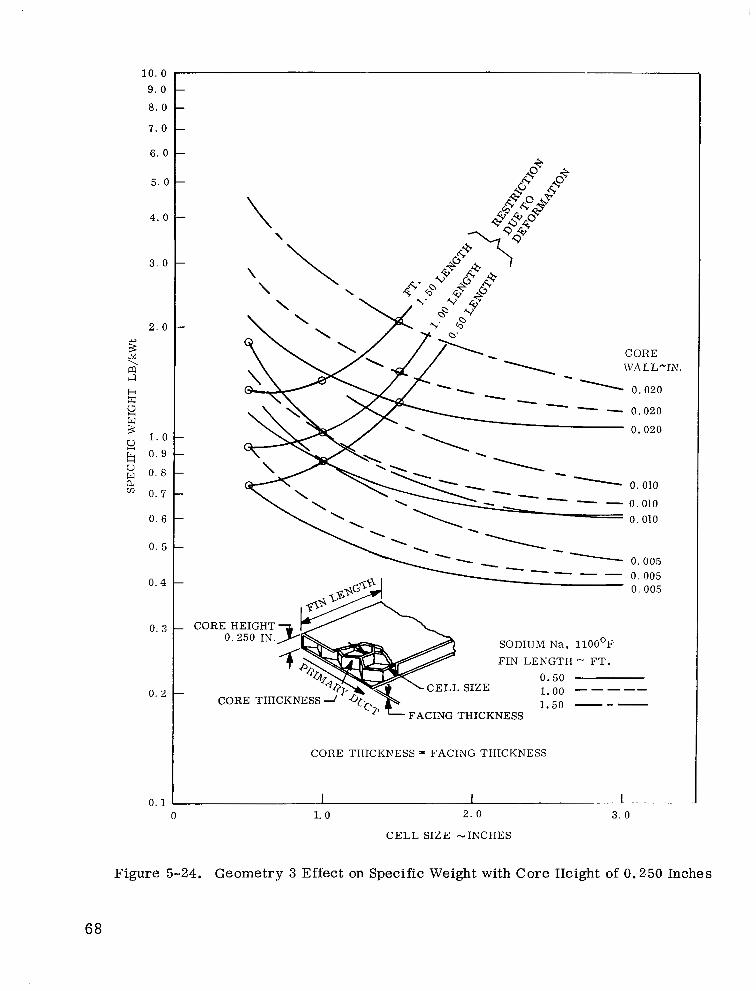
10. 0 9. 0
8. 0
7. 0
6 . 0
5. 0
4 . 0
3 . 0
2 . 0
5 2 \ a ;I
b z s w 2 5
1 . 0
3 0. 9
0. 8 ' 0 . 7
0. 6
0. 5
0 .4
0. 3
0 . 2
0 . 1 0
- 0,020
0.020
\ '. \"- - - - - 0.010 " 0.010
0.005
- CORE HEIGHT SODIUM Na, llOO'F FIN LENGTH - FT.
1.00 ----- 1.50 ---
-/' -FACING THICKNESS
CORE THICKNESS FACING THICKNESS
1 . .~ ~~ 1 " . c~~ 1. 0 2. 0 3.0
CELL SIZE "INCHES
Figure 5-24. Geometry 3 Effect on Specific Weight with Core Height of 0.250 Inches
68
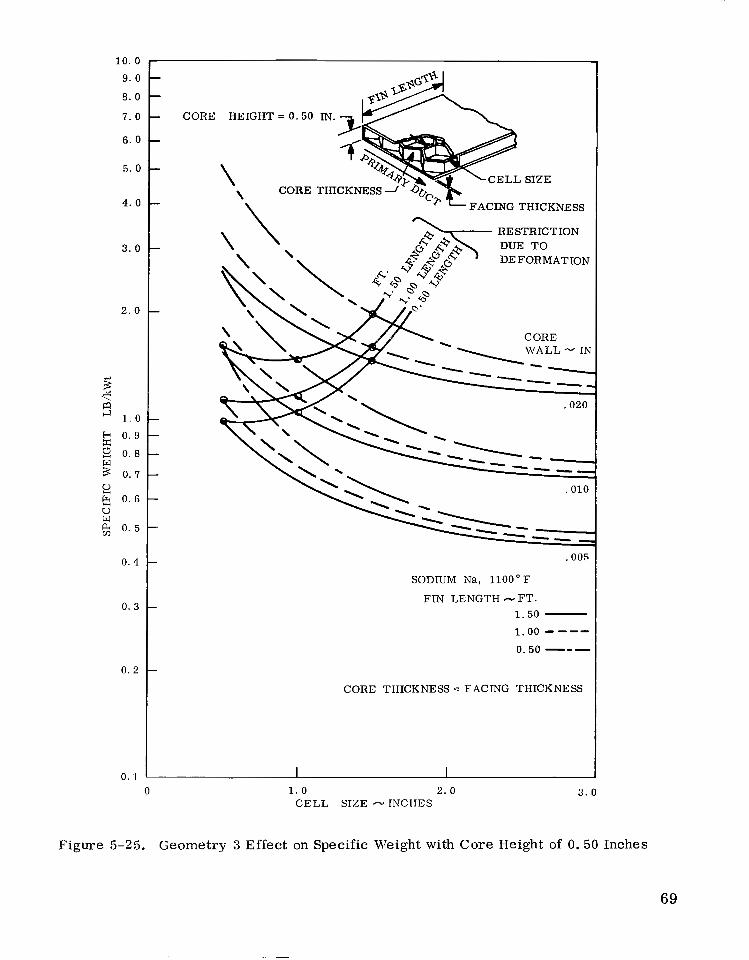
10. 0
9. 0
8. 0
7.0
6. 0
5. 0
4. 0
3.0
2. 0
z a 1 . 0
.+ F4
e 0. 9 z w S 0. a 3 0. 7 8 & 0. 6
a, 0. 5
V w
0. 4
0. 3
0 .2
0 .1 0
CORE
SODIUM Na, llOO'F
FIN LENGTH - FT. 1.50 - 1.00 - --- 0.50 ---
CORE THICKNESS = FACING THICKNESS
1.0 2 .0 CELL SIZE - INCHES
3.0
Figure 5-25. Geometry 3 Effect on Specific Weight with Core Height of 0.5G Inches
69
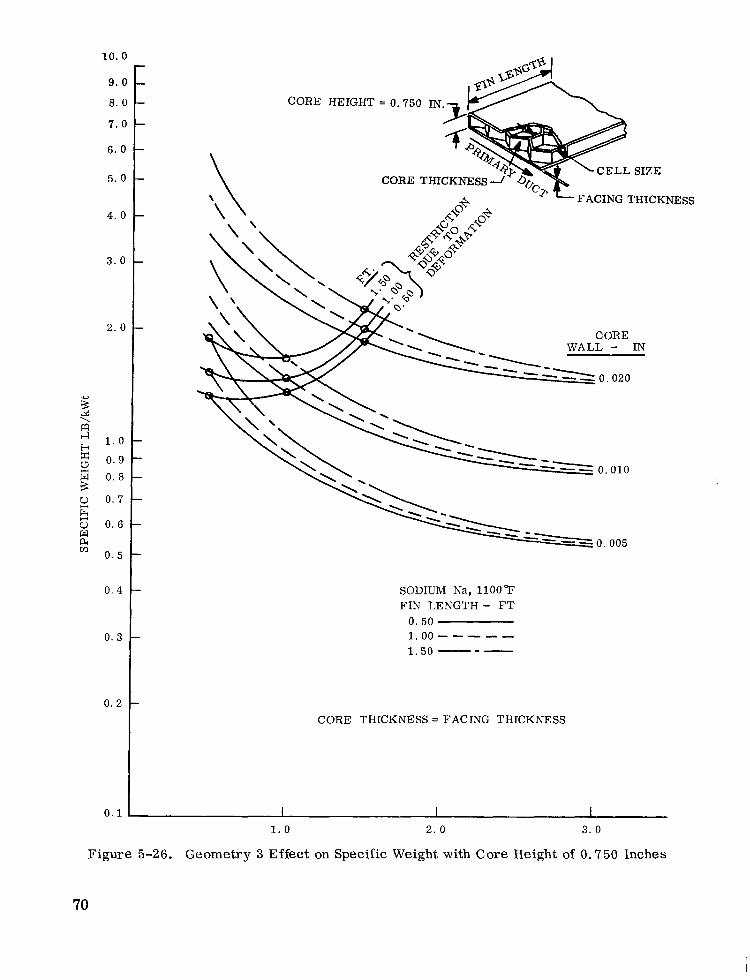
10. 0
9 . 0
a. o 7.0
6. 0
5. 0
4.0
3. 0
2. 0
2 a GI 1.0
B !z 0.9
2 0 .7
2
%
24 \
-P
; 0. 8
u 0. 6 w 0. 5
0 . 4
0 . 3
0 . 2
0.1
CORE HEIGHT = 0.750 IN
CORE THICKNESS
FACING THICKNESS
CORE WALL - IN
SODIUM Na, 1100°F FIN LENGTH - FT
0. 50 1.00""- 1.50 ---
CORE THICKNESS = FACING THICKNESS
1.0 2 . 0 3. 0
Figure 5-26. Geometry 3 Effect on Specific Weight with Core Height of 0.750 Inches
70

10. 0 9. 0
a. 0
7 . 0
6. 0
5. 0
4. 0
3. 0
2 2 . 0 2 \ !n I4 6 z !2
8 tr: 1.0
h
z V w 0. 9
0. a 0. r 0. 6
0. 5
0.4
0.3
0 . 2
0.1
SODIUM Na. llOO°F
CORE HEIGHT = 0.250 IN.
FACING THICKNESS = 0.010 IN. CORE THICKNESS = 0.005 IN.
1.0 2 . 0 CELL S I Z E .-a INCHES
3 . 0
Figure 5-27. Geometry 3 Effect on Specific Weight with Facing Thickness of 0.010 Inches
71
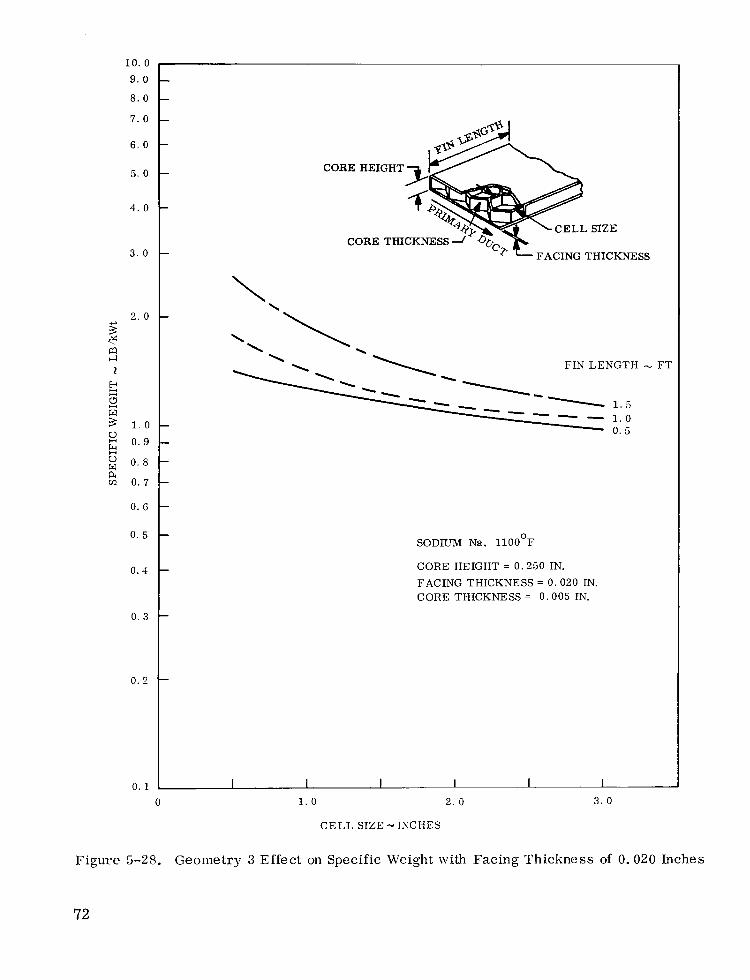
10. 0
9. 0
8 . 0
7 . 0
6 . 0
5. 0
4. 0
3 . 0
2. 0 2 3 2
1
z r? (3
E 3 1 . 0
2 0 . 9
0. 8
2 0 . 7
0. G
0. 5
0.4
0 . 3
0 . 2
0 . 1 0
CORE HEIGHT
CORE THICKNESS SIZE
-/' FACING THICK mss
\
FIN LENGTH - FT
SODIUM Na, llOO'F
CORE HEIGHT = 0.250 IN. FACING THICKNESS = 0.020 IN. CORE THICKNESS = 0 .005 IN.
1 . 0 2. 0
C E L L SIZE - TSCHES
3.0
Figure 5-28. Geometry 3 Effect on Specific Weight with Facing Thickness of 0. 020 Inches
72

10. 0 9. 0
a. 0 7 . 0
6. 0
5. 0
4. 0
3. 0
s 3
2.0 T.
l+ I
z w s 3 u, 1 . 0
5 0.9
a, 0. 8
0.7
0. 6
0. 5
0 . 4
0.3
0. 2
0.1 0
CORE HEIGHT 7
SIZE CORE THICKNESS azo,>
-<’ FACING THICKNESS
FIN LENGTH FT.
0 . 5
SODIUM Na. 1100°F CORE HEIGTH = 0.500 IN. FACING THICKNESS= 0.010 IN. CORE THICKNESS = 0 .005 IN
1.0 2 . 0
CELL SIZE - INCHES
3 . 0
Figure 5-29. Geometry 3 Effect on Specific Weight with Facing Thickness of 0.010 Inches and Core Height of 0 . 5 Inches
73

9. a 8 . 0
7. c
6 . 0
5. a
4. a
3.0
2. 0
1 . 0
0. 9
0. 8
0. 7
0. 6
0. 5
0.4
0 . 3
0. 2
0.1 0
IRE THICKNESS 1
1.0 2 . 0
CELL SIZE - INCHES
3.0
CORE
C( SIZE
.HICK 'NESS
FIN LENGTH FT.
0 . 5
SODIUM Na. 1100'F CORE HEIGTH = 0.500 IN, FACING THICKNESS = 0.020 IN, CORE THICKNESS = 0.005 IN.
Figure 5-30. Geometry 3 Effect on Specific Weight with Facing Thickness of 0.020 Inches and Core Height of 0.5 Inches
74
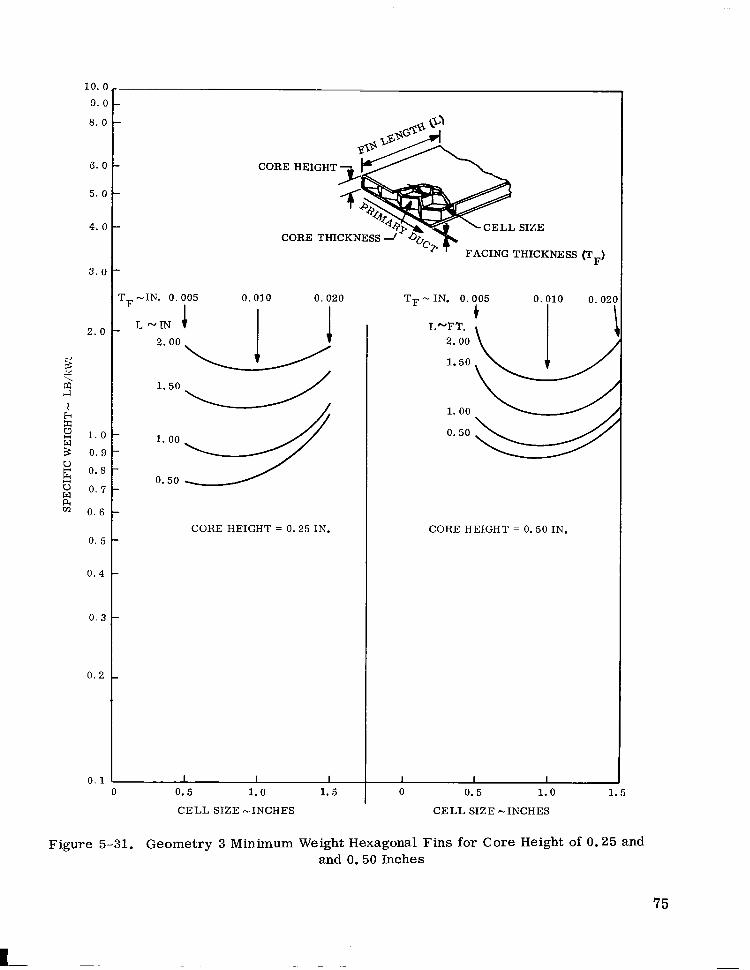
10. 0
9. 0
8 . 0
6. 0
5. 0
4. 0
3 . 0
2 . 0
5 - \
r-1
b 1
z
a
; u 1.0
5 0. 9
B u 0. 7
k? 0.8
w ' 0 . 6
0. 5
0 . 4
0. 3
0 .2
0.1
I
0
r, -IN. 0 .005 0.010 0 .020 T
L -rN I
0. 1-oo9 50
CORE HEIGHT = 0.25 IN.
CELL SIZE "INCHES
SIZE
' C T FACING THICKNESS
TF ... IN. 0.005 0 + L "FT.
2.00 \ p'"
0.02(
1
CORE HEIGHT = 0.50 IN.
I I I 0 0.5 1.0
CELL SIZE "INCHES
Figure 5-31. Geometry 3 Minimum Weight Hexagonal Fins for Core Height of 0.25 and and 0.50 Inches
75

On a preliminary basis the hexagonal configuration does not demonstrate an advantage
over the other geometries. This is a direct result of the temperature drop imposed in
going from one cell to the next. Other approaches were examined which tried to take
advantage of the honeycomb structure, yet did not involve a temperature drop in going
from cell to cell. For example, by drilling small holes in the core, fluid could be trans-
ported from one cell to the next. This concept presented two problems: a pressure drop
(and attendant temperature drop) would be incurred during passage through the holes, and
secondly, the return fluid wicking would be extremely difficult to design and fabricate.
The relationship between the vapor temperature drop and required flow area is shown in
Figure 5-32 for a specific case.
500
R 400
2 PI 0 Ei CI
Ei ;>
P; w
0
300
2
200
E 4 * (d
zl 100
0
FIN LENGTH CORE HEIGHT
I \
FIN LENGTH = 6 . 0 INCHES CORE HEIGHT = 0.250 INCH CELL SIZE = 0.5 INCH
I I 0 0.2 0. 4 0. 6 0 . 8 1
FLOW AREUAREA OF HEXAGONAL SIDE
. c
Figure 5-32. Axial Vapor Temperature Drop for Hexagonal Configuration with Holes
76

5.2 VAPOR ~~ "" CHAMBER FIN INTEGRATION EVALUATION
The next portion of the analysis examined the integration of vapor chamber geometries with
the primary duct and effect of the primary fluid ducts on the overall radiator design. Two
basic nonfinned duct configurations were considered. One concept which allows heat to be
transferred to both sides of the heat pipe evaporator section, is shown in Figure 5-33 as
integrated with Geometries 1 and 2. This concept should result in a higher effective radi-
ating temperature and a smaller radiator area. The second concept, Figure 5-34 is a self-
contained fluid duct which can transfer heat from only one of its surfaces. Unlike the f i rs t
concept, the primary fluid is not in direct contact with the vapor chambers. However, this
arrangement provides the primary fluid ducts with meteoroid "bumper" protection and is
considerably easier to fabricate.
In order to draw a comparison between each radiator vapor chamber condenser geometry
from an integration and total radiator standpoint, a computer code was written which would
calculate: required primary duct size, primary duct armor thickness, total radiator area,
radiator duct weight and fluid pump work. These results were then combined with data pre-
vioulsy obtained from the vapor chamber condenser/fin analysis. In this fashion, a total
radiator weight was calculated as a function of condenser length.
Figure 5-35 illustrates the logic utilized in calculating the weight of the fluid ducts and
system pump work weight penalty. Although the logic is identical, two sets of equations
were utilized within the code so as to reflect both primary duct concepts. Since the required
length of the primary fluid ducts and the required armor thickness are interdependent, an
iteration loop was necessary to effect a solution. The final output from the code was the
primary fluid duct system weight as a function of duct width and vapor chamber fin condens-
ing length.
One important aspect of the primary duct design is the flow velocity. This parameter
strongly influences the primary duct pressure drop, coolant film temperature drop and
vulnerable area. Consequently, preliminary cases were run in order to estimate the
optimum primary fluid flow velocity. Using vapor chamber fin Geometry 2, in conjunction
77
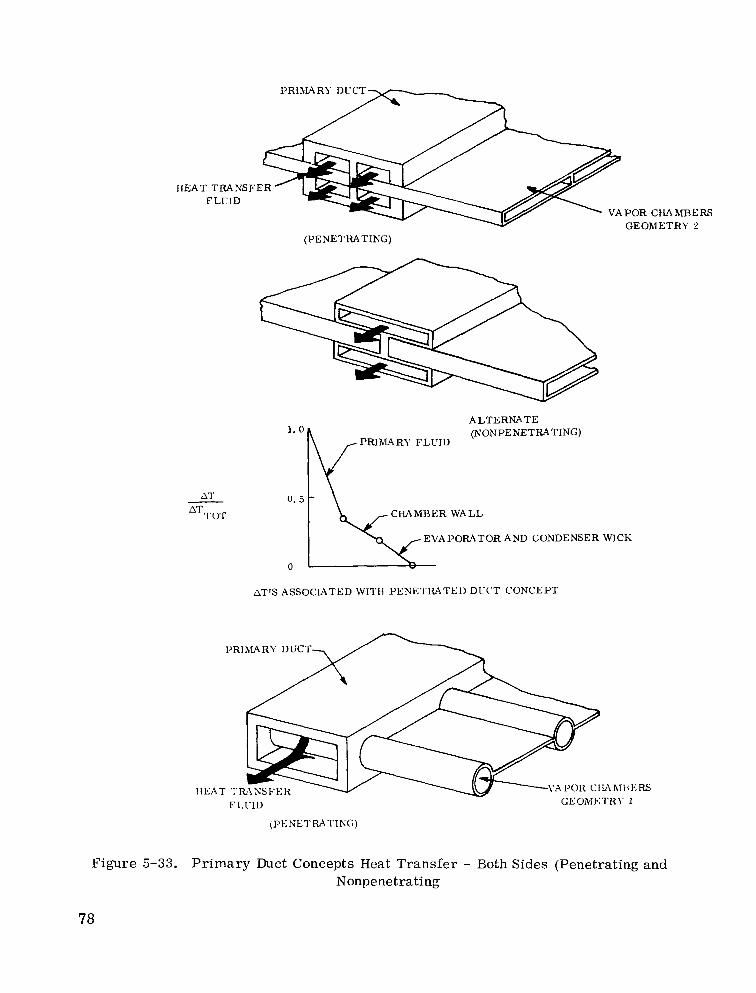
IlEAT TMWSFER FLUID
VA POR CIIA hlBE RS GEOMETRY 2
(PENETRATING)
AT
T OT
1. 0
0. 5
0
ALTERNATE (NONPENETRATING)
PRIMARY FLL'ID
CHAMMI3ER WALL
EVAPORATOR AND CONDENSER WICK
AT'S ASS0Cb"TED W I T H PENETRATED DCCT CONCEPT
Figure 5-33. Primary Duct Concepts Heat Transfer - Both Sides (Penetrating and Nonpenetrating
78
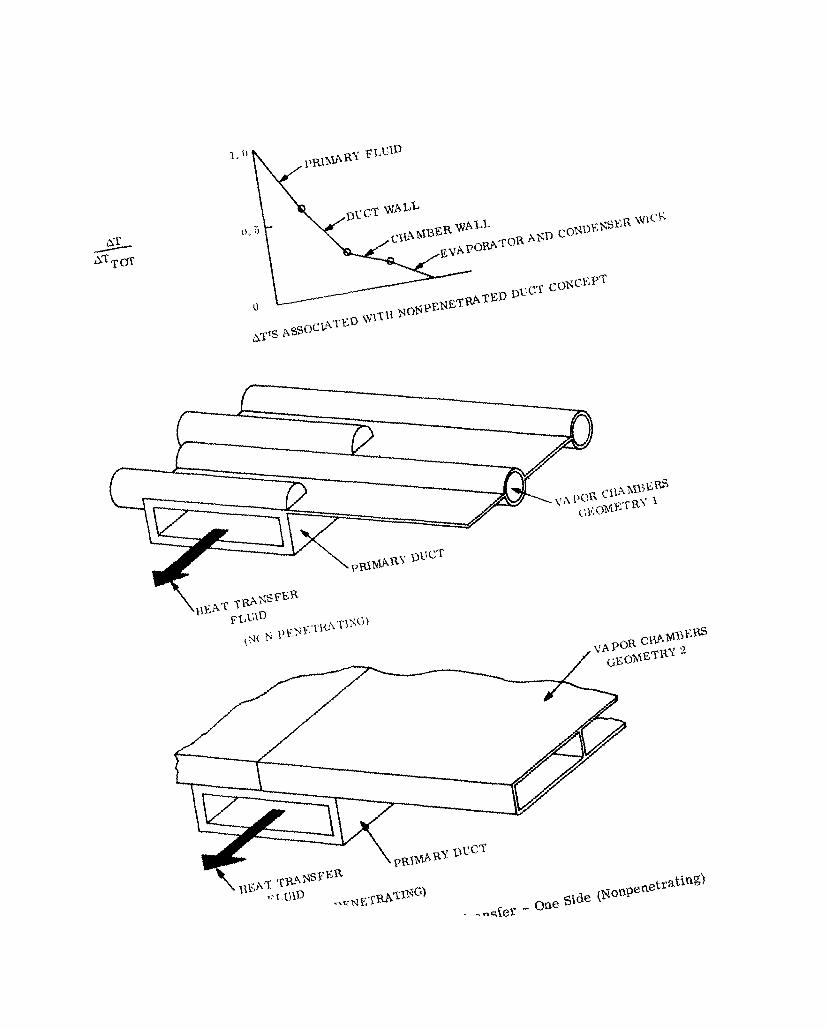
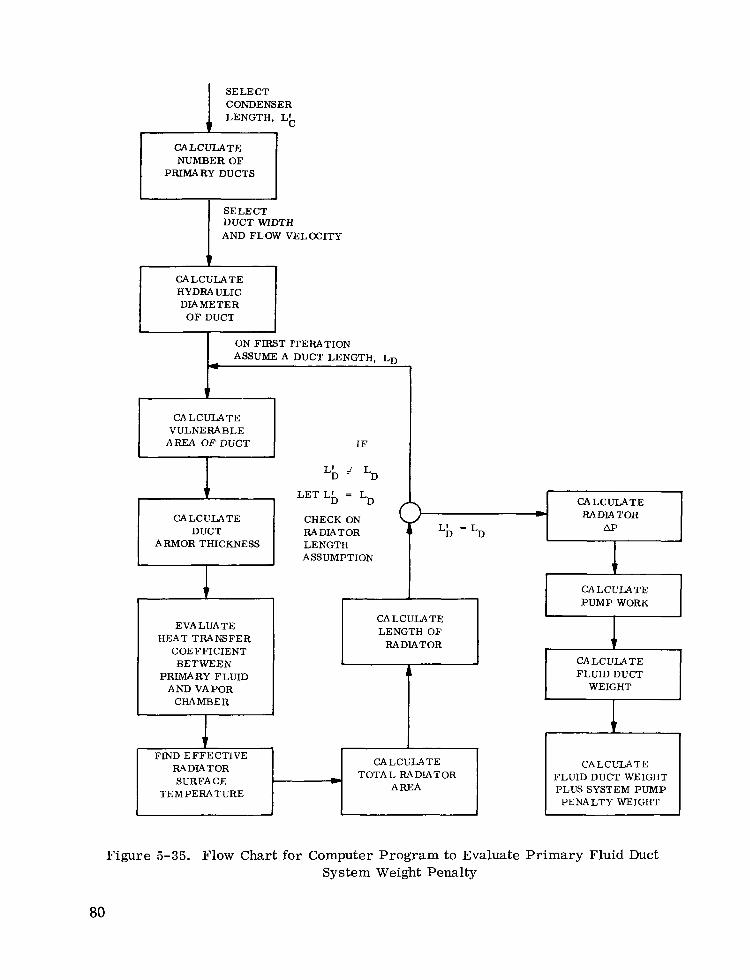
A LENGTH, Lb
CALCULATE NUMBER OF
PRIMARY DUCTS
I S E L E C T DUCT WIDTH AND FLOW VELOCITY
CALCULATE HYDRAULIC DIAMETER
O F DUCT I I ON FIRST ITERATION
CALCULATE VULNERABLE
AREA OF DUCT
CALCULATE
ARMOR THICKNESS
EVALUATE HEAT TRANSFER
C O E F F I C I E N T B E T W E E N
PRIMARY FLUID AND VAPOR
CHAMBER
t I F I N D E F F E C T I V E I
I F
L E T Lb = LD
CHECK ON RADIATOR LENGTH ASSUMPTION
CALCULATE e RA DIA TOR
L b = LD AP
1 CALCULATE P U M P WORK
CALCULATE LENGTH OF
RADIATOR 1 c CALCULATE A FLUID DUCT
WEIGHT
1 I +
RADIATOR SURFACE
TEMPERATURE
CALCULATE TOTAL RADIATOR
AREA
CALCULATE FLUID DUCT WEIGHT PLUS SYSTEM PUMP
PENALTY WEIGHT
Figure 5-35. Flow Chart for Computer Program to Evaluate Primary Fluid Duct System Weight Penalty
80
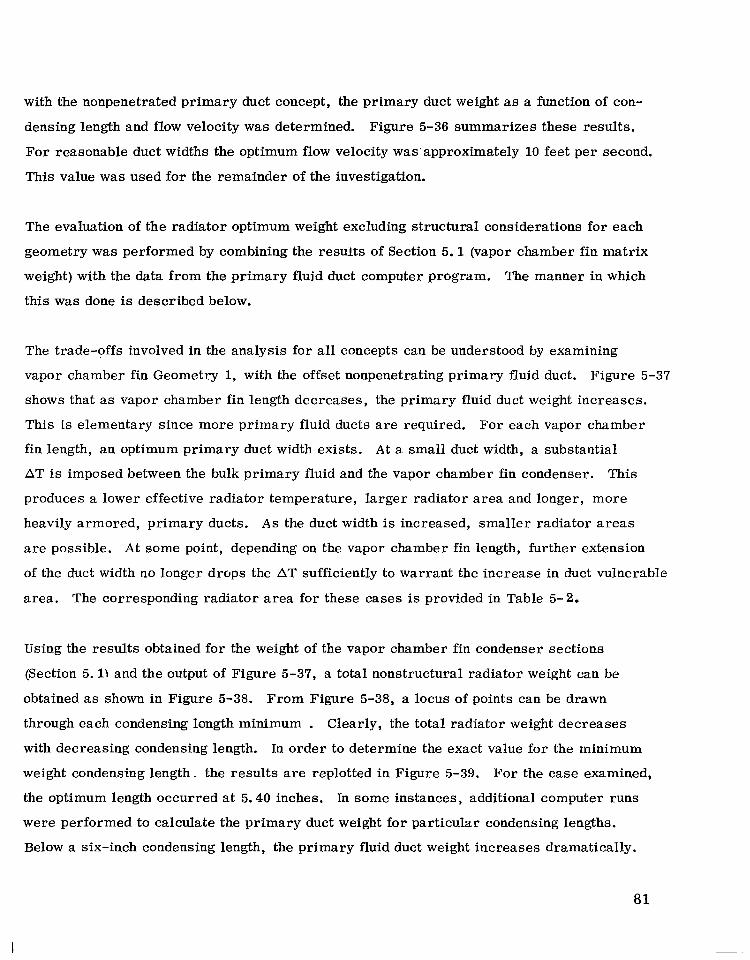
with the nonpenetrated primary duct concept, the primary duct weight as a function of con-
densing length and flow velocity was determined. Figure 5-36 summarizes these results.
For reasonable duct widths the optimum flow velocity was approximately 10 feet per second.
This value was used for the remainder of the investigation.
The evaluation of the radiator optimum weight excluding structural considerations for each
geometry was performed by combining the results of Section 5.1 (vapor chamber fin matrix
weight) with the data from the primary fluid duct computer program. The manner in which
this was done is described below.
The trade-offs involved in the analysis for all concepts can be understood by examining
vapor chamber fin Geometry 1, with the offset nonpenetrating primary fluid duct. Figure 5-37
shows that as vapor chamber fin length decreases, the primary fluid duct weight increases.
This is elementary since more primary fluid ducts are required. For each vapor chamber
fin length, an optimum primary duct width exists. At a small duct width, a substantial
AT is imposed between the bulk primary fluid and the vapor chamber fin condenser. This
produces a lower effective radiator temperature, larger radiator area and longer, more
heavily armored, primary ducts. A s the duct width is increased, smaller radiator areas
a r e possible. At some point, depending on the vapor chamber fin length, further extension
of the duct width no longer drops the AT sufficiently to warrant the increase in duct vulnerable
area. The corresponding radiator area for these cases is provided in Table 5-2.
Using the results obtained for the weight of the vapor chamber fin condenser sections
(Section 5 .1 \ and the output of Figure 5-37, a total nonstructural radiator weight can be
obtained as shown in Figure 5-38. From Figure 5-38, a locus of points can be drawn
through each condensing length minimum . Clearly, the total radiator weight decreases
with decreasing condensing length. In order to determine the exact value for the minimum
weight condensing length. the results are replotted in Figure 5-39. For the case examined,
the optimum length occurred at 5.40 inches. In some instances, additional computer runs
were performed to calculate the primary duct weight for particular condensing lengths.
Below a six-inch condensing length, the primary fluid duct weight increases dramatically.
81

0.i \
"" 1 I I I I
Figure 5-36. Effect of Flow Velocity and Variable Condensing Length on Primary Duct Weight
GEOMETRY 1
IFFSET NONPENETRATED DUCT
L -0.5
V \ FIN THICKNESS I TF - 0.010 IN.
J. . o
DUCT WIDTH - INCHES
Figure 5-37. Variation of Primary Fluid Duct Weight as a Function of Duct Width and Vapor Chamber Length
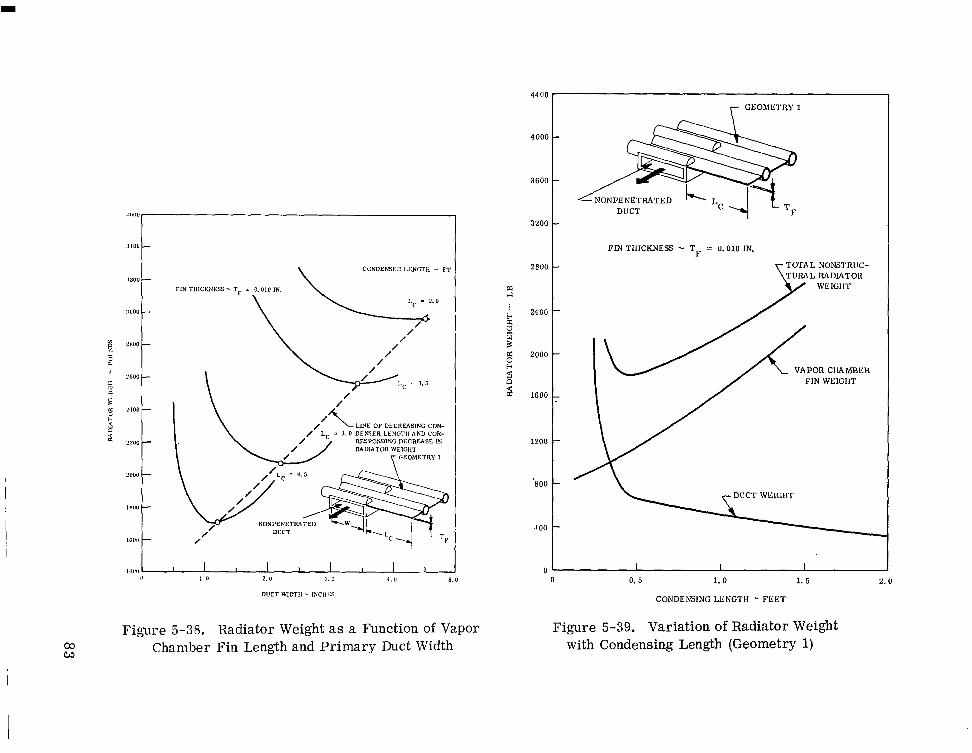
CONDENSER LENGTH - F1 FIN TIIIUMESS - rF = 0.010 m.
L = 2.0
\ LC - 1.5
/
Figure 5-38. Radiator Weight as a Function of Vapor Chamber Fin Length and Primary Duct Width
44 00
4000
3600
3200
ZPOO
2400
2000
1600
1200
'800
4 00
0
DUCT
FIN THICKNESS - TF = 0.010 IN.
TOTAL NONSTRUC- TUR4L MDIATOB
WEItiIIT
VAPOR CllAMBER FIN WEIGllT
I I I 0 0. 5 1.0 1. 5 2 . 0
CONDENSINGLENGTH - F E E T
Figure 5-39. Variation of Radiator Weight with Condensing Length (Geometry 1)

Table 5- 2 . Influence on Radiator Area for Various Duct Widths and Vapor Chamber
Vapor Chamber Length, L (Ft)
C
0. 5
1. 0
1. 5
2.0
Condensing Lengths
Duct Width WD (in.)
0.50 1. 00 1.50 2.00
1.0 1. 5 2.0 2. 5 3.0
1. 5 2 . 0 2. 5 3. 0 3.5 4.0
2 . 0 2.5 3. 0 3.5 4.0 4. 5
Required R p a t o r Area, A (Ft )
1505 1065 96 5 920
1545 1270 1160 1090 1040
1515 126 0 1135 1065 1030 10 10
1290 1145 1070 1030 10 15 1005
A summary of the optimum radiator weights is shown in Table 5-3 for each configuration.
The radiator weights for either type of primary fluid duct did not vary dramatically; however,
the offset duct geometry generally incurred a 2040-30 percent penalty. One outstanding
result is the number of chambers required in the hexagonal vapor chamber concept. The
weights presented do not include structural weight; this analysis is presented in the
following section.
84
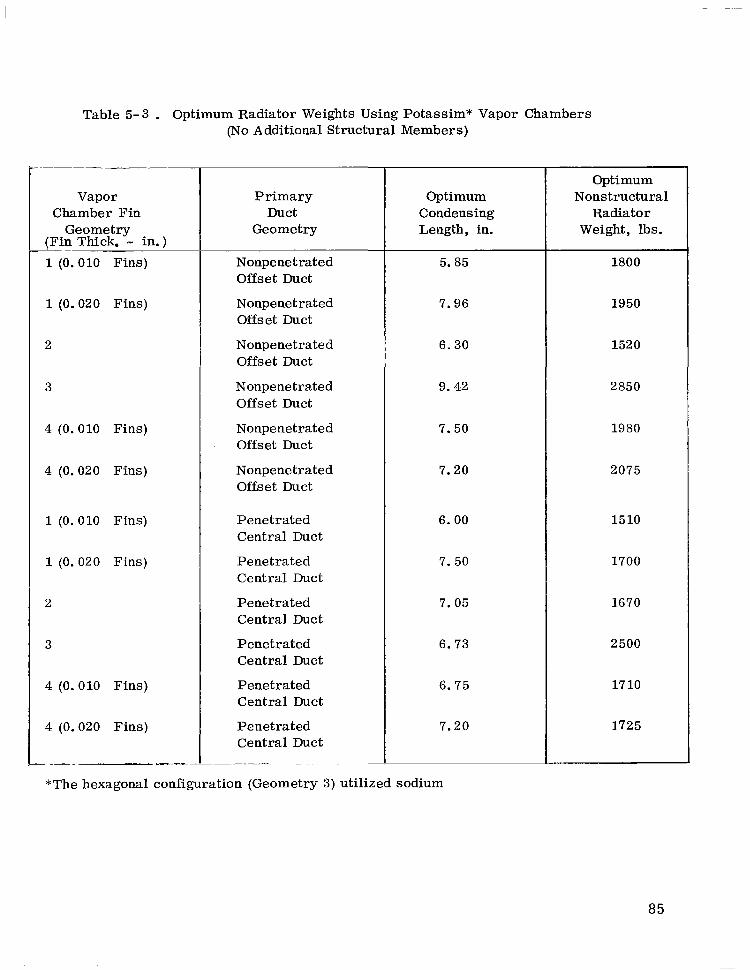
Table 5-3 . Optimum Radiator Weights Using Potassim* Vapor Chambers (No Additional Structural Members)
Vapor Chamber Fin
Geometry (Fin Thick. - in. )
- ~~~ ~
1 (0.010
1 (0.020
2
3
4 (0.010
4 (0.020
1 (0.010
1 (0.020
2
3
4 (0.010
4 (0.020
~~
Fins)
Fins)
Fins)
Fins)
Fins)
Fins)
Fins)
Fins)
Pr imary Duct
Geometry
Nonpenetrated Offset Duct
Nonpenetrated Offset Duct
Nonpenetrated Offset Duct
Nonpenetrated Offset Duct
Nonpenetrated Offset Duct
Nonpenetrated Offset Duct
Penetrated Central Duct
Penetrated Central Duct
Penetrated Central Duct
Penetrated Central Duct
Penetrated Central Duct
Penetrated Central Duct . "" ~~~
-~ - ~~
Optimum Condensing Length, in.
5. 85
7.96
6.30
9.42
7.50
7 . 2 0
6.00
7. 50
7.05
6.73
6.75
7.20
Optimum Nonstructural
Radiator Weight, lbs.
1800
1950
1520
2850
19 80
2075
15 10
1700
1670
2500
17 10
1725
*The hexagonal configuration (Geometry 3) utilized sodium
85

5 . 3 VAPOR CHAMBER FIN CONCEPT/RADIATOR STRUCTURAL EVALUATION - - " -
5 . 3 . 1 GENERAL
A realistic comparison between the candidate vapor chamber concepts must include an
estimate of the overall weight, including additional structural members required to support
the launch loads.
Figure 5-40 shows the four radiator panel concepts analyzed. Since the panels did not
have sufficient strength, structure, in the form of rings and longerons, was added as re-
quired to support the launch load.
5 . 3 . 2 LOADS
For an unshrouded design, the flight loads consist of aerodynamic loads as well as
acceleration o r g loads. The most severe axial load distribution and shear and moment
distributions, due to aerodynamic loading during a two stage Saturn V launch, are shown
t t t t t t t t t t t t t t t t =O=o=n I u E E "
CYLINDRICALIFIN RECTANGULAR CHANNEL HEXAGONAL HONEYCOMB OFFSET RECTANGULAR CHANNEL
Figure 5-40. Vapor Chamber Fin Concepts
86
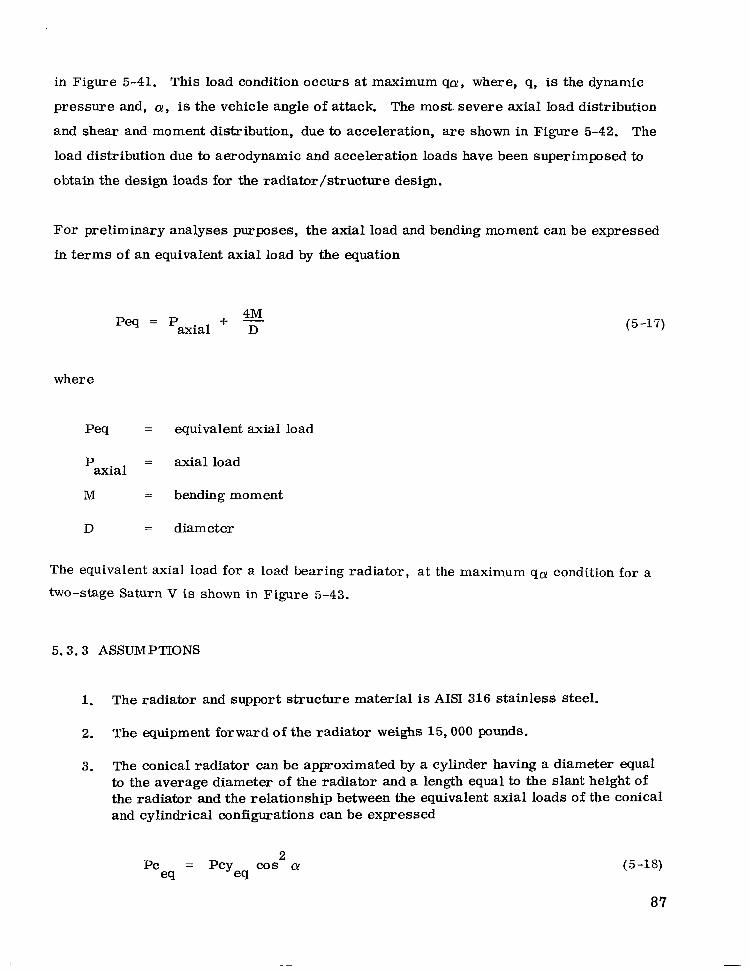
in Figure 5-41. This load condition occurs at maximum q a , where, q, is the dynamic
pressure and, a , is the vehicle angle of attack. The most. severe axial load distribution
and shear and moment distribution, due to acceleration, are shown in Figure 5-42. The
load distribution due to aerodynamic and acceleration loads have been superimposed to
obtain the design loads for the radiator/structure design.
For preliminary analyses purposes, the axial load and bending moment can be expressed
in te rms of an equivalent axial load by the equation
Peq = P 4M axial D
+ -
where
equivalent axial load
axial load
bending moment
diameter
(5-17)
The equivalent axial load for a load bearing radiator, at the maximum qa condition for a
two-stage Saturn V is shown in Figure 5-43.
5 . 3 . 3 ASSUMPTIONS
1. The radiator and support structure material is AIS1 316 stainless steel.
2. The equipment forward of the radiator weighs 15,000 pounds.
3. The conical radiator can be approximated by a cylinder having a diameter equal to the average diameter of the radiator and a length equal to the slant height of the radiator and the relationship between the equivalent axial loads of the conical and cylindrical configurations can be expressed
= pcyeq cos a 2
eq (5-18)
87
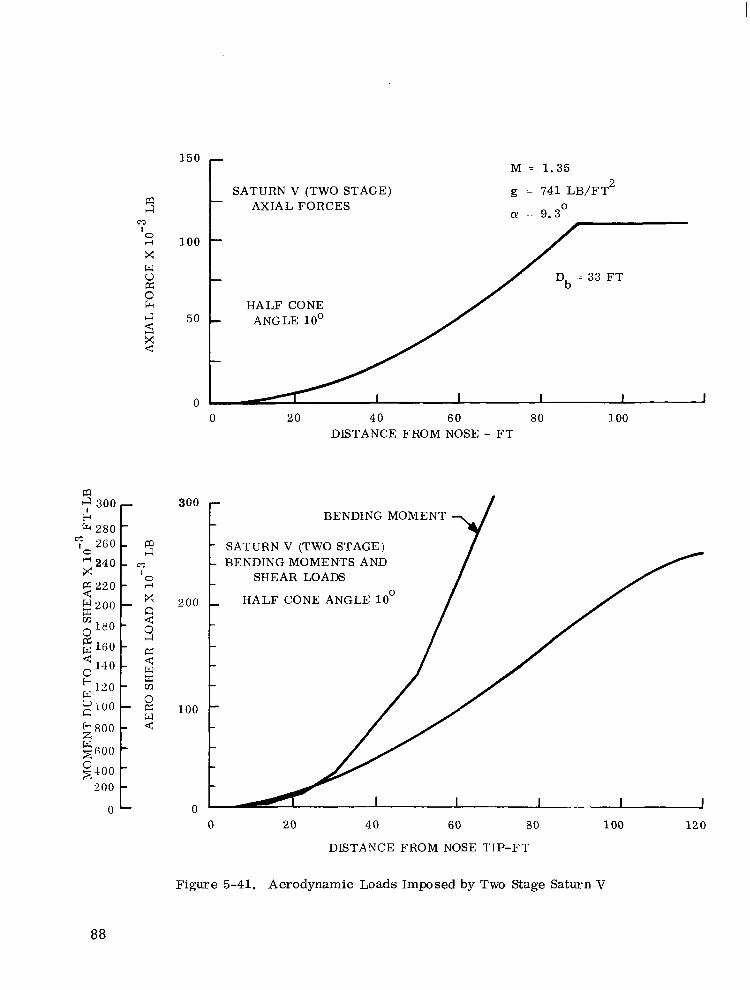
1 5 0 M = 1 . 3 5
SATURN V (TWO STAGE) g = 741 LB/FT 2
I4 a -
A X I A L F O R C E S cy = 9 . 3
0
m I 0 - 1 0 0 X w u - e;
-
2 H A L F C O N E I4 50 - s ANGLE 10'
X c -
0 0 20 40 60 80 100
DISTANCE FROM NOSE - FT
300 - BENDING MOMENT -
- SATURN V (TWO STAGE) - BENDING MOMENTS AND - SHEAR LOADS
200 - HALF CONE ANGLE 10'
- -
- -
100 - - - L
0 0 20 40 60 80 100 120
DISTAPJCE FROM NOSE TIP-FT
Figure 5-41. Aerodynamic Loads Imposed by Two Stage Saturn V
88

60
40 50 f SATURN V (TWO STAGE) AXIAL ACCELERATION LOADS (2.0 g'S)
0 10 20 3 0 ' lo DISTANCE FROM NOSE T I P - FT
60 - SATURN V (TWO STAGE) LATERAL
50 - ACCELERATION AND ASSOCIATED BENDING MOMENT LOADS (0.2 g'a)
4 0 - MOMENT
n 111 "0 :io 40
DIs'r.4\c.k. ~ 1 1 0 x 1 NOSE I ' IP - F I so
Figure 5-42. Acceleration Loads Imposed by Two Stage Saturn V 500C
4000
:loo0
'000
1000
, 3oo
c
0 ' H A L F C O N E A N G L E
0 20 40 I I I I -1 I
160 60 80 100 120 140
DISTANCE r'ROI1 NOSE TIP. FT
Figure 5-43. Equivalent Axial Load-Saturn V Launch Vehicle (Two Stage)
89
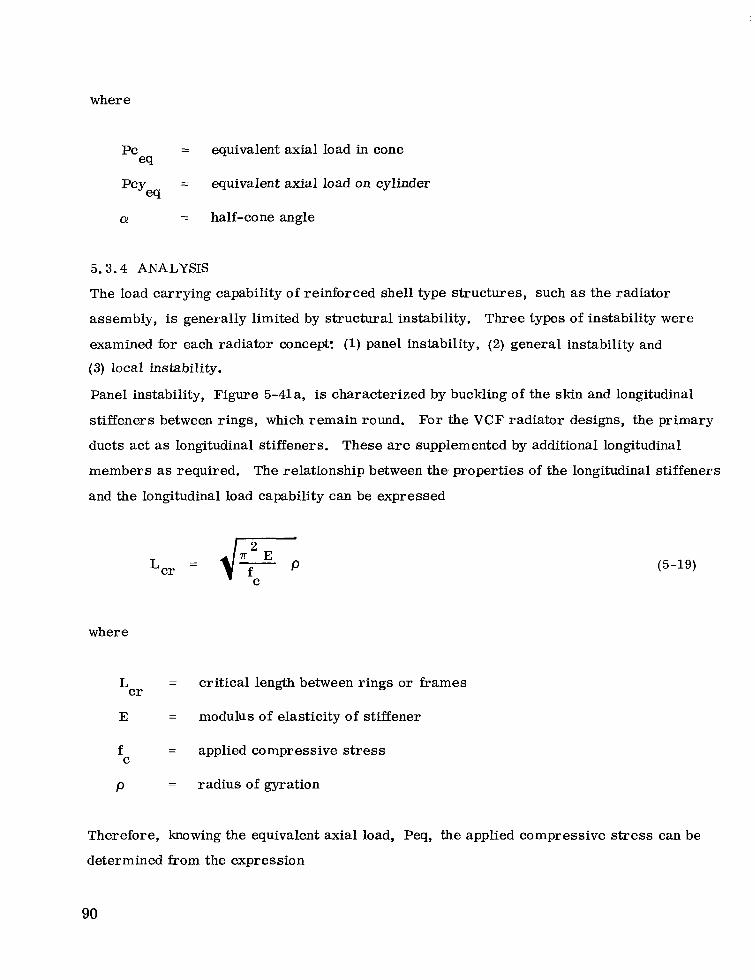
where
P C = equivalent axial load in cone ecl
"Yeq = equivalent axial load on cylinder
Q! = half-cone angle
5.3.4 ANALYSIS
The load carrying capability of reinforced shell type structures, such as the radiator
assembly, is generally limited by structural instability. Three types of instability were
examined for each radiator concept: (1) panel instability, (2) general instability and
(3) local instability.
Panel instability, Figure 5-41a, is characterized by buckling of the skin and longitudinal
stiffeners between rings, which remain round. For the VCF radiator designs, the primary
ducts act as longitudinal stiffeners. These are supplemented by additional longitudinal
members as required. The relationship between the. properties of the longitudinal stiffeners
and the longitudinal load capability can be expressed
(5-19)
where
L = critical length between rings or &ames
E = modulus of elasticity of stiffener
f = applied compressive stress
P = radius of gyration
c r
C
Therefore, knowing the equivalent axial load, Peq, the applied compressive stress can be
determined from the expression
90
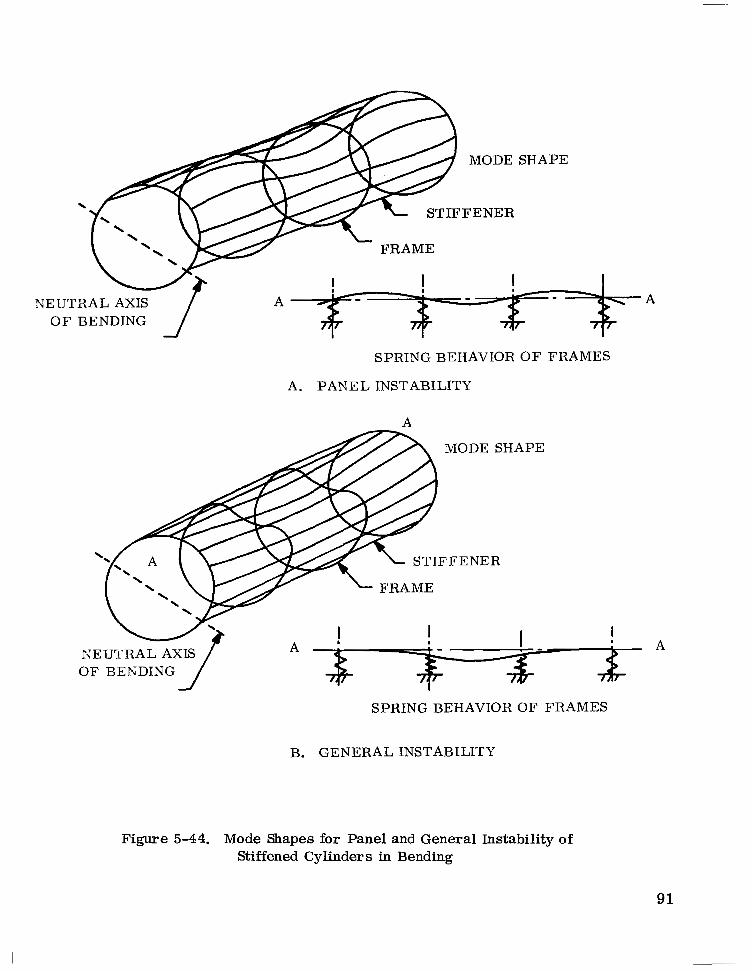
MODE SHAPE
STIFFENER
NE U’1’RAL AXIS O F BENDING
SPRING BEHAVIOR O F FRAMES
A. PANEL INSTABILITY
A
STIFFENER
FRAME
I NEUTRAL AXIS A A
OF BENDING
SPRING BEHAVIOR OF FRAMES
B. GENERAL INSTABILITY
Figure 5-44. Mode Shapes for Panel and General Instability of Stiffened Cylinders in Bending
91
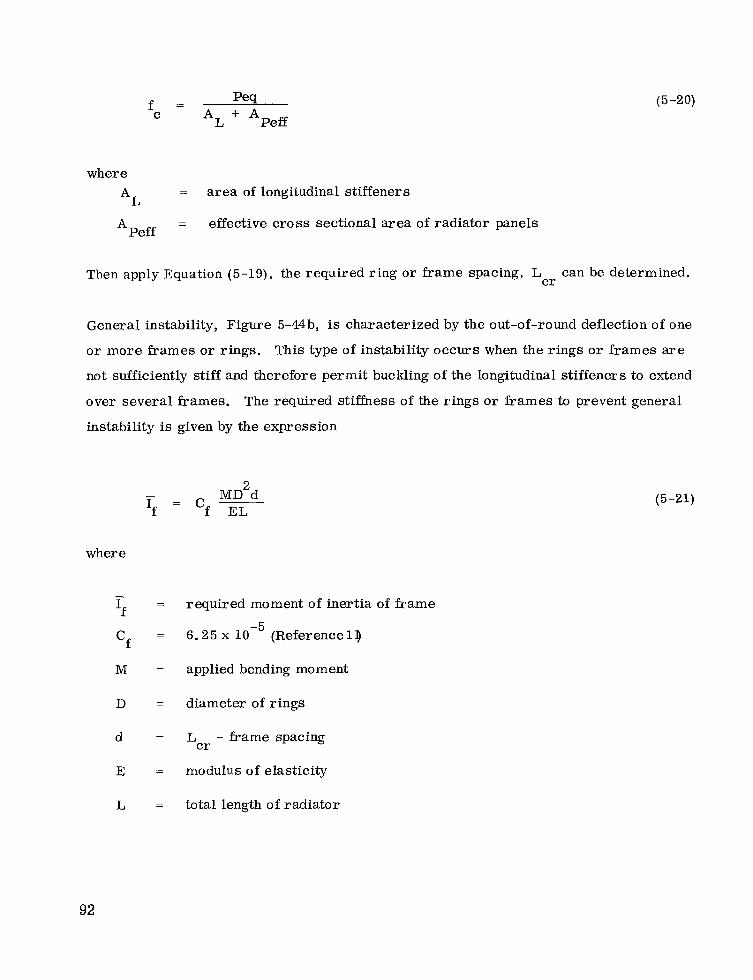
(5 -20)
where
*L
A Peff
= area of longitudinal stiffeners
= effective cross sectional area of radiator panels
Then apply Equation (5-19), the required ring or frame spacing, L can be determined. c r
General instability, Figure 5-44b, is characterized by the out-of-round deflection of one
o r more frames or rings. This type of instability occurs when the r ings or frames are
not sufficiently stiff and therefore permit buckling of the longitudinal stiffeners to extend
over several frames. The required stiffness of the rings o r f rames to prevent general
instability is given by the expression
- MD2d If - cf -
where
- If = required moment of inertia of frame
Cf = 6.25 x 10 (Reference13
M = applied bending moment
D = diameter of r ings
d - ii-ame spacing
E = modulus of elasticity
L = total length of radiator
-5
-
- 'cr
(5 -21)
92

The third mode of failure considered is the local failure of the individual radiator panels
by (i) sheet buckling such that nodes occur onlyat theattachment to rings and stiffeners o r (2)
by a number of discrete failures within each panel. The former can be evaluated from the
expression:
K 7 r E 2
F - - C C cr 2
12 (1 -v )
where
critical compressive stress on panel
coefficient given by Reference
modules of elasticity
Poisson's ratio
effective thickness of radiator panel
width of panel
(5-22)
The Latter form of local failure is a function of the panel concept being investigated a s
illustrated in Figure 5-45.
The potential modes of local failure for Geometry 1 a r e tube failure or fin failure as
illustrated in Figure 5-45a. The load capability for the tubes is given in Figure 5-46 as a
function of wall thickness and tube diameter. The load capability for the f i n s is given in
Figure 5 4 7 a s a function of fin height and thickness. Since the tubes and fins car ry equal
loads, the optimum structural design exists when the allowable loads, P as defined by
both F i g u r e s 5 4 6 and 5-47 a r e equal. Therefore, for a given longitudinal load distribution,
the appropriate tube and fin dimensions can be selected from Figures 5-46 and 5-47.
Figure 5 4 7 i s applicable also to Geometries 2 and 4.
0'
9 3
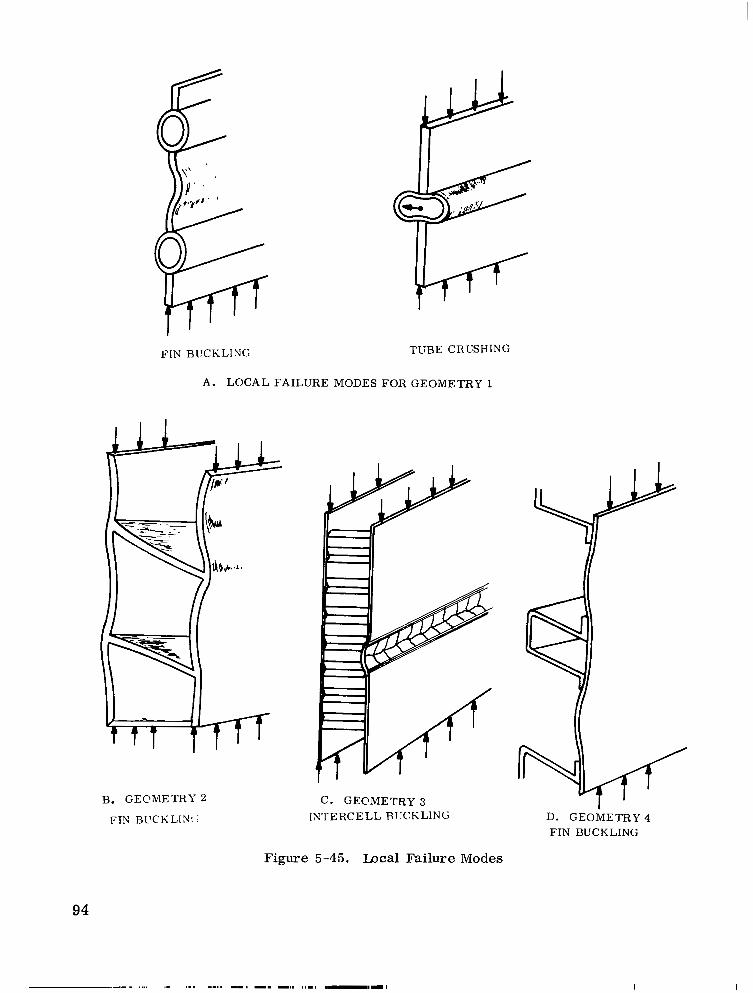
B. GECMETRY 2
FIN RL'CKLIN! I
Figure 5-45. Local Failure Modes
94
D. GEOMETRY 4 FIN BUCKLING
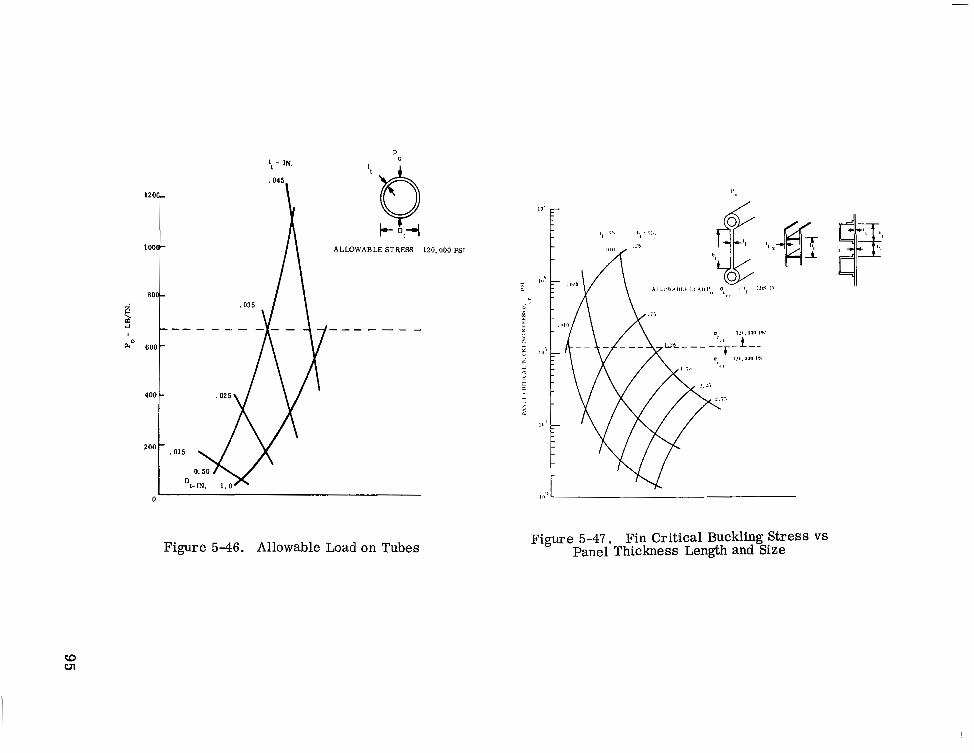
P O
ALLOWABLE STRESS 120,000 P S I
"""_
0
Figure 5-46. Allowable Load on Tubes Figure 5-47. Fin Critical Buckling Stress VS Panel Thickness Length and Size

Local failure of Geometry 3 can occur due to intercell buckling as illustrated in Figure 5-45c.
This type of failure is characterized by buckling of the face sheets within the confines of
individual cells. The cri t ical stress for stainless steel face sheets is shown in Figure 5-48
as a function of cell size and face sheet thickness. The corresponding critical equivalent
axial load, Peq, acting on a cylindrical section of radiator is shown in Figure 5-49 as a
function of the radiator diameter, the cell size and the face sheet thickness. Typical di-
mensions defined by thermal requirements are S = 1.5 inches and t = 0.015 inches. From
Figure 5-48, it can be seen that the critical face sheet stress is approximately 30,000 psi
compared to a yield stress of 120,000 psi or 25 percent of the maximum obtainable utilization.
Figure 5-50 presents the density in pounds per square foot of radiator area a s a function of
the dimensions of the honeycomb panels. The core density and face sheet density is
separated to permit freedom in trading off the geometric parameters. The use of Figures
5-48, 5-49 and 5-50 permit rapid preliminary evaluation of the effects of cell geometry and
face sheet thickness on load carrying capability and weight.
f
I O G E MATERIAL SS - Pcy 1?0.000 PSI
t
Figure 5-45. Intercell Buckling Stress vs Facing Thickness and Cell Size
96
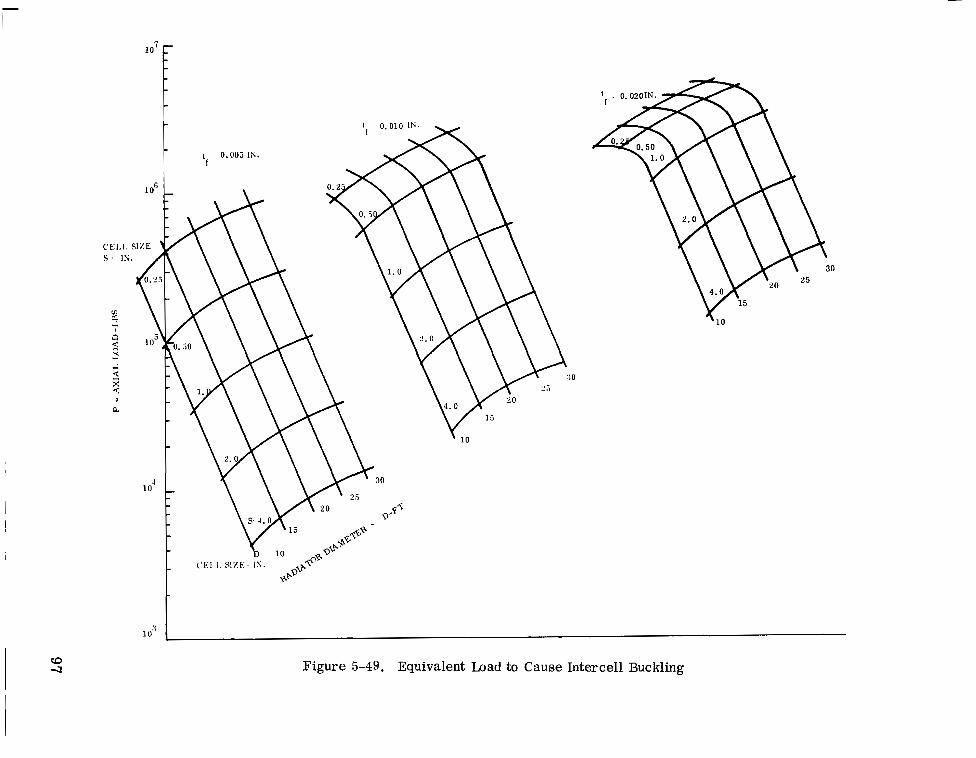
10'
' 10
Figure 5-49. Equivalent Load to Cause Intercell Buckling

1.0 t d
Figure 5-50. Stainless Steel Honeycomb Core Density
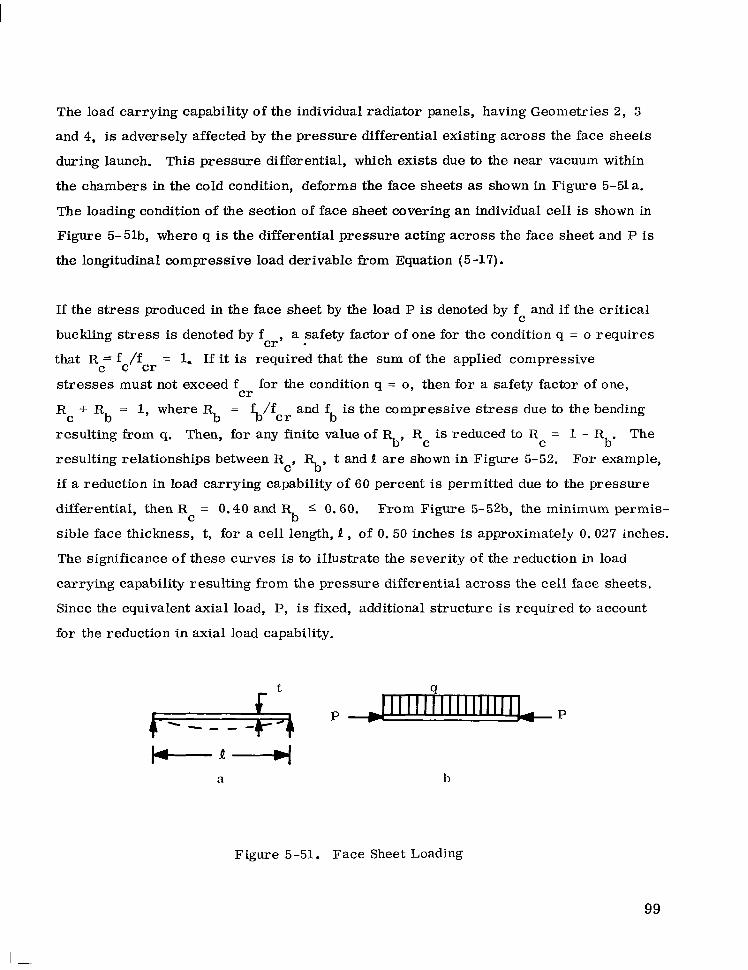
The load carrying capability of the individual radiator panels, having Geometries 2, 3
and 4, is adversely affected by the pressure differential existing across the face sheets
during launch. This pressure differential, which exists due to the near vacuum within
the chambers in the cold condition, deforms the face sheets as shown in Figure 5-51 a.
The loading condition of the section of face sheet covering an individual cell is shown in
Figure 5-51b, where q is the differential pressure acting across the face sheet and P is
the longitudinal compressive load derivable kom Equation (5-17).
If the stress produced in the face sheet by the load P is denoted by f and if the critical
buckling stress is denoted by f a safety factor of one for the condition q = o requires
that R = f /f = 1. If it is required that the sum of the applied compressive
stresses must not exceed f for the condition q = 0, then for a safety factor of one,
R + Rb = 1, where R = f,,/fcr and f,, is the compressive stress due to the bending
resulting from q. Then, for any finite value of %, R is reduced to R = 1 - R The
resulting relationships between R %, t and 1 are shown in Figure 5-52. For example,
if a reduction in load carrying capability of 60 percent is permitted due to the pressure
differential, then R = 0.40 and % 0.60. From Figure 5-52b, the minimum permis-
sible face thickness, t, for a cell length, P , of 0. 50 inches is approximately 0.027 inches.
The significance of these curves is to illustrate the severity of the reduction in load
carrying capability resulting from the pressure differential across the cell face sheets.
Since the equivalent axial load, P, is fixed, additional structure is required to account
for the reduction in axial load capability.
C
c r y - c c cr
cr
C b
C C b'
C'
C
Figure 5-51. Face Sheet Loading
99

CI 0 0
P
(0 I
Figure 5-52.
c c
Stress Relationships of Radiator Panel Face Sheets

5.3.5 SUMMARY O F RESULTS
The results of the analyses described are summarized in te rms of weight in Table 5-4.
5.4 FABRICATION EVALUATION
5.4.1 GENERAL
A load bearing vapor chamber radiator consists of the following major elements:
1. Structural stiffening rings
2. Splice/attachment plates
3. Nlounting/interface structure
4. Vapor chamber fins
5. Primary fluid ducts
6 . Primary fluid headers and feed lines.
The structural and attachment members and fluid headers were not considered in this phase
of the comparative evaluation since these techniques are not significantly dependent on
vapor chamber geometry. Rather, a review was made of the fabrication and assembly of
individual and groups of vapor chambers in conjunction with the primary fluid duct. Results
were incorporated with the thermal, structural and weight evaluations performed to assist
in the selection of the most desirable vapor chamber geometry for the radiator.
Ultimately the fabrication techniques required comprise a significant part of the overall
cost and feasibility of the radiator. It is, therefore, considered important to select and
test a vapor chamber geometry that is representative of concepts that would be employed.
Key criteria considered in the fabrication evaluation include:
10 1
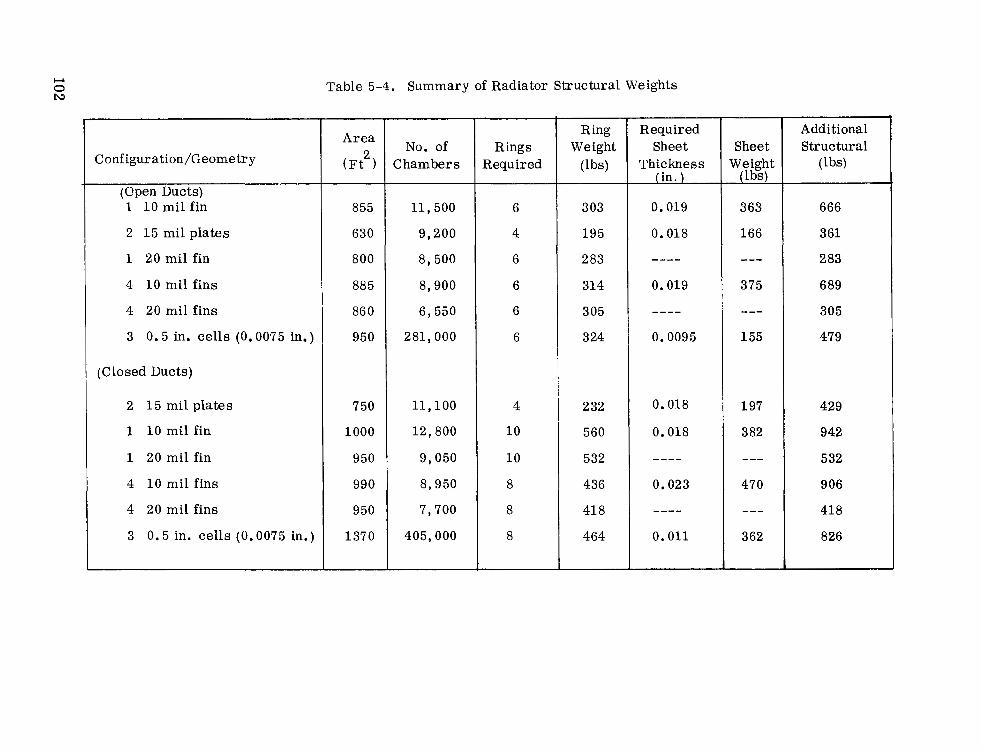
Table 5-4. Summary of Radiator Structural Weights
Configuration/Geometry
(@pen Ducts) 1 10 mil fin
2 15 mil plates
1 20 mil fin
4 10 mil fins
4 20 mil fins
3 0.5 in. cells (0.0075 in.)
(Closed Ducts)
2 15 mil plates
1 10 mil fin
1 20 mil fin
4 10 mil fins
4 20 mil fins
3 0.5 in. cells (0.0075 in.)
Area
( F A
855
630
800
885
86 0
950
750
1000
950
990
950
1370
~ ~ ~~~ ~ ~~ ~
No. of Chambers
11,500
9,200
8,500
8,900
6,550
281,000
11,100
12,800
9,050
8,950
7,700
405,000
6
4
6
6
6
6
4
10
10
8
8
8
Ring Weight
( W
303
195
283
314
3 05
324
232
560
532
436
41 8
464
Required Sheet
Thickness (in. )
0,019
0.018
""
0.019
""
0.0095
0.018
0.018
""
0.023
""
0.011
Sheet Weight
(lbs)
363
166
"_ 375
"-
155
197
3 82
-"
470
"_ 362
Additional Structural
(Lbs)
666
361
2 83
6 89
305
479
429
942
532
906
418
826
1.
2.
3.
4.
5.
6.
7.
Use of Stainless Steel (316 or equivalent).
Requirements for the fabrication and assembly of several thousand heat pipes, within reasonable time and cost constraints. Minimize complex structures.
Repetitive reliability in fabrication and assembly processes consistent with life- time and thermal requirements.
Incorporation of wicks in each heat pipe required.
Cleanliness of fabrication, charging of liquid metals and individual sealing of each pipe must be achieved.
Material joining techniques must be consistent with known and established procedures, near state-of-art fabrication technology assumed.
Vapor chambers must be compatible with primary fluid ducts.
5.4.2 FABRICATION TECHNIQUES
The geometries lend themselves to one or more manufacturing processes largely dependent
on the design characteristics of the vapor chamber. Manufacturing processes considered
most appropriate are listed in Figure 5-53.
5 .4 .2 .1 Sheet Metal Rolled and Welded
Pipe and tubular vapor chambers can be made by either butt welding o r piercing, the latter
being a seamless process. Heated strips of stainless steel which have edges beveled
slightly are used so that they will meet accurately when formed in a circular shape. A s
the s t r ip is pulled through the welding bell, the circular shape is formed and the edges are
welded together. A final operation can pass the pipe through shaping and finishing rolls to
give correct size (circular o r elliptical).
5.4.2.2 Special Welding (Electron Beam and TIG)
Electron Beam o r Tungsten Inert Gas (TIG) welding techniques afford a method of obtaining
coalescence of materials within controlled environments. In the TIG technique, shielding
of the weld joint is obtained from an inert gas such as helium or argon. Tungsten electrodes
are usually used because of their high melting point and virtually nonconsumable nature.
103
S H E E T M E T A L / R O L L E D / WELDED
SPECIAL WELDING ELECTRON BEAM - TIG)
I BRAZING
I EXTRUSION
I DIFFUSlON BONDING
1 l 3 4
Figure 5-53. Fabrication Processes for Vapor Chamber Geomebies
Manual open welding can be accomplished with the use of inert gas jets. Horizontal and
vertical welding chambers are available which provide an ultrahigh purity helium atmosphere
and capable of handling hardware of several feet in diameter o r length. Electron beam
welding is performed in a specially designed vacuum chamber with remote welding capability.
Essentially no foreign material is interjected into the weld to provide an extremely high
purity noncontaminated weld joint. Since electron beam welding must be done under a
vacuum, part size is more restrictive than that of TIG welding. Electron beam and TIG
welds are considered well suited for heat pipe fabrication due to their relatively clean weld
capability.
5.4.2.3 Brazing
Brazing affords a relatively low cost method of joining, particularly if several similar
surfaces can be joined in a single application. Brazing involves the use of a nonferrous
filler material applied between two closely fitting surfaces. The filler material, melted
at a lower temperature (above 800 F) than the base material, is generally distributed by 0
104
capillary action. For a satisfactorily brazed joint, it is essential that the liquidous
(melting) temperature of the filler material is reached and metal wet, or alloy, with the
metal surfaces on which it is applied. The brazing temperature must be above the operating
temperature of the part. Some of the advantages attributed to brazing are as follows:
1. The completed joint requires little or no finishing
2. The relatively low temperature at which the joint is made minimizes distortion
3. There is no flash o r weld spatter
4. Brazing techniques do not require as much skill as the technique for electron beam and TIG welding
5. The process can be easily mechanized
6. The process is economical.
Disadvantages which must be considered when selecting joining methods are:
1. If the joint is to be exposed to corrosive media, the filler metal used must have the required corrosion resistance
2. Al l of the brazing alloys lose strength at elevated temperatures requiring careful selection and application of the brazing alloy.
Brazing is especially suited for relatively large surface area joints where good heat
transfer is required o r where configurations permit the joining of many surfaces in a
single operation.
5.4.2.4 Extrusion
Many of the heat pipe configurations lend themselves to extrusion techniques, particularly
shapes approaching circular or elliptical tubes. The principles of extrusion, similar to
the act of squirting toothpaste k o m a tube, has long been utilized for a variety of materials
and shapes. The extrusion of stainless steel must be done at elevated temperatures (“2400 F).
Several limitations applicable to the extrusion of heat pipes are worthy of note.
0
10 5
Extrusion of nonuniform surfaces and thicknesses can cause part warpage especially
where considerable lengths are involved. Extrusions of small diameter ( c 3/8 inch)
stainless steel tubes with wall thicknesses of 50 mi l s o r less is difficult because of the
inability to maintain close tolerances.
5.4.2.5 Diffusion Bonding
Diffusion bonding is one of the more recent and effective methods of attachment. The
principle of the bonding mechanism is the use of a prescribed pressure and metal to metal
contact at the proper temperature-time relationship to achieve a metaIlurgica1 bond. The
actual bond of the materials is caused by the migration of atoms across the interface at
sufficiently high temperatures to reduce the time required, and grain growth without
recrystallization. Temperatures associated with stainless steel bonds are approximately
2000'F. Intersticial materials such as nickel are sometimes added to increase diffusion
and uniformity of the surface. Methods of applying pressure to the surfaces and size
limitations of autoclave or s imilar type furnaces are constraints which must be considered
before design or selection of a fabrication technique can be made. Due to the requirements
for rather unique fixtures and facilities, the diffusion bonding technique is considered a
relatively costly process but provides a very suitable method for the bonding of certain
parts.
5.4.2.6 Vapor Chamber Geometry Fabrication Evaluation Results
A degree of fabrication difficulty comparison was made of each concept which was subse-
quently used in the overall evaluation which included thermal, integration, structural and
fabrication considerations. Results of the fabrication evaluation for each of the four
general concepts a r e contained in Figures 5-54 through 5-57. Geometry 2 was judged to
be more difficult than Geometry 1 due to end closures and wall joining techniques. Brazes
required may give somewhat lower reliability than welds.
Of the four basic geometries considered, the number of individual vapor chambers
required for the complete radiator were calculated to range from less than 7000 for
Geometry 4 to over 400,000 for Geometry 3.
106

\VELD I I
e . . , .. . : . .... , .:.:. .: .: CASDID.A'I'I-.S: SHEE EX'L'RI'SIOS r ~ I E ' r A L i I l O L L E D / \ ~ E L D
DIF'FI'SIOX HOKDING ll..\'I'lK(;
SHEET METAL/ RI<LIABLE AS DESIRED WHERE COMPLETE ROLLED/RZLD
0 W'ELDIHG OF 0.015 INTI1 MA'L'ERML SOT A S
TIBE SEALING IS MANDATORY. E S D C . \ P
EASS FABRICATIOE; CONSIDERED HEL.4'L'Kk:I,Y
EXTRUSIOE; 0 KX'rRUSION O F TUBE AND L I P IS A LIKELY CANDIDATE Bur OVERALL SURFACE 'I 'OLERANCES ARE DIFFICULT TO MAINTAIK;. FIN WELDED TO LIP PROVIDES GOOD SEAL.
0 EXD CAP FABRICATION CONSIDERED RELATNF:LY EASY
DIFFI'SION .BONDING
0 DIFI.'LISlON BONDING PROVIDES CAPABILITY O F FORMING CHAMBER/FIE! I N ONE Pl€:CE
rn PROVIDES GOOD SEAL
COSTS A R E IlICll (FABRICATION DIFFICI'L'I')
0 END CAP SEALING hlOHE DIFFICI 'LT
WELD WELD I I
I 2 l
Figure 5-54. Geometry 1 Fabrication Techniques
CANDIDATES: SHEET hlETAL/RRAZING SHEET METAL/UTLDING DIFFUSION BONDING EXTRUSION
0 SUITABLE METHOD IF FLANGES ARE PROVIDED OR CORRUGATED CONCEPT IS EIMPLOYED
0 END CAP WELD IS DIFFICLLT
0 CONFIGI'RATION WITHOUT FLANGE IS CONSIDEREI DIFFIC LL'r
0 WELDING-CONSIDERED MORE DIFFICULT THAN
AND SMALL SURFACES, BUT MAY PROVIDE BRAZING DUE T O P R O J E C T R E Q U I R E M E W S
BETTER SEALh'G
END CAP WELD IS DIFFICULT
CONFIGIRATIOK W~ITHOC'T FLANGE IS DIFFICULT
0 CSE OF BOXES AKD SHEETS CONSIDERED FEASIBLE
0 ~II\IXTI~:K.~NCF: O F ML'fAL THICKNESS/WEIGHT bI.4Y BE J I O R E DIFFICI 'LT
0 b:SI) C:\P C0NSIDLRb:D D l F l ~ l C l ~ L T
COXSLDERED DIFFICL-LT A K D ;r p x a c m . . A L - ~~
WlTll PRESEKT TECHNOLOGY
BRAZE
f a @ I 2 -NOT RECOMMENDED
BRA Z
SAME AS ABOVE BUT MELDS
Figure 5-55. Geometry 2 Fabrication Techniques
10 7
CANDIDATES: SHEET METAL/BRAZING/ELECTROI\: BEAM WELD DIFFUSION BONDING
SHEI;T XIETAI. B R A Y I N ( ; EI .ECTRON Bh:A\I WE1.D
DIFFLISION RON DING
7 ~
INDIVIDUAL HONEYCOMBS ELECTRON BEAM WELDED
BRAZING OR WELDING OF COMB TO SHEETS REQLqRE FLANGES OR TABS TO PROVIDE SEALING, CONSIDERED VERY DIFFICULT
WICKING CHARGING AND SEALING VERI' DIFFICULT ~ ~~ ~- - ~
SIMILAR TECHNIQUES
VERY DIFFICULT FABRICATION
HlGH COST
WICKING. CHARGlNG AND SEALING VERY DIFFICLiLT
~ -
CG FLANGES
R E Q C W E D ~" ~
Figure 5-57. Geometry 4 Fabrication Techniques
108

5.5 VAPOR CHAMBE-R ~ ~ _ _ _ _ _ _ _ _ _ FIJN DESIGN CONCLUSIONS
From the analysis presented, Geometry 2 using a closed nonpenetrated duct was selected
as the optimum VCF configuration. This decision was based on a combination of factors
including thermal performances radiator weight, integration with primary duct, structural
weight and ease of fabrication. Figure 5-58 summarizes the evaluation results.
Total radiator weights for each radiator concept are provided in Table 5-5. In general,
the open penetrated primary fluid duct provided a lighter weight system than the completely
enclosed nonpenetrated configuration. However, the overall radiator weights of
Geometries 1, 2 and 4 did not vary that greatly. The 0.010 inch thick fin cases for
Geometries 1 and 4 required excessive structural members which lessened their attrac-
tiveness. The honeycomb configuration was considerably heavier, largely as a result of
its lower effective radiating temperature. The large number of individual chambers in
this design is another deterrent to its selection.
Sodium was chosen as the working fluid because of its superior performance over the
entire radiator temperature range. The results of the fluid analysis, obtained with the
HPIPE computer code, for Geometry 1 a r e provided in Figure 5-59. Cesium was the
poorest fluid by a wide margin; in fact, with a 0.5 inch pipe diameter, the only operating
region possible was in the vicinity of 1100 F. At higher temperatures the surface tension
of cesium was inadequate to provide the capillary pumping, while at temperatures below
1100 F a lower vapor density, coupled with the low surface tension made it impossible to
satisfy the pressure balance. Although potassium exhibited satisfactory performance, the
higher conductivity, latent heat of vaporization and surface tension of sodium results in
lower weights for these cases.
0
0
109
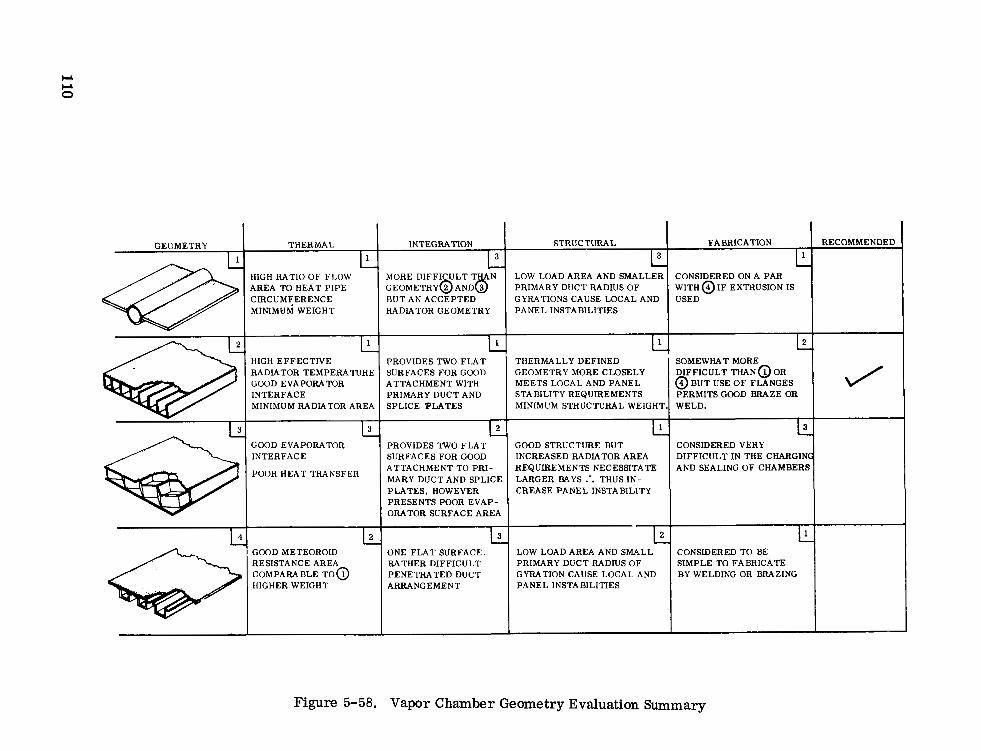
w w 0
GEUMETRY
4
THERMAL INTEGRATION STRUCTURAL I 1 1 3 1 3
L
W i H RATIO O F FLOW LOW LOAD AREA AND SMALLER 4REA TO HEAT PIPE 3IRCUMFERENCE GYRATIONS CAUSE LOCAL AND MINIMUM WEIGHT
4IGH EFFECTIVE
SPLICE PLATES MINIMUM RADIATOR AREA PRIMARY DUCT AND [NTERFACE ATTACHMENT WITH ZOOD E V A P O R A M R SURFACES FOR GOOD RADIATOR TEMPERATURE PROVIDES TWO F L A T
3
3OOD EVAPORATOR INTERFACE
PROVIDES TWO F L A T SURFACES FOR GOOD
HEAT TFL4NSFER I MARY DUCT AND SPLICE ATTACHMENT TO PRI -
PLATES, HOWEVER
ORATOR SURFACE AREA PRESENTS POOR EVAP-
IL THERMALLY DEFINED GEOMETRY MORE CLQSELY MEETS LOCAL AND PANEL STABILITY REQUIREMENTS MINIMUM STRUCTURAL WEIGHT.
1
GOOD S T R U C T m E B U T INCREASED RADIATOR AREA REQUIREMENTS NECESSITATE LARGER BAYS .'. THUS IN- CREASE PANEL INSTABlLlTY
GOOD METEOROID ONE FLAT SURFACE. RESISTANCE AREA
LOW LOAD AREA AND SMALL RATHER DIFFICULT
COMPARABLE T O O PRIMARY DUCT RADIUS O F
PENETRATED DUCT HIGHER WEIGHT
GYRATION CAUSE LOCAL AND ARRANGEMENT PANEL INSTABILITIES
SOMEWHAT MORE
3 BUT USE O F F L A N G E S PERMITS GOOD BRAZE OR
DIFFICULT THAN@ OR
WELD. I I
CONSIDERED VERY DIFFICULT IN THE CHARGIN AND SEALING O F
CONSIDERED TO BE SIMPLE TO FABRICATE BY WELDING OR BRAZING
Figure 5-58. Vapor Chamber Geometry Evaluation Summary

Table 5-5. Summary of Radiator Weights
;I T h e r m a l E v a l u a t i o n
G e o m e t r y
[Nonpene t r a t ed Duc t s ) I
2 15 m i l p l a t e s ~ 750
1 20 mil f i n s ' 950
4 20 mil f in s \ 950
1 10 mil f ins 1 1000
I
4 10 m i l f i n s
3 0.5 i nch ce l l (. 0075 i n c h )
[ P e n e t r a t e d D u c t s ]
1 20 m i l f i n s
2 15 mil p l a t e s
4 20 mil f in s
1 10 m i l f i n s
4 10 m i l fins
3 0.5 inch ce l l (. 0075 i n c h )
990
1370
800
630
860
855
885
950
i
~
i
I I I
No. o f C h a m b e r s
11,100
9050
7700
12,800
8950
405,000
8500
9200
6550
11,500
8900
281.000
R a d i a t o r Weight
( W
1520
1950
2075
1800
1980
2850
1700
1670
1850
1510
17 10
2500
S t r u c t u r a l E v a l u a t i o n
I Rina 1 R e w i r e d I S h e e t
1 4 I
10 I
8
10
I
8 1
232 0.018
"_ 418
560 j 0.018
436 i 0.023
464 j 0.011
283
195 0.018
305
303 0.019
I -"
"_
0.0095 1
197
"_ "_ 382
470
362
"_ 166
"_ 363
37 5
155
S t r u c t u r a l Weight
( W
429
532
418
942
906
826
283
36 1
305
66G
689
479
-iT Total
Weight
(LB)
1949
2482
2493
2742
2886
3676
1983
2031
2155
2116
2399
2979

2.6
2.4
2 .2
A 1.6
1 .4
1 . 2
1.0
0. 8
0.6
0.4
CONDENSING LENGTH = 1 . 0 FT PIPE OD = 0.5 IN. FIN LENGTH = 0.5 IN. FIN THICKNESS = 0.010 IN.
900 1000 1100 1200 1300 1400
PIPE SURFACE TEMPERATURE, F 0
Figure 5-59. Fluid Comparison Finned Cylinder Geometry 1
112

SECTION 6
VAPOR CHAMBER (HEAT PIPE) TEST PROGRAM
6 . 1 TEST OBdECTIVES AND REQUIREMENTS
The objective of the vapor chamber test was to obtain accurate performance data on the
selected concept (geometry 2) in order to substantiate the analytical predictions obtained
from the HPIPE computer code and to provide data for the preliminary design of the vapor
chamber fin radiator. The primary areas of concern were:
1. The magnitude of the evaporative and condensing temperature drops as a function of the vapor chamber heat rejection rate
2. The determination of the axial vapor temperature drop as a function of the heat rejection rate
3 . The pumping capability of the sodium within the wick.
Limiting evaporative heat flux limits were also to be measured. Test requirements as-
sociated with these objectives are listed in Table 6-1.
Table 6-1. General Test Requirements
Data Obtain sound engineering performance and design data to be substantiated by an error analysis.
Temperature Range Test program vapor chamber operating temperature ranges 900' to 1300'F.
Test Accuracy
Test Increments
Measurement of evaporating and condensing AT to f 1 F. Measurement of heat fluxes within f 1 0 percent.
Operating temperatures, 900°-10000-11000-12000-13000F. Heat flux levels, 5000-10,000-20,000-30,000-40,000-80,000 Btu/Hr-Ft2.
0
Test Orientation Normal operation - horizontal Pumping test 0' to 30' f 1' Tilt
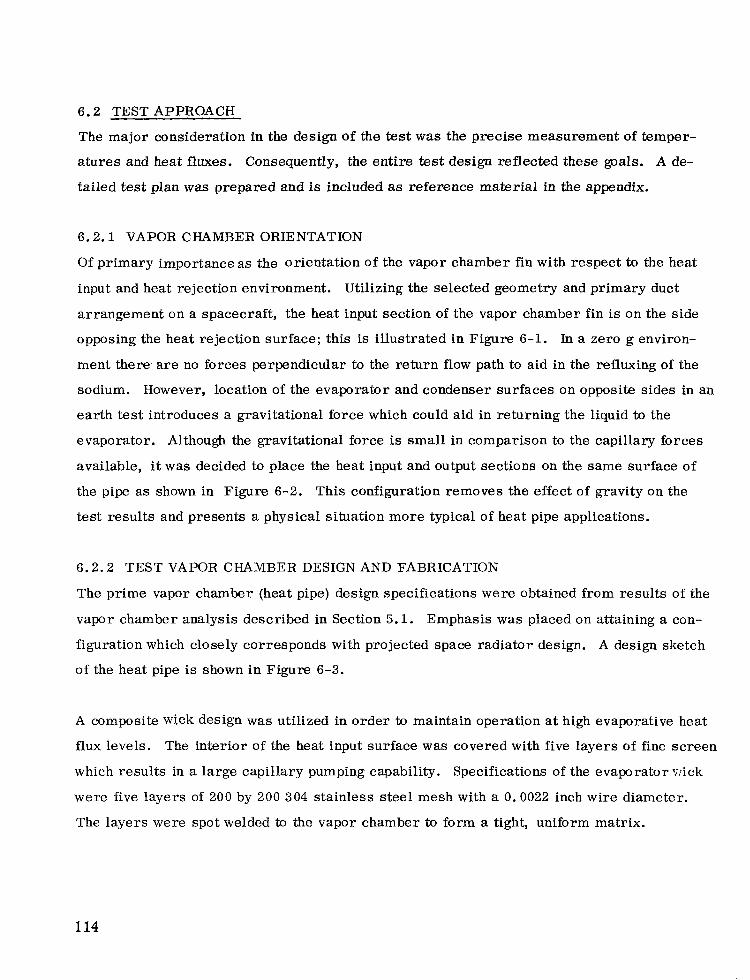
6.2 TEST APPROACH
The major consideration in the design of the test was the precise measurement of temper-
atures and heat fluxes. Consequently, the entire test design reflected these goals. A de-
tailed test plan was prepared and is included as reference material in the appendix.
6.2.1 VAPOR CHAMBER ORIENTATION
Of primary importance as the orientation of the vapor chamber fin with respect to the heat
input and heat rejection environment. Utilizing the selected geometry and primary duct
arrangement on a spacecraft, the heat input section of the vapor chamber fin is on the side
opposing the heat rejection surface; this is illustrated in Figure 6-1. In a zero g environ-
ment there. are no forces perpendicular to the return flow path to aid in the refluxing of the
sodium. However, location of the evaporator and condenser surfaces on opposite sides in an
earth test introduces a gravitational force which could aid in returning the liquid to the
evaporator. Although the gravitational force is small in comparison to the capillary forces
available, it was decided to place the heat input and output sections on the same surface of
the pipe as shown in Figure 6-2. This configuration removes the effect of gravity on the
test results and presents a physical situation more typical of heat pipe applications.
6.2.2 TEST VAPOR CHAMBER DESIGN AND FABRICATION
The prime vapor chamber (heat pipe) design specifications were obtained from results of the
vapor chamber analysis described in Section 5.1. Emphasis was placed on attaining a con-
figuration which closely corresponds with projected space radiator design. A design sketch
of the heat pipe i s shown in Figure 6-3.
A composite wick design was utilized in order to maintain operation at high evaporative heat
flux levels. The interior of the heat input surface was covered with five layers of fine screen
which results in a large capillary pumping capability. Specifications of the evaporator wick
were five layers of 200 by 200 304 stainless steel mesh with a 0.0022 inch wire diameter.
The layers were spot welded to the vapor chamber to form a tight, uniform matrix.
114

Figure 6-1. Vapor Chamber Thermal Orientation on Spacecraft
EVA PURA T O R
/cI INSULATION CONDENSER S E C T I O N - VAPOR FLOW
? ) ) -vchh) 4 R E F L U X I N G
IN QOUT
Figure 6-2. Vapor Chamber Test Orientation
115
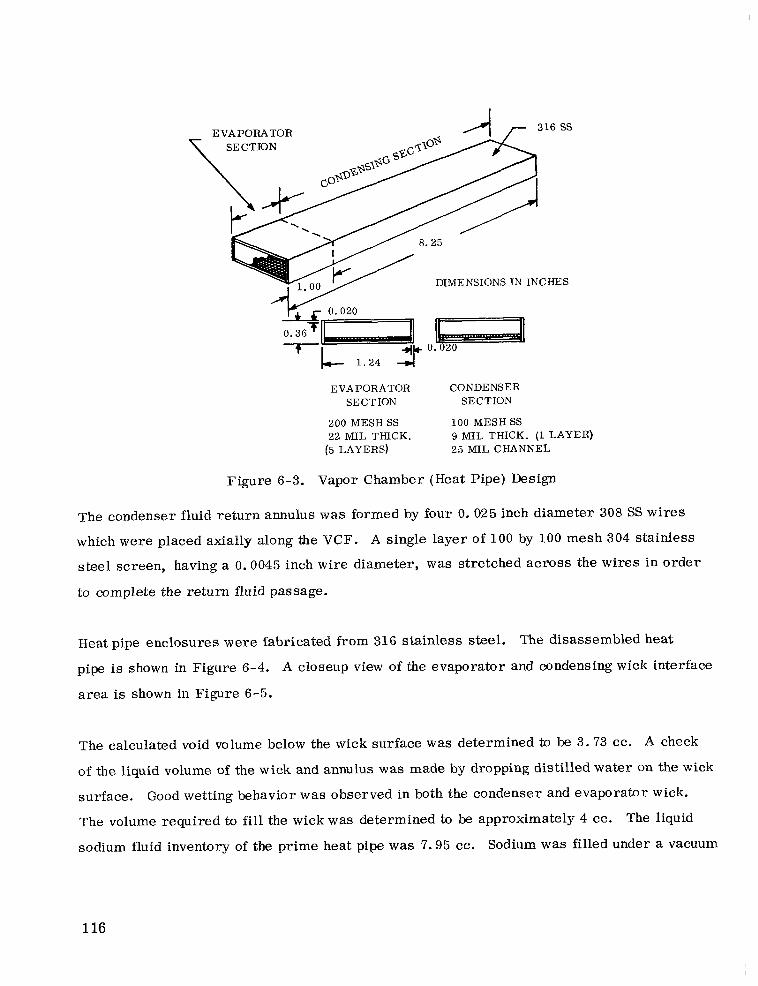
1.24 4 EVAPORATOR CONDENSER
SECTION SECTION
200 MESH SS 100 MESH SS 22 MIL THICK. 9 MIL THICK. (1 LAYER)
(5 LAYERS) 25 MIL CHANNEL
Figure 6-3. Vapor Chamber (Heat Pipe) Design
The condenser fluid return annulus was formed by four 0.025 inch diameter 308 SS wires
which were placed axially along the VCF. A single layer of 100 by 100 mesh 304 stainless
steel screen, having a 0.0045 inch wire diameter, was stretched across the wires in order
to complete the return fluid passage.
Heat pipe enclosures were fabricated from 316 stainless steel. The disassembled heat
pipe is shown in Figure 6-4. A closeup view of the evaporator and condensing wick interface
area is shown in Figure 6-5.
The calculated void volume below the wick surface was determined to be 3.73 cc. A check
of the liquid volume of the wick and annulus was made by dropping distilled water on the wick
surface, Good wetting behavior was observed in both the condenser and evaporator wick.
The volume required to fill the wick was determined to be approximately 4 cc. The liquid
sodium fluid inventory of the prime heat pipe was 7.95 cc. Sodium was filled under a vacuum
116
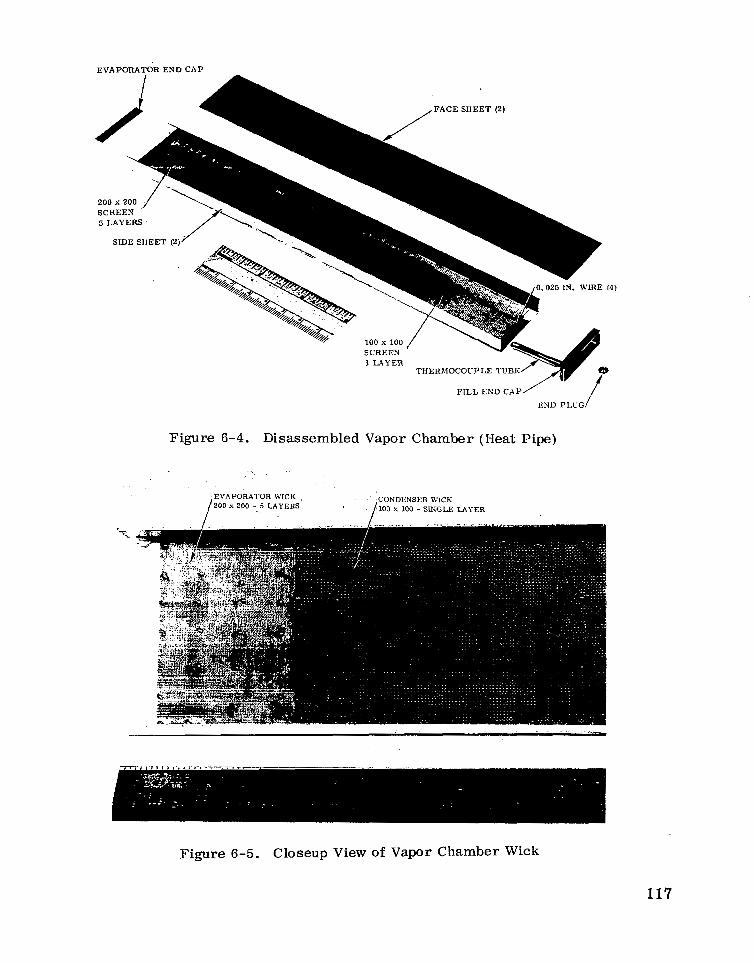
EVAPORATOR END CAP
FILL END CAP/ END PLCG /
Figure 6-4. Disassembled Vapor Chamber (Heat Pipe)
EVAPORATOR WICK , / Z O O x 200 - 5 LAYERS
CONDENSER W'ICK ' 6100 X 100 - SWGLE LAYER
Figure 6-5. Closeup View of Vapor Chamber Wick
117
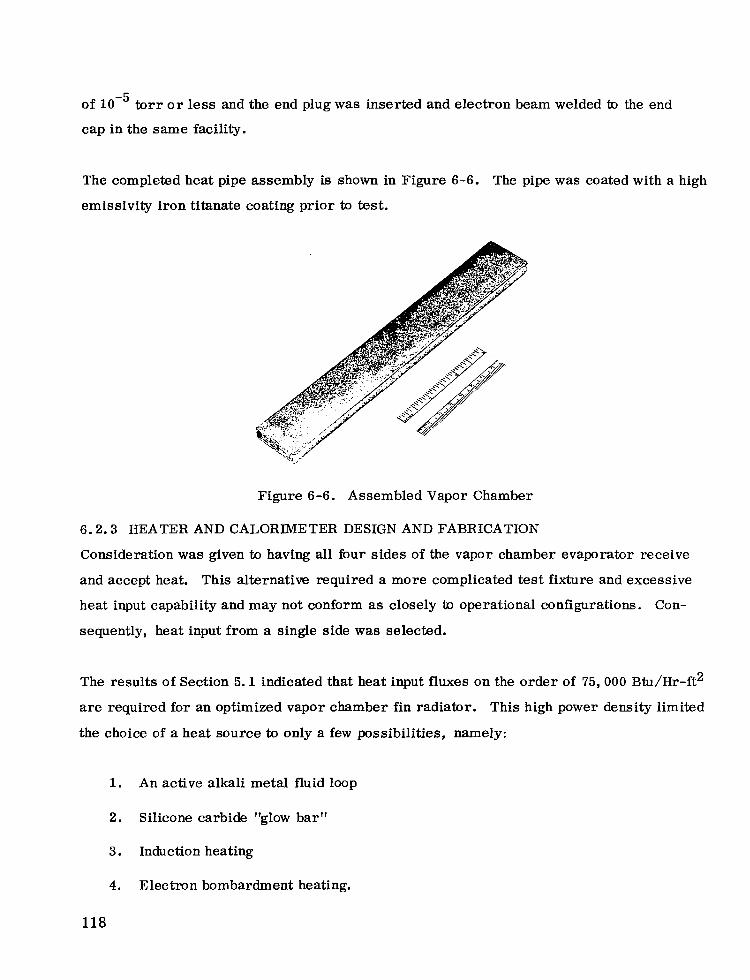
of t o r r o r less and the end plug was inserted and electron beam welded to the end
cap in the same facility.
The completed heat pipe assembly is shown in Figure 6-6. The pipe was coated with a high
emissivity iron titanate coating prior to test.
Figure 6-6. Assembled Vapor Chamber
6 . 2 . 3 HEATER AND CALORIMETER DESIGN AND FABRICATION
Consideration was given to having all four sides of the vapor chamber evaporator receive
and accept heat. This alternative required a more complicated test fixture and excessive
heat input capability and may not conform as closely to operational configurations. Con-
sequently, heat input from a single side was selected.
The results of Section 5 . 1 indicated that heat input fluxes on the order of 75,000 Btu/Hr-ft2
are required for an optimized vapor chamber fin radiator. This high power density limited
the choice of a heat source to only a few possibilities, namely:
1. An active alkali metal fluid loop
2. Silicone carbide "glow bar"
3. Induction heating
4. Electron bombardment heating.
118
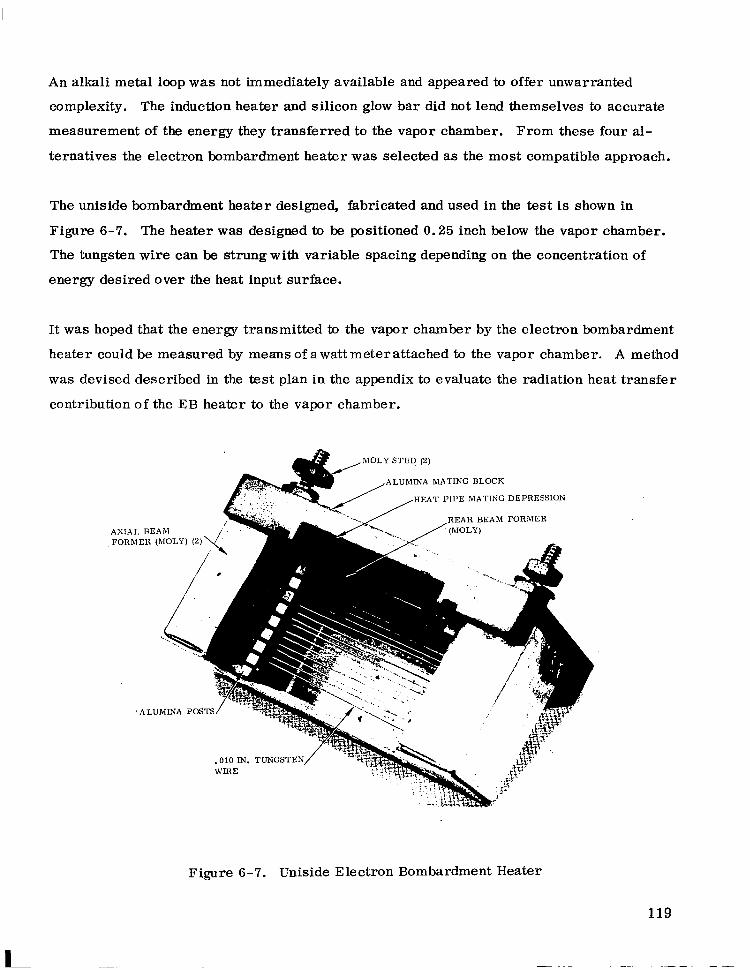
An alkali metal loop w a s not immediately available and appeared to offer unwarranted
complexity. The induction heater and silicon glow bar did not lend themselves to accurate
measurement of the energy they transferred to the vapor chamber. From these four al-
ternatives the electron bombardment heater was selected as the most compatible approach.
The uniside bombardment heater designed, fabricated and used in the test is shown in
Figure 6-7. The heater was designed to be positioned 0.25 inch below the vapor chamber.
The tungsten wire can be strung with variable spacing depending on the concentration of
energy desired over the heat input surface.
I t was hoped that the energy transmitted to the vapor chamber by the electron bombardment
heater could be measured by means o fa wattmeter attached to the vapor chamber. A method
was devised described in the test plan in the appendix to evaluate the radiation heat transfer
contribution of the EB heater to the vapor chamber.
AXIAI FORM
"
Figure 6-7. Uniside Electron Bombardment Heater
If no heat losses are present, the heat input to the vapor chamber should be equal to the heat
rejected. The amount of energy rejected was measured by a specially designed water calori-
meter shown in Figure 6-8. Therefore, the energy transferred by the vapor chamber could
be measured in two ways. Another check on the heat balance exists by virtue of the Stephan-
Boltzman relation:
(z)c = € 0 T 4
where
(2) = condenser heat flux
= emissivity of vapor chamber surface
0 = Stephan-Boltzman constant (1.713 X 10"' Btu-Ft-2 - R-4 )
T = absolute temperature of the vapor chamber surface.
Therefore, three possibilities of measuring heat flux were available with the test design.
6.2.4 TEST UNIT INSULATION
Heat losses were reduced to a minimum by use of molybdenum mulitfoil insulation in con-
junction with a pressed silica fiber insulation. (Conductivities of this insulation are listed
in Table 6-2. ) Multifoil insulation possesses extremely low thermal conductivities, thereby
making possible a compact yet effective bar r ie r to heat transfer. The use of the silica fiber
insulation pmvided a rigid fixture for the test assembty and also aided in reducing heat losses.
A photograph of the major test block hardware is shown in Figure 6-9. A view of the vapor
chamber with multifoil in place and mounted on the test block is shown in Figure 6-10.
120
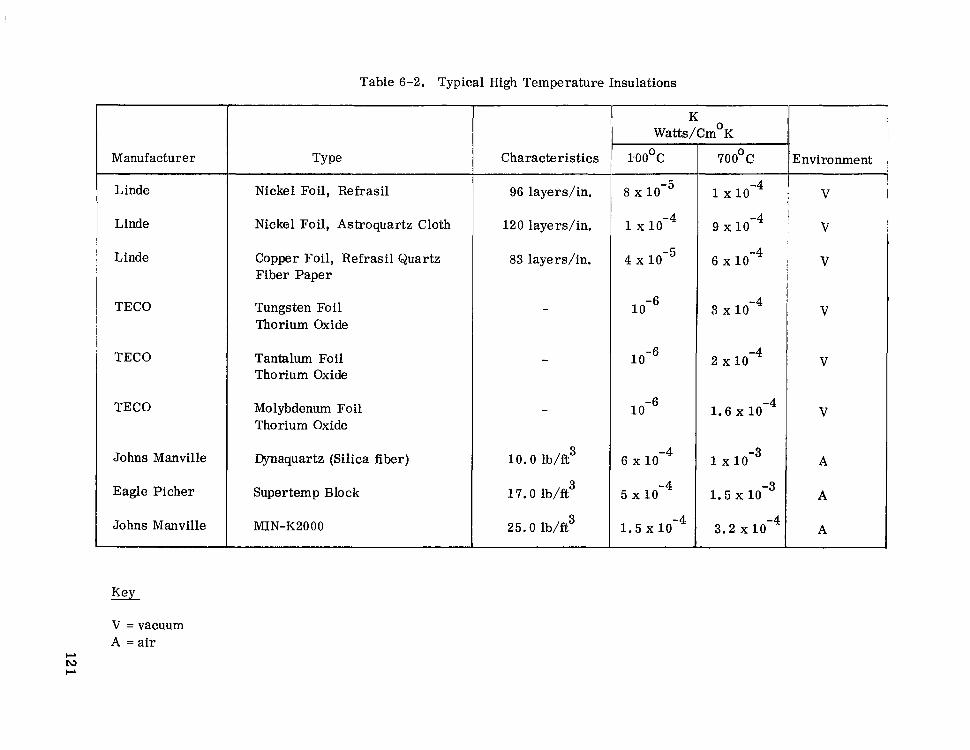
Table 6-2. Typical High Temperature Insulations
Manufacturer
L inde
Linde
Linde
TECO
TECO
TECO
Johns Manville
Eagle Picher
Johns Manville
Nickel Foil, Refrasil
Nickel Foil, Astroquartz Cloth
Copper Foil, Refrasil Quartz Fiber Paper
Tungsten Foil Thorium Oxide
Tantalum Foil Thorium Oxide
Molybdenum Foil Thorium Oxide
Dynaquartz (Silica fiber)
Supertemp Block
MIN-K2000
1- (1
Characteristics
96 layerdin.
120 l a y e d i n .
83 layerdin.
10. o w f t 3
17.0 lb/ft
25.0 lb/ft3
3
K Watts/Cm°K
Environment
8 x
1 x
4 x
1 o-6
1 o-6
I 1 x
9 x I
6 x
3 x
2 x
1.6 x
1 x
1.5 x
3.2 x
V
V
V
V
V
V
A
A
A
Key
V = vacuum A =a i r
CL
CL tu

Figure 6-8. Calorimeter
Figure 6-9. Unassembled Test Block Hardware
122
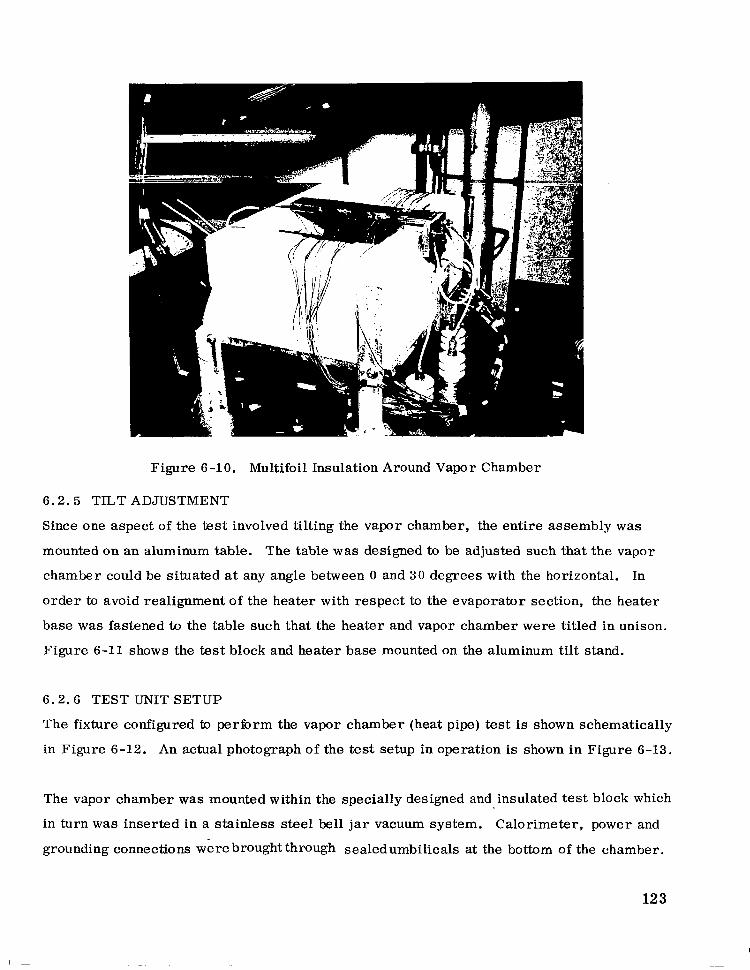
Figure 6-10. Multifoil Insulation Around Vapor Chamber
6.2.5 TILT ADJUSTMENT
Since one aspect of the test involved tilting the vapor chamber, the entire assembly was
mounted on an aluminum table. The table w a s designed to be adjusted such that the vapor
chamber could be situated at any angle between 0 and 30 degrees with the horizontal. In
order to avoid realignment of the heater with respect to the evaporator section, the heater
base was fastened to the table such that the heater and vapor chamber were titled in unison.
Figure 6-11 shows the test block and heater base mounted on the aluminum tilt stand.
6.2.6 TEST UNIT SETUP
The fixture configured to perform the vapor chamber (heat pipe) test is shown schematically
in Figure 6-12. An actual photograph of the test setup in operation is shown in Figure 6-13.
The vapor chamber was mounted within the specially designed and insulated test block which
in turn was inserted in a stainless steel bell jar vacuum system. Calorimeter, power and
grounding connections werebroughtthrough sealedumbilicals at the bottom of the chamber.
12 3
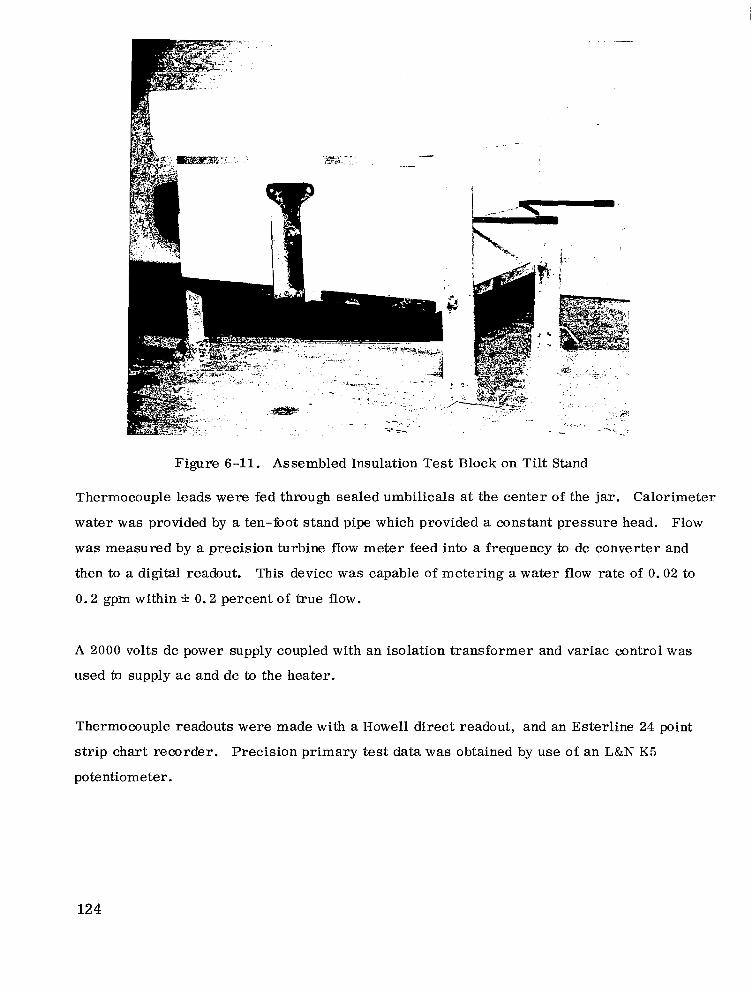
Figur'e 6-11. Assembled Insulation Test Block on Tilt Stand
Thermocouple leads were fed through sealed umbilicals at the center of the jar. Calorimeter
water was provided by a ten-foot stand pipe which provided a constant pressure head. Flow
was measured by a precision turbine flow meter feed into a frequency to dc converter and
then to a digital readout. This device was capable of metering a water flow rate of 0.02 to
0.2 gpm within * 0.2 percent of true flow.
A 2000 volts dc power supply coupled with an isolation transformer and variac control was
used to supply ac and dc to the heater.
Thermocouple readouts were made with a Howell direct readout, and an Esterline 24 point
strip chart recorder. Precision primary test data was obtained by use of an L&N K 5
potentiometer.
124
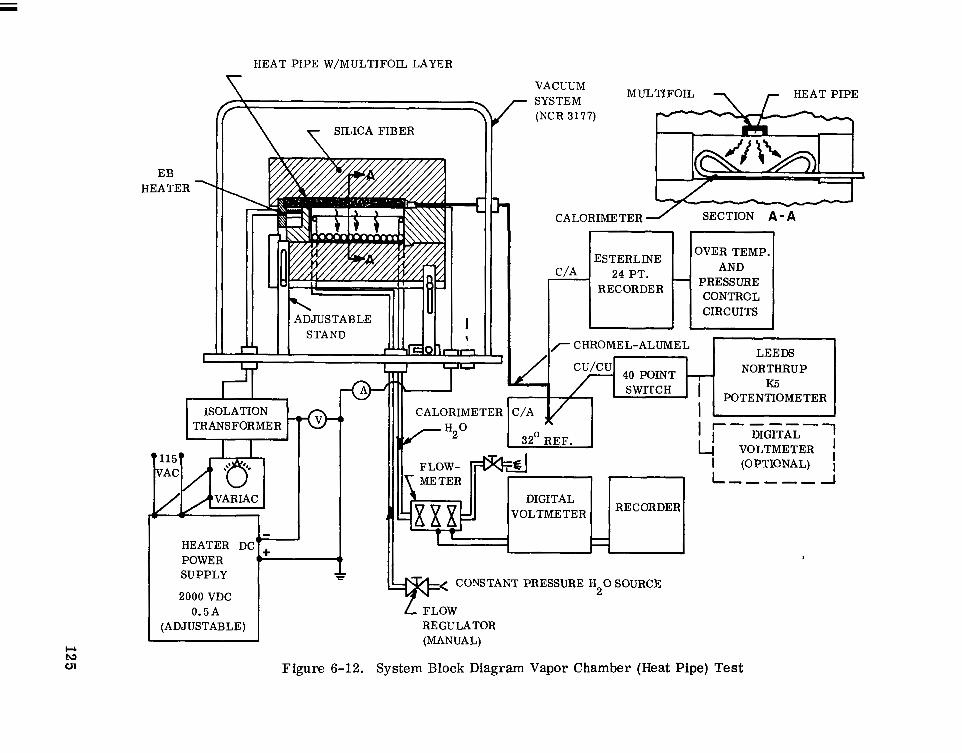
HEAT PIPE W/MULTIFOIL LAYER
SILICA FIBER
E B HEATER
J
1 ISOLATIONTI TRANSFORMER
PQ VARIAC
HEATER DC +
POWER su PPLY
2000 VDC 0.5A
(ADJUSTABLE) r"
VACUUM - SYSTEM MULTIFOIL 7 r HEAT PIPE
(NCR 3177) 2
CALORIMETER
" , C/A 1 E S Z ~ . , H o V E ~ ~ ~ M p *
PRESSURE RECORDER CONTRCL
CIRCUITS
r CMOMEL-ALUMEL .1 LEEDS
cu'cu 7 40 POINT NORTHRUP rA K5
POTENTIOMETER CALORIMETER C/A I
I r-"" DIGITAL VOLTMETER ,
I (OPTIONAL) I I
L"""l DIGITAL
VOLTMETER RECORDER
- - II "
b< CONSTANT PRESSURE H 2 0 SOURCE
L FLOW REGULATOR (MANUAL)
Figure 6-12. System Block Diagram Vapor Chamber (Heat Pipe) Test

Y
Figure 6-13. Vapor Chamber Test Setup
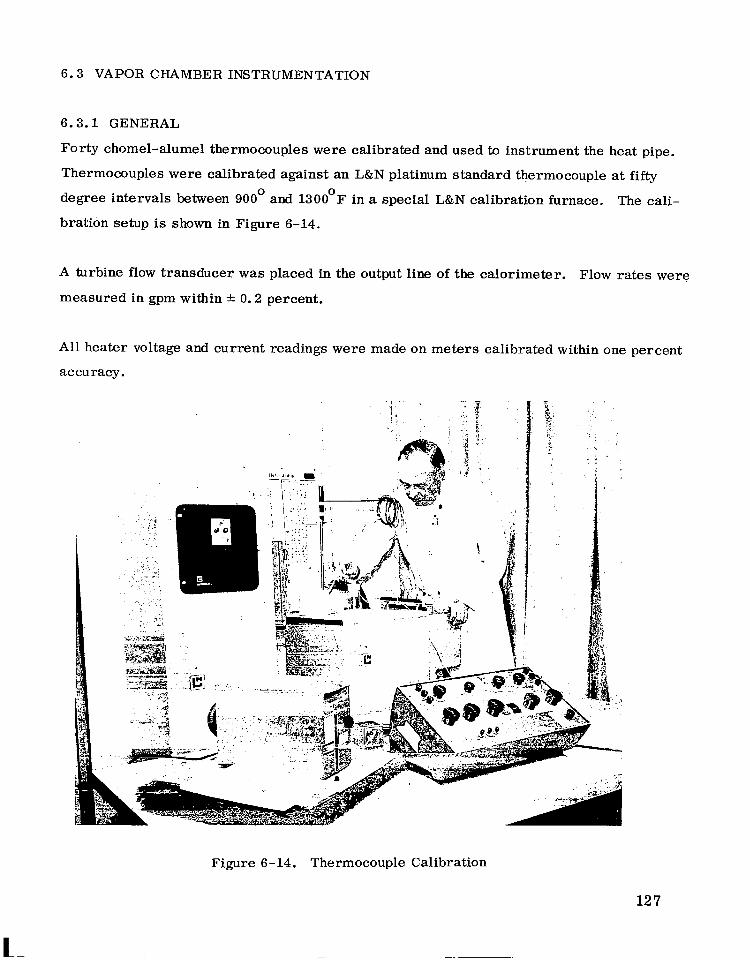
6.3 VAPOR CHAMBER INSTRUMENTATION
6.3.1 GENERAL
Forty chomel-alumel thermocouples were calibrated and used to instrument the heat pipe.
Thermocouples were calibrated against an L&N platinum standard thermocouple at fifty
degree intervals between 900° and 1300°F in a special L&N calibration furnace. The Cali-
bration setup is shown in Figure 6-14.
A turbine flow transducer was placed in the output line of the calorimeter. Flow rates were
measured in gpm within f 0.2 percent.
A l l heater voltage and current readings were made on meters calibrated within one percent
accuracy.
Figure 6-14. Thermocouple Calibration
12 7
L
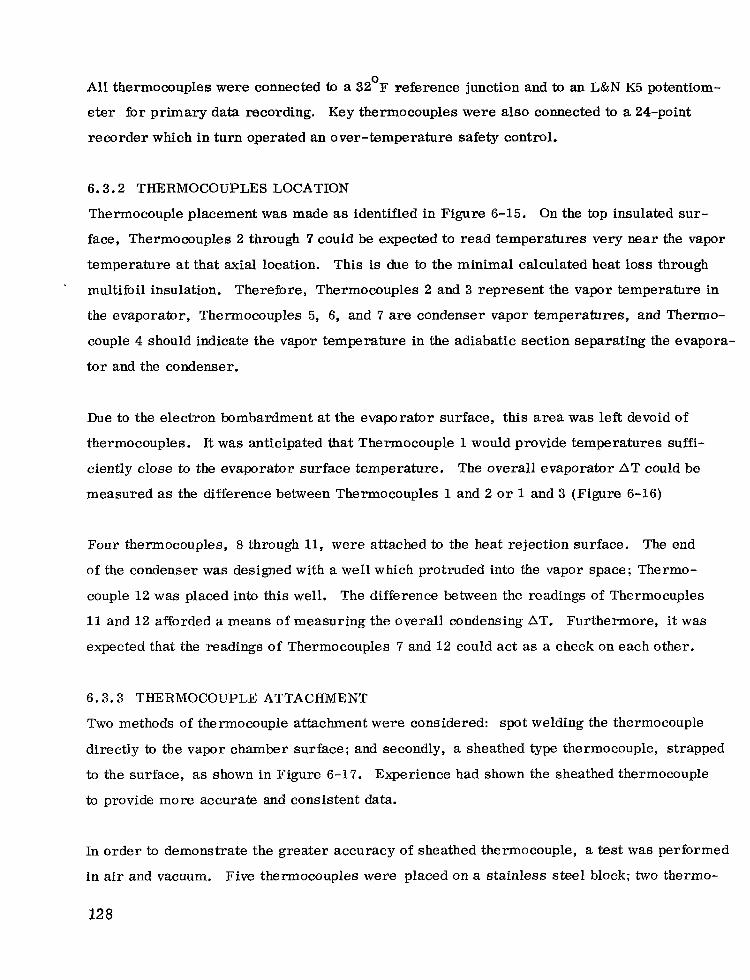
All thermocouples were connected fa a 32 F reference junction and to an L&N K5 potentiom-
eter for primary data recording. Key thermocouples were also connected to a 24-point
recorder which in turn operated an over-temperature safety control.
0
6 . 3 . 2 THERMOCOUPLES LOCATION
Thermocouple placement was made as identified in Figure 6-15. On the top insulated sur-
face, Thermocouples 2 through 7 could be expected to read temperatures very near the vapor
temperature at that axial location. This is due to the minimal calculated heat loss through
' multifoil insulation. Therefore, Thermocouples 2 and 3 represent the vapor temperature in
the evaporator, Thermocouples 5, 6, and 7 are condenser vapor temperatures, and Thermo-
couple 4 should indicate the vapor temperature in the adiabatic section separating the evapora-
tor and the condenser.
Due to the electron bombardment at the evaporator surface, this area was left devoid of
thermocouples. It was anticipated that Thermocouple 1 would provide temperatures suffi-
ciently close to the evaporator surface temperature. The overall evaporator AT could be
measured as the difference between Thermocouples 1 and 2 o r 1 and 3 (Figure 6-16)
Four thermocouples, 8 through 11, were attached to the heat rejection surface. The end
of the condenser was designed with a well which protruded into the vapor space; Thermo-
couple 12 was placed into this well. The difference between the readings of Thermocuples
11 and 12 afforded a means of measuring the overall condensing AT. Furthermore, it was
expected tha t the readings of Thermocouples 7 and 12 could act as a check on each other.
6 . 3 . 3 THERMOCOUPLE ATTACHMENT
Two methods of thermocouple attachment were considered: spot welding the thermocouple
directly to the vapor chamber surface; and secondly, a sheathed type thermocouple, strapped
to the surface, as shown in Figure 6-17. Experience had shown the sheathed thermocouple
to provide more accurate and consistent data.
In order b demonstrate the greater accuracy of sheathed thermocouple, a test was performed
in air and vacuum. Five thermocouples were placed on a stainless steel block; two thermo-
128

Z I P
Figure 6-15. Thermocouple Locations
129
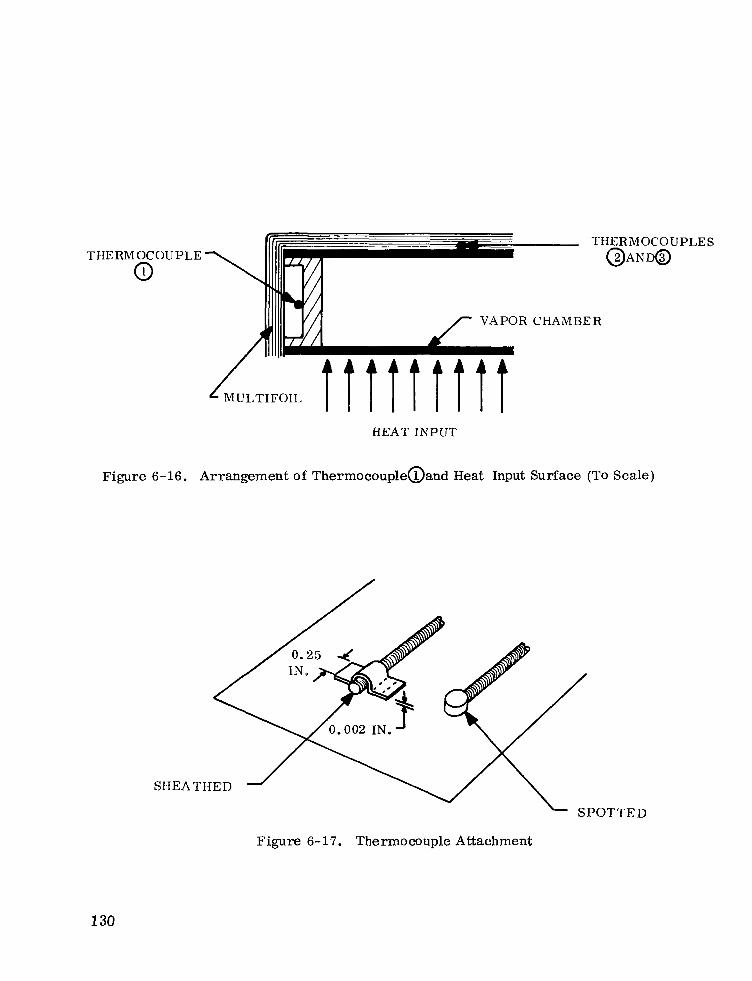
T H E R M O C O U P L E S T H E R M O C O U P L E
0 @AND@
V A P O R C H A M B E R
HEAT r NP UT
Figure 6-16. Arrangement of Thermocoupleaand Heat Input Surface (To Scale)
SI-IEATIIED
Figure 6-17. Thermocouple Attachment
130
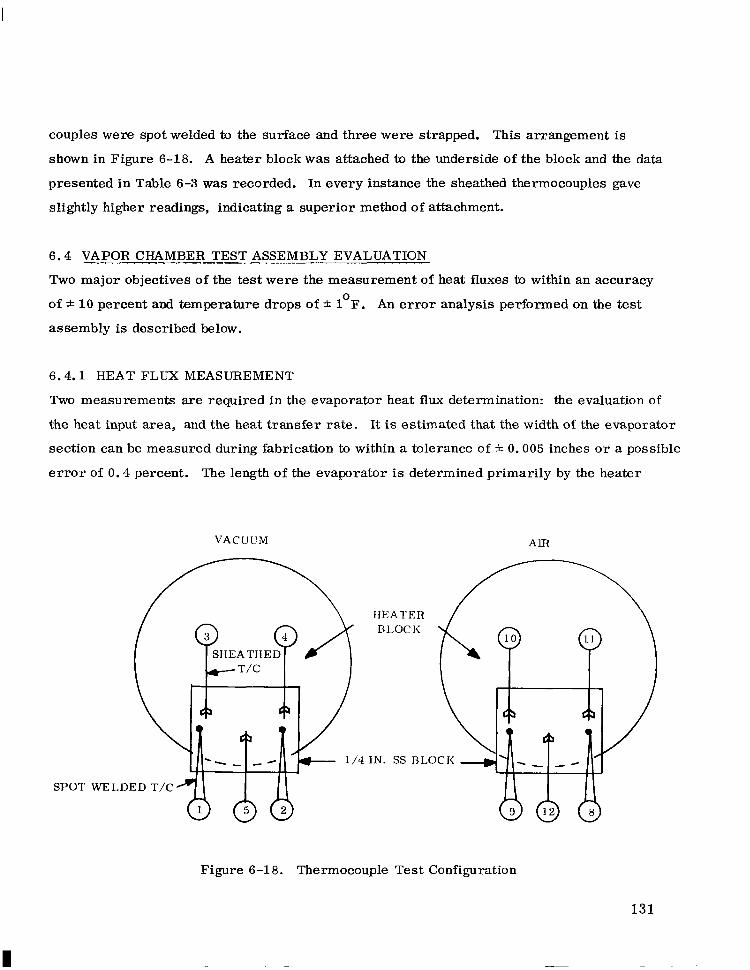
couples were spot welded to the surface and three were strapped. This arrangement is
shown in Figure 6-18. A heater block was attached to the underside of the block and the data
presented in Table 6-3 was recorded. In every instance the sheathed thermocouples gave
slightly higher readings, indicating a superior method of attachment.
6 . 4 VAPOR - CHAMBER TEST ASSEMBLY EVALUATION
Two major objectives of the test were the measurement of heat fluxes to within an accuracy
of f 10 percent and temperature drops of * 1 F. An error analysis performed on the test
assembly is described below.
. . . """""
0
6 . 4 . 1 HEAT FLUX MEASUREMENT
Two measurements are required in the evaporator heat flux determination: the evaluation of
the heat input area, and the heat transfer rate. It is estimated that the width of the evaporator
section can be measured during fabrication to within a tolerance of * 0.005 inches or a possible
e r r o r of 0.4 percent. The length of the evaporator is determined primarily by the heater
VACUUM AIR
Figure 6-18. Thermocouple Test Configuration
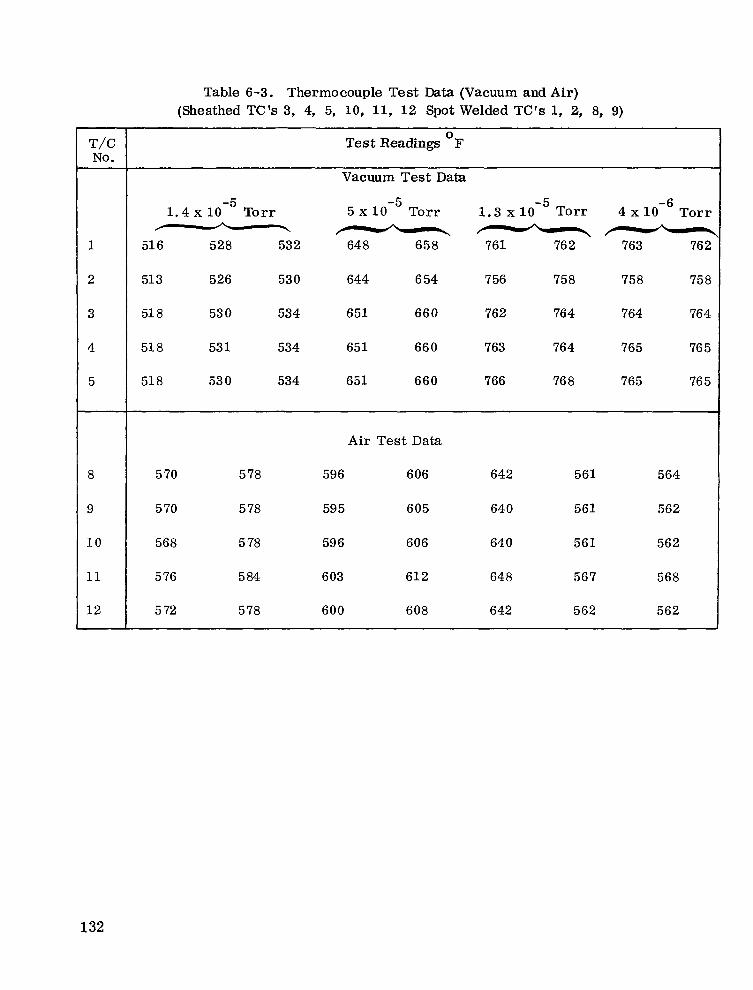
T/C No.
1
2
3
4
5
8
9
1 0
11
12
Table 6-3. Thermocouple Test Data (Vacuum and Air) (Sheathed TC's 3, 4, 5, 10, 11, 1 2 Spot Welded TC's 1, 2, 8, 9)
Test Readings F
Vacuum Test Data
0
1.4 x 10 Tor r 5 x 1 0 Torr 1.3 x 1 0 Torr 4 x Tor r
51 6 528 532 648 658 761 76 2 763 762
-5 -5 -5 - -" 51 3 526 53 0 644 6 54 7 56 758 758 75 8
51 8 53 0 534 651 660 762 764 764 76 4
51 8 53 1 534 65 1 660 763 76 4 765 76 5
51 8 53 0 534 651 660 766 76 8 765 76 5
Air Test Data
5 70 5 78 596 6 06 642 561 564
5 70 5 78 59 5 605 640 561 562
568 5 78 59 6 606 64 0 561 562
5 76 5 84 6 03 612 648 567 568
5 72 5 78 600 608 642 562 562
132
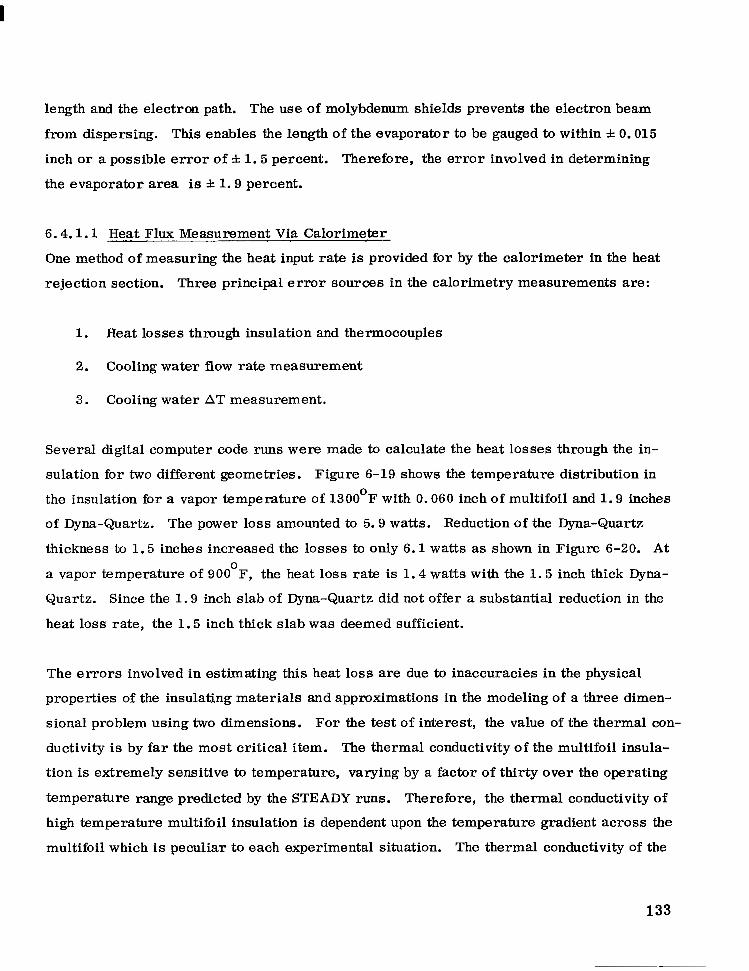
length and the electron path. The use of molybdenum shields prevents the electron beam
from dispersing. This enables the length of the evaporator to be gauged to within f 0.015
inch or a poss ib le e r ror o f f 1 . 5 percent. Therefore, the error involved in determining
the evaporator area is f 1 . 9 percent.
6 . 4 . 1 . 1 Heat Flux_ Measurement Via Calorimeter-
One method of measuring the heat input rate is provided for by the calorimeter in the heat
rejection section. Three principal error sources in the calorimetry measurements are:
1. Heat losses thmugb insulation and thermocouples
2. Cooling water flow rate measurement
3. Cooling water AT measurement.
Several digital computer code runs were made to calculate the heat losses through the in-
sulation for two different geometries. Figure 6-19 shows the temperature distribution in
the insulation for a vapor temperature of 1300°F with 0.060 inch of multifoil and 1 . 9 inches
of Dyna-Quartz. The power loss amounted to 5.9 watts. Reduction of the Dyna-Quartz
thickness to 1 . 5 inches increased the losses to only 6 . 1 watts as shown in Figure 6-20. A t
a vapor temperature of 900 F, the heat loss rate is 1 . 4 watts with the 1 . 5 inch thick Dyna-
Quartz. Since the 1 . 9 inch slab of Dyna-Quartz did not offer a substantial reduction in the
heat loss rate, the 1 . 5 inch thick slab w a s deemed sufficient.
0
The errors involved in estimating this heat loss are due to inaccuracies in the physical
properties of the insulating materials and approximations in the modeling of a three dimen-
sional problem using two dimensions. For the test of interest, the value of the thermal con-
ductivity is by far the most critical item. The thermal conductivity of the multifoil insula-
tion is extremely sensitive to temperature, varying by a factor of thirty over the operating
temperature range predicted by the STEADY runs. Therefore, the thermal conductivity of
high temperature multifoil insulation is dependent upon the temperature gradient across the
multifoil which is peculiar to each experimental situation. The thermal conductivity of the
133
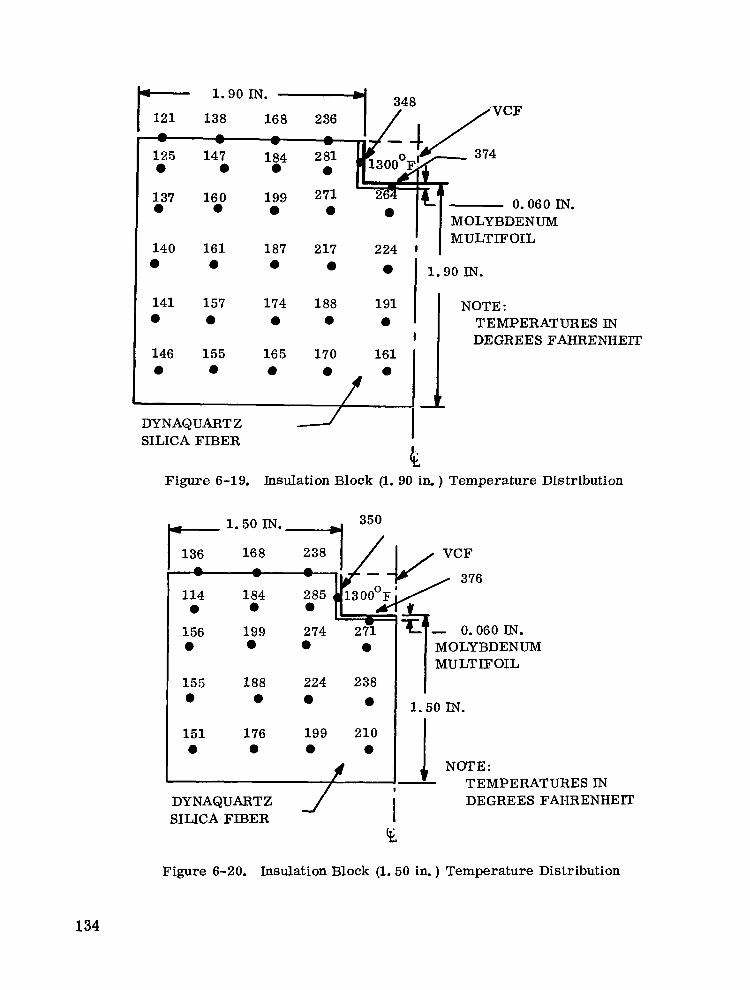
/VCF
3 74
0. MOLYBDE
060 IN. NUM
187 217 224 I ' I MULTIFOIL
0 1 1 . 9 0 IN.
141 157 174 188 191 1 NOTE:
y 6 1; :5 l:/ lil 11 0 0 0 0 0 TEMPERATURES IN I DEGREES FAHRENHEIT
DYNAQUARTZ SILICA FIBER
1; Figure 6-19. Insulation Block (1. 90 in. ) Temperature Distribution
, 1 . 5 0 IN. 350
136 16 8 :]/1/ - VCF
114 7 1 0 184 0 0 l 3 O O 0 d
376
- I
156 199 274 2 f i 0 0 0 0
155 188 224 238 0 0 0 0
151 176 199 210 0 0 0 0
#
3- 0.060 IN. MOLYBDENUM MULTIFOIL
1 . 5 0 IN.
S I N DYNAQUARTZ 1 SIUCA FIBER I DEGREES FAHRENHEm
(?i
Figure 6-20. Insulation Block (1.50 in. ) Temperature Distribution
134
Dyna-Quartz is dependent upon its temperature and density.. According to Johns-Manville,
the density can be controlled ID within210 percent which corresponds to an e r r o r of less
than - + 3 percent in the thermal conductivity. The variation of the thermal conductivity for
this material with temperature is well documented and is considered to be known to within
the accuracy permitted by the density.
In light of the uncertainties involved in the thermal conductivities, the computer runs were
run with the values corresponding to the highest temperature in the system. Therefore, the
heat loss quantities obtained by the computer runs are conservative and represent a maximum
heat leak. The extreme at the other end of the spectrum would be a heat leak approaching
zero. Therefore, the maximum percentage e r r o r involved in the insulation heat loss calcula-
tion is:
13 O O ° F
MAX. HEAT LOSS (WATTS) 6 .1 HEAT REJECTED (WATTS) 261 x 100 = - x 100 = 2.3%
900°F
" l S 4 - 1 .5% 93.6
The heat loss through the thermocouples was also estimated in a conservative manner; the
difficulty in performing an exact calculation is due to the tolerances associated with the
sheath, wire and insulation thickness. The heat loss through the 25 thermocouples was
estimated to be no greater than 2. 7 watts at 1300°F and 0.9 watt at 900°F. Using the logic
applied to the insulation heat losses, the maximum percentage error is approximately 1
percent at both 900°F and 1300'F.
A turbine flow meter was used to measure the water flow rate. Over a calibrated range the
flow meter is rated to produce an error ofkO. 2 percent. The digital voltmeter used in con-
junction with the flow meter can be calibrated to w i t h i n t 0.5 percent of the absolute accuracy
135
The determination of the water AT introduces another possible source of e r ro r . The wa te r
AT was measured by two in-line thermocouples, at the inlet to and outlet from the vacuum
chamber. By once again employing the calibration technique, an accurate evaluation of the
AT is possible. With the heat pipe inoperative, the water AT is essentially equal to zero if
the water temperature is close to that of the room; thermocouples were referenced to one
another at this condition. The accuracy of the calibration is ensured since the temperature
of the water during the test did not change appreciably. The remaining e r r o r i s limited to
that of the potentiometer reading - + 0.15%.
6.4.1.2 Heat Flux Measurement by Measuring Heat Input
The second proposed method of determining the evaporative heat flux is by measurement of
the heat input. Energy is transferred to the evaporator by electromagnetic radiation and
electron bombardment. Prior to test, the radiation contribution was estimated to be less
than eight percent of the total energy transfer. An estimate of the actual radiative energy
contribution was to be made using the calorimeter. In light of the previous analysis for the
calorimeter, the radiation contribution can be determined to within26 percent o r to within
0.48 percent of the total heat transfer.
The heating attributed to electron bombardment can be measured using a watt meter, con-
sisting of a volt and ammeter. The error introduced by these devices is 1 . 0 percent each.
No other sizable errors are envisioned using this procedure. Unfortunately, the radiative
contribution from the electron bombardment heater comprised over 60 percent of the energy
transfer. Therefore, this method of measuring the heat input to the vapor chamber could not
be employed as a check on the calorimetry.
6 . 4 . 1 . 3 Heat Flux Measurement Conclusions
Measurement of heat flux by determining the heat input was not employed. However, a s
discussed in Section 6.2, the Stephan-Boltzmann relationship w a s used to calculate the heat
being rejected from the vapor chamber. This method agreed well with the calorimetry data.
A summary of the errors involved in the calorimetry heat flux measurement is given in
Table 6-4.
136
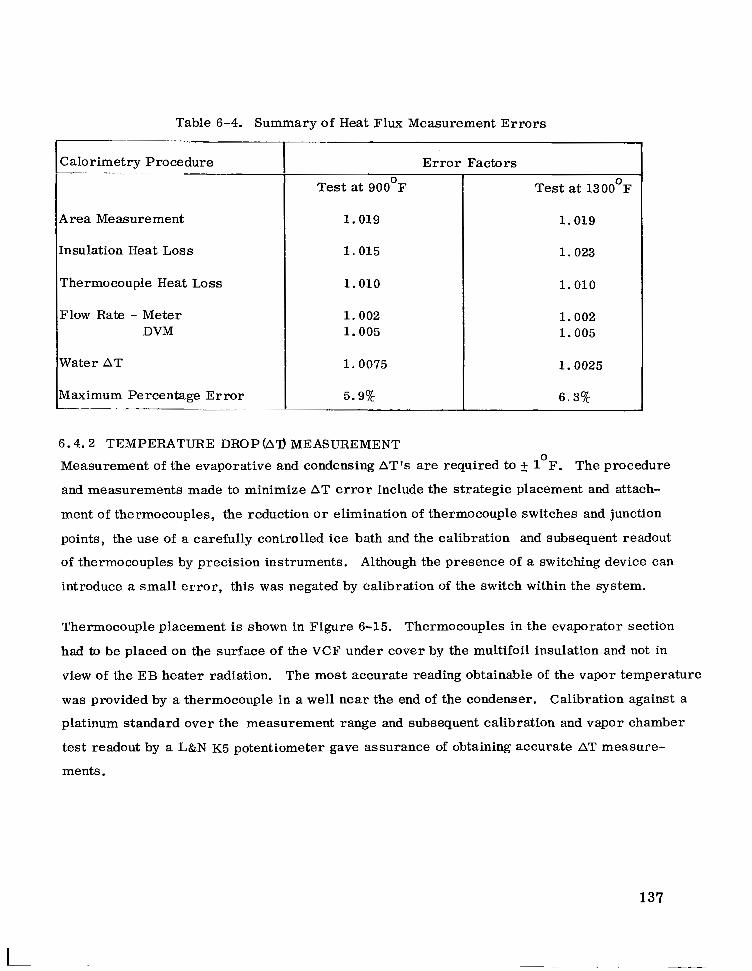
Table 6-4. Summary of Heat Flux Measurement Errors ~
Calorimetry Procedure
Area Measurement
[nsulation Heat Loss
Thermocouple Heat Loss
Flow Rate - Meter DVM
Water AT
Maximum Percentage Error ~~ . . - " . - . - .
r Error Factors
Test at 900°F
1.019
1.015
1.010
1.002 1.005
1.0075
5.9%
Test at 1300°F
1.019
1.023
1.010
1.002 1.005
1.0025
6.3%
6.4.2 TEMPERATURE DROP(A9 MEASUREMENT Measurement of the evaporative and condensing AT'S are required to t 1 F. The procedure
and measurements made to minimize AT er ror include the strategic placement and attach-
ment of thermocouples, the reduction o r elimination of thermocouple switches and junction
points, the use of a carefully controlled ice bath and the calibration and subsequent readout
of thermocouples by precision instruments. Although the presence of a switching device can
introduce a small error, this was negated by calibration of the switch within the system.
0
Thermocouple placement is shown in Figure 6-15. Thermocouples in the evaporator section
had to be placed on the surface of the VCF under cover by the multifoil insulation and not in
view of the EB heater radiation. The most accurate reading obtainable of the vapor temperature
was provided by a thermocouple in a well near the end of the condenser. Calibration against a
platinum standard over the measurement range and subsequent calibration and vapor chamber
test readout by a L&N K5 potentiometer gave assurance of obtaining accurate AT measure-
ments.
137
L

6.5 TEST DESCRIPTION AND RESULTS
The vapor chamber fin test was divided into four phases: (1) calibration of the electron
bombardment heater energy transfer; (2) heat flux and AT measurements; (3) tilt test; and
(4) limiting evaporative heat flux determination. The primary objective of the test was to
obtain accurate design data for a sodium VCF.
The following observations were made from the tests:
1. The rectangular VCF, using sodium, performed satisfactorily in the 825 F to 0
1600OF temperature range.
2. Tilting the vapor chamber through 10 degrees (evaporator raised) did not alter its ‘performance.
3. A high evaporative heat flux condition (1.4 x 10 BTU/Hr-Ft ) was attained without 5 2
evidence of burnout. Testing at higher heat fluxes was precluded by temperature limitations.
4. A condensing AT substantially larger than that predicted was observed. This AT was time dependent and decreased as a substantial amount of test hours were accumulated on the VCF.
6.5.1 CALIBRATION TEST (PHASE 1)
The purpose of the calibration test was to determine the quantity of radiative onergy trans-
ferred to the VCF from the EB heater as a function of VCF temperature. Since the EB
energy transfer can be measured by a watt meter, the sum of the electrical and radiative
measurements can be utilized to provide the total energy transfer. This information was
necessary for the second phase of the test.
Using the procedure outlined in the test plan (Appendix B). it was expected that the radiative
heat transfer could be measured to within - + 15.0 percent. However, it was anticipated that
the total radiative heat transfer would comprise less than eight percent of the total heat
transferred. The electron bombardment energy contribution was expected to be measured to
within+2.0 percent. Using the procedure outlined in the test plan, the data shown in Table
6-5 was obtained. The heating contribution due to radiation was significantly higher than that
138

I
anticipated. This was explained by an apparent overdesign of the heater. A s a result, the
overal l error involved in measuring the heat input by this method would have increased to a
greater degree than permitted by the test ground rules. Therefore, this method of measure-
ment was not pursued; the calorimetry data and the Stephan-Boltzmann relationship were
relied upon for this heat input evaluation as described in Section 6 . 4 .
Table 6-5. Radiative Heat Transfer Test Data
Evaporator Total Heat Radiative Energy Temperature Rejected Transfer
( O F ) (watts) (watts) - ~~~~ ~~ ~~
893'F
1065'F
77.0 6 8 . 9
187.0 108.0 1249'F
,156 .0 101.0 1158'F
123 .0 94.9
Percentage of Energy Transferred
by Radiation (% 1
89.5
77. 2
64. 7
57. 8
6 . 5 . 2 HEAT FLUX AND AT MEASUREMENTS (PHASE 2)
6 . 5 . 2 . 1 Evaporative Heat Flux Versus AT
The second phase of the testing obtained temperature and calorimetry data between 800 F
and 1300'F. The instrumentation as discussed in Section 6 . 3 was devised such that accurate
readings of the input surface (Thermocouple l), condenser surface temperature (Thermo-
couples 8, 9, 10 and 11) could be obtained. Figure 6-15 illustrates the location of these
thermocouples. Although no thermocuple could be placed directly on the heat input section
due to the EB heater, Thermocouple 1 provided an accurate substitute. The arrangement
of Thermocouple 1 and the evaporator surface is shown in Figure 6-16. The proximity of
Thermocouple 1 to the evaporator, the relatively good thermal path between the two, and
the presence of the multifoil insulation ensured a minimal AT between the evaporator sur-
face and Thermocouple 1 . From analytical calculations which were later substantiated by
test results, Thermocouple 1 was estimated to reflect the evaporator surface temperature
to within 1°F.
0
139
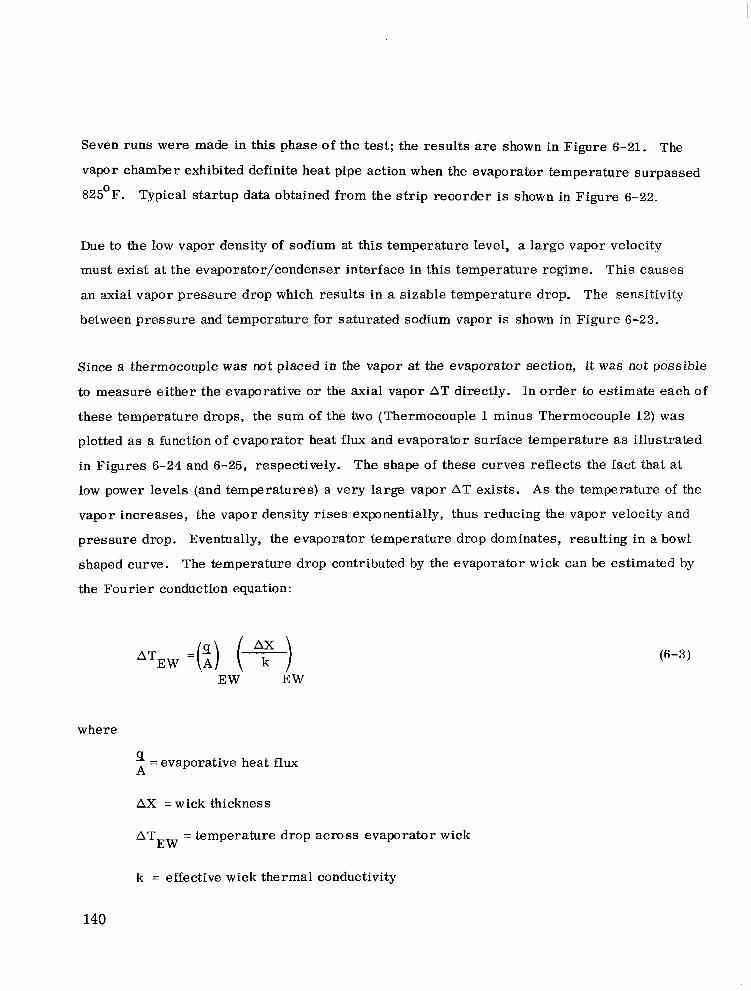
Seven runs were made in this phase of the test; the results are shown in Figure 6-21. The
vapor chamber exhibited definite heat pipe action when the evaporator temperature surpassed
825'F. Typical startup data obtained from the strip recorder is shown in Figure 6-22.
Due to the low vapor density of sodium at this temperature level, a large vapor velocity
must exist at the evaporator/condenser interface in this temperature regime. This causes
an axial vapor pressure drop which results in a sizable temperature drop. The sensitivity
between pressure and temperature for saturated sodium vapor is shown in Figure 6-23.
Since a thermocouple was not placed in the vapor at the evaporator section, it was not possible
to measure either the evaporative o r the axial vapor AT directly. In order to estimate each of
these temperature drops, the sum of the two (Thermocouple 1 minus Thermocouple 12) was
plotted a s a function of evaporator heat flux and evaporator surface temperature as illustrated
in Figures 6-24 and 6-25, respectively. The shape of these curves reflects the fact that a t
low power levels (and temperatures) a very large vapor AT exists. A s the temperature of the
vapor increases, the vapor density rises exponentially, thus reducing the vapor velocity and
pressure drop. Eventually, the evaporator temperature drop dominates, resulting in a bowl
shaped curve. The temperature drop contributed by the evaporator wick can be estimated by
the Fourier conduction equation:
where
' = evaporative heat flux A
AX = wick thickness
ATEW =temperature drop across evaporator wick
k = effective wick thermal conductivity
140
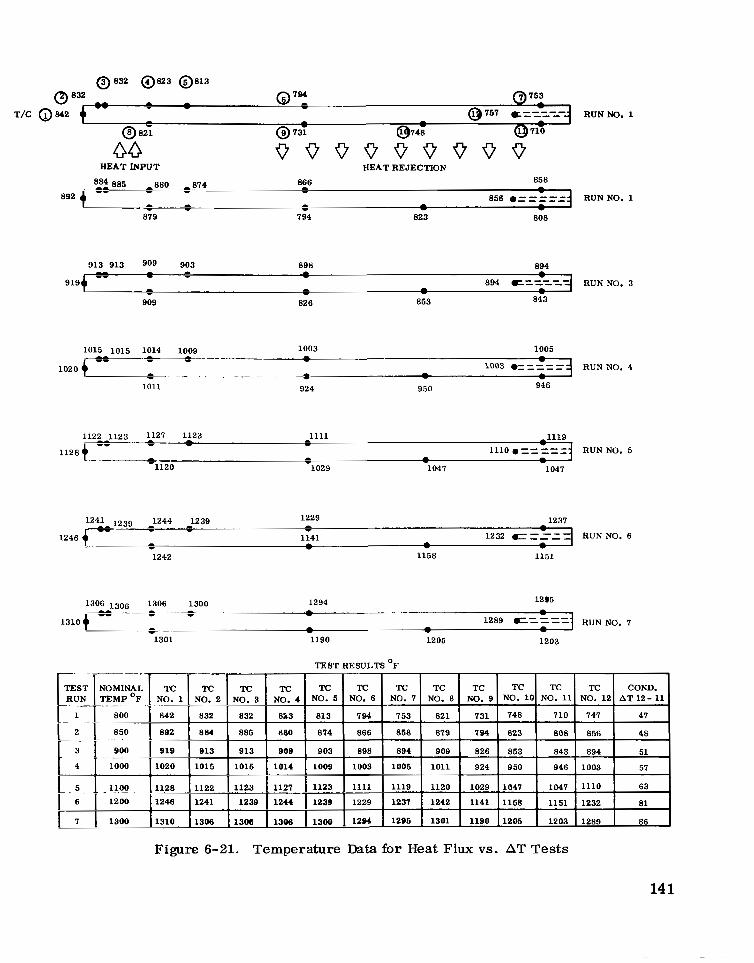
1244 1239 1229 1237 - 1246 L- a -
1141 1232 C="= - RUN NO. 6 - - - - 1242 1158 1151
1306 l ~ n ~ 1306 1300 1294 1295
TEST RESULTS OF
NO. 8 TC
821
879
909
1011
1120
1242
1301
-
-
TC NO. 9
131
794
826
924
1029
1141
1190
NO. 10 COND. TC TC TC
A T 12- 11 NO. 12 NO. 11
748
51 894 843 853
48 856 808 823
47 141 710
950 946 1003 51
1047
86 1289 1203 1205
81 1232 1151 1158
63 1110 1047
Figure 6-21. Temperature Data for Heat Flux vs. AT Tests
14 1
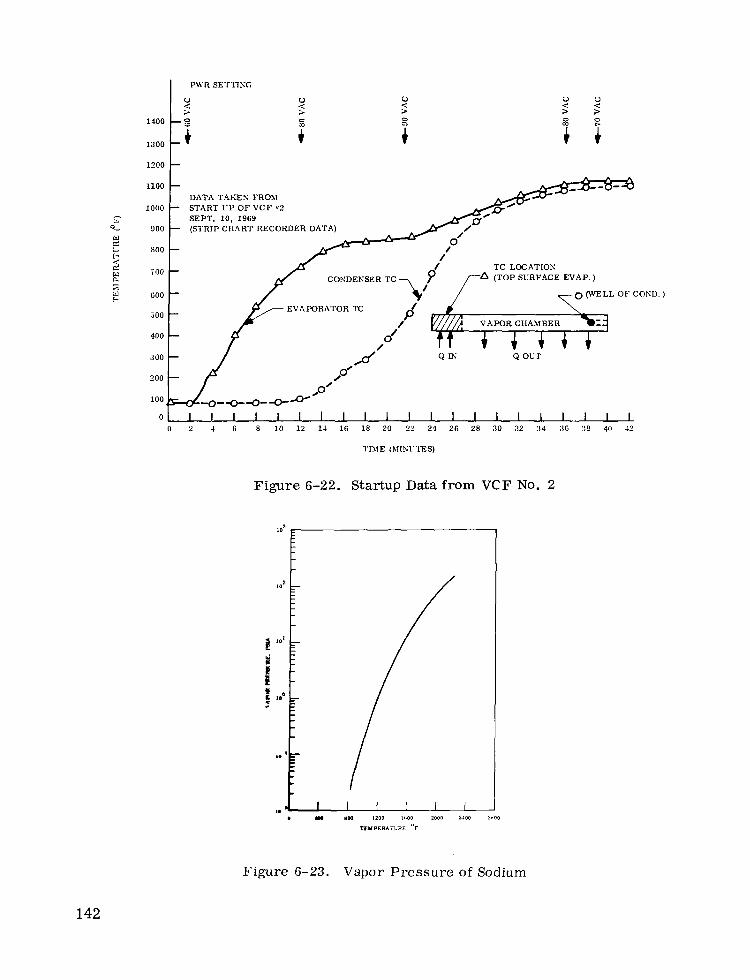
1200
DATA TAKES FROM
SEPT. 10, 1969
c L
L
700
300
200
100
700 - C03‘DENSERTCy?7,{+ i A TC (TOP LOCATION ~ SURFACE + ~~~ EVAP. )
400 -
GOO
,700
- 0 (WELL EVAPORATOR TC -
/ VAPOR CHAMBER
O/ /
300 - Q r r ; Q OUT
/ d
‘ T C 1 p’
/ ,o/
4 [A (TOP SURFACE EVAP.) TC LOCATION
/ T O (WELL
7f57G.F VAPOR CHAMBER
Q r r ; Q OUT
OF COKU.)
Figure 6-22. Startup Data from VCF No. 2
TEMPERATURE. “F
Figure 6-23. Vspor Pressure of Sodium
142
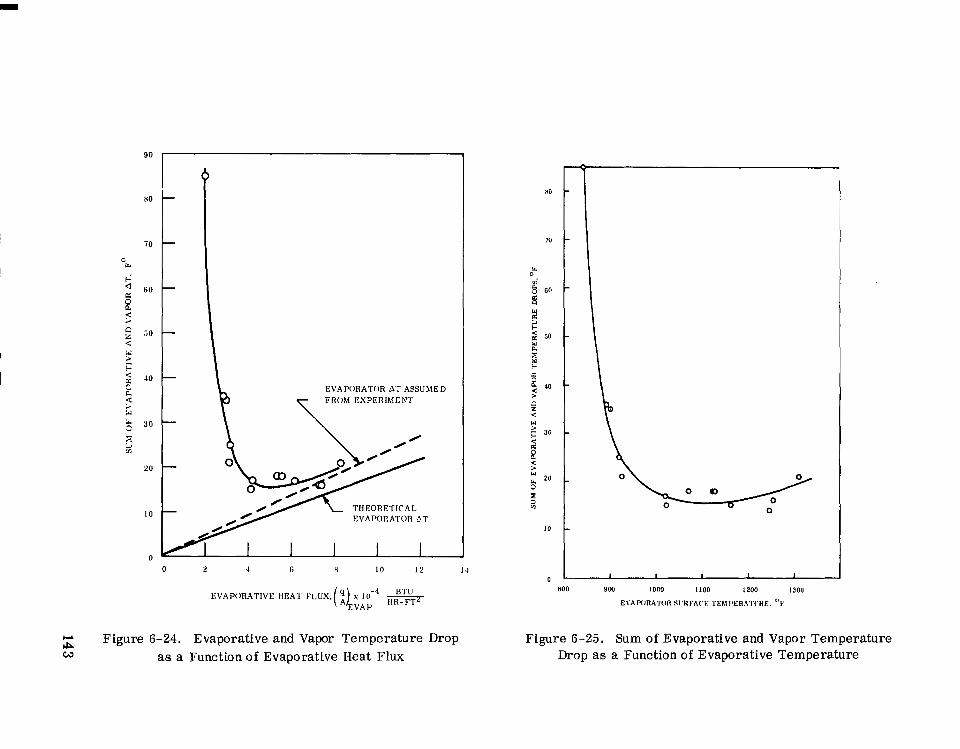
EVAPORATOR A T ASSUMED
THEORETICAL EVAPORATOR >T
C-r Figure 6-24. Evaporative and Vapor Temperature Drop A W as a Function of Evaporative Heat Flux
Figure 6-25. Sum of Evaporative and Vapor Temperature Drop as a Function of Evaporative Temperature
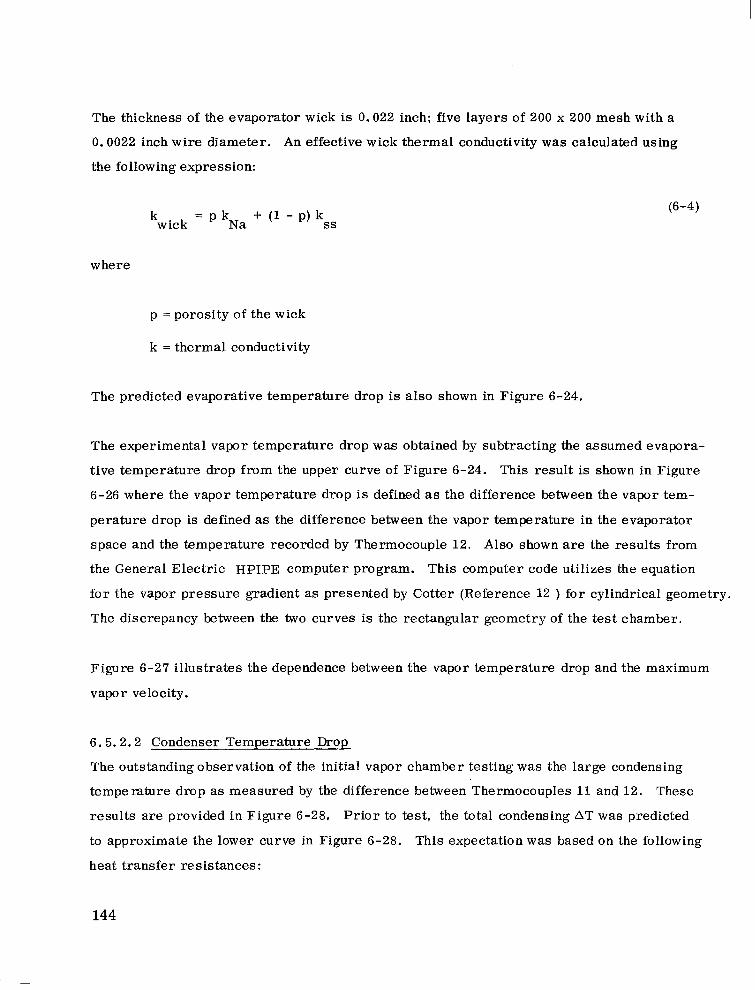
The thickness of the evaporator wick is 0.022 inch; five layers of 200 x 200 mesh with a
0.0022 inch wire diameter. An effective wick thermal conductivity was calculated using
the following expression:
where
p = porosity of the wick
k = thermal conductivity
The predicted evaporative temperature drop is also shown in Figure 6-24.
The experimental vapor temperature drop was obtained by subtracting the assumed evapora-
tive temperature drop from the upper curve of Figure 6-24. This result is shown in Figure
6-26 where the vapor temperature drop is defined as the difference between the vapor tem-
perature drop is defined as the difference between the vapor temperature in the evaporator
space and the temperature recorded by Thermocouple 12. Also shown are the results from
the General Electric HPIPE computer program. This computer code utilizes the equation
for the vapor pressure gradient as presented by Cotter (Reference 12 ) for cylindrical geometry.
The discrepancy between the two curves is the rectangular geometry of the test chamber.
Figure 6-27 illustrates the dependence between the vapor temperature drop and the maximum
vapor velocity.
6.5.2.2 Condenser Temperature Drop
The outstanding observation of the initial vapor chamber testing was the large condensing
temperature drop as measured by the difference between Thermocouples 11 and 12. These
results are provided in Figure 6-28. Pr ior to test, the total condensing AT was predicted
to approximate the lower curve in Figure 6-28. This expectation was based on the following
heat transfer resistances:
144
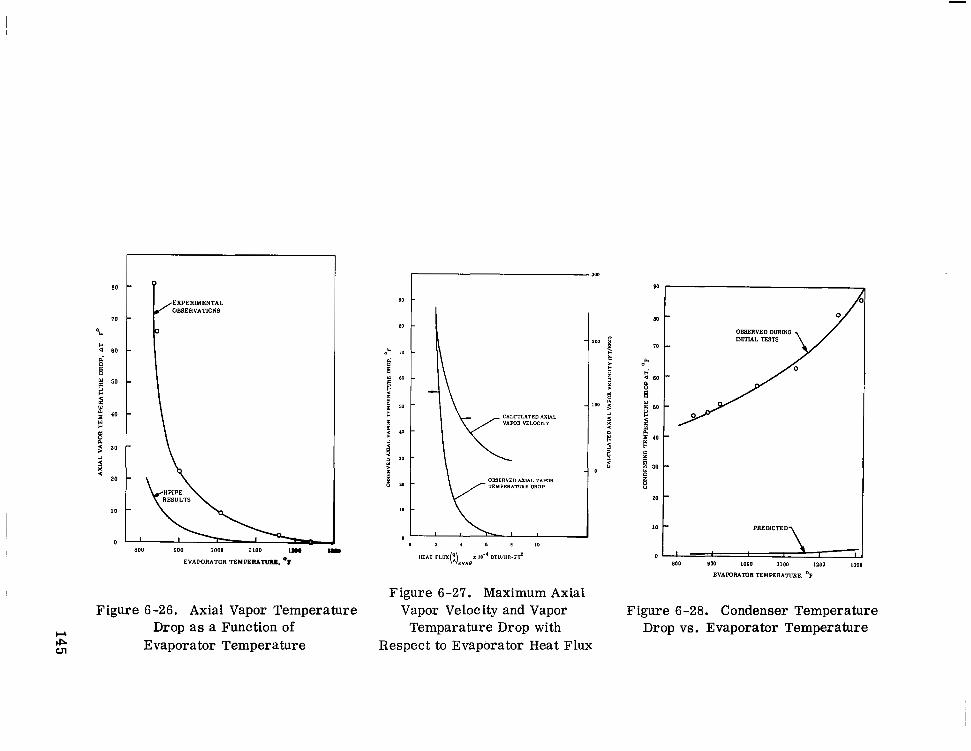
RESULTS
Figure 6-27. Maximum Axial Figure 6-26. Axial Vapor Temperature Vapor Velocity and Vapor
w I&
Drop a s a Function of Temparature Drop with
ul Evaporator Temperature Respect to Evaporator Heat Flux
10 - PREMC'TED
0 ' I L BDD PW ID00 1100 1200 1300
EVAPORATOR TEMPERATURE. OF
Figure 6-28. Condenser Temperature Drop vs. Evaporator Temperature
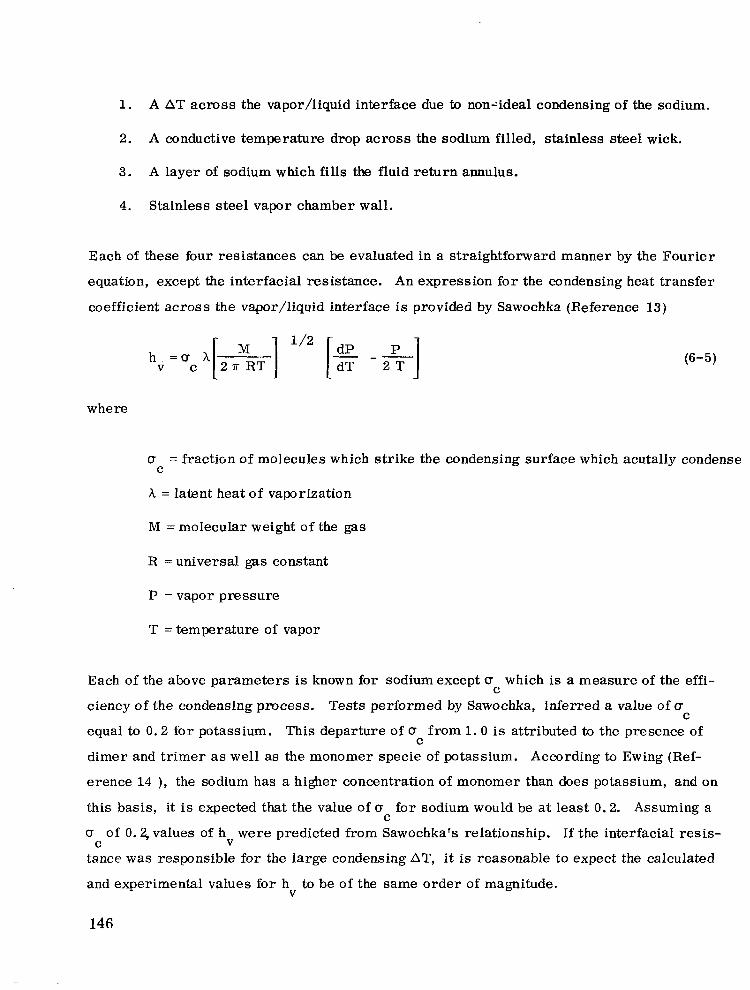
1. A AT across the vapor/liquid interface due to non-ideal condensing of the sodium.
2. A conductive temperature drop across the sodium filled, stainless steel wick.
3. A layer of sodium which fills the fluid return annulus.
4. Stainless steel vapor chamber wall.
Each of these four resistances can be evaluated in a straightforward manner by the Fourier
equation, except the interfacial resistance. An expression for the condensing heat transfer
coefficient across the vapor/liquid interface is provided by Sawochka (Reference 13)
1 /2 h . = u v c A[ 2 a R T ] [E -*]
where
u = fraction of molecules which strike the condensing surface which acutally condense
h = latent heat of vaporization
C
M = molecular weight of the gas
R = universal gas constant
P = vapor pressure
T = temperature of vapor
Each of the above parameters is known for sodiumexcept u which is a measure of the effi-
ciency of the condensing process. Tests performed by Sawochka, inferred a value of u equal to 0 .2 for potassium. This departure of (J from 1 . 0 is attributed to the presence of
dimer and t r imer as well as the monomer specie of potassium. According to Ewing (Ref-
erence 14 ), the sodium has a higher concentration of monomer than does potassium, and on
this basis, it i s expected that the value of (J for sodium would be at least 0.2. Assuming a
u of 0.2, values of h were predicted from Sawochka's relationship. If the interfacial resis-
tance was responsible for the large condensing AT, it is reasonable to expect the calculated
and experimental values for h to be of the same order of magnitude.
C
C
C
C
C V
V
146
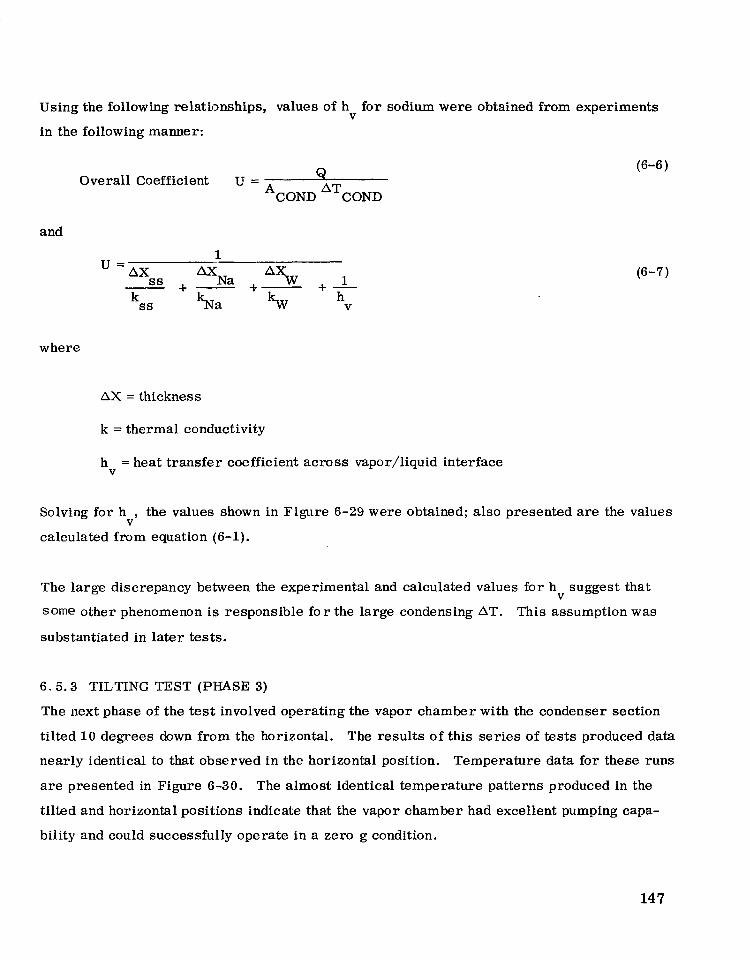
Using the following relationships, values of h for sodium were obtained from experiments
in the following manner: V
Overall Coefficient u = Q *COND AT^^^^
and
k ss %a ' h
V
where
AX = thickness
k = thermal conductivity
h = heat transfer coefficient across vapor/liquid interface V
Solving for h , the values shown in Figure 6-29 were obtained; also presented are the values
calculated from equation (6-1). V
The large discrepancy between the experimental and calculated values for h suggest that
Some other phenomenon is responsible for the large condensing AT. This assumption was
substantiated in later tests.
V
6 . 5 . 3 TILTING TEST (PHASE 3)
The next phase of the test involved operating the vapor chamber with the condenser section
tilted 1 0 degrees down from the horizontal. The results of this series of tests produced data
nearly identical to that observed in t h e horizontal position. Temperature data for these runs
are presented in Figure 6-30. The almost identical temperature patterns produced in the
tilted and horizontal positions indicate that the vapor chamber had excellent pumping capa-
bility and could successfully operate in a zero g condition.
147

IO' I
1 o6
< 2
e c LL Y
TRANSFER COEFFICIENT CALCU- INTERFACLAL CONDENSING HEAT
LATED FROM SAWCCHKA':. RELATIONSHIP
E L I
i
I
IO?
RANGE OF VALUES FOR 1lNPREDlCTEt RESISTANCE AS CAI.CVLATED FROM EXPERIMENT
10 I I I I I 800 900 1000 1100 1200 1300
CONDENSER SURFACE TEMPERATCRE. OF
Figure 6-29. Comparison of Calculated Interfacial Resistance with Observed Thermal Resistance
6 . 5 . 4 LIMITING HEAT FLUX TEST (PHASE 4)
An attempt to ascertain the limiting evaporative heat flux was terminated after reaching an
evaporator temperature of 1600 F without sign of abnormal operation. This corresponds to
an evaporator heat flux of 146,000 Btu/Hr-Ft . 2
0
Further increases in temperature were precluded by the distinct possibility of chamber
rupture. Upon removal from the test rig, the heat pipe showed a marked deformation of the
two horizontal surfaces (Figure 6-31). This was caused by the increased sodium vapor pres-
sure as well as a lower chamber wall strength. Results from the limiting heat flux test a r e
shown in Figure 6-32.
6 . 5 . 5 ADDITIONAL INVESTIGATIONS OF THE CONDENSING TEMPERATURE DROP
The large condensing temperature drop exhibited by the first V C F (Number 1) prompted the
testing of a second chamber. Consequently, Chamber Number 2, which had been fabricated
at the same time as VCF 1, was placed on test; the design of these chambers was identical.
148
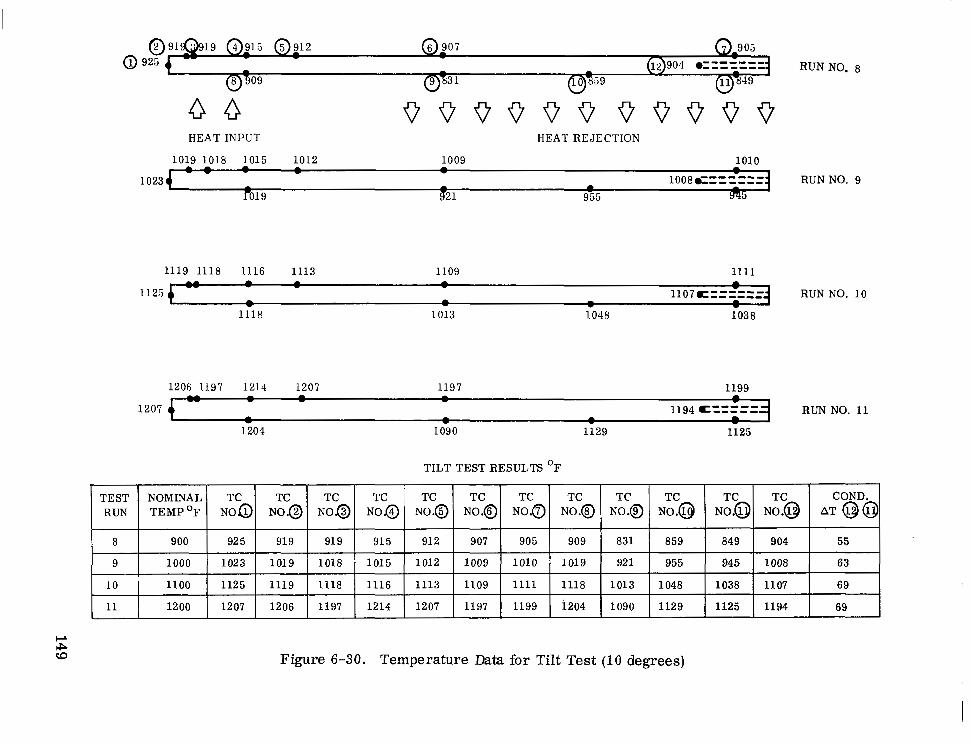
HEAT INPUT HEAT REJECTION
1019 1018 1015 1012 1009 1010 " - " - - -
1023 - 1 1 1008C====== RUN NO. 9 1019 52 1 955 945
-
1119 1118 1116 1113 1109 1111 1 1 - - -
1125 RUN NO. 10 - - - - 1118 1013 1048 1038
1206 1197 1214 1207 1197 1199 1 - - - -
1207 1194 t===== RUN NO. 11 a - - -
1204 1090 1129 1125
TILT TEST RESULTS OF
TEST COND. TC TC TC TC TC TC TC TC TC TC TC TC NOMINAL RUN AT @@ NO.@ NO.@ NO.@ NO.@ NO.@ NOD NO.@ NO.@ NO@ NO@ NO.@ NO^ TEMPOF
8
69 1107 1038 1048 1013 1118 1111 1109 1113 1116 1118 1119 1125 1100 10
63 1008 945 955 921 1019 1010 1009 1012 1015 1018 1019 1023 1000 9
55 904 849 859 831 909 905 907 912 915 919 919 925 900
11 69 1194 1125 1129 1090 i204 1199 1197 1207 1214 1197 1206 1207 1200
Figure 6-30 . Temperature Data for Tilt Test (10 degrees)

Figure 6-31. Deformation of Heat Pipe After Limiting Heat Flux Test
Initial results obtained from the testi,ig of VCF 2 were comparable to those of VCF 1 . Sub-
sequently, testing of VCF 2 was halted while tests of other wick configurations proceeded
yielding inconclusive results. VCF 2 was again placed on test ten weeks later. These tests
were conducted in the same test facility and utilized instrumentation previously used. In
this series of investigations, the observed condensing drops were markedly lower; Figure
6-33 summarizes these observations.
In neither series of tests did the condensing temperature drop approach predicted figures.
However, using even the worst data obtained, the VCF is 80 percent efficient. A seven inch
length of stainless steel, 0. 040 inch thick, has a fin efficiency of approximately ten percent
at 1 1 0 0 ~ ~ .
6 . 5 . 6 DISCUSSION OF TEST RESULTS
The data provided by Figure 6-24 indicate that the evaporative temperature drop matched the
predicted values closely. This result becomes clear upon examination of data in the higher
150
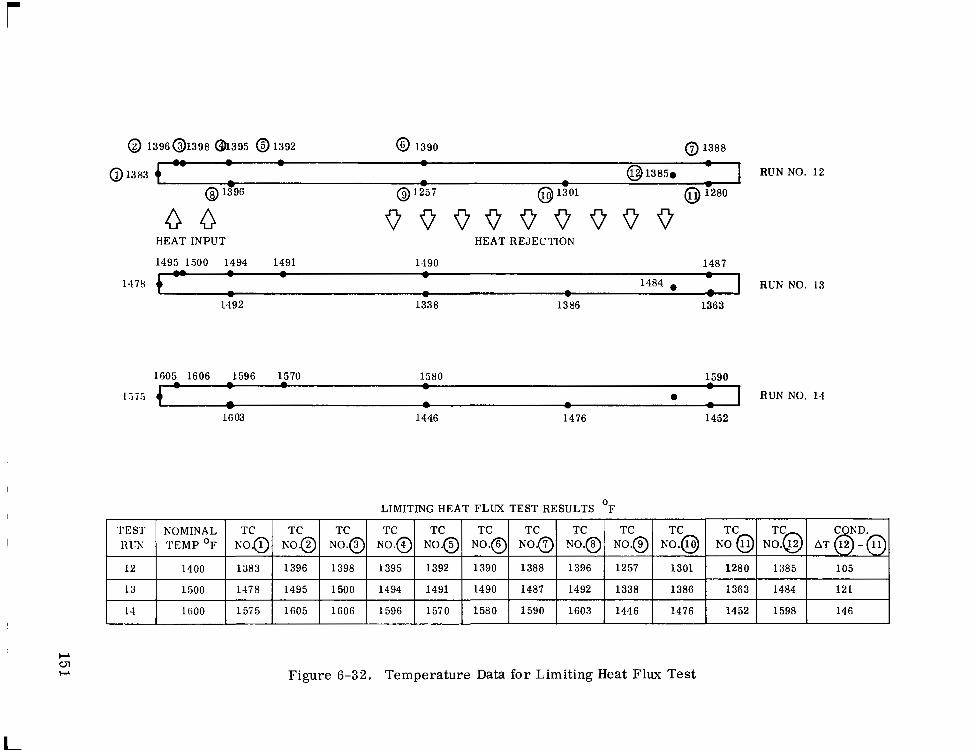
r
@ 139601398 a 3 9 5 @ 1392 @ 1390 0 1388
HEAT INPUT
1495 1500 1494 1491
HEAT REJECTION
1.190 1487
1478
1492 1338 1386 1363
1605 1606 1596 1570 1580
RUN NO. 12
RUN NO. 13
, LIMITING HEAT FLUX TEST RESULTS O F
TEST COKD. TC TC TC TC TC TC TC TC TC TC TC TC NOMINAL RlTi AT 0-0 NO.@ KO 0 NO.@ NO.@ NO.@ N 0 . O N O . 8 NO.@ NO.@ NO.@ KO@ NO.@
TEMP OF
12
146 1598 1452 1476 1446 1603 1590 1580 1570 1596 1G06 1605 1575 1600 11
121 1484 1363 1386 1338 1492 1487 1490 1491 1494 1500 1495 1478 1500 13
105 1385 1280 1301 1257 1396 1388 1390 1392 1395 1398 1396 1883 1400
Figure 6-32. Temperature Data for Limiting Heat Flux Test

VCF 2
TEST 1
CONDENSING A T (OF)
VCF 2 TEST 2
CONDEtSlNG AT ( F)
THEORETICAL CONDENSING
I T ( O F )
90O0E'
N . A .
I
ATC 9
ATc 0.8
lOOO'F
ATc 38
TEMPERATURES I N '1;
11 OO'F
1025
A T ~ 4 5
a 0 1077
ATc 14
ATc l.G
1200'F
1122
ATc . 50
I;] N.A.
1300°F
1222
ATc 54
-1 1252
A T c 18
4 T c 2 .5
DECEMBER 3 . 1969
FEBRUARY 16. 1974
Figure 6-33. Condenser Test Results of V C F No 2

heat flux regions where the vapor frictional pressure drop must approach zero. Observed
axial vapor temperature drops were within reasonable bounds of the expected values. Due
to the exponential dependence of saturation vapor pressure with respect to temperature, the
large disparity between calculated and observed data in the lower temperature regime is to
be expected.
The condensing temperature drop, which is defined as the difference between the vapor and
condenser surface temperatures, was more than an order of magnitude larger than that pre-
dicted. Evaluation of the thermal barrier strongly suggests that a gaseous resistance must
be present between the bulk vapor and condenser surface over a substantial portion of the
condensing area. The logical conclusion is that the annulus beneath the condenser screen
(see Figure 6-3) was incompletely filled with sodium. This statement is supported by two
additional facts. Firs t , the condensing surface temperature distributions are relatively
uneven; see Figure 6-21. Secondly, the thermal resistance offered by a layer of sodium
vapor 0.020 inch thick is greater than that observed (h- 7). Therefore, the value of the un-
explained observed thermal resistance is intermediate between that of a 0.020 inch layer of
sodium vapor and a 0.020 inch layer of sodium liquid.
The reason for the improved performance of the vapor chamber when subjected to further
testing cannot be explained with any certainty. However, it appears probable that some
conditioning process between the sodium and stainless steel screen occurred which enabled
the sodium to distribute more evenly and completely beneath the screen.
153
I

SECTION 7
RADIATOR DESIGN, ANALYSIS AND FABRICATION
7 . 1 GENERAL DISCUSSION
The development of a vapor chamber fin radiator was proposed a s a method of obtaining a
lighter, smaller and more reliable heat rejection system than the more conventional con-
duction fin radiator. However, the added cost of developing the vapor chamber fin radiator
can only be justified if its characteristics are significantly superior to more conventional
systems. The prime objectives of this radiator design study a r e to identify a promising
Rankine cycle vapor chamber radiator and compare this radiator to the alternative con-
duction fin radiator. This study formulates conceptual designs which offer the best potential
performance for both the stainless steel vapor chamber and stainless steel clad copper
conduction fin radiators.
The basic ground rules imposed on both radiators are identified in Table 3-1 of Section 3.
7 .2 CONDUCTION FIN RADIATOR
7 . 2 . 1 CONDUCTION FIN RADIATOR ANALYSIS
7 .2 .1 .1 General
The configuration of the conduction fin radiator used in this study was dictated primarily
by the requirements specified in Section 3. The offset fin/tube geometry as shown in
Figure 7-1 was employed. The tube and armor material was 316 stainless steel; the fin
material, a composite of stainless steel and copper. The high thermal conductivity of copper
enables high fin efficiencies to be obtained with reasonable fin thicknesses, while the stain-
less steel in the f i n provides the necessary structural rigidity. Copper is used a s the interior
material since the exterior iron titanate emissive coating adheres more readily to stainless
steel.
154
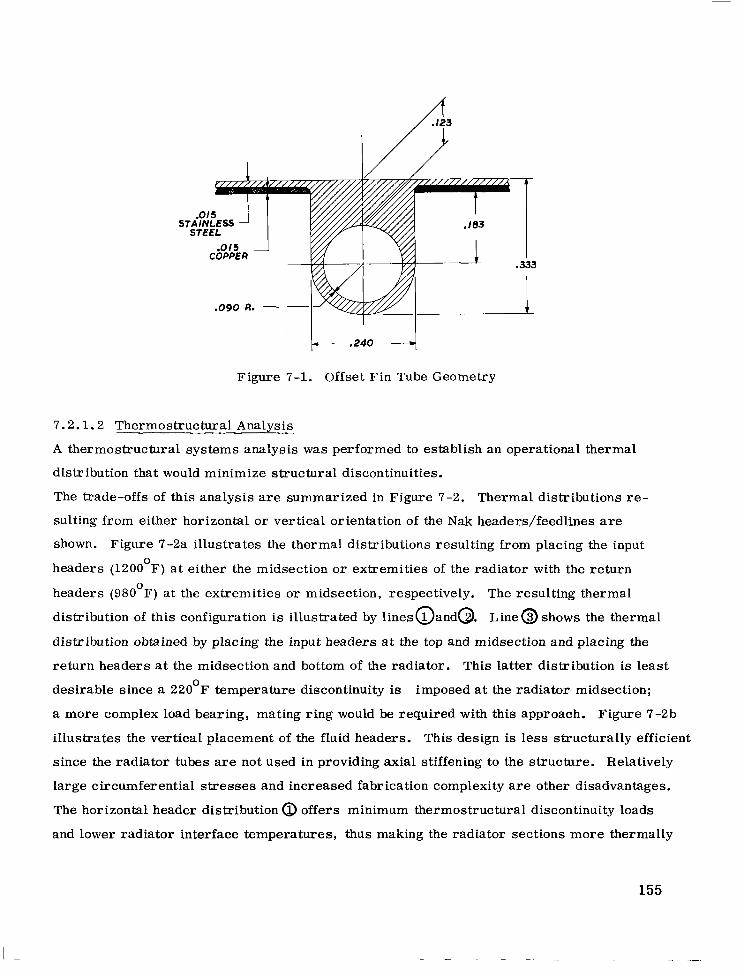
-090 R. 1- 1 .333
1 ,240 4
Figure 7-1. Offset Fin Tube Geometry
7.2.1.2 Thermostructural Analysis
A thermostructural systems analysis was performed to establish an operational thermal
distribution that would minimize structural discontinuities.
The trade-offs of this analysis are summarized in Figure 7-2. Thermal distributions re-
sulting from either horizontal or vertical orientation of the Nak headers/feedlines are
shown. Figure 7-2a illustrates the thermal distributions resulting from placing the input
headers (1200 F) at either the midsection or extremities of the radiator with the return
headers (980 F) a t the extremities or midsection, respectively. The resulting thermal
distribution of this configuration is illustrated by l i n e s a a n d a . Line@ shows the thermal
distribution obtained by placing the input headers at the top and midsection and placing the
return headers at the midsection and bottom of the radiator. This latter distribution is least
desirable since a 220 F temperature discontinuity is imposed at the radiator midsection;
a more complex load bearing, mating ring would be required with this approach. Figure 7-2b
illustrates the vertical placement of the fluid headers. This design is less structurally efficient
since the radiator tubes are not used in providing axial stiffening to the structure. Relatively
large circumferential stresses and increased fabrication complexity are other disadvantages.
The horizontal header distribution @ offers minimum thermostructural discontinuity loads
and lower radiator interface temperatures, thus making the radiator sections more thermally
0
0
0
155
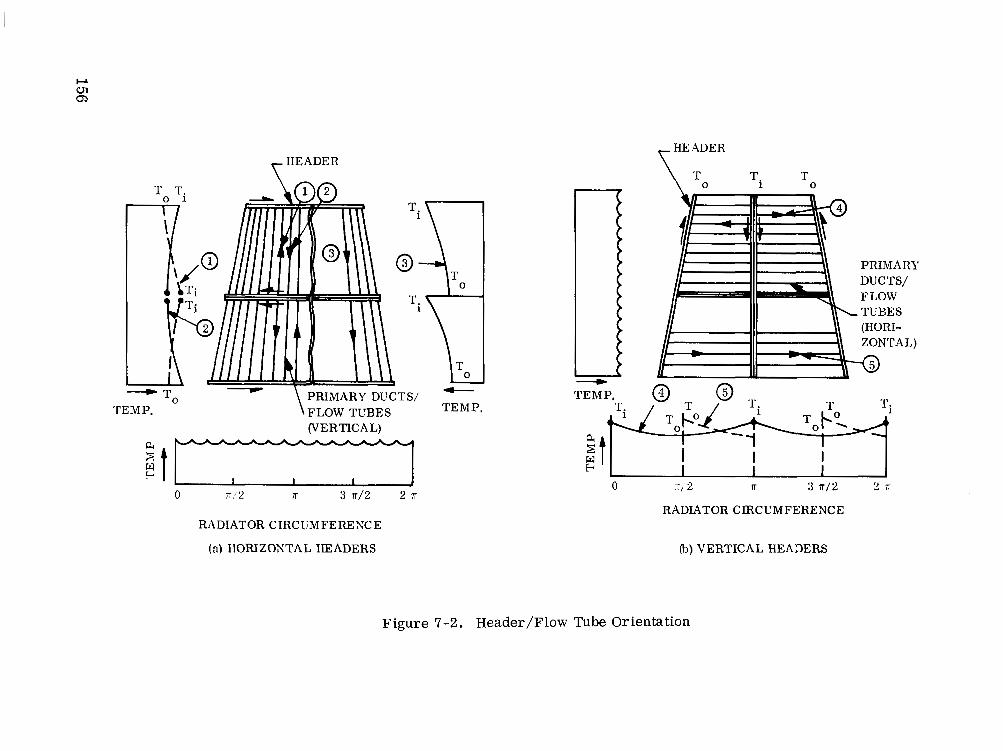
TEMP. \FLOW TUBES (VERTICAL)
RADIATOR CIRCUMFERESCE
(a) HOFUZOKTAL HEADERS
+ T E M P ,
6) VERTICAL HEADERS
Figure 7-2. Header/Flow Tube Orientation
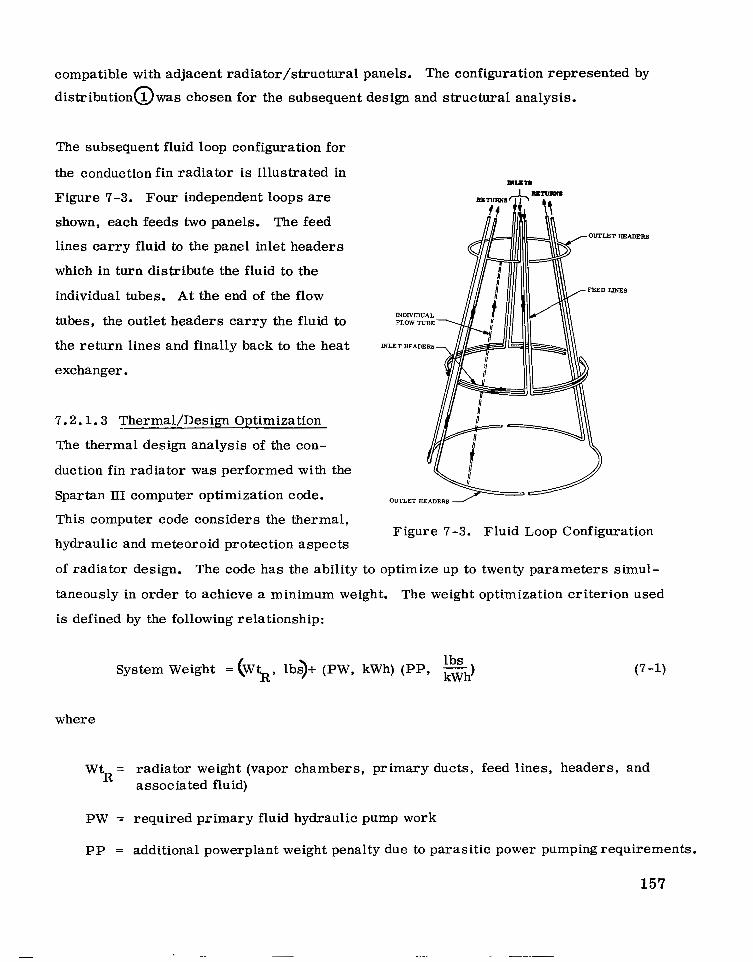
compatible with adjacent radiator/structural panels. The configuration represented by
distributionawas chosen for the subsequent design and structural analysis.
The subsequent fluid loop configuration for
the conduction fin radiator is illustrated in
Figure 7-3. Four independent loops are llL-
shown, each feeds two panels. The feed
lines carry fluid to the panel inlet headers
which in turn distribute the fluid to the
individual tubes. At the end of the flow
tubes, the outlet headers carry the fluid to FLOW 'ITBE
the return lines and finally back to the heat NUTHEADERS
exchanger.
aun
~ D W D U A L
7 . 2 . 1 . 3 Thermal/Design Optimization
tLJ The thermal design analysis of the con- 4 duction fin radiator was performed with the
Spartan III computer optimization code. OUTLET HEADERS
This computer code considers the thermal,
hydraulic and meteoroid protection aspects
of radiator design. The code has the ability to optimize up to twenty parameters simul-
taneously in order to achieve a minimum weight. The weight optimization criterion used
is defined by the following relationship:
I f
Figure 7-3. Fluid Loop Configuration
System Weight = ( W h , lbs)+ (PW, kwh) (PP, kwh) 1 bs
where
W h = radiator weight (vapor chambers, primary ducts, feed lines, headers, and associated fluid)
P W = required primary fluid hydraulic pump work
PP = additional powerplant weight penalty due to parasitic power pumpingrequirements.
157
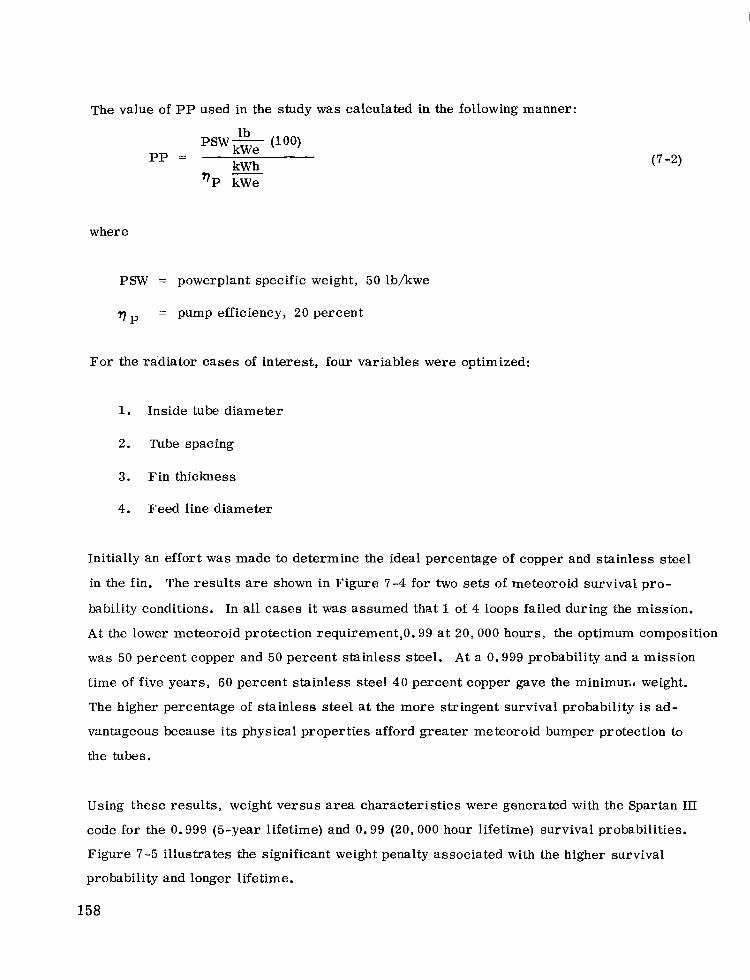
The value of PP used in the study was calculated in the following manner:
where
PSW = powerplant specific weight, 50 lb/kwe
r ] = pump efficiency, 20 percent
For the radiator cases of interest, four variables were optimized:
1. Inside tube diameter
2. Tube spacing
3. Fin thickness
4. Feed line diameter
Initially an effort was made to determine the ideal percentage of copper and stainless steel
in the fin. The results are shown in Figure 7-4 for two sets of meteoroid survival pro-
bability conditions. In all cases it was assumed that 1 of 4 loops failed during the mission.
At the lower meteoroid protection requirement,O. 99 at 20,000 hours, the optimum composition
was 50 percent copper and 50 percent stainless steel. A t a 0.999 probability and a mission
time of five years, 60 percent stainless steel 40 percent copper gave the minimum weight.
The higher percentage of stainless steel at the more stringent survival probability is ad-
vantageous because its physical properties afford greater meteoroid bumper protection to
the tubes.
Using these results, weight versus area characteristics were generated with the Spartan I11
code for the 0.999 (5-year lifetime) and 0.99 (20,000 hour lifetime) survival probabilities.
Figure 7-5 illustrates the significant weight penalty associated with the higher survival
probability and longer lifetime.
158
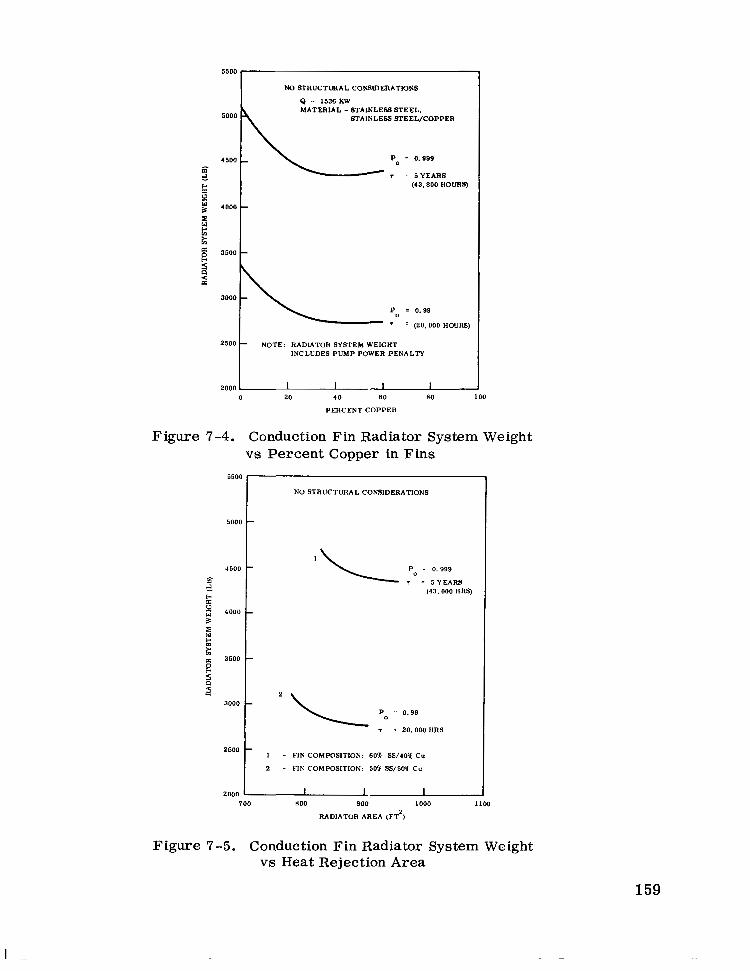
NO SCRL'CTURAL CONSIDERATIONB
e - 1536 KW MATERIAL - STAINLESS STEEL,
.WAINLEES B T E E L K O P P E R
P -- 0.999
P 1
2
- 7 . 5 Y E A R S
g (43.800 HOURS)
$ 4000 -
NOTE: RADIATOR SYSTEM WEIGHT INCLtiDES PUMP POWER PENALTY
2000 - 2 0 40 60 80 IO0
P F B C E N T C O P P E R
Figure 7-4. Conduction Fin Radiator System Weight vs Percent Copper in Fins
NO STRUCTURAL CONSIDERATIONS
(49.000 HRS)
1 - FIN COMPOSlTlOPi: 60% SS/40% Cu
2 - FIX COMPOSITIOPI': 5CfX S S / S H Cu
I I 1 700 do0 900 1000 1100
RADIATUR AREA (FT2)
Figure 7-5. Conduction Fin Radiator System Weight vs Heat Rejection Area
159
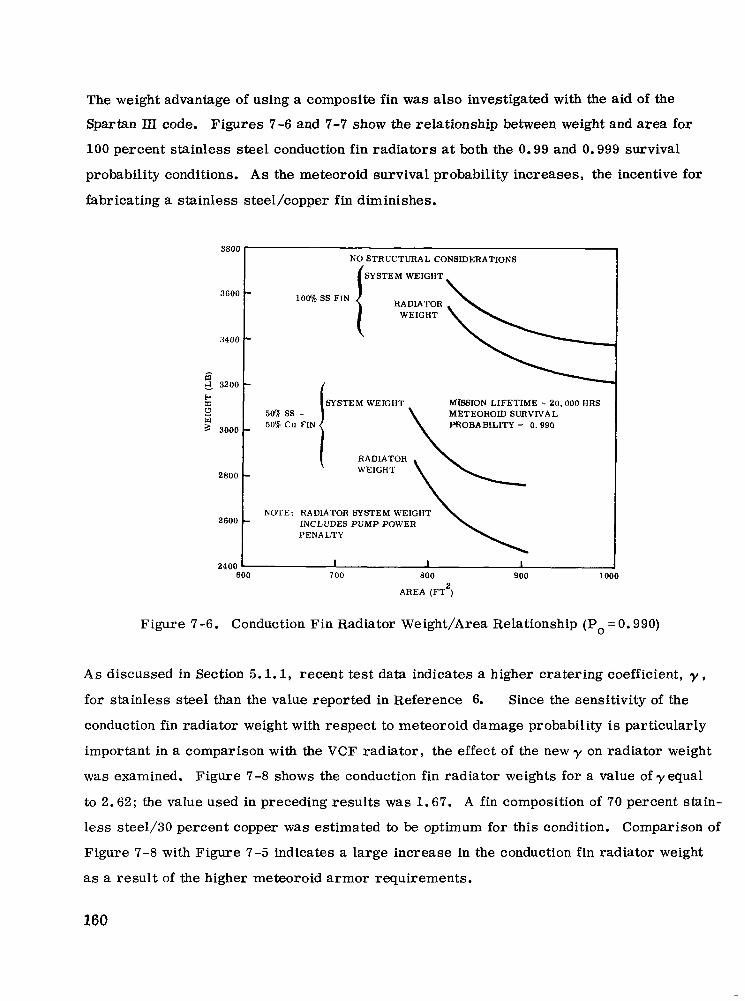
The weight advantage of using a composite fin was also investigated with the aid of the
Spartan III code. Figures 7-6 and 7-7 show the relationship between weight and area for
100 percent stainless steel conduction fin radiators at both the 0.99 and 0.999 survival
probability conditions. A s the meteoroid survival probability increases, the incentive for
fabricating a stainless steel/copper fin diminishes.
3800 NO STRUCTURAL CONSIDERATIONS
SYSTEM WEIGHT
3600 - 100% SS FIN
:1400 -
el 3200
z SYSTEM WEIGHT MISSION LIFETIME : 20,000 HRS 0 METEOROID SURVIVAL
MOBABILITY = 0.990
2800 -
2600 - NOTE: RADIATOR SYSTEM WEIGHT INCLUDES PUMP POWER PENALTY
2400 600 700 800 900 101
AREA ( F T ) 2
Figure 7-6. Conduction Fin Radiator Weight/Area Relationship (Po = O . 990)
A s discussed in Section 5.1.1, recent test data indicates a higher cratering coefficient, y , for stainless steel than the value reported in Reference 6. Since the sensitivity of the
conduction fin radiator weight with respect to meteoroid damage probability is particularly
important in a comparison with the VCF radiator, the effect of the new y on radiator weight
was examined. Figure 7-8 shows the conduction fin radiator weights for a value of yequal
to 2.62; the value used in preceding results was 1.67. A fin composition of 70 percent stain-
less steel/30 percent copper was estimated to be optimum for this condition. Comparison of
Figure 7-8 with Figure 7-5 indicates a large increase in the conduction fin radiator weight
as a result of the higher meteoroid armor requirements.
160
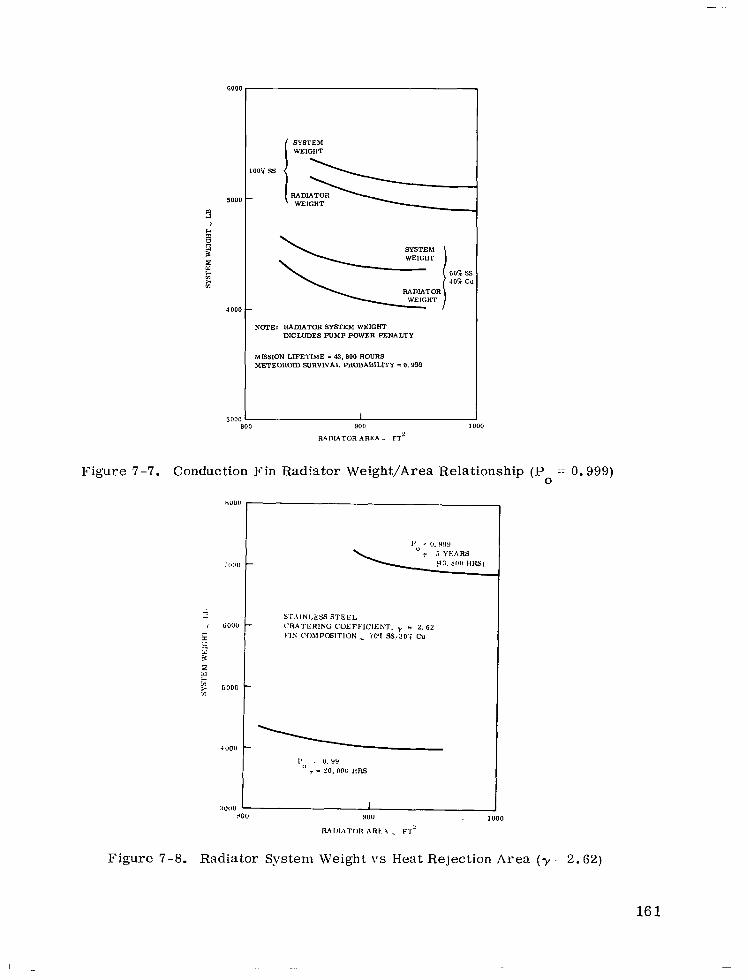
Figure 7 -7 .
60C
500
m rl
1 c
E 5 g
0
10
4 00
300
NOTE: RADIATOR SYSI'EM WEIGHT INCLUDES PUMP POWER PENALTY
MISSION LIFETIME = 43,800 HOURS METEOROID SURVIVAL PROBABILITY = 0.999
60% SS 40% C L
900
RADIATOR AREA - 1000
FT'
Conduction Fin Radiator Weight/Area Relationship (P = 0.999) 0
Figure 7-8. Radiator System Weight 1's Heat ReJection Area ( y . 2.62)
16 1
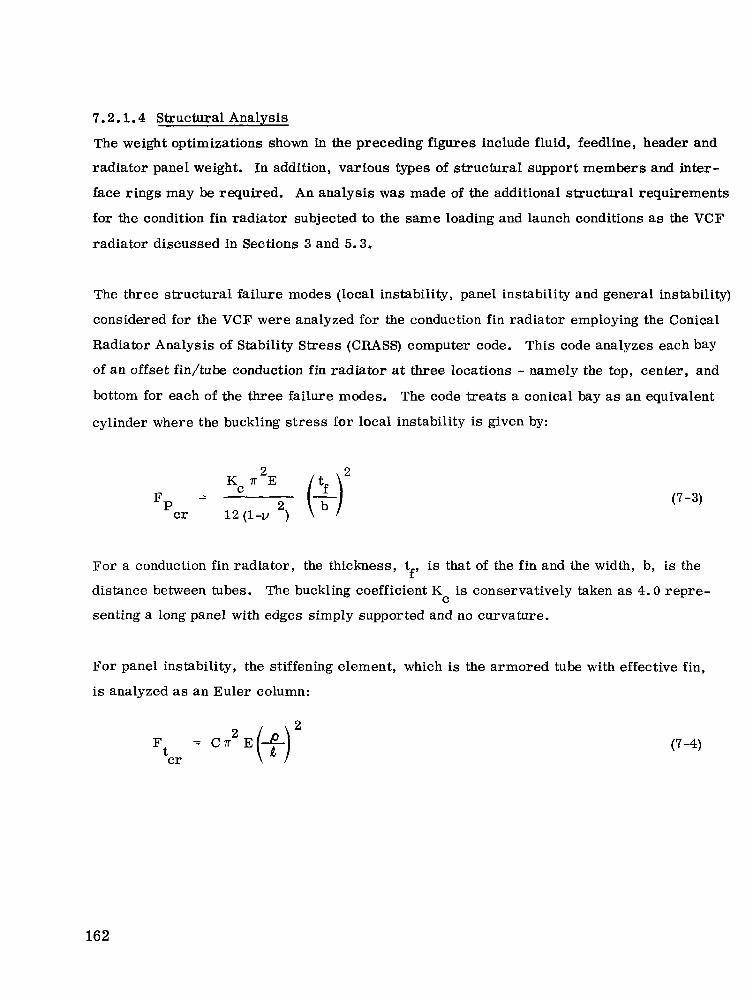
7.2.1.4 Structural Analysis
The weight optimizations shown in the preceding figures include fluid, feedline, header and
radiator panel weight. In addition, various types of structural support members and inter-
face rings may be required. An analysis was made of the additional structural requirements
for the condition fin radiator subjected to the same loading and launch conditions as the VCF
radiator discussed in Sections 3 and 5.3.
The three structural failure modes (local instability, panel instability and general instability)
considered for the VCF were analyzed for the conduction fin radiator employing the Conical
Radiator Analysis of Stability Stress (CRASS) computer code. This code analyzes each bay
of an offset fin/tube conduction fin radiator at three locations - namely the top, center, and
bottom for each of the three failure modes. The code treats a conical bay as an equivalent
cylinder where the buckling stress for local instability is given by:
For a conduction fin radiator, the thickness, t is that of the fin and the width, b, is the
distance between tubes. The buckling coefficient K is conservatively taken as 4.0 repre-
senting a long panel with edges simply supported and no curvature.
f’
C
For panel instability, the stiffening element, which is the armored tube with effective fin,
is analyzed as an Euler column:
2
Ft cr = C n2 E (+) (7 -4)
162
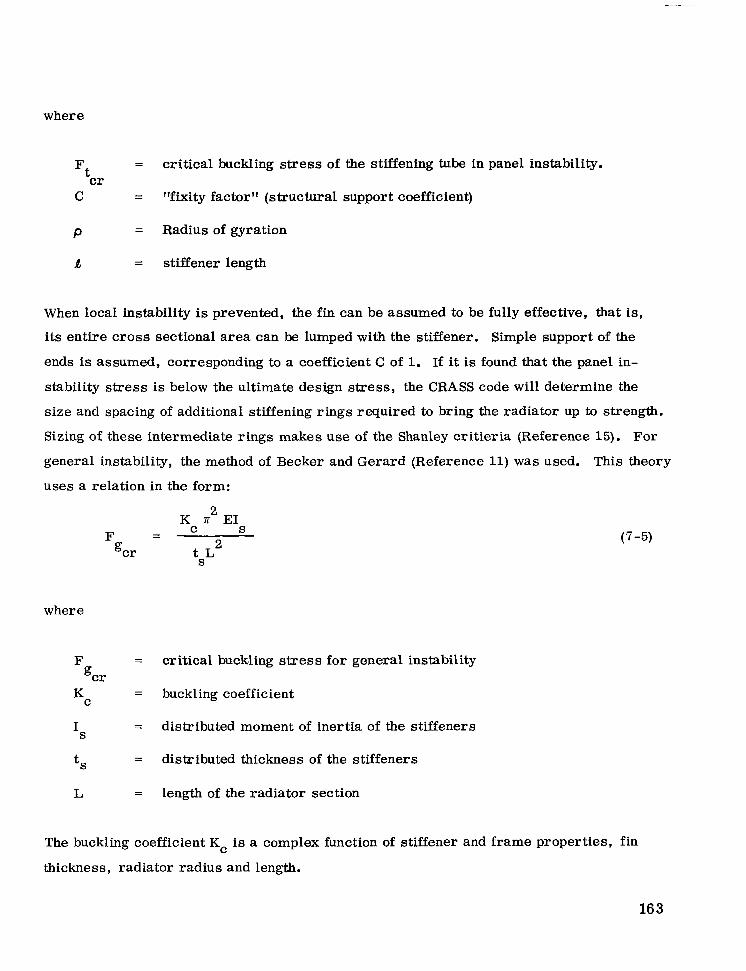
where
Ft = critical buckling stress of the stiffening tube in panel instability. cr
C = "fixity factor" (structural support coefficient)
P = Radius of gyration
R = stiffener length
When local instability is prevented, the fin can be assumed to be fully effective, that is,
its entire cross sectional area can be lumped with the stiffener. Simple support of the
ends is assumed, corresponding to a coefficient C of 1. If it is found that the panel in-
stability stress is below the ultimate design stress, the CRASS code will determine the
size and spacing of additional stiffening rings required to bring the radiator up to strength.
Sizing of these intermediate rings makes use of the Shanley critieria (Reference 15). For
general instability, the method of Becker and Gerard (Reference 11) was used. This theory
uses a relation in the form:
K K E1 2
F C S - - gcr tsLZ
(7 -5)
where
F = critical buckling stress for general instability gcr
KC
IS
tS
= buckling coefficient
= distributed moment of inertia of the stiffeners
= distributed thickness of the stiffeners
L = length of the radiator section
The buckling coefficient Kc is a complex function of stiffener and frame properties, fin
thickness, radiator radius and length.
16 3
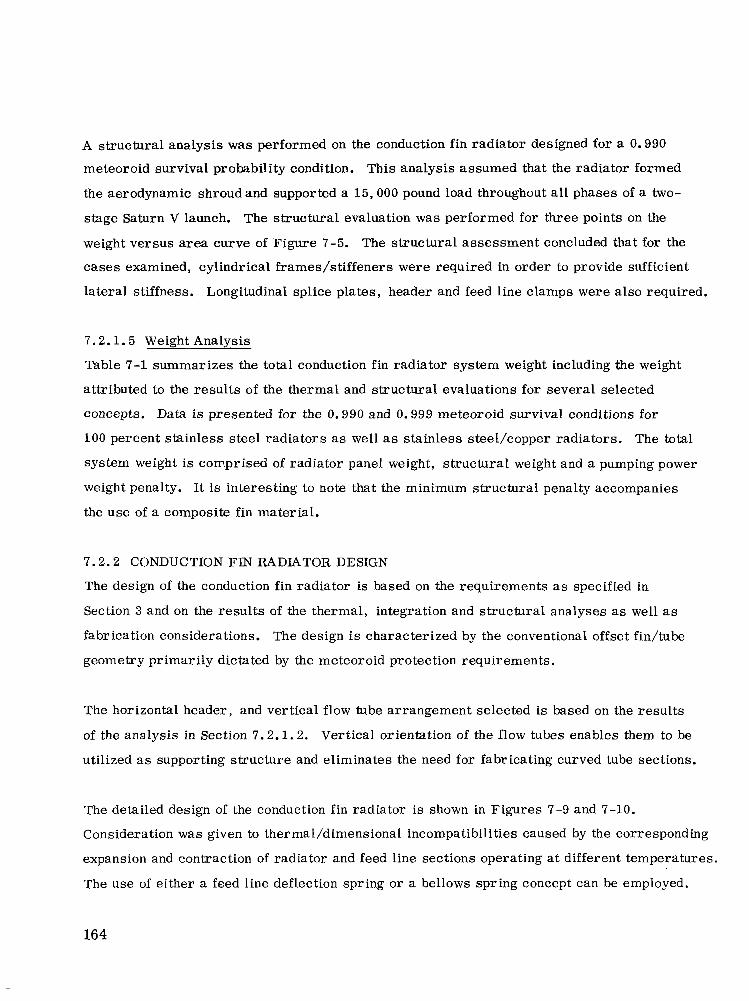
A structural analysis was performed on the conduction fin radiator designed for a 0.990
meteoroid survival probability condition. This analysis assumed that the radiator formed
the aerodynamic shroud and supported a 15,000 pound load throughout all phases of a two-
stage Saturn V launch. The structural evaluation was performed for three points on the
weight versus area curve of Figure 7-5. The structural assessment concluded that for the
cases examined, cylindrical frames/stiffeners were required in order to provide sufficient
lateral stiffness. Longitudinal splice plates, header and feed line clamps were also required.
7.2.1.5 Weight Analysis
Table 7-1 summarizes the total conduction fin radiator system weight including the weight
attributed to the results of the thermal and structural evaluations for several selected
concepts. Data is presented for the 0.990 and 0.999 meteoroid survival conditions for
100 percent stainless steel radiators as well as stainless steel/copper radiators. The t o t a l
system weight is corr.prised of radiator panel weight, structural weight and a pumping power
weight penalty. It is interesting to note that the minimum structural penalty accompanies
the use of a composite fin material.
7.2.2 CONDUCTION FIN RADIATOR DESIGN
The design of the conduction fin radiator is based on the requirements a s specified in
Section 3 and on the results of the thermal, integration and structural analyses as well as
fabrication considerations. The design is characterized by the conventional offset fin/tube
geometry primarily dictated by the meteoroid protection requirements.
The horizontal header, and vertical flow tube arrangement selected is based on the results
of the analysis in Section 7.2.1.2. Vertical orientation of the flow tubes enables them to be
utilized a s supporting structure and eliminates the need for fabricating curved tube sections.
The detailed design of the conduction fin radiator is shown in Figures 7-9 and 7-10.
Consideration was given to thermal/dimensional incompatibilities caused by the corresponding
expansion and contraction of radiator and feed line sections operating at different temperatures.
The use of either a feed line deflection spring or a bellows spring concept can be employed.
164
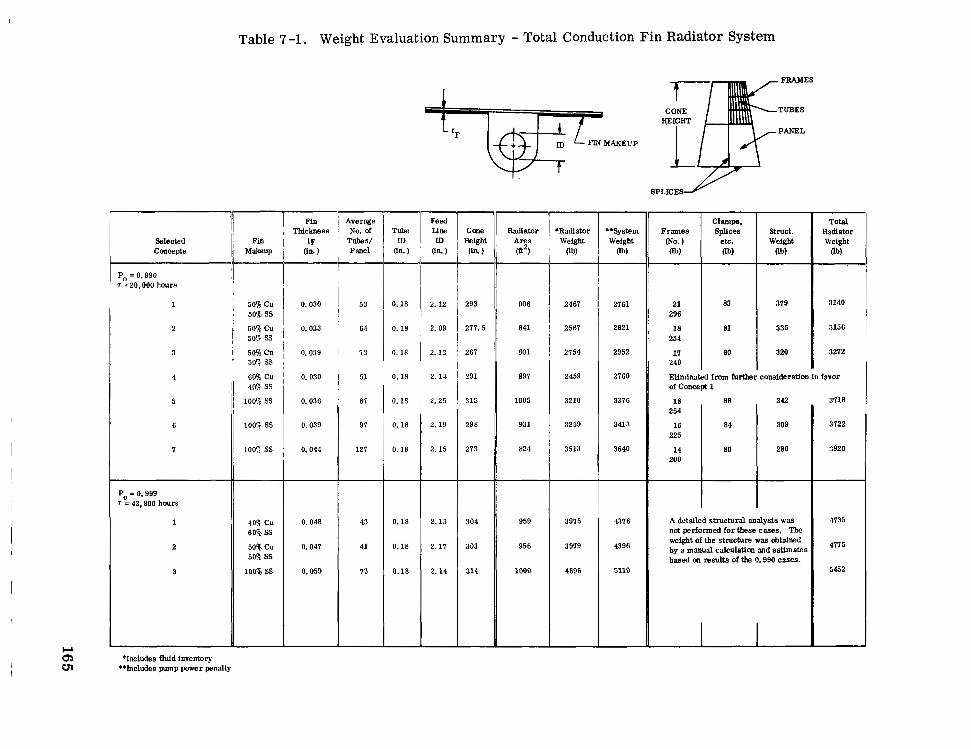
Table 7 -1. Weight Evaluation Summary - Total Conduction Fin Radiator System
SPLICE/ . r Feed une ID
(in. ) Height CaW
(Ln 1
clamps. Splices
etc. ob)
Stmct. Weigbt
(lb)
Radiator Total
Weight (lb)
Tube ID
(in. ) -
0.18
0.18
0.18
0.18
0. 18
0.18
0.18
0.18
0.18
0.18
-t 3140
31%
3212
379
335
320
293
277.5
261
291
315
298
213
906
841
801
891
1005
93 1
824
2761
2821
2952
2760
3376
3413
3640
296 21
254 18
240 17
Ellmina of Concl
83
81
80
2461
2581
2154
2459
3210
3259
3513
2.12
2. 09
2. 13
2. 14
2. 2s
2. 19
2. 15
1 I 50%SS
2 0.033
1 I 50% Cu ~ 0.039 1, SO? SS ~ i
I from further eonsideratlon In favor
:I718
3722
::920
342
309
280
18 254
16 225
88
84
14 80
I
1007 SS 0.039
, 1007 SS 0.044 200
I I A detalled structural analysis wm not performed for these cases. The weight of the stmcture wa6 obtdned by a manual calculntim and estlmate based m m d t s of the 0.990 cases.
4735
4775
5452
43
41
73
2. 13
2. 11
2. 14
304
303
314
959
956
1000
3975
3979
4896
4376
4396
5110
'Includes Uuid Inventory "Includes pump power penalty
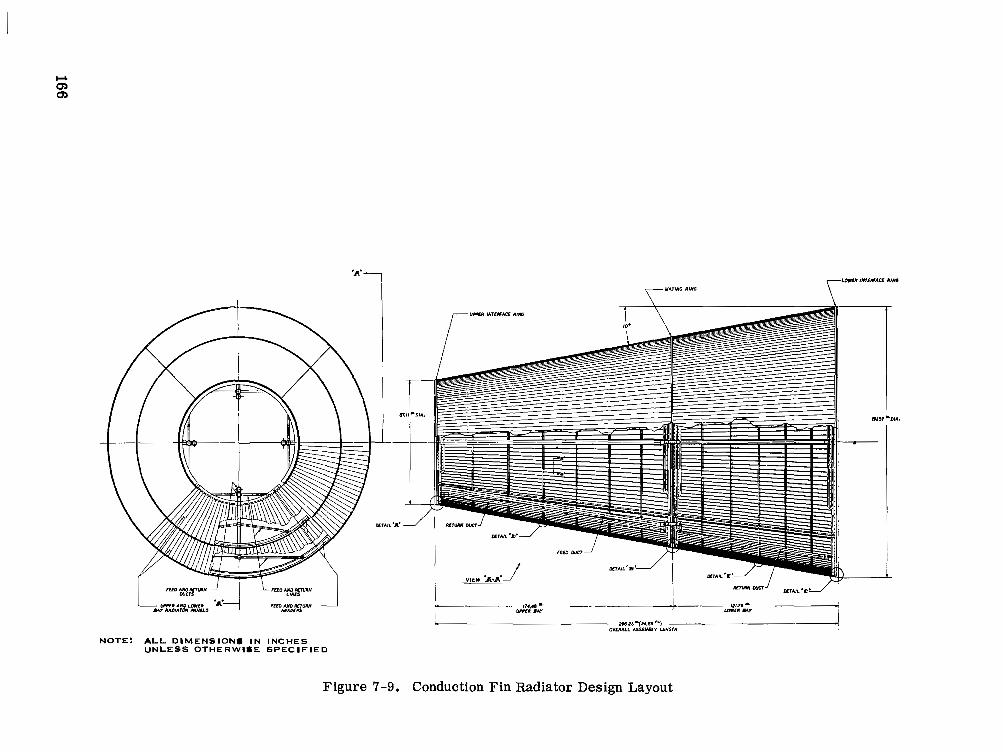
Y
NOTE: A L L DIMENSIONS IN INCHES UNLESS OTHERWISE SPECIFIED
Figure 7-9. Conduction Fin Radiator Design Layout
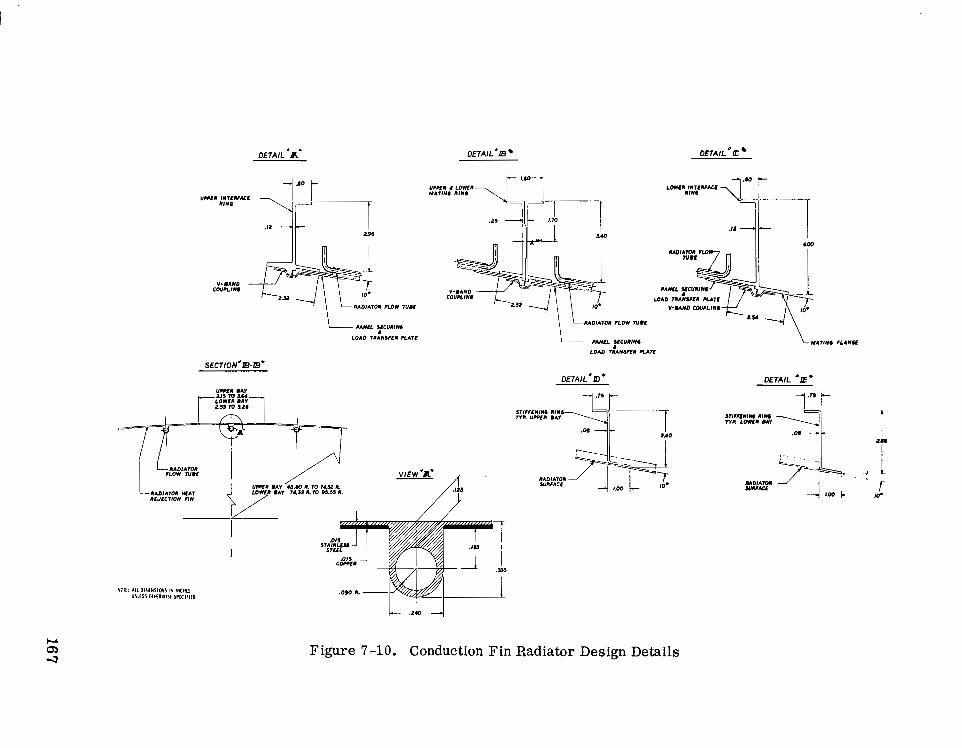
DETAlL 'A* DETAIL'B DETAIL * C
C W C L I N I V-BAND
10.
PADlATOl FLOW 7 U Y
SECTION*B-IB'
p l.60"
L - ~ A D I A T o l M A T nEJtCTlDN FIN
c ,240 "I
Figure 7-10. Conduction Fin Radiator Design Details
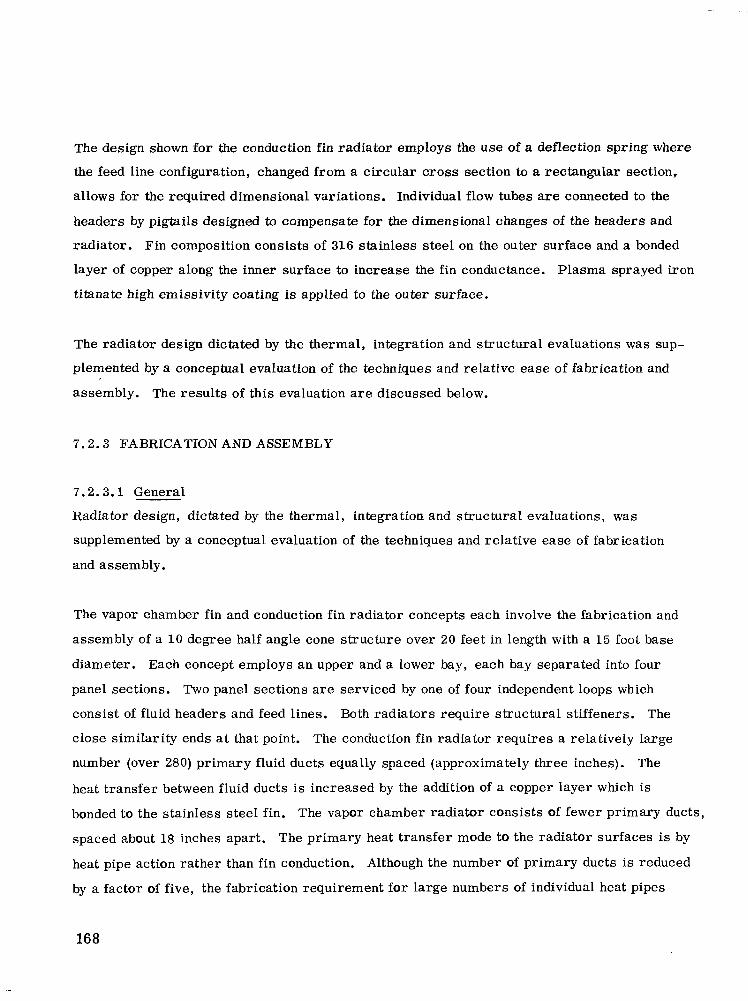
The design shown for the conduction fin radiator employs the use of a deflection spring where
the feed line configuration, changed from a circular cross section to a rectangular section,
allows for the required dimensional variations. Individual flow tubes are connected to the
headers by pigtails designed to compensate for the dimensional changes of the headers and
radiator. Fin composition consists of 316 stainless steel on the outer surface and a bonded
layer of copper along the inner surface to increase the fin conductance. Plasma sprayed iron
titanate high emissivity coating is applied to the outer surface.
The radiator design dictated by the thermal, integration and structural evaluations was sup-
plemented by a conceptual evaluation of the techniques and relative ease of fabrication and
assembly. The results of this evaluation are discussed below.
7 . 2 . 3 FABRICATION AND ASSEMBLY
7 .2 .3 .1 General
Radiator design, dictated by the thermal, integration and structural evaluations, was
supplemented by a conceptual evaluation of the techniques and relative ease of fabrication
and assembly.
The vapor chamber fin and conduction fin radiator concepts each involve the fabrication and
assembly of a 1 0 degree half angle cone structure over 20 feet in length with a 15 foot base
diameter. Each concept employs an upper and a lower bay, each bay separated into four
panel sections. Two panel sections are serviced by one of four independent loops which
consist of fluid headers and feed lines. Both radiators require structural stiffeners. The
close similarity ends at that point. The conduction fin radiator requires a relatively large
number (over 280) primary fluid ducts equally spaced (approximately three inches). The
heat transfer between fluid ducts is increased by the addition of a copper layer which is
bonded to the stainless steel fin. The vapor chamber radiator consists of fewer primary ducts,
spaced about 18 inches apart. The primary heat transfer mode to the radiator surfaces is by
heat pipe action rather than fin conduction. Although the number of primary ducts is reduced
by a factor of five, the fabrication requirement for large numbers of individual heat pipes
168

increases the manufacturing difficulty over the conduction fin design (e.g., reference design
vapor chamber radiator consists of approximately 10,000 sodium filled heat pipes).
A preliminary fabrication analysis was performed on each radiator to identify potential
fabrication techniques and obtain a comparative assessment of the degree of complexity,
which can be used as a figure of merit in the comparative evaluation of the radiator concepts.
The fabrication and assembly considerations and techniques required for the conduction fin
radiator are described below. A similar evaluation of the vapor chamber fin radiator is
contained in Section 7.3.
7.2.3.2 Co.nduction Fin Radiator Fabrication and Assembly
The conduction fin radiator layout and design details are shown in Figures 7-9 and 7-10.
Fabrication techniques identified are considered preliminary. In some instances alternative
design or fabrication techniques have been identified.
Step 1 .- Flow Tube/Fin Assembly (Figure 7-11)
Eachcoolant duct fin consists of two elements: a machined or extruded stainless steel channel
or tube, and a stainless steel/copper bonded fin. The stainless steel tube/fin can be
fabricated by extrusion and/or machining. A half section of 0.030 inch wall tubing i s then
welded to the fin. An alternative to this procedure would consist of the braze of a 0.030 inch
wall tube to the extruded or machined fin. A layer of copper is brazed to the stainless fin
after the assembly of the fin or after the assembly of the panel in Step 2.
Step 2 - Panel Assembly and Test, Upper and Lower Bay (Figure 7-12)
An assembly jig is used to place and hold individual fins together for welding into a quarter
panel. Stainless steel pigtails are inserted on inlet and outlet ends of each coolant duct,
headers are positioned and all welds are made. Each quarter panel assembly is flushed clean
and inspected for leaks.
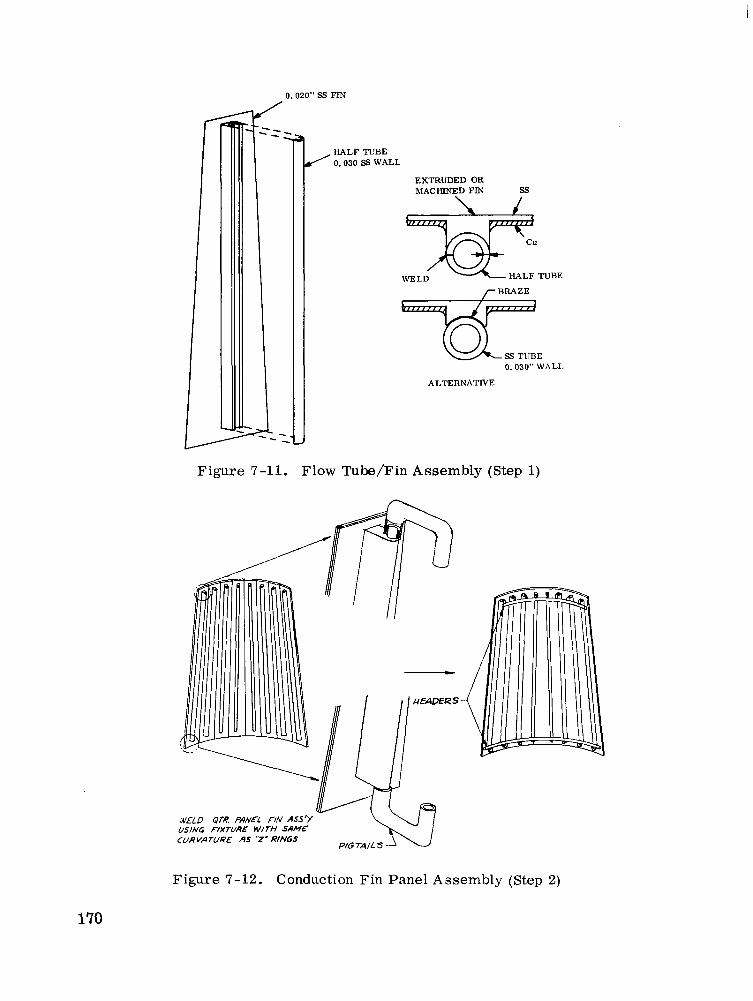
0.020" SS FIN
0.030 SS WALL HALF TUBE
EXTRCDED OR
0. 030" WALI.
ALTERNATIVE
F igure 7-11. Flow Tube/Fin Assembly (Step 1)
WELD QTR. PANEL FIN ASS'Y U5lNG FIXTURE WITH SAME CURVATURE AS "2' RINGS
Figure 7-12. Conduction Fin Panel Assembly (Step 2)
170

Step 3 - Splice Plates and Z Rings (Figure 7-13)
Z rings are fabricated in quarter sections and notched to receive flow tubes and splice
plates. An assembly fixture is used to mount, join and rivet together the interface and
mating rings. Axial splice plates are then welded or riveted to the Z rings.
SPLICE PLATE 4 PIACCS o w e 2 RINO
ASSSMBL Y FlXTUQC LOWEE m r
2," - - -
2 RNG- 4 SECTIONS €ACH LOW€R BAY AND ffPP€E 54V
Figure 7-13. Assembly of Z Rings and Mating Rings on Fixture (Step 3)
Step 4 - Lower Radiator Bay Assembly (Figure 7-14)
Lower quarter panels (4) are positioned over the Z rings on the assembly fixture and
riveted to the splice plates and Z rings. V-band couplings are installed on the interface
r ings .
Step ~- 5 - Upper .. . - "" Radiator -~ Bay . Assembly (Figure 7-14)
A similar procedure to that described in the preceding steps is followed to assemble the upper
bay. The preferred procedure involves the assembly of each bay individually, however,
the upper assembly fixture could attach to the lower fixture and assembly of both bays could
be accomplished in that configuration.
171
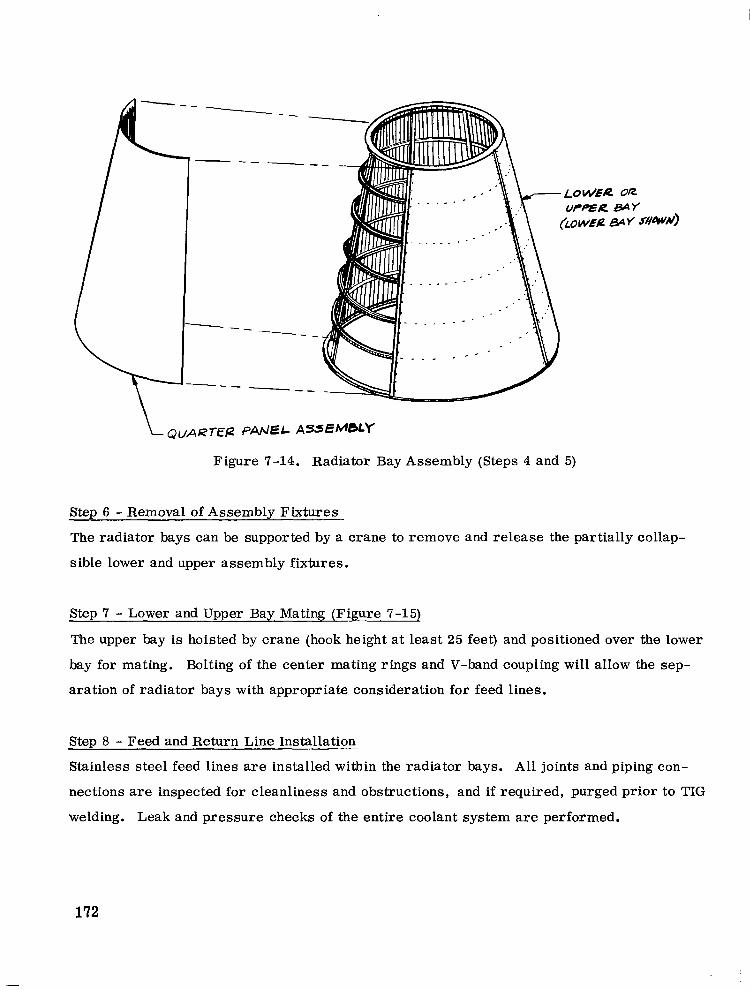
Step 6 - Removal of Assembly Fixtures
The radiator bays can be supported by a crane to remove and release the partially collap-
sible lower and upper assembly fixtures.
Step 7 - Lower and Upper Bay Mating (Figure 7-15)
The upper bay is hoisted by crane (hook height at least 25 feet) and positioned over the lower
bay for mating. Bolting of the center mating rings and V-band coupling will allow the sep-
aration of radiator bays with appropriate consideration for feed lines.
Step 8 - Feed and Return Line Installation
Stainless steel feed lines are installed within the radiator bays. All joints and piping con-
nections are inspected for cleanliness and obstructions, and if required, purged prior to TIG
welding. Leak and pressure checks of the entire coolant system are performed.
172
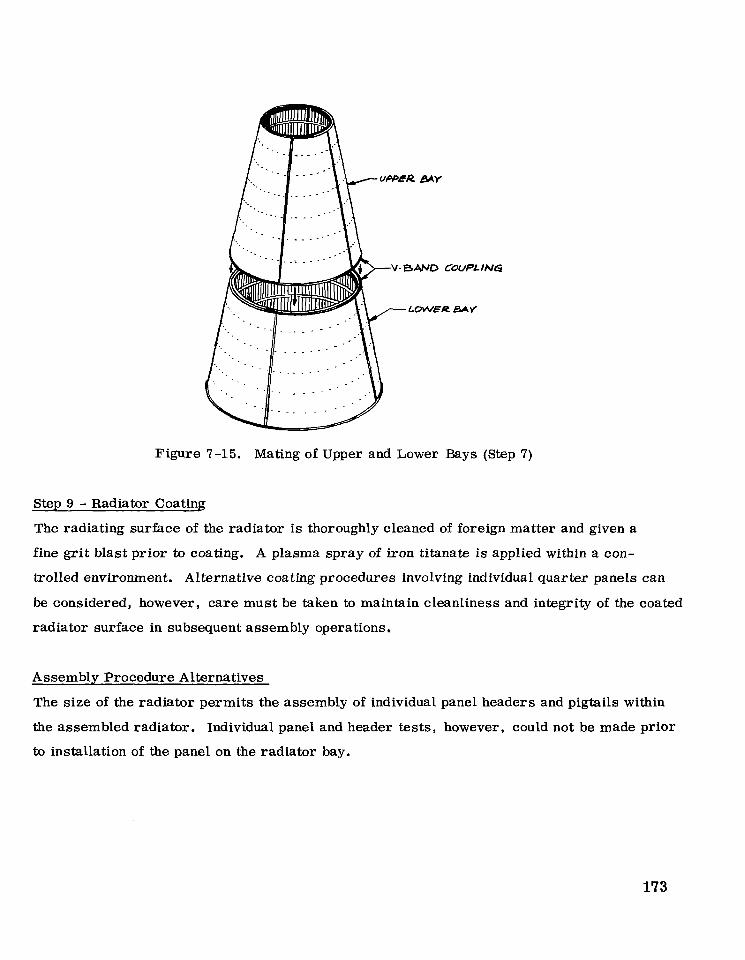
V- BAND COUPLING
LOW€R m y
Figure 7-15. Mating of Upper and Lower Bays (Step 7)
Step 9 - Radiator Coating
The radiating surface of the radiator is thoroughly cleaned of foreign matter and given a
fine grit blast prior to coating. A plasma spray of iron titanate is applied within a con-
trolled environment. Alternative coating procedures involving individual quarter panels can
be considered, however, care must be taken to maintain cleanliness and integrity of the coated
radiator surface in subsequent assembly operations.
Assembly Procedure Alternatives
The size of the radiator permits the assembly of individual panel headers and pigtails within
the assembled radiator. Individual panel and header tests, however, could not be made prior
to installation of the panel on the radiator bay.
173
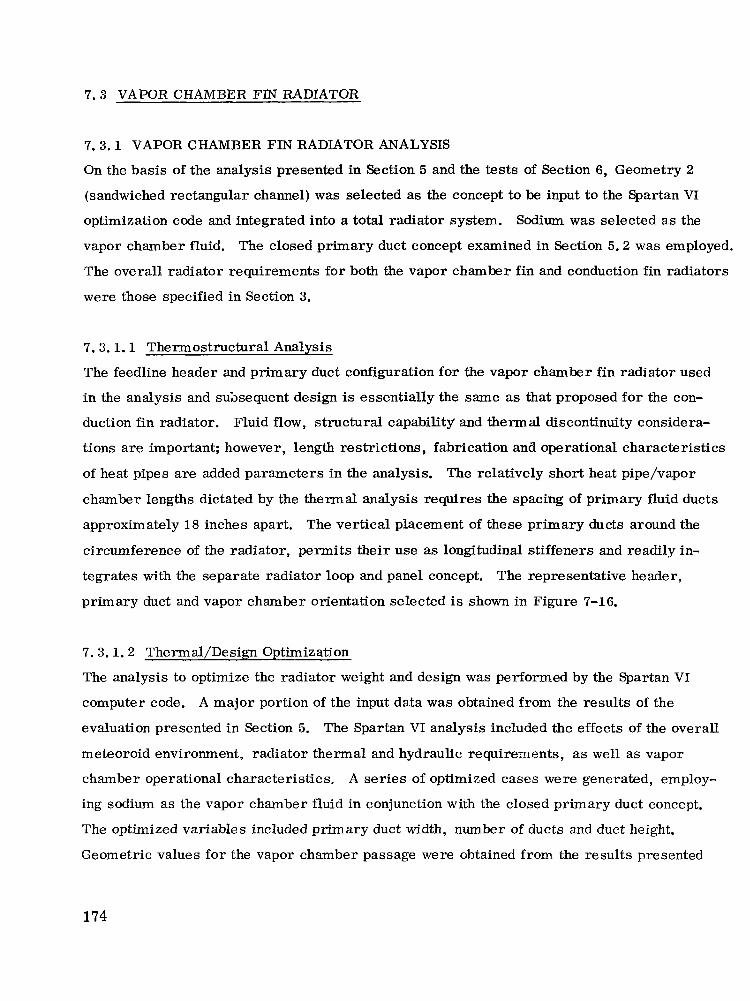
7 . 3 VAPOR CHAMBER FIN RADIATOR
7 . 3 . 1 VAPOR CHAMBER FIN RADIATOR ANALYSIS
On the basis of the analysis presented in Section 5 and the tests of Section 6, Geometry 2
(sandwiched rectangular channel) was selected as the concept to be input to the Spartan VI
optimization code and integrated into a total radiator system. Sodium was selected as the
vapor chamber fluid. The closed primary duct concept examined in Section 5.2 was employed.
The overall radiator requirements for both the vapor chamber fin and conduction fin radiators
were those specified in Section 3.
7 . 3 . 1 . 1 Thermostructural Analysis
The feedline header and primary duct configuration for the vapor chamber fin radiator used
in the analysis and suhsequent design is essentially the same as that proposed for the con-
duction fin radiator. Fluid flow, structural capability and thermal discontinuity considera-
tions are important; however, length restrictions, fabrication and operational characteristics
of heat pipes are added parameters in the analysis. The relatively short heat pipe/vapor
chamber lengths dictated by the thermal analysis requires the spacing of primary fluid ducts
approximately 18 inches apart. The vertical placement of these primary ducts around the
circumference of the radiator, permits their use as longitudinal stiffeners and readily in-
tegrates with the separate radiator loop and panel concept. The representative header,
primary duct and vapor chamber orientation selected is shown in Figure 7-16.
7 . 3 . 1 . 2 Thermal/Design Optimization
The analysis to optimize the radiator weight and design was performed by the Spartan VI
computer code. A major portion of the input data was obtained from the results of the
evaluation presented in Section 5. The Spartan VI analysis included the effects of the overall
meteoroid environment, radiator thermal and hydraulic requirements, as well as vapor
chamber operational characteristics. A ser ies of optimized cases were generated, employ-
ing sodium as the vapor chamber fluid in conjunction with the closed primary duct concept.
The optimized variables included primary duct width, number of ducts and duct height.
Geometric values for the vapor chamber passage were obtained from the results presented
174
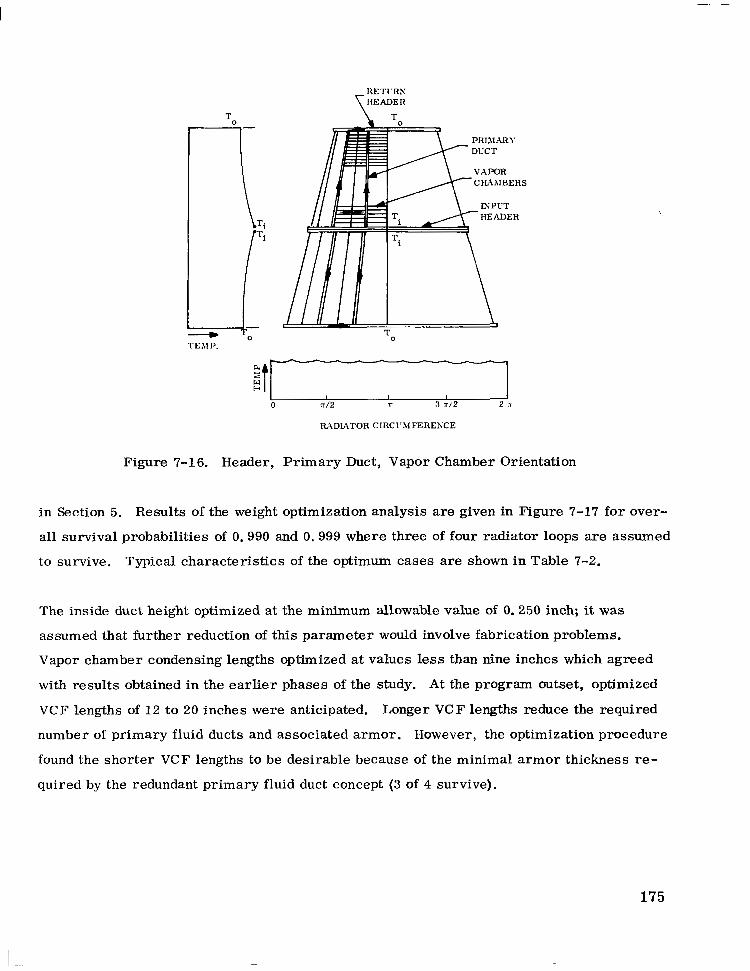
I 1 I I I 0 a/2 s :1 a/2 2;;
RhDLATOR CIRCI’WFERENCE
Figure 7-16. Header, Primary Duct, Vapor Chamber Orientation
in Section 5. Results of the weight optimization analysis are given in Figure 7-17 for over-
all survival probabilities of 0.990 and 0.999 where three of four radiator loops are assumed
to survive. Typical characteristics of the optimum cases are shown in Table 7-2.
The inside duct height optimized at the minimum allowable value of 0.250 inch; it was
assumed that further reduction of this parameter would involve fabrication problems.
Vapor chamber condensing lengths optimized at values less than nine inches which agreed
with results obtained in the earlier phases of the study. At the program outset, optimized
VCF lengths of 12 t o 20 inches were anticipated. Longer V C F lengths reduce the required
number of primary fluid ducts and associated armor. However, the optimization procedure
found the shorter VCF lengths to be desirable because of the minimal armor thickness re-
quired by the redundant primary fluid duct concept (3 of 4 survive).
175
L
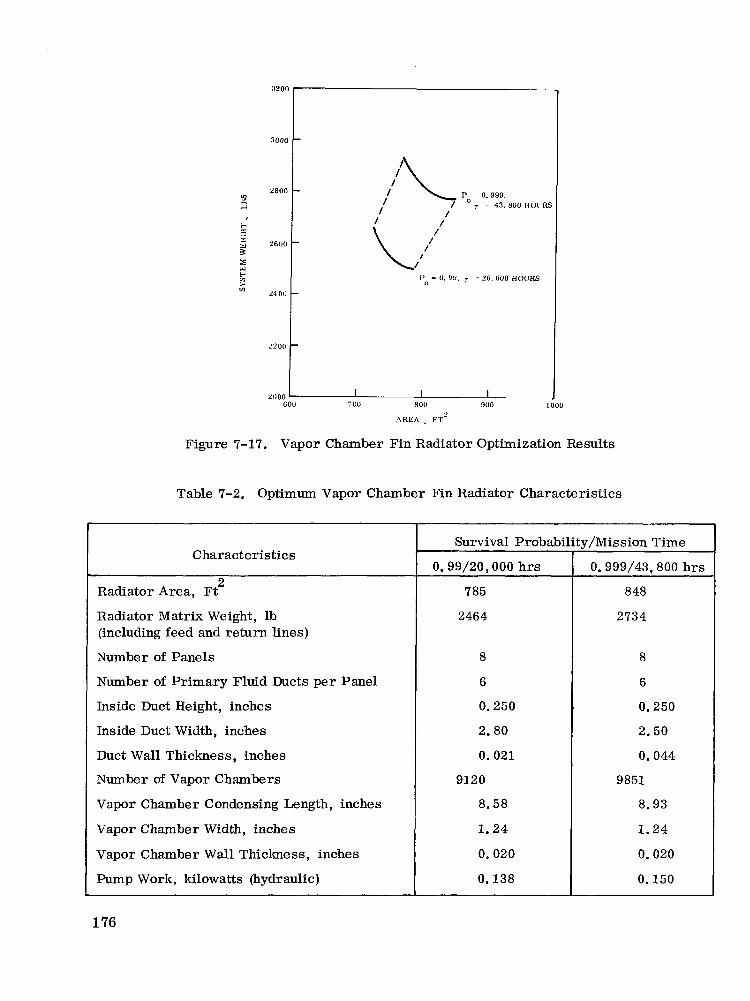
3000 "I
. \REA FT-
Figure 7-17. Vapor Chamber Fin Radiator Optimization Results
Table 7-2. Optimum Vapor Chamber Fin Radiator Characteristics
Characteristics
Radiator Area, Ft
Radiator Matrix Weight, lb (including feed and return lines)
Number of Panels
Number of Primary Fluid Ducts per Panel
Inside Duct Height, inches
Inside Duct Width, inches
Duct Wall Thickness, inches
Number of Vapor Chambers
Vapor Chamber Condensing Length, inches
Vapor Chamber Width, inches
Vapor Chamber Wall Thickness, inches
Pump Work, kilowatts (hydraulic)
2
176
0.99/20,000 hrs
785
2464
8
6
0.250
2.80
0.021
9120
8.58
1.24
0.020
0.138
0.999/43,800 hrs
848
2734
8
6
0.250
2.50
0.044
9851
8.93
1.24
0,020
0.150
A more complete understanding of the important parameters affecting radiator weight and
area was obtained by varying several of the key parameters. Examination of the optimized
cases indicates a large temperature drop across the primary fluid boundary layer. For
the reference design (0.99 meteoroid survival probability) the temperature drop from the
bulk fluid to the inside wall was 42'F. This temperature drop decreases the effective
radiator temperature and raises the radiator area. With the present design this AT can be
reduced by increasing the primary duct width or the total number of ducts; both of these
perturbations cause an increase in vulnerable area. Therefore, the magnitude of the pri-
mary duct fluid film drop is a trade-off between total radiator area (or weight) and the pri-
mary duct armor weight requirements.
The primary fluid AT may also be reduced by the addition of extended surface areas within
the duct. Often, advantages accrued from this type of design complexity are offset by the
fabrication problems introduced. A study was performed, using Spartan VI, to show the
trade-off between the radiator weight and gap size between the primary duct fins. Figure
7-18 shows the effect of introducing f i n s (0.010-inch thick) in the primary fluid duct on
radiator weight and area for the optimized case at a 0.99 probability and a lifetime of 20,000
hours. Additional cases were run to obtain the locus of optimized radiators as a function of
weight and area for two meteoroid survival probability conditions, these are illustrated in
Figure 7-19. For these radiators a minimum gap size of 0.100 inch was allowed in order to
lend an element of manufacturing credibility to the designs. However, the information pre-
sented in Figure 7-18 suggests that further gains from increasing the number of fins would
be inconsequential.
7.3.1.3 Structural Analysis
The structural analysis of the reference design consisted of an extension of the approach
which was used in the evaluation presented in Section 5.3. General, panel and local insta-
bilities were considered. Local instabilities were prevented by maintaining the vapor
chamber geometric values used in the previous analysis. In order to ensure against panel
instability circumferential Z rings were added. Results of the evaluation indicated that a
minimum of five Z rings spaced every 18 inches plus two interface rings were required for
177

Po = 0.99
DUCT FIN SPACING, INCHES r = 20,000 HOURS
0.80 0.50 0.20 0.10
I t , + t 800
2700 R PRIMARY DUCT 7
AREA
SYSTEM WEIGHT
1
- 780
- 760
- 740
- 720
- 700
"000 I I I I I I I 0 4 8 12 16 20 24 2n
I
NUMBER OF FINS PER DUCT
Figure 7-18. Effect of Extended Surfaces in Primary Fluid Duct on Vapor Chamber Fin Radiator Weight
2500
2400
2300
2200
21 00 G50 700 7.50 x00
AREA (FT')
Figure 7-19. Vapor Chamber Fin Radiator Weight/Area with Optimum Number of P r i m a r y Duct Fins
178
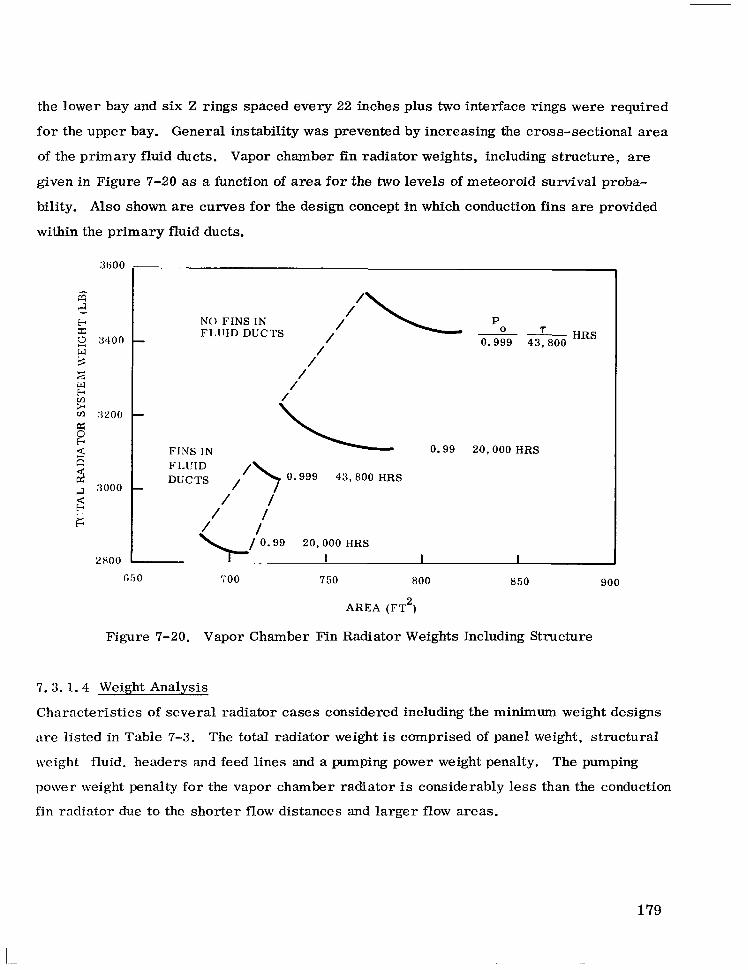
the lower bay and six Z rings spaced every 22 inches plus two interface rings were required
for the upper bay. General instability was prevented by increasing the cross-sectional area
of the primary fluid ducts. Vapor chamber fin radiator weights, including structure, are
given in Figure 7-20 as a function of area for the two levels of meteoroid survival proba-
bility. Also shown are curves for the design concept in which conduction fins are provided
within the primary fluid ducts.
-
/ N O FINS I N Fl.1lln /
/ /
/
F I N S I N Fl.I!ID
0.99 20 ,000 HRS
DUCTS / I\ 1 0.999 43,800 HRS
/ i / /
650 700 750 800 850 900
AREA (FT ) 2
Figure 7-20. Vapor Chamber Fin Radiator Weights Including Structure
7. 3 . 1 . 4 Weight Analysis
Characteristics of several radiator cases considered including the minimum weight designs
;ire listed in Table 7-3. The total radiator weight is comprised of panel weight, structural
weight fluid. headers and feed lines and a pumping power weight penalty. The pumping
power weight penalty for the vapor chamber radiator is considerably less than the conduction
f in radiator due to the shorter flow distances and larger flow areas.
179
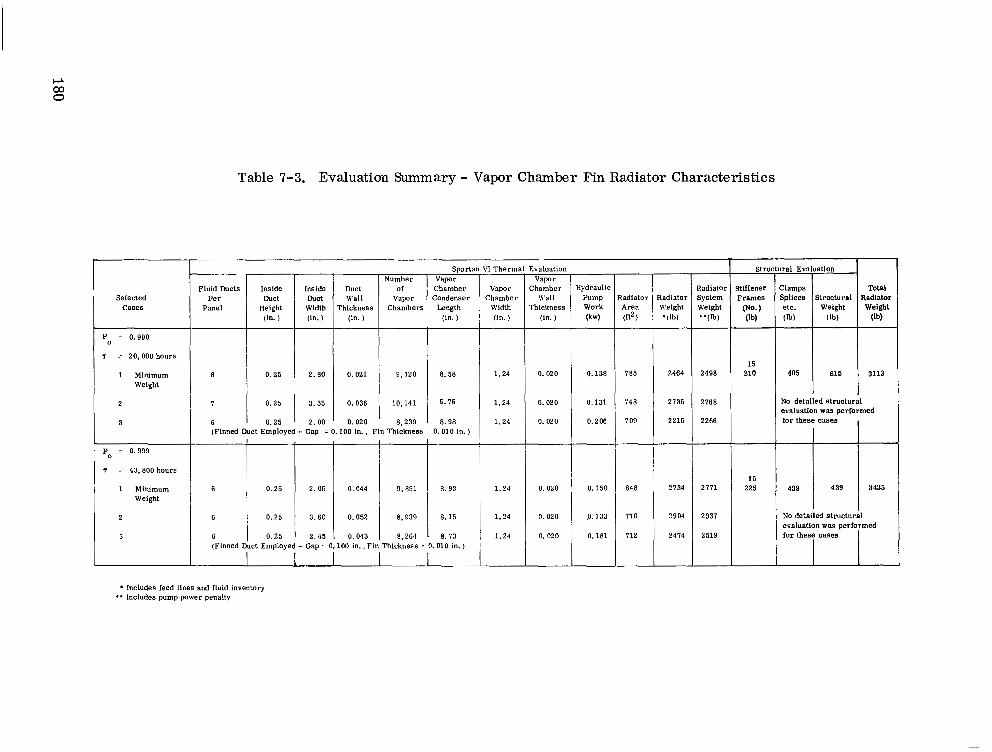
Table 7-3. Evaluation Summary - Vapor Chamber Fin Radiator Characteristics
l- n Therma
Vapor Chamber
Width (in. )
Sparla
Chamber Vapor
:ondenser Length
(in.)
8.58
6 .16
8.98
:valuation Vapor
:hamber W a l l
rhickness (in. )
0,020
0,020
0,020
n l -
"
"
I i
Structural Evaluation
Frames Splices Structural Radlalor Total
-
iadiator Area (ft2 )
Fluid Ducts Per
Panel
Number Hydraulic
Pump Work (kw)
lnslde Inside
(In. ) (in. )
Radiatol Selected
Cases
P - 0.930
T 2 20,000 hours
1 Minimum Weight
2
3
210 15
No detailed structural evaluation was performed
0.138
0.131
0.206
185
148
709
6 1 0.25 1 2.80 1 0.021 1 9,120 1.24
1.24
1.24 I (Finned Duct Employed - Gap = 0.100 in., Fin Thickness - 0.010 in. )
I 0.25 3.55 0.036 10,141
6 i 0.25 2.00 0.020 8.239 for these cases
225 439
P = 0.993
7 = 43,800 hours
1 Minimum Weight
2
3
1.24
1.24
1.24
0,020
0,020
0,020
0.150
.o. 133
0,181
848
770
112
2734 2771 6 0.25 2.05 0,044 9,851 8.93
6 0.25 3.60 0,052 8.339 8.15
6 0.25 2.45 0,043 8,264 R.13
No detailed structural evaluation w a s performed
2904 2931
2474 2519 for these cases (Finned &ct Employed - Gap : 0.100 in., Fin Thtckness = 0. 010 in. )
I
" Includes pump poser penalty * Includes feed ilnes and fluid inventory
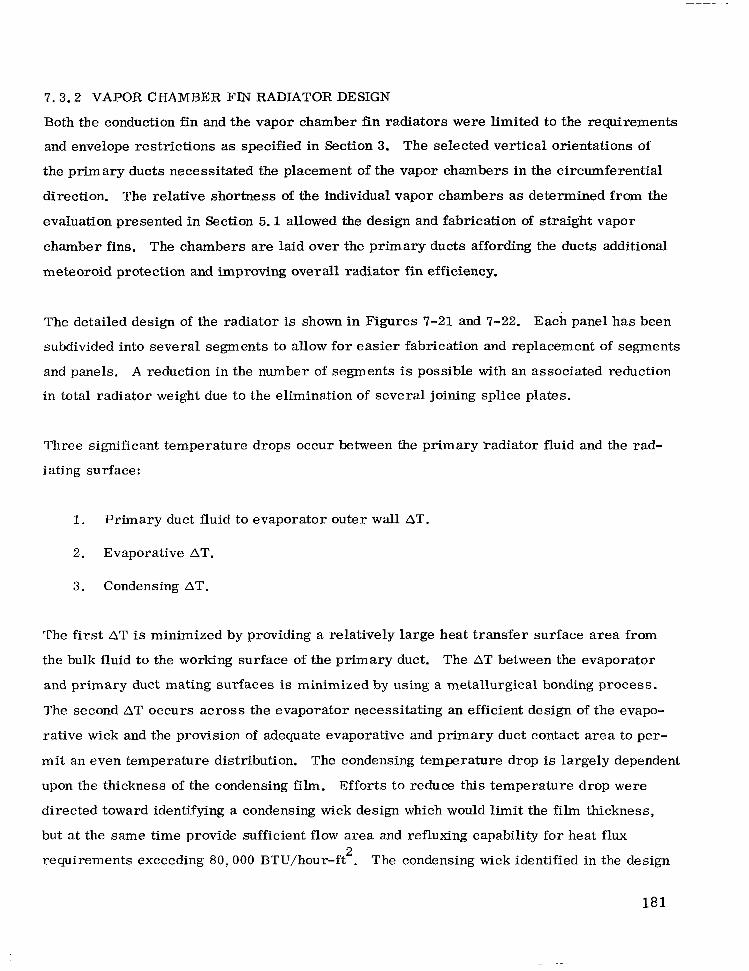
7 . 3 . 2 VAPOR CHAMBER FIN RADIATOR DESIGN
Both the conduction fin and the vapor chamber fin radiators were limited to the requirements
and envelope restrictions as specified in Section 3. The selected vertical orientations of
the primary ducts necessitated the placement of the vapor chambers in the circumferential
direction. The relative shortness of the individual vapor chambers as determined from the
evaluation presented in Section 5.1 allowed the design and fabrication of straight vapor
chamber fins. The chambers are laid over the primary ducts affording the ducts additional
meteoroid protection and improving overall radiator fin efficiency.
The detailed design of the radiator is shown in Figures 7-21 and 7-22. Each panel has been
subdivided into several segments to allow for easier fabrication and replacement of segments
and panels. A reduction in the number of segments is possible with an associated reduction
in total radiator weight due to the elimination of several joining splice plates.
Three significant temperature drops occur between the primary radiator fluid and the rad-
iating surface:
1. Primary duct fluid to evaporator outer wall AT.
2. Evaporative AT.
3. Condensing AT.
The first AT is minimized by providing a relatively large heat transfer surface area from
the bulk fluid to the working surface of the primary duct. The AT between the evaporator
and primary duct mating surfaces is minimized by using a metallurgical bonding process.
The second AT occurs across the evaporator necessitating an efficient design of the evapo-
rative wick and the provision of adequate evaporative and primary duct contact area to per-
mit an even temperature distribution. The condensing temperature drop is largely dependent
upon the thickness of the condensing film. Efforts to reduce this temperature drop were
directed toward identifying a condensing wick design which would limit the film thickness,
but at the same time provide sufficient flow area and refluxing capability for heat flux
requirements exceeding 80,000 BTU/hour-ft . The condensing wick identified in the design 2
181
"
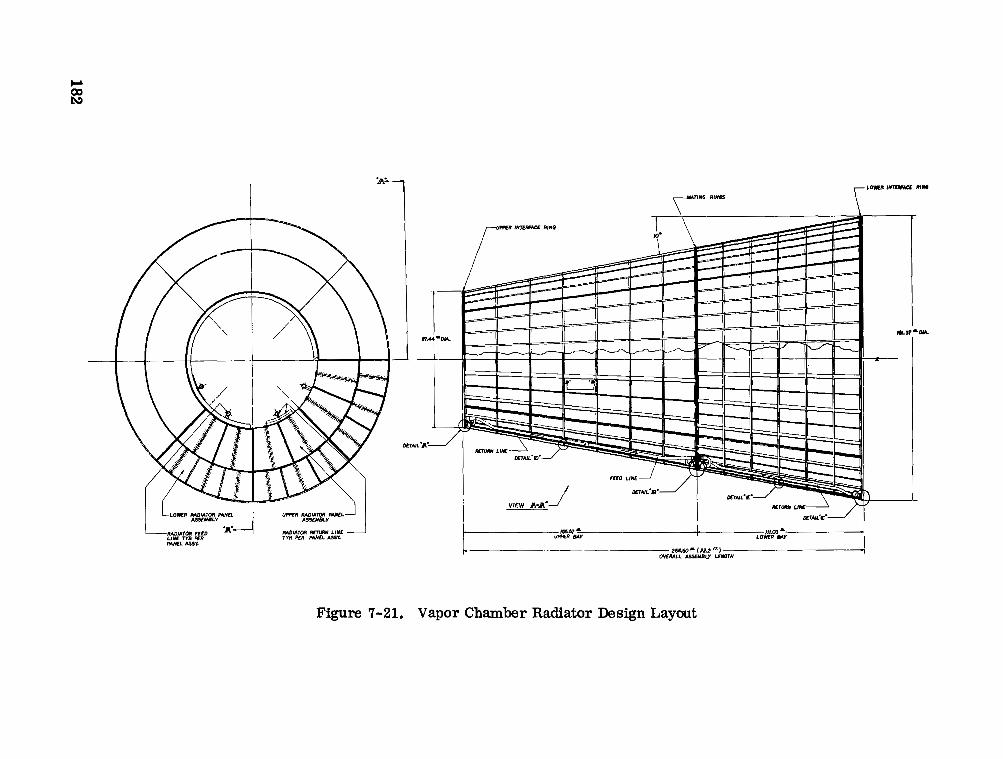
. '.
VIEW A - A ' ~ I .. ." . , 7
t-
Figure 7-21. Vapor Chamber Radiator Design Layout
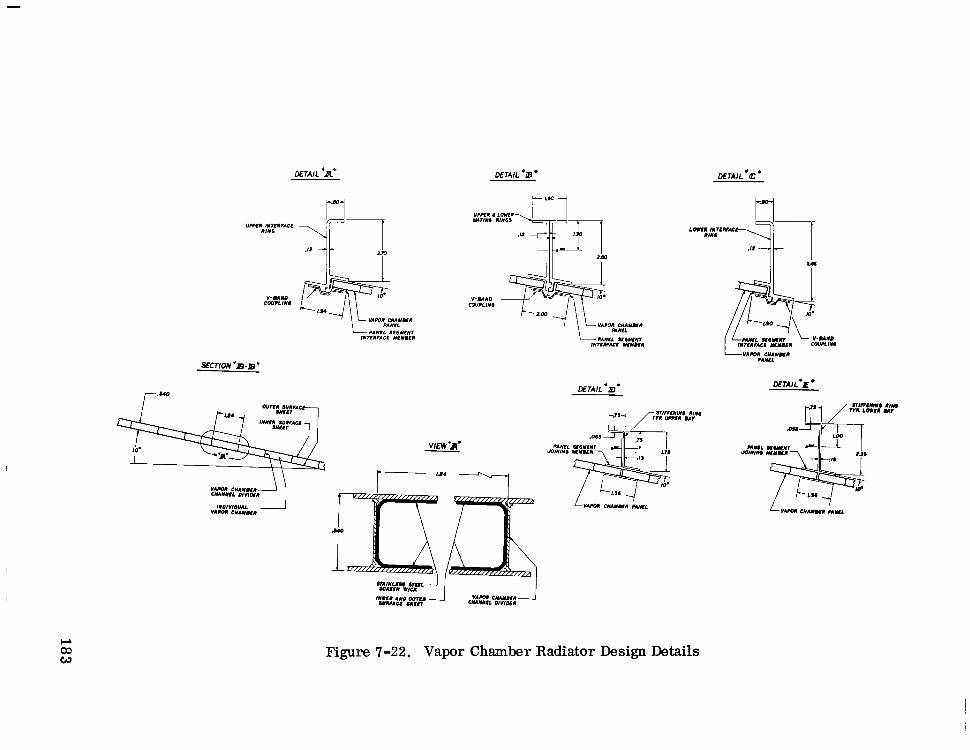
DETAIL 'A' DETAIL 'm
DETA1L.D'
Figure 7-22. Vapor Chamber Radiator Design Details
NTAIL*E*
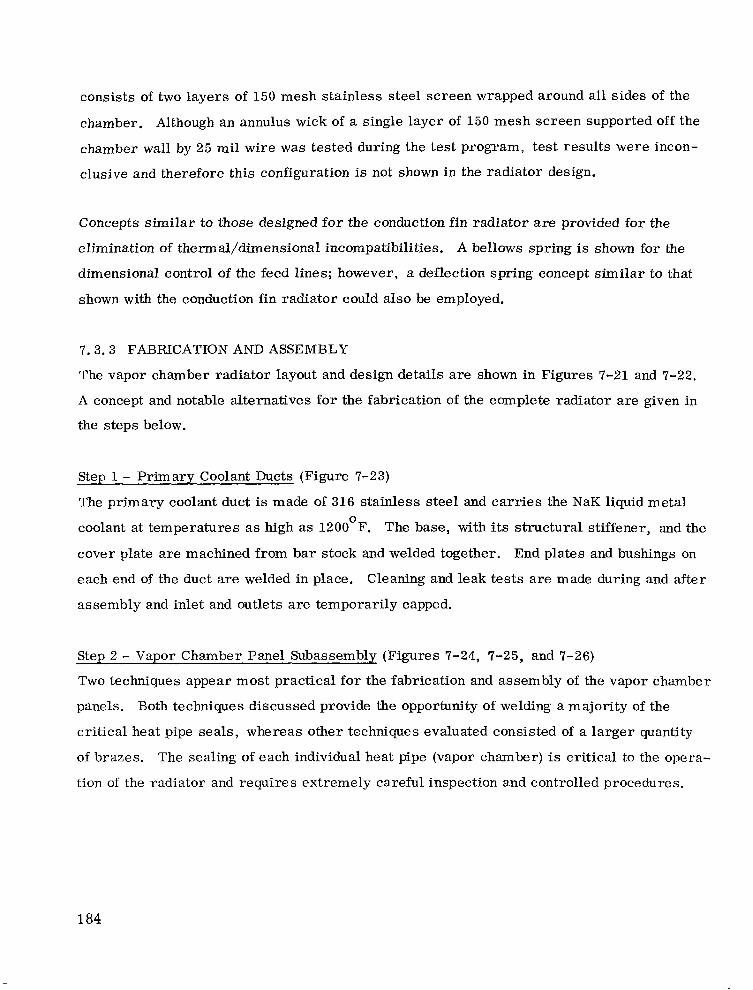
consists of two layers of 150 mesh stainless steel screen wrapped around all sides of the
chamber. Although an annulus wick of a single layer of 150 mesh screen supported off the
chamber wall by 25 mil wire was tested during the test program, test results were incon-
clusive and therefore this configuration is not shown in the radiator design.
Concepts similar to those designed for the conduction fin radiator are provided for the
elimination of thermal/dimensional incompatibilities. A bellows spring is shown for the
dimensional control of the feed lines; however, a deflection spring concept similar to that
shown with the conduction fin radiator could also be employed.
7 . 3 . 3 FABRICATION AND ASSEMBLY
The vapor chamber radiator layout and design details are shown in Figures 7-21 and 7-22.
A concept and notable alternatives for the fabrication of the complete radiator are given in
the steps below.
Step 1 - Primary Coolant Ducts (Figure 7-23)
The primary coolant duct is made of 316 stainless steel and carries the NaK liquid metal
coolant at temperatures as high as 1200 F. The base, with its structural stiffener, and the
cover plate are machined from bar stock and welded together. End plates and bushings on
each end of the duct are welded in place. Cleaning and leak tests are made during and after
assembly and inlet and outlets are temporarily capped.
0
Step 2 - Vapor Chamber Panel Subassemblg (Figures 7-24, 7-25, and 7-26)
Two techniques appear most practical for the fabrication and assembly of the vapor chamber
panels. Both techniques discussed provide the opportunity of welding a majority of the
critical heat pipe seals, whereas other techniques evaluated consisted of a larger quantity
of brazes. The sealing of each individual heat pipe (vapor chamber) is critical to the opera-
tion of the radiator and requires extremely careful inspection and controlled procedures.
184
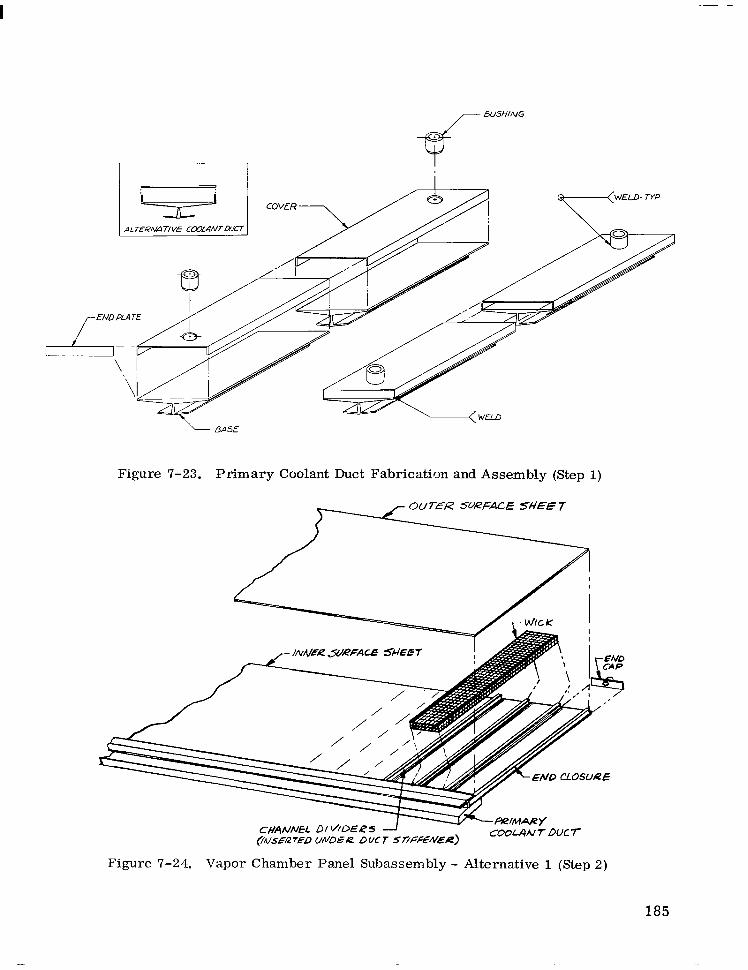
I
I : -7
- 5A5E
Figure 7-23. Pr imary Coolant Duct Fabrication and Assembly (Step 1)
Figure 7-24. Vapor Chamber Panel Subassembly - Alternative 1 (Step 2)
185
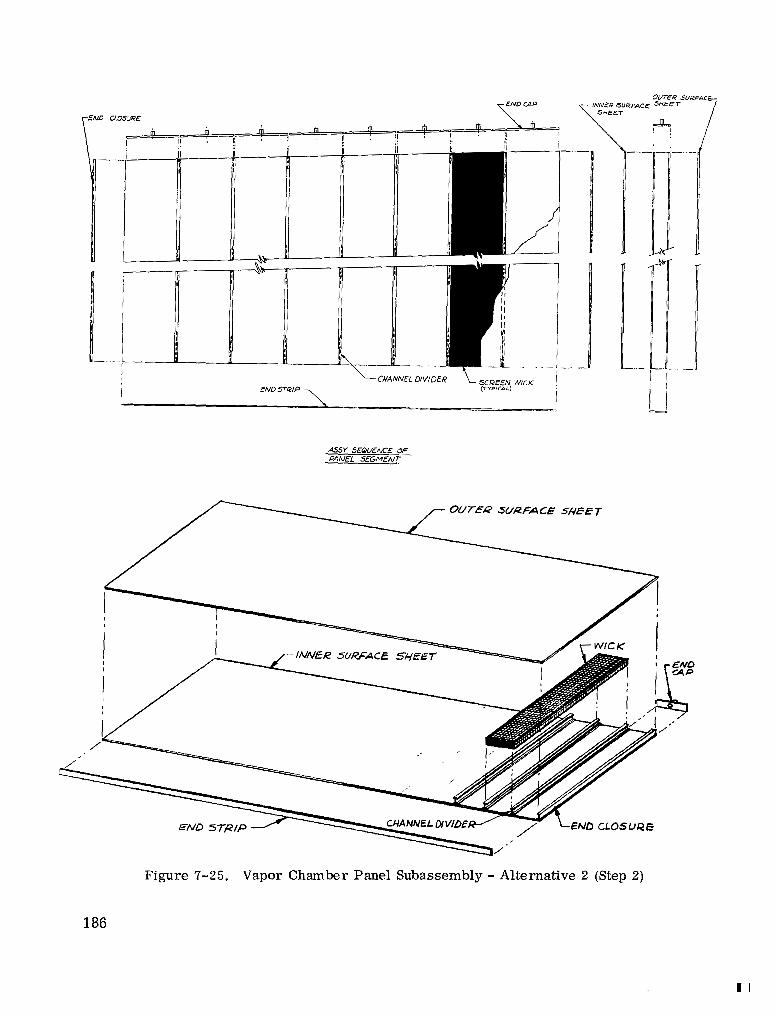
Figure 7-25. Vapor Chamber Panel Subassembly - Alternative 2 (Step 2)
186
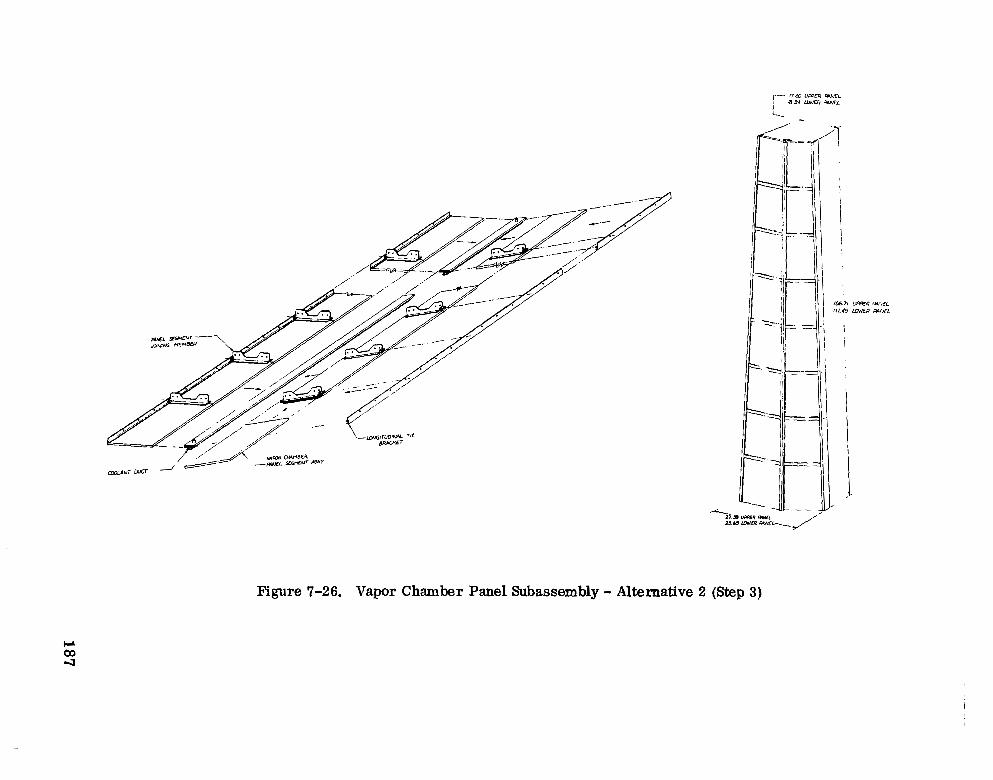
1_
I
Figure 7-26. Vapor Chamber Panel Subassembly - Alternative 2 (Step 3)
1. Alternative 1 (Figure 7-24). The vapor chamber panel consists of two 20 mil sheets of 316 stainless steel separated by equally spaced 10 mil channel dividers which form the individual heat pipes. A wick consisting of two layers of 150 mesh stainless steel screen is wrapped around all sides of each chamber. A preformed wick is considered.
a. The fabrication sequence begins with the placement, spacing and welding of the channel dividers on the inner surface sheet. A fixture holding the channel dividers in position could be prepared, the inner surface sheet laid over them, and the individual dividers EB or TIG welded. If brazing were to be performed, a careful selection of brazing sequences and temperatures would be required.
b. Each panel, separated by a joining member, is subsequently inserted into the primary coolant duct. All interfaces with the duct are carefully welded with the exception of the thermal contact surface of the vapor chamber. (This surface is brazed after all the welds are made on all panels with a silver/copper alloy braze at a temperature of approximately 1570'F. )
c. Preformed wicks cut to size are then laid in each channel and spotted to the inner surface sheet and the channel dividers. Special forming and position- ing tools will be required to perform this task.
d. The outer surface sheet is now positioned over the assembly and welds are made along the primary coolant duct and each channel divider. The remain- ing spot welds are made in the upper surface of the wick. The braze of the assemblies to the primary duct can be made at this time.
e. Cleanliness and individual chamber integrity are vitally important. End caps are welded. A thorough cleaning, bake out and leak test must be per- formed prior to liquid metal charging.
f. Liquid metal charging and final EB welds and sealing are performed in a vacuum environment, (Consideration should be given to the performance of items (e) and (f) within the same environment to reduce the possibility of unwanted foreign material.
2. Alternative 2 (Figures 7-25 and 7-26). Alternative No. 2 is pictorially described in Figures 7-25 and 7-26, Although this alternative involves the use of an addi- tional end plate next to the primary duct, it has the advantage of permitting a leak check of a vapor chamber panel subassembly prior to its installation in the primary duct. All surface sheets, end caps and channel dividers are welded and/or brazed, wicks spot welded and the entire panel cleaned and leak checked prior to the primary duct braze. Brazing of the subassembly to the primary coolant duct must be performed prior to liquid metal charging due to the tem- peratures involved. Final bake out, cleaning, charging and end cap sealing would again be performed within a vacuum environment.
188
- Step 3 -- Lon@@dinal . . .~." " . " Tie Brackets and Joining Members (Figure 7-26)
Longitudinal stiffeners and tie brackets are mounted along each edge of the assembly as
shown in the figure (Alternative 2 described). Each bracket and joining member is TIG
welded to the vapor chamber assemblies.
Step 4 - Panel Assembly and Test (Figure 7-27)
The individual subassembly panels are assembled into quarter panel assemblies by riveting
together the longitudinal stiffeners. Inlet and outlet headers and pigtail piping are installed
and welds made. Leak and flow tests of each quarter panel assembly can now be made prior
to final assembly and installation of feedline connnections.
Step 5 - Frame Assembly (Figure 7-28)
The lower bay structure support frame (interface rings, Z ring stiffeners and longerons)
are assembled as a riveted frame. The upper bay frame is similarly assembled. Bolted
assemblies are used where replacement capability is desired.
Step .. 6 . - . Lower . and Upper Bay Assembly (Figure 7-28)
Final assembly of the radiator bays consist of riveting or bolting the individual panel assem-
blies (four per bay) to the frame. Bolted assemblies are used where replacement capability
is desired.
Step 7 - Final Assembly (Figure 7-28)
Structural attachments are made between the two bays and at the interface rings with the
addition of V-band couplings. Feedline piping and expansion manifolds are installed. All
joints and connections are inspected for cleanliness and obstructions, purged and subse-
quently TIG welded. Leak and pressure checks of the entire coolant system are performed.
Step 8 - Radiator Coating
The radiating surface is thoroughly cleaned of foreign matter and given a fine grit blast
prior to coating. A plasma spray of iron titanate is applied within a controlled environ-
ment.
189
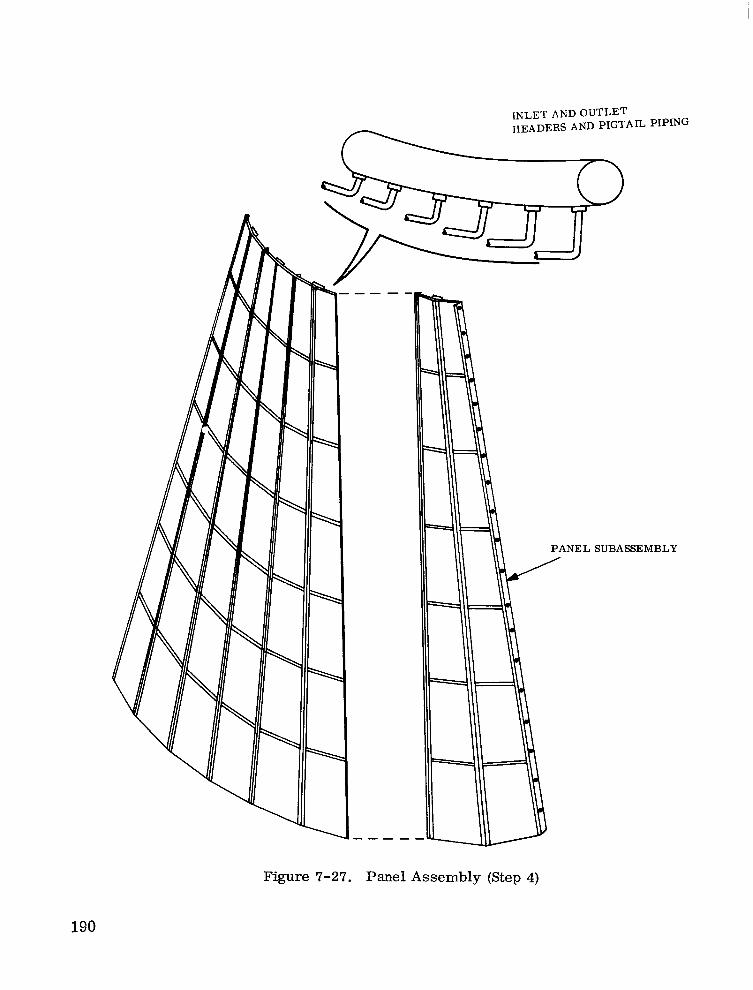
IL PIPING
""
""
PANEL SUBASSEMBLY
Figure 7-27. Panel Assembly (Step 4)
190
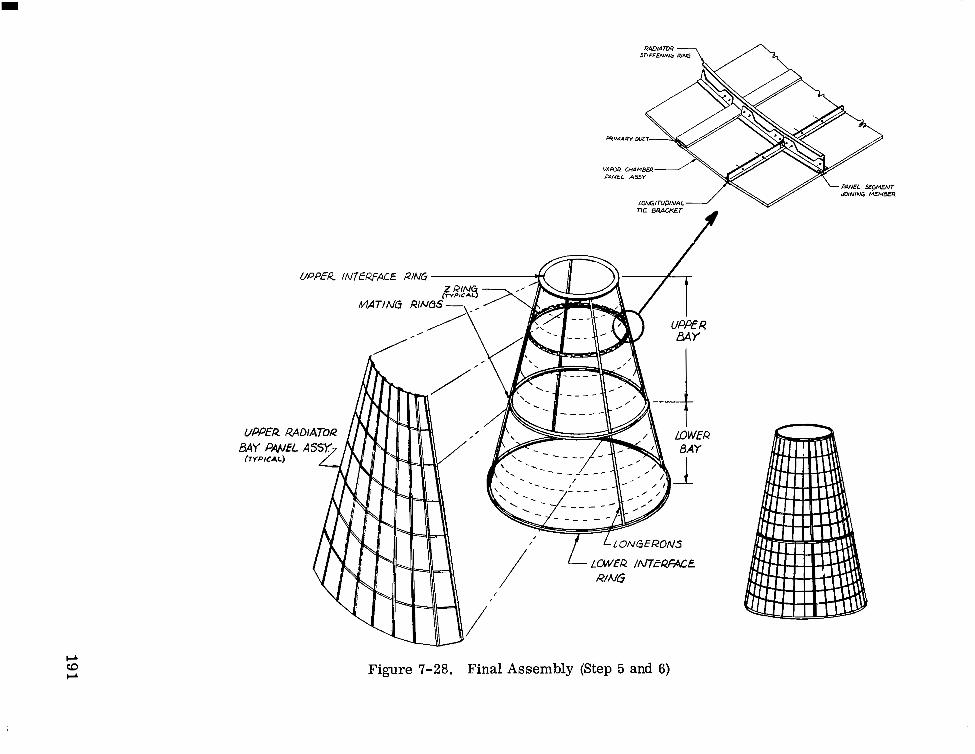
Figure 7-28. Final Assembly (Step 5 and 6)
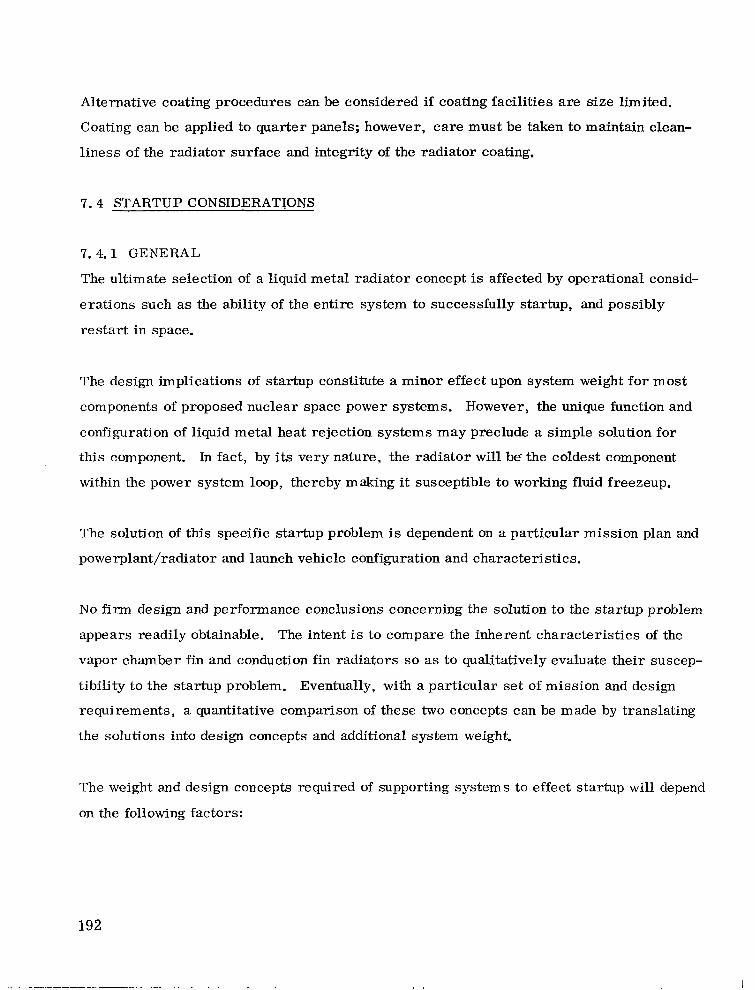
Alternative coating procedures can be considered if coating facilities are size limited.
Coating can be applied to quarter panels; however, care must be taken to maintain clean-
liness of the radiator surface and integrity of the radiator coating.
7 .4 STARTUP CONSIDERATIONS
7.4.1 GENERAL
The ultimate selection of a liquid metal radiator concept is affected by operational consid-
erations such as the ability of the entire system to successfully startup, and possibly
restart in space.
The design implications of startup constitute a minor effect upon system weight for most
components of proposed nuclear space power systems. However, the unique function and
configuration of liquid metal heat rejection systems may preclude a simple solution for
this component. In fact, by its very nature, the radiator will be- the coldest component
within the power system loop, thereby making it susceptible to working fluid freezeup.
The solution of this specific startup problem is dependent on a particular mission plan and
powerplant/radiator and launch vehicle configuration and characteristics.
No f i r m design and performance conclusions concerning the solution to the startup problem
appears readily obtainable. The intent is to compare the inherent characteristics of the
vapor chamber fin and conduction fin radiators so as to qualitatively evaluate their suscep-
tibility to the startup problem. Eventually, with a particular set of mission and design
requirements, a quantitative comparison of these two concepts can be made by translating
the solutions into design concepts and additional system weight.
The weight and design concepts required of supporting systems to effect startup will depend
on the following factors:
192

1. Type of fluids in system
2. Total fluid inventory
3. Fluid location and disbursement
4. System/Mission considerations.
Each of these factors arecomparatively discussed in relation to the two radiator concepts.
7.4.2 TYPE OF FLUID IN SYSTEM
Both the conduction and vapor chamber fin radiators contain NaK (78 w 76 k) as the primary
fluid which has a melting point of 12 F. This fluid will likely be liquid at and during launch
with appropriate insulation from the upper S-I1 cryogenic tank. Actually during ascent,
skin heating rates can considerably influence radiator temperatures where no external
shroud is provided. Figure 7-29 shows the skin temperature of the nine degree half angle
three-stage Saturn V launch adapter during ascent. Radiator skin temperatures are expected
to be over 200 F during this period. Once earth orbit is achieved, the effective sink tem-
perature for most orbital conditions will be above 12 F. This is shown in Figure 7-30. It
can be concluded that under most earth orbital conditions the NaK-78 radiator would remain
liquid and not present a major freezing problem. Strip heaters or an isotope heater can be
applied in susceptible locations. Circulation of the working fluid can also be a means of
preventing localized freezeup.
0
0
0
The startup of a radiator during an interplanetary mission where the effective sink tempera-
ture is lower than 12'F, will require freezeup preventative techniques.
The vapor chamber radiator also contains a heat pipe (vapor chamber) fluid which in the
case of the reference design is sodium with a melting point of 208 F. The presence of
frozen sodium in the vapor chamber cannot be cited as a definite disadvantage since heat
pipes start operating from a frozen condition without any major time delay. The location
within the heat pipe of the frozen sodium is important however, a discussion of this point is
presented in subsequent paragraphs.
0
19 3
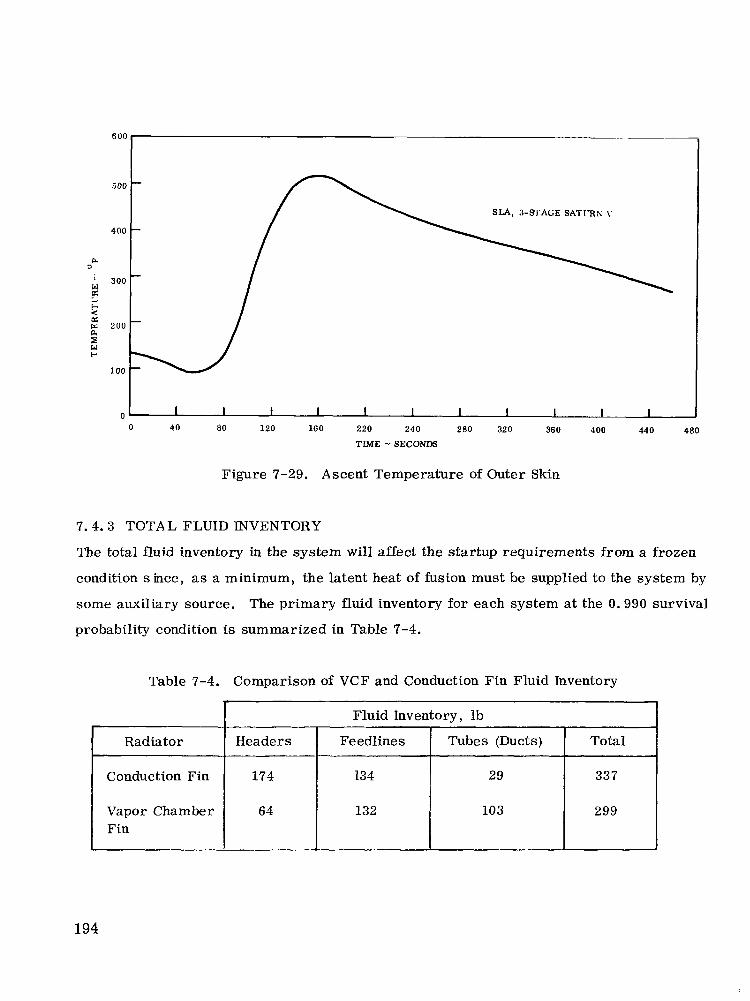
Figure 7-29. Ascent Temperature of Outer Skin
7. 4 . 3 TOTAL FLUID INVENTORY
The total fluid inventory in the system will affect the startup requirements from a frozen
condition s mce, as a minimum, the latent heat of fusion must be supplied to the system by
some auxiliary source. The primary fluid inventory for each system at the 0 . 9 9 0 survival
probability condition is summarized in Table 7-4.
Table 7-4.
Radiator
Conduction Fin
Vapor Chamber Fin
Comparison of V C F and Conduction Fin Fluid Inventory
Fluid Inventory, lb
Headers
337 29 131 174
Total Tubes (Ducts) Fe edline s
64 299 103 132
194

I
3 00
, 28 0
220 -
180
R 0
I
2 140
E 100 E
jl 60
E u w Fr w 20
-20
E = 0 . 9
D
- c
1 D
-60
0 0 .2 0.4 0 . 6 0.8 1.0
s/E
Figure 7-30. Effect of Radiator Surface Properties on Effective Sink Temperature for 100 nm Earth Orbit
195

The conduction fin radiator has a 10 percent greater fluid inventory primarily as a con-
sequence of the comparatively large headers required for this concept. The headers act
as a plenum so that the flow path through any tube provides the same pressure drop. In
the conduction fin design the fluid tube spacing is less than 3 . 0 inches, making it necessary
to run the header along the entire panel length. The large spacing of 18 to 20 inches be-
tween vapor chamber primary ducts enables a more compact header. On the basis of fluid
inventory, a slight advantage can be accorded the VCF radiator.
7 .4 .4 FLUID LOCATION AND DISBURSEMENT
In conditions where temperatures below the freezing point of the fluid a r e encountered, the
location of the fluid in the radiator can play an important part in determining the amount
of energy required to keep it liquid. From this standpoint, the vapor chamber radiator has
an advantage in that the concentration of primary fluid in relatively few ducts enables a
simpler distribution system for the auxiliary power source. More importantly, the wide
separation between fluid ducts means that the fluid ducts can be maintained at a temperature
above the NaK freezing point while the effective radiator temperature is kept at a lower
level. An example calculation supporting this statement indicates that the NaK i n the vapor
chamber radiator can be maintained at 50°F with a total energy loss of 9 . 1 kW while 25 kW
would be rejected by the conduction fin radiator.
Figure 7-31 pictures a vapor chamber fin radiator with one feed and return fluid loop kept
liquid, as well as one primary fluid duct. When startup of the system is required, elevation
of the fluid temperature to 500 to 600 F could initiate vapor chamber action. This would
result in the adjacent vapor chambers (those connected to the next primary duct and adjoining
the condensing end) starting up, working in reverse, and melting the NaK in the adjacent
primary ducts. An entire panel could be brought up to operating temperature much more
quickly than is possible with a conduction fin radiator. This is due to the high conductivity
of the vapor chambers.
0
The process described above is dependent upon the containment of sodium a t the evaporative
end of the vapor chamber. If a system is kept inoperative for a long period of time with one
196
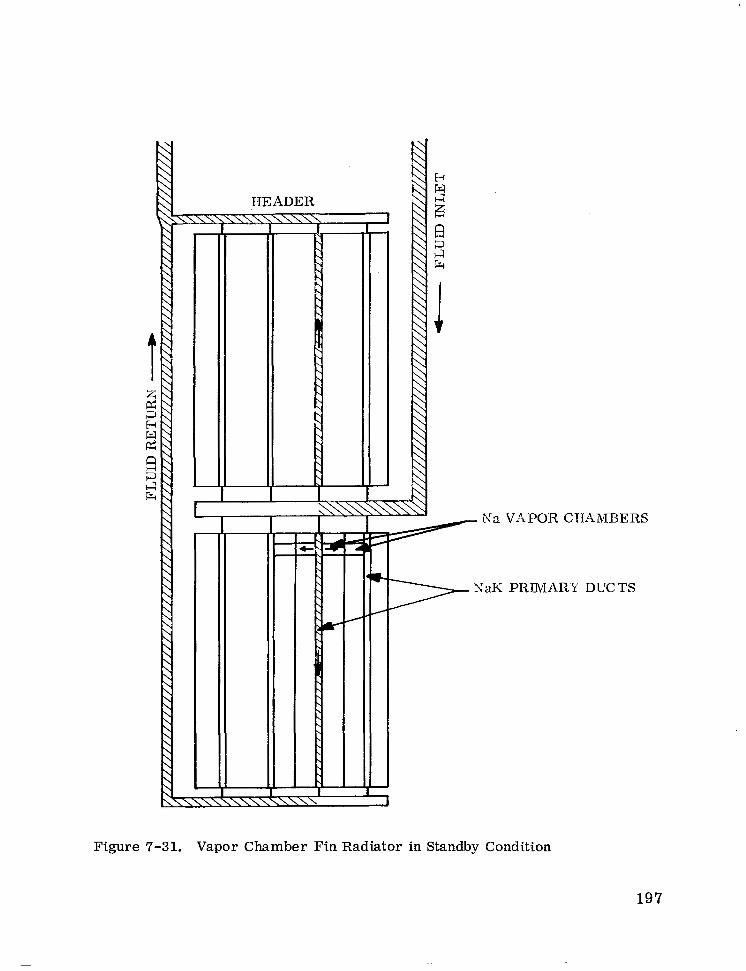
Nn VAPOR CTTXMBERS
z==” X& PRIMARY DUCTS
Figure 7-31. Vapor Chamber Fin Radiator in Standby Condition
197
loop in a fluid state, it is possible for sublimation of the sodium to occur with a resultant
mass t ransfer of sodium to the condenser section. This process could continue until the
evaporator section was devoid of sodium. The possibilities of sodium transfer to the
condenser was also examined during launch ascent. Although it is accepted that sodium
previously frozen could be liquified and redistributed within the vapor chambers due to
gravitational and acceleration forces, the circumferential orientation of the chamber pre-
cludes the possibility of adjacent vapor chambers with dry evaporators. Contingencies of
this nature must be examined more extensively for each particular set of startup conditions
before firm decisions can be made.
7 . 4 . 5 SY$TEM/MISSION CONSIDERATIONS
The configuration of the radiator and interfacing vehicles and structures must be considered.
One aspect of the startup problem, of concern to both designs, is the effect of thermal
s t r e s ses on the radiator and interfacing structure. If a dry launch were used, hot fluid
injected into the lines could create stresses which might buckle the radiator skin. A t a
minimum, the implications of this occurrence could be cracking and flaking of the emissive
coating. Dimensional changes of several inches are possible along the length and circum-
ference of a large radiator subjected to differential temperatures of 1200 to 1300 F.
Startup procedures must reflect these considerations. A thorough analysis of each radiator
would be required to determine which design is more susceptible to this kind of damage.
0
From the points considered, it appears that for most earth orbital missions either radiator
concept can be designed to alleviate potential startup problems. The V C F radiator pr imary
loop possesses several inherent characteristics which could minimize these problems; how-
ever, the significance of these advantages cannot be ascertained until a more specific
definition of the system startup requirements and characterist ics is available.
198

SECTION 8
RADIATOR COMPARISON AND CONCLUSIONS
8.1 GENERAL
TheRankine cycle vapor chamber and conduction fin radiator reference designs were based
on the same ground rules and performance considerations. Therefore, each unit is capable
of accomplishing the same function with the same reliability over the mission lifetime. The
designs derived from the study were evaluated and compared to determine whether signifi-
cant performance advantages could be obtained by use of the vapor chamber radiator.
The primary figures of merit used in this comparison are :
1. Performance (weight/area)
2. Fabrication feasibility
3. Required development effort
4. Operational
8.2 PERFORMANCE (WEIGHT/AREA)
A comparison between the reference V C F and conduction fin radiator designs on the basis
of weight and area is shown in Figure 8-1. These results are based on the conditions speci-
fied in Section 3. The radiator weights in this figure include panel, feedline, pump penalty
and structural weight.
A t the lower meteoroid protection requirement (P = 0.990), both concepts a r e equivalent
from a weight standpoint; however, the VCF has a 10 to 15 percent area advantage. The
relative insensitivity of the VCF radiator weight to changes in meteoroid survival require-
ments is demonstrated by weight/area curves; whereas the conduction fin radiator increases
in weight by 50 percent, the V C F radiator exhibits a weight increase of less than ten percent
at a P = 0.999.
0
0
199
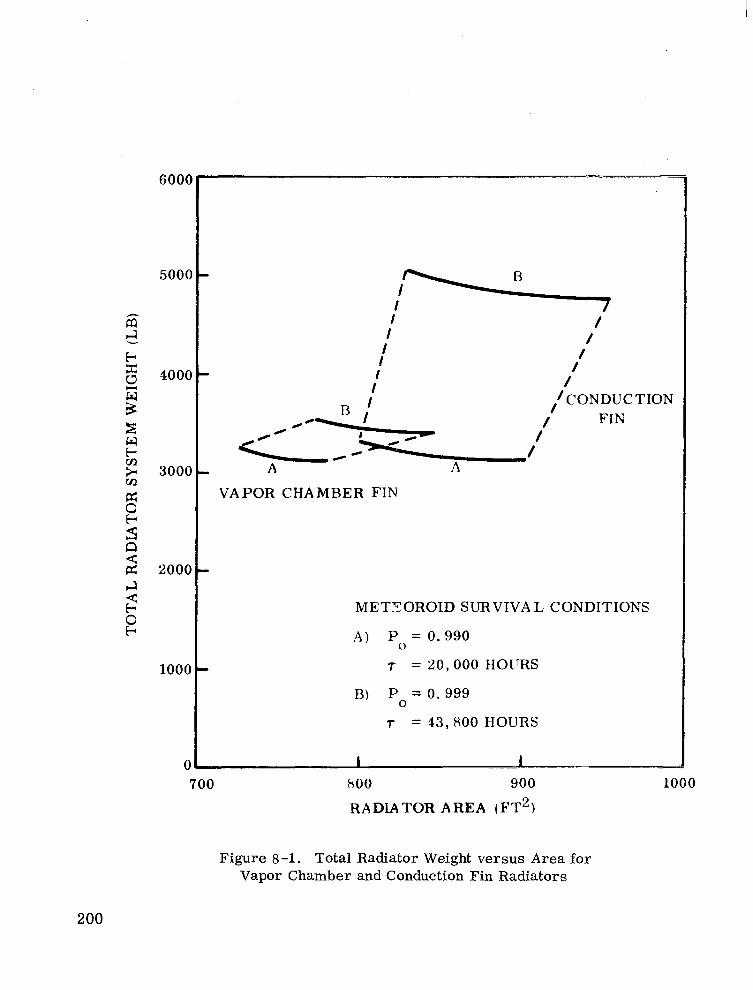
6 000
5000
4000
3000
2000
1000
0
VAPOR CHAMBER F I N
METGOROID SURVIVAL CONDITIONS
A ) P = 0.990 0
T = 20 ,000 IIOITRS
R) Po = 0 .999
T = 43, HOO HOURS
7 00 ROO 900
RADIATOR AREA ( F T ~ )
1000
Figure 8-1. Total Radiator Weight versus Area for Vapor Chamber and Conduction Fin Radiators
200
This characteristic is a direct consequence of the smaller vulnerable area of the primary
fluid ducts in the V C F radiator. The VCF design has obvious weight advantages as meteor-
oid protection requirements become more severe.
The area and weight of the vapor chamber radiator uses the condensing AT calculated by the
HPIPE program. Experimental results were at least an order of magnitude larger than pre-
dicted by HPIPE. If the experimental results had been used to design the vapor chamber
radiator, it would have been anywhere from approximately 4 to 20 percent larger and heavier,
depending on the experimental results used.
The results of the evaluation incorporate a meteoroid cratering coefficient of stainless
steel equal to 1.67. More recent estimates as discussed in Sections 5 . 1 . 1 and 7 . 2 . 1 suggest
a value of 2 . 6 2 to be more accurate. The effect of this change is to significantly increase
radiator weight. Continuing reassessments of the meteoroid hazard have the potential of
significantly affecting the weight comparison presented.
The comparison of vapor chamber and conducting fin radiators in this section does not in-
clude internal fins in primary fluid ducts of the vapor chamber radiator. While these f i n s
have some heat transfer advantages over plain ducts, they are unattractive from a fabrica-
tion standpoint.
An evaluation of several design and performance characteristics of both optimized radiator
systems provides a number of interesting comparisons. A design point comparison of the
two radiators is shown in Table 8-1.
20 1
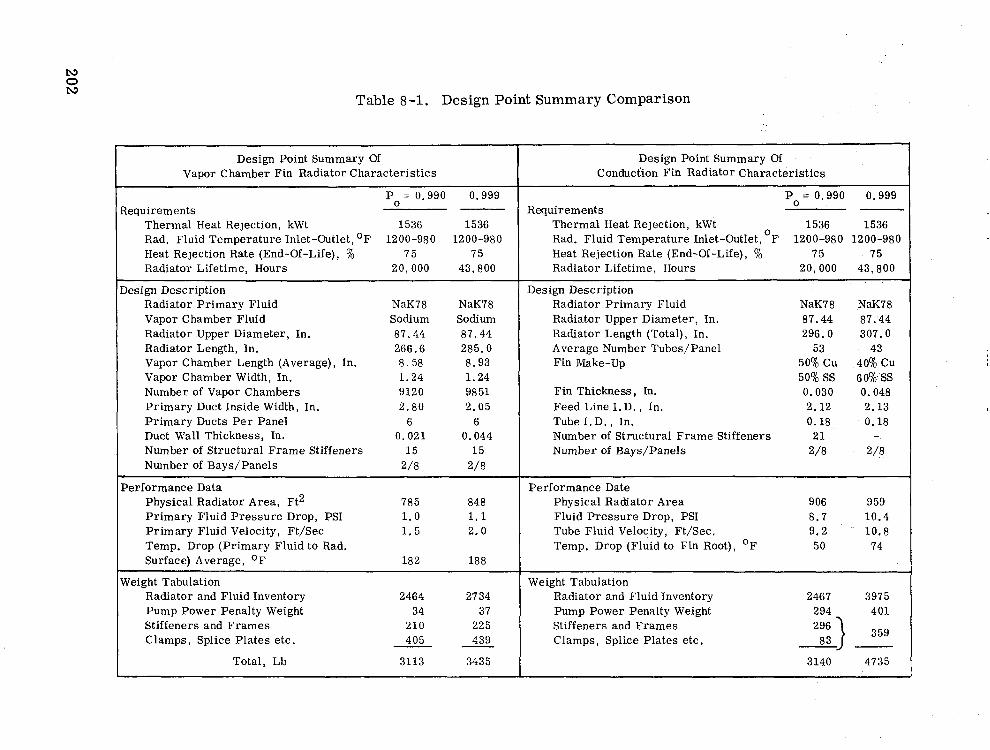
Table 8-1. Design Point Summary Comparison
Design Point Summary Of Vapor Chamber Fin Radiator Character is t ics
P = 0.990 0.999 Requirements
0
Thermal Heat Rejection, kWt 1536 1536 Rad, Fluid Temperature Inlet-Outlet, O F 1200-980 1200-980 Heat Rejection Rate (End-Of-Life), % 75 75 Radiator Lifetime, Hours 20,000 43,800
Design Description Radiator Pr imary Fluid NaK78 NaK78 Vapor Chamber Fluid Sodium Sodium Radiator Upper Diameter, In. 87.44 87.44 Radiator Length, In. 266.6 285.0 Vapor Chamber Length (Average), In. 8 . 58 8 .93 Vapor Chamber Width, In. 1 .24 1 .24 Number of Vapor Chambers 9120 9851 Primary Duct Inside Width, In. 2 .80 2 .05 Pr imary Ducts Per Panel 6 6 Duct Wall Thickness, In. 0.021 0.044 Number of S t ruc tura l Frame S t i f feners 1 5 15 Number of Bays/Panels 2/8 2/8
Performance Data Physical Radiator Area, Ft2 785 848 P r imary F lu id P res su re Drop , PSI 1 . 0 1.1 Primary Fluid Veloci ty , Ft /Sec 1 .5 2 .0 Temp. Drop (Primary Fluid to Rad. Surface) Average, O F 182 188
Weight Tabulation Radiator and Fluid Inventory 2464 2734 Pump Power Penalty Weight 34 37 S t i f feners and Frames 210 225 Clamps, Spl ice Plates e tc . 405 439
Total, Lb 3113 3435
Design Point Summary Of Conduction Fin Radiator Characterist ics
P = 0.990 0.999 Requirements
0
Thermal Heat Rejection, kWt 1536 1536 Rad. Fluid Temperature Inlet-Outlet, F 1200-980 1200-980 Heat Rejection Rate (End-Of-Life), % 75 75 Radiator Lifetime, Hours 20,000 43,800
0
Design Description Radiator Primary Fluid NaK78 .NaK78 Radiator Upper Diameter, In. 87.44 87.44 Radiator Length (Total) , In. 296.0 307.0 Average Number Tubes/Panel 53 43 Fin Make-up 50% Cu 40% Cu
50% SS 6O%SS Fin Thickness, In. 0.030 0.048 Feed Line I . D. , In. 2.12 2.13 Tube I . D. , In. 0.18 0.18 Number of Structural Frame St i f feners 21 - Number of Bays/Panels 2/8 2 4
Performance Date Physical Radiator Area 906 959 Fluid Pressure Drop, PSI 8.7 10.4 Tube Fluid Velocity, Ft/Sec. 9.2 ’ 10.8 Temp. Drop (Fluid to Fin Root), O F 50 74
Weight Tabulation Radiator and Fluid Inventory 2467 3975 Pump Power Penalty Weight 401 St i f feners and Frames 2} 359 Clamps, Spl ice Plates e tc .
3140 4735 ”
83
r
8.3 FABRICATION FEASIBILITY
An evaluation of the fabrication processes required for each radiator indicates a decided
advantage is afforded the conduction fin radiator. The rather conventional offset fin/tube
geometry is not only easier to fabricate but offers relatively high reliability of fabrication
compared to the fabrication of 10,000 individual liquid metal vapor chambers. Large size
vacuum test and welding facilities would be required for the VCF radiator. The conduction
fin radiator requires a bimetallic copper to stainless steel bonded fin. Bonding techniques
such as this have been developed and should not present significant problems.
8.4 REQUIRED DEVELOPMENT EFFORT
Another important factor which must be evaluated is the present state of development of each
radiator technology and the required effort involved in obtaining flight hardware. The con-
duction fin radiator can be considered as being state-of-the-art insofar as operation at the
design point is concerned. Heat transfer performance of liquid metal conduction fin radiators
has been accurately predicted in tests at temperatures below 700 F (Reference 16), and the
1200 F temperature regime does not appear to present any special technical problem. Dur-
ing these same series of tests, no flow stability or unexplained problems of coolant maldistri-
bution were observed. It can be stipulated that a liquid metal conduction fin radiator would
involve minimal development problems.
0
0
The VCF radiator design and fabrication techniques will require development. The magnitude
of the development effort will depend to a large extent on the trade-off which is willing to be
accepted between weight and fabrication sophistication. In addition to the actual manufacture
of the VCF radiator, several other areas of investigation are necessary. These include:
1. Wick design
2. Performance predictability
3 . Influences of fluid inventory
203
The composite wick design used in the tests was thought to be responsible for the high con-
densing AT’S experienced. Verification of this theory a s well a s further investigation of
other wick designs appears to be in order.
The ability to consistently predict vapor chamber performance, within certain limits, is
another requirement which must be met. The large number of vapor chambers in a single
radiator system makes operational uniformity and predictability especially important. To
a large degree this quality will be dependent upon the ability to closely control the fabrication
of each chamber.
Another area of concern which deserves attention is the fluid inventory. Theoretically, an
amount of fluid which would just fill the wick pore volume is ideal. However, limitations
on the ability to correctly assess this volume plus the difficulty of adding a precise amount
of liquid metal to a chamber presents a problemarea. The influence of variations in fluid
inventory upon chamber performance should be carefully analyzed.
8 .5 OPERATIONAL COMPARISON
A complete assessment between two radiator concepts cannot be performed without consider-
ing the operational requirements of each mission. Behavior of the radiator system during
startup and transients are two examples of areas requiring further investigation for a specific
mission before a selection between radiators can be made. A cursory analysis, presented
in Section 7.4, indicates that several characteristics of the VCF radiator offer less severe
startup problems.
8.6 CONCLUSIONS
The analytical design and testing performed in this study was directed towards a comprehen-
sive evaluation of the Vapor Chamber Fin (VCF) radiator for the potassium Rankine cycle.
Several conclusions concerning the characteristics of the V C F radiator and its competitive-
ness with the conduction fin radiator are cited here:
204
1. The work performed in this study has indicated that the VCF radiator is a feasible heat rejection concept for use in the potassium Rankine cycle in a zero g environment. A detailed design concept has been presented which is capable of satisfying the heat rejection and structural requirements imposed by an unmanned 300 kWe potassium Rankine power system launched aboard a two stage Saturn V. This conclusion is substantiated by the testing of a proto- type sodium vapor chamber fin in the 825 to 1600°F temperature range.
0
2. A comparison of the fabrication requirements for the VCF and conduction fin radiators indicates that the VCF system is considerably more difficult to fabri- cate. Construction of the conduction fin concept can be considered to be state- of-the-art with the exception of the bimetallic (stainless steel and copper) fin. Although this design feature is not expected to present a large development effort, elimination of the copper would only incur a 15 to 20 percent weight penalty.
3. The construction of the optimized V C F radiator presented in this study entails the filling of approximately 10,000 separately sealed vapor chambers with alkali metal. The operation of a vapor chamber necessitates high purity filling conditions, cleanliness of the V C F walls and wick, and completely reliable individual chamber sealing. Failure to provide close quality control can lead to an overall decrease in the radiator effectiveness. It is concluded that a sizable fabrication development effort is required before a 10,000 chamber radiator can be built with predictable performance.
4. The relative attractivenss of the VCF radiator as compared to a conduction fin radiator is dependent upon the mission of interest and in particular upon the meteoroid survival probability required. At the less severe meteoroid survival probability condition considered, 0.99 for 20, 000 hours, the incentive for develop- ing a V C F radiator is minimal. However, at meteoroid survival probabilities of 0.999 for five years, a significant (for an unmanned system) weight and area savings over a conduction fin radiator can be achieved. The comparative insensi- tivity of the V C F radiator concept to changes in meteoroid survival probabilities is directly related to two characteristics of this concept:
a. Fewer primary fluid (NaK-78) ducts are required, resulting in a large reduction in the vulnerable area of the main coolant loop.
b. The vapor chamber fins, which comprise almost all of the radiator surface a rea , a r e redundant devices. Therefore, the armor requirements can be determined with the expectation that a percentage of chambers will eventually be punctured without a significant loss in radiator performance.
20 5

However, the weight advantage for the V C F radiator is probably negligible as compared to the modified 47r shield weight of over 50,000 pounds required for postulated manned space missions.
5. A detailed analytical investigation of four promising V C F geometries concluded that the rectangular channel configuration was optimum. This analysis included the effects of the heat transfer, heat pipe operation, meteoroid protection, vehicle and primary duct integration, structural and fabrication requirements. The finned round tube and finned rectangular chamber designs were superior to the rectangular channel from a heat transfer standpoint. Structural requirements of both finned concepts, however, increased the weight of these radiator systems significantly. The finned round tube was susceptible to tube crushing and both finned geometries were subject to fin buckling, especially when thinner (0,010 to 0.015 inch) fins were considered.
6. The honeycomb vapor chamber concept resulted in an unattractive V C F design; this is due to the poor thermal efficiency of the device caused by the interior honeycomb walls. The large radiating area required by this concept negated the effects of the inherent honeycomb structural rigidity.
7 . The results of the fluid evaluation showed that sodium was a superior vapor chamber working fluid a s compared to cesium and potassium. This was attri- buted to the high surface tension and latent heat of vaporization of sodium. Cesium was unacceptable as a vapor chamber fluid for the conditions studied.
8. The VCF tests demonstrated the ability of the rectangular channel geometry to be used a s a heat rejection device with sodium as the working fluid. The V C F performed satisfactorily in the 825O to 1600°F temperature regime as well as under a 1 0 degree tilt condition and at evaporator heat fluxes up to 1.4 x l o 5 BTU/hr-ft2. The one uncertainty surrounding the V C F tests was the condensing AT. Initially, observed condensing temperature drops were considerably higher than predicted. Testing of a second V C F produced lower AT'S which continued to decrease with time. This unexpected result was attributed to an incomplete filling of the condenser fluid return annulus. The design of composite wicks, using an annular condenser return, requires more investigation.
206
SECTION 9
REFERENCES
1. Whipple, F. L. , Meteoroids and Penetration, Journal of Geophysical Research, Volume 68, Number 17, 1963.
2. Loeffler, I. J., S. Lieblein, and N. Clough, "Meteoroid Protection for Space Radiators," In "Progress in Astronautics and Aeronautics, Vol II, Power Systems for Space Flight, 'I
Academic Press , New York, 1963.
3. "A Study of Jupiter Flyby Missions, General Dynamics Report FZM-4625, May 17, 1966.
4. Volkoff, J. J. , "Protection Requirements for the Resistance of Meteoroid Penetration Damage of Interplanetary Spacecraft Systems, JPL Technical Report No. 32-410, July 1, 1964.
5. Diedrich, J. H. , I. J. Loeffler, and A. R. McMillan, "Hypervelocity Jmpact Damage Characteristics in Beryllium and Graphite Plates and Tubes, * I NASA TN D-3018, September, 1965.
6. Clough, N. , Lieblein, S. , McMillan, A.R. , "Crater Characteristics of 11 Metal Alloys Under Hyper-Velocity Impact Including Effects of Projectile Density and Target Temperaturer1, NASA TN D-5135, April 1969.
7. Cockfield, R. D. , "Comparison of Load Bearing and Non-Load Bearing Radiators for Nuclear Rankine Systems. NASA CR-72307, May 6, 1967.
8. Hagen, K. G. , "Integration of Large Radiators with Nuclear Electric Spacecraft Systems", Air Transport and Space Meeting, New York, N. Y. , April 1964.
9. Kunz, H. R. , Langston, L. S. , Hilton, B. H. , Wyde, S. S., and Nashick, G. H. , "Vapor Chamber Fin Studies, NASA CR-812, June 1967.
10. Lieblein, S. , "Analysis of Temperature Distribution and Radiant Heat Transfer Along A Rectangular Fin of Constant Thickness, " NASA TN D-196.
11. Gerard G. , Becker, H. , "Handbook of Structural Stability Part VI - Strength of Stiffened Curved Plates and Shells, NASA-TN 3786, July 1958.
12. Cotter, L. , "Theory of Heat Pipes, Los Alamos Scientific Laboratory, "3246 MS, March 26, 1965.
207
13. Sawochka, S. G. , "Thermal and Hydraulic Performance of Potassium during Condensation Inside a Single Tube, I t NASA CR-851, August 1967.
14. Ewing, C. T. , e t al, "High Temperature Properties of Potassium, I' U. S. Naval Research Laboratory, NRL 6233, September 24, 1965.
15. Shanley, F. R., ftWeight-Strength Analysis of Aircraft Structures, I' Dover Publications, 1952.
16. Cockfield, R. D. , Killen, R. T. , ftTesting of an Aluminum Radiator With Liquid Metal Coolant. Presented at AIAA Thermophysics Conference, June 1970.
208
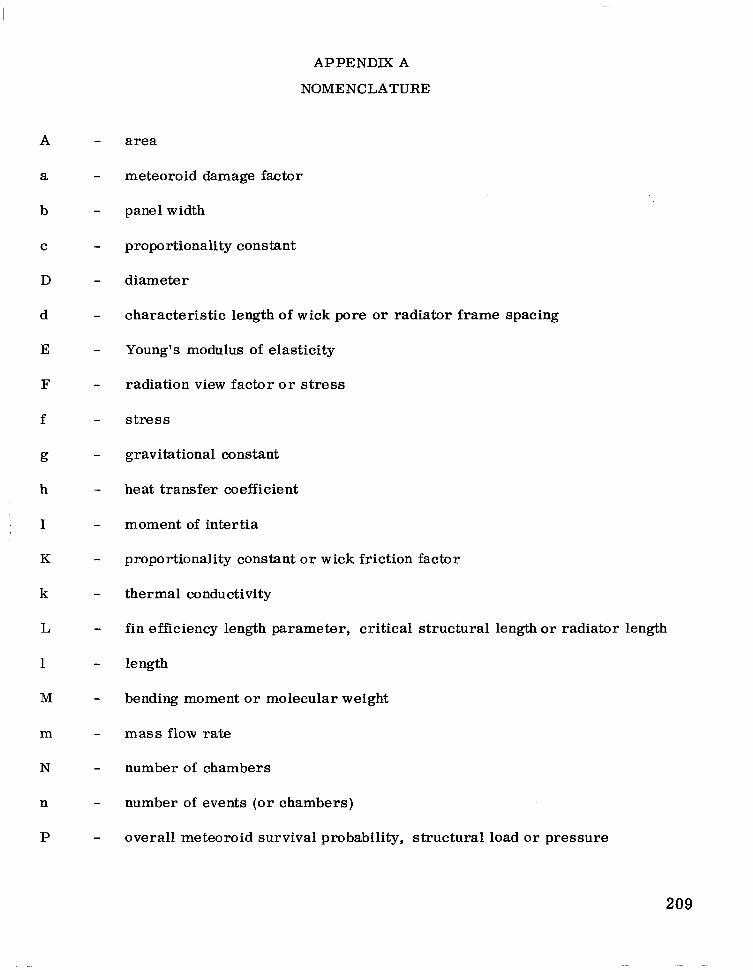
APPENDIX A
NOMENCLATURE
A
a
b
C
D
d
E
F
f
g
h
' I
K
k
L
1
M
m
N
n
P
area
meteoroid damage factor
panel width
proportionality constant
diameter
characterist ic length of wick pore or radiator f rame spacing
Young's modulus of elasticity
radiation view factor o r stress
stress
gravitational constant
heat transfer coefficient
moment of intert ia
proportionality constant o r wick friction factor
thermal conductivity
fin efficiency length parameter, critical structural length or radiator length
length
bending moment or molecular weight
m a s s flow rate
number of chambers
number of events (or chambers)
overall meteoroid survival probability, structural load or pressure
209
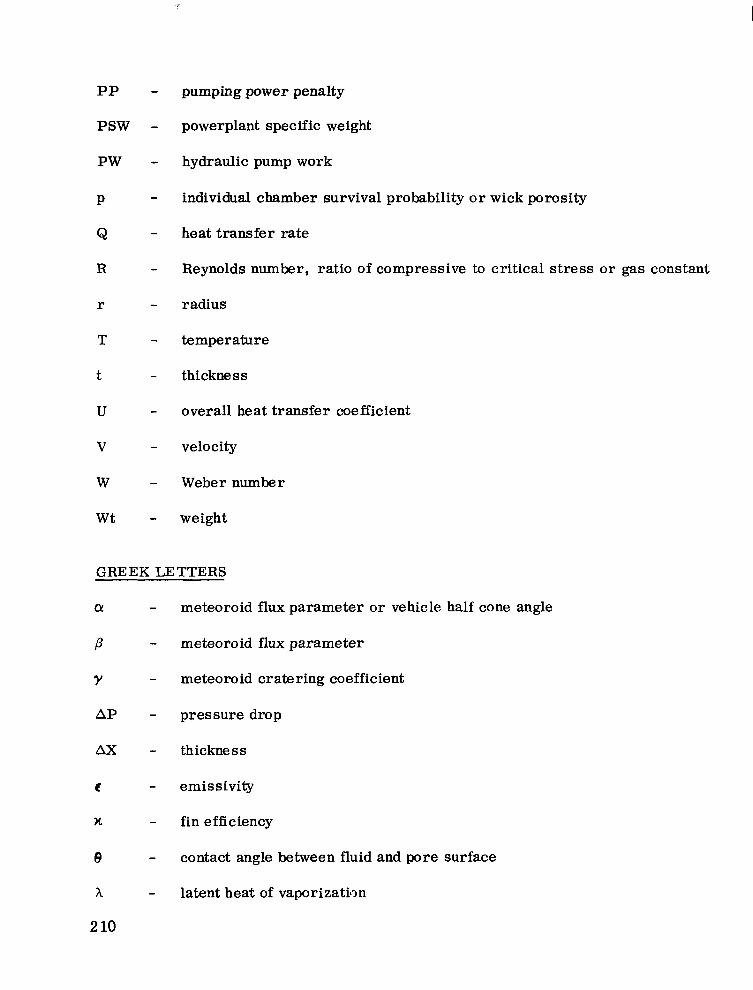
PP
PSW
PW
P
Q
R
r
T
t
U
V
W
W t
pumping power penalty
powerplant specific weight
hydraulic pump work
individual chamber survival probability or wick porosity
heat t ransfer rate
Reynolds number, ratio of compressive to c r i t i ca l s t r e s s o r gas constant
radius
temperature
thickness
overall heat transfer coefficient
velocity
Weber number
weight
GREEK LETTERS - CY
P
Y
AP
Ax
6
x
e
A
2 10
meteoroid flux parameter or vehicle half cone angle
meteoroid flux parameter
meteoroid cratering coefficient
pressure drop
thickness
emissivity
fin efficiency
contact angle between fluid and pore surface
latent heat of vaporizatiiJn
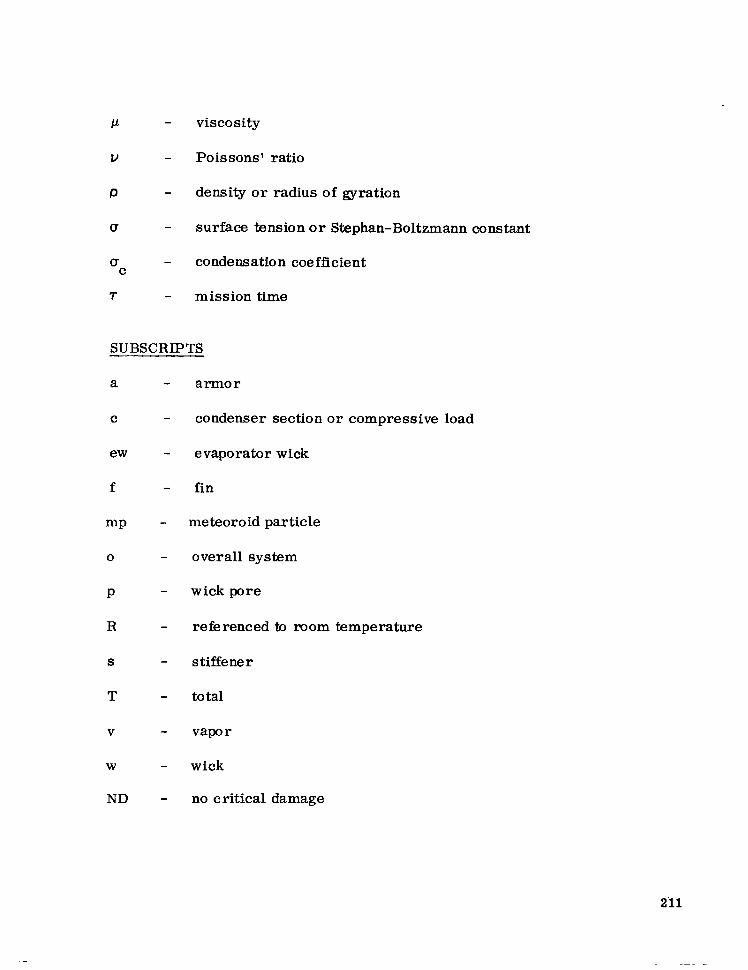
P - viscosity
V - Poissons' ratio
P - density o r radius of gyration
(5 - surface tension o r Stephan-Boltzmann constant
U C
- condensation coefficient
7 - mission time
SUBSCRIPTS
a
C
ew
f
nlP
0
P
R
S
T
V
W
ND
- armor
- condenser section o r compressive load
- evaporator wick
- fin
- nleteoroid particle
- overall system
- wick pore
- referenced to room temperature
- stiffener
- total
- vapor
- wick
- no critical damage
21 1

APPENDIX B TEST PLAN FOR VAPOR CHAMBER RADIATOR
SECTION 1 INTRODUCTION
1.1 SCOPE
This document presents detailed instructions for performing engineering tests on the vapor
chamber radiator.
1.2 OBJECTIVE
The primary objective of this test program is to demonstrate the capability of the vapor
chamber radiator as detailed in GE Drawing 47D301344.
1.3 APPLICABLE DRAWINGS
1.3.1 DRAWINGS
SK 6569JH
47D301339
47D301340
47D301341
47D301342
47D301343
47D301344
47B301336
47B301337
47E301338
Vapor Chamber R.adiator Bell Jar Test Assembly
Calorimeter Tube
Lower Insulation
Middle Insulation
Upper Insulation
Electron Bombardment Heater
Sodium Heat Pipe Vapor Chamber Radiator
Adjustable Mounting Plate
Channel Support
Adjustable Mounting Support Vapor Chamber Radiator
2 12

SECTION 2
TEST CONDITIONS , FACILITIES AND EQUIPMENT
2.1 TEST CONDITIONS
2.1.1 VISUAL EXAMINATION AND TEST CONDITIONS
Visual examination and test shall be performed under the following standard conditions
unless otherwise specified:
1. Temperature"77 F t 18 F
2. Relative Humidity"28 to 32 inches of mercury
0 0
Vacuum conditions will be maintained at a chamber pressure of 5 x 10 t o r r or less. -5
2.2 TEST FACILITIES
The test facility which will be utilized for this test is the NRC 3177 Vacuum System located
in Vacuum and High Temperature Technology Lab, Room 8941, CCR 8.
2 . 3 TEST EQUIPMENT
The following test equipment (or equivalent) is required to perform the vapor chamber heat
pipe tests.
1. Vacuum Chamber System--NRC 3177
2. L & N Thermocouple Checking Furnace, Model #9009-A-3
3. L & N 3555 Type K5 Potentiometer
4. Eppley Standard Cell, Cat. #lo0
5. Esterline 24-point Recorder, Model #E1124E
6. Heater Power Supply (Kilovolt Corp.)
213

7. Variac, 120 volts at 20 amperes
8. Isolation Transformer, Sola Ca. #23-25-220
9. L&N Ice Bath
10. L&N Standard Thermocouple, platinum: platinum-rhodium, S/N AB-69-40
11. NLS Digital Voltmeter, Series 290C
12. Esterline Strip Chart Recorder, Model #11015
13. Turbine Flow Transducer Flow Technology Inc.
14. 40-Point L&N Switch
15. Weston Volt and Amp Meters
16. Flow R.egulator.
2 14

SECTION 3
PR.E-TEST REQUIREMENTS AND OPERATIONS
3.1 TEST SPECIMEN
The vapor chamber radiator, Drawing 47D301344, is of a rectangular cross-section,
1.25" x 0.36", and a length of 8.5". This thin-walled pipe is filled with liquid sodium
and sealed. It should be noted that white gloves must be utilized in handling of the pipe
and all surfaces of the pipe must be free of dirt and grease. The pipe must not be sub-
jected to any unnecessary shock or vibration.
3.2 TEST FIXTURE SET-UP
The test fixture will be assembled in the NRC 3177 vacuum system bell jar as shown in
Drawing SK-6569JH. Additional insulation m y be added or removed upon approval of
the test director. A l l instrumentation and heater leads should be- routed as far away from
the fixture as possible.
3.3 INSTRUMENTATION
3.3.1 THERMOCOUPLES
Forty chromel-alumel thermocouples will be calibrated and used to instrument the heat
pipe as shown in Figure l*. Thermocouples installed on the insulation will be calibrated
in the 100 F range to 400 F range at 100 F increments. Thermocouples installed on the
calorimeter will be calibrated at their two extreme temperatures, namely, the ice point
3Z°F and boiling point of water 212 F. Thermocouples installed on the heat pipe itself
will be calibrated against a L&N standard thermocouple at 900°F, 1000 F, 1050°F, llOO°F,
1150°F, 1200°F, 1250°F and 1300'F. (Minimum calibration increments).
0 0 0
0
0
*Not attached. Refer to Figure 6-15.

3.3.2 FLOW METER
The turbine flow transducer (Flow Tech. Inc. , "Milliflowff) will be placed in the output
line of the calorimeter at least 10 pipe diameters from the closest up-stream and down-
stream connection. This device shall be capable of metering a water flow rate of 0.02 - 0.2 gpm within -!-0.2% - of true flow. A frequency to DC converter, DVM and recorder will
be used to indicate and record the flow rates as a function of time.
Flow meter readout will be made on a NLS digital voltmeter. All heater voltage and
current readings will be made with 1% or bet ter meters .
3.3.3 INSTRUMENTATION GENERAL
All thermocouples will be connected to a 32 F reference junction and to the L&N K5
potentiometer for primary data recording for stand-by or unattended operation. Key TC's
will be connected to the 24-point Esterline recorder which in turn will operate an over-
temperature safety control.
0
A block diagram of all instrumentation will be found in Figure 2. *
~
*Not attached. Refer to Figure 6-12.
2 16
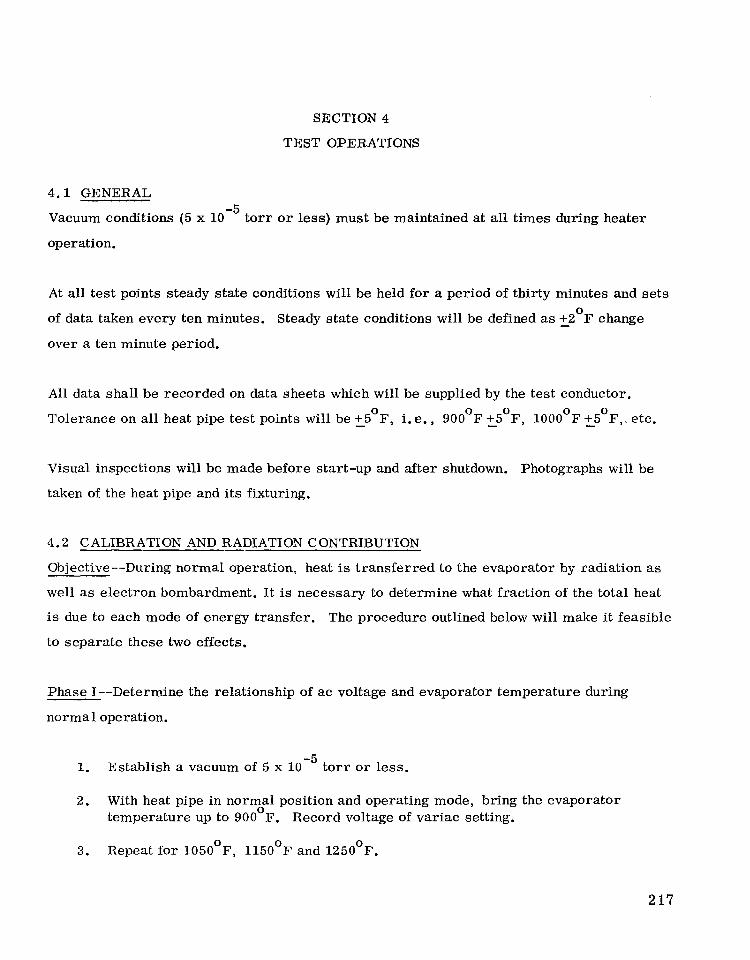
SECTION 4
TEST 0PER.ATIONS
4.1 GENERAL
Vacuum conditions (5 x 10 torr or less) must be maintained at all times during heater
operation.
-5
At all test points steady state conditions will be held for a period of thirty minutes and sets
of data taken every ten minutes. Steady state conditions will be defined as +2 F change
over a ten minute period.
0 -
Al l data shall be recorded on data sheets which will be supplied by the test conductor.
Tolerance on all heat pipe test points will be 5 5 F, i. e. , 900 F +5 F, 1000 F +5 F,. etc. 0 0 0 0 0 - -
Visual inspections will be made before start-up and after shutdown. Photographs will be
taken of the heat pipe and its fixturing.
4.2 CALIBRATION AND RADIATION CONTRIBUTION
Objective--During normal operation, heat is transferred to the evaporator by radiation as
well as electron bombardment. It is necessary to determine what fraction of the total heat
is due to each mode of energy transfer. The procedure outlined below will make it feasible
to separate these two effects.
Phase I--Determine the relationship of ac voltage and evaporator temperature during
normal operation.
1. Establish a vacuum of 5 x 10 to r r or less. -5
2. With heat pipe in normal position and operating mode, bring the evaporator temperature up to 900 F. Record voltage of variac setting. 0
3. Repeat for 1050°F, 1150°F and 1250'F.
2 17

Phase 2--Estimate the heat input due to radiation (evaporator temperatures during this
part of the test will be reduced).
1. Turn off DC power supply.
2. With variac on a voltage setting corresponding to the normal 900 F condition, 0
record heat pipe temperature.
3 . Repeat for variac voltage settings corresponding to 1050°F, 1150 F and 1250 F as 0 0
established in Phase 1, Step c.
4. Calculate estimates of power input to heat pipes by radiation.
Phase 3--Using a series of shrouds consisting of Dyna-Quartz blocks, measure the radia-
tion contribution at various temperature levels.
1. Estimate the amount of shrouded area from the results of Phase 2.
2. With shrouds in place, variac voltages on settings determined in Phase 1, and DC supply off, record the evaporator temperature for the four (4) variac settings in Phase 1; 900°F, 1050°F, 1150°F and 125O0F.
3 . From the recorded temperatures calculate the heat transferred versus evaporator temperature.
4.3 MEASUR.EMENT OF EVAPORATIVE HEAT FLUXES VERSUS AT'S
Objective--Measure the evaporative heat flux between 5,000 and 80,000 BTU/Hr-Ft as a
function of evaporative AT and condensing AT.
2
Procedure 1--Establish a vacuum of 5 x 10 tor r o r less. -5
Procedure 2--At a minimal power level (less than 50 watts) heat the vapor chamber until
heat pipe action can be obtained. When isothermal conditions are reached, the water flow
rate should be adjusted such that the water AT is between 10 and 20 degrees F. Record
power input, all thermocouples, flow rate, etc., when steady state has been reached.
218
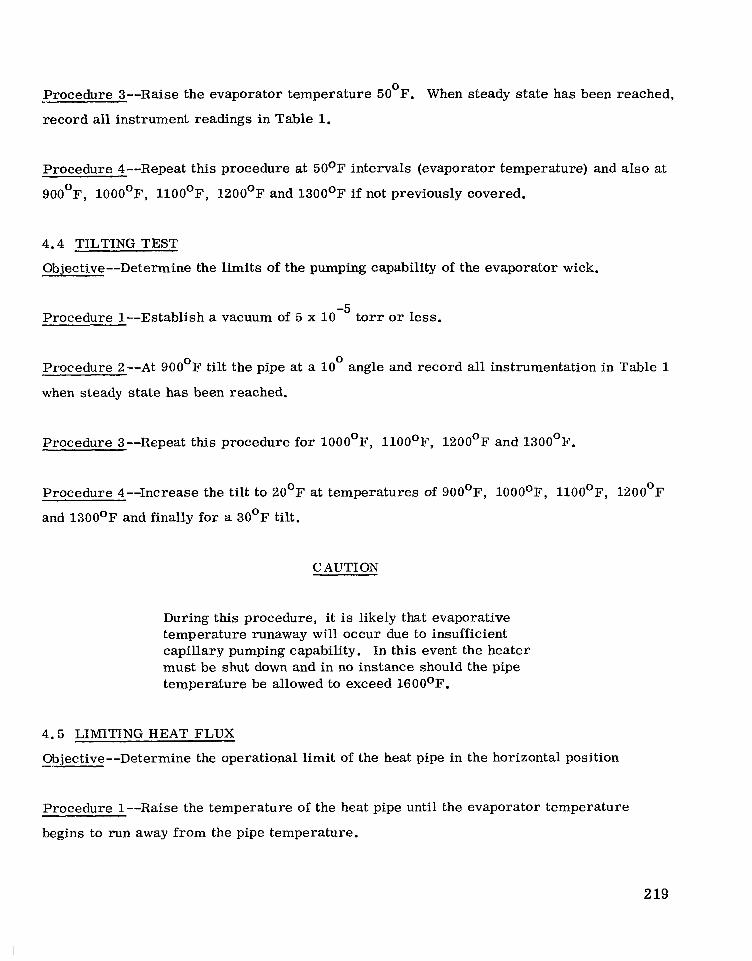
Procedure 3--Raise the evaporator temperature 50 F. When steady state has been reached,
record all instrument readings in Table 1.
0
Procedure 4--Repeat this procedure at 50°F intervals (evaporator temperature) and also at
900°F, 1000°F, llOO°F, 1200°F and 1300°F if not previously covered.
4.4 TILTING TEST
Objective--Determine the limits of the pumping capability of the evaporator wick.
Procedure 1--Establish a vacuum of 5 x 10 to r r o r less. -5
Procedure 2--At 900°F tilt the pipe at a 10 angle and record all instrumentation in Table 1
when steady state has been reached.
0
Procedure 3--Repeat this procedure for 1000°F, llOO°F, 1200°F and 1300°F.
Procedure 4"Increase the tilt to 20°F at temperatures of 900°F, 1000°F, llOO°F, 1200°F
and 1300°F and finally for a 30°F tilt.
CAUTION
During this procedure, it is likely that evaporative temperature runaway will occur due to insufficient capillary pumping capability. In this event the heater must be shut down and in no instance should the pipe temperature be allowed to exceed 1600OF.
4 . 5 LIMITING HEAT FLUX
0bjective"Determine the operational limit of the heat pipe in the horizontal position
Procedure 1--Raise the temperature of the heat pipe until the evaporator temperature
begins to run away from the pipe temperature.
2 19
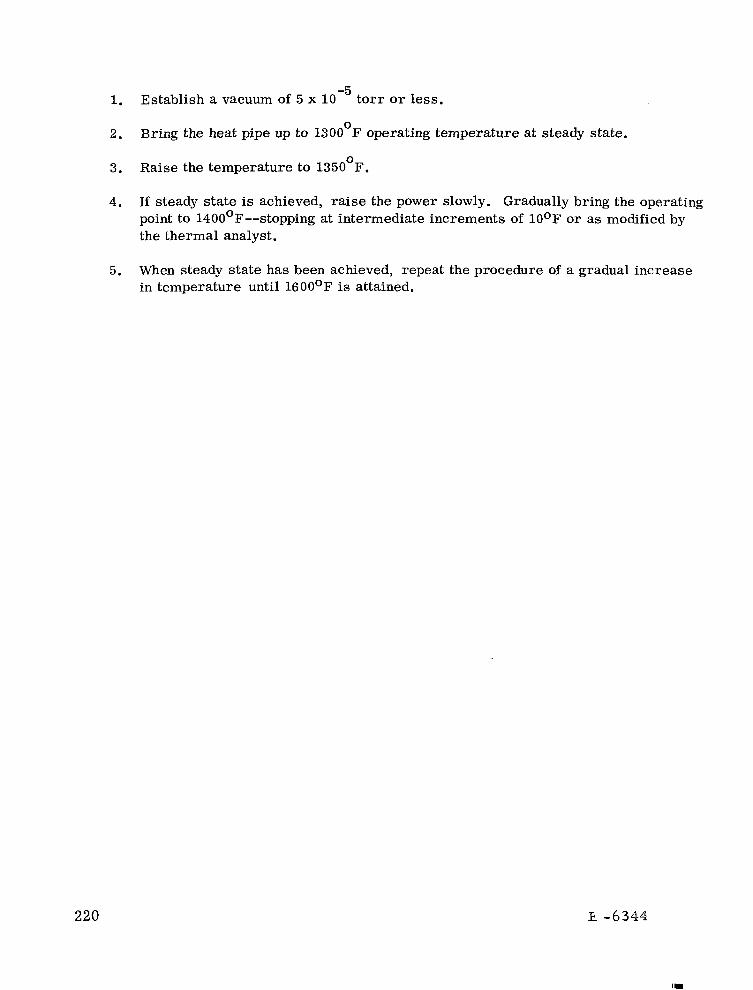
1. Establish a vacuum of 5 x 10 t o r r o r less. -5
2. Bring the heat pipe up to 1300 F operating temperature at steady state.
3. Raise the temperature to 1350 F.
0
0
4. If steady state is achieved, raise the power slowly. Gradually bring the operating point to 1400°F--stopping at intermediate increments of 10°F o r as modified by the thermal analyst.
5. When steady state has been achieved, repeat the procedure of a gradual increase in temperature until 1600°F is attained,
220 E -6344
![OTIMIZAÇÃO DE CICLO DE TURBINA A VAPOR COM ......É importante para o entendimento desse projeto o conhecimento básico de turbinas a vapor e do ciclo Rankine. De acordo com [3]](https://img.pdfslide.net/doc/110x75/5e6954356f7f2f458510315e/otimizafo-de-ciclo-de-turbina-a-vapor-com-importante-para-o-entendimento.jpg)
![04 - Ciclo de Rankine Ideal - Exercício · 2020. 6. 16. · gua é o fluido de trabalho em um ciclo de potência a vapor de Rankine ideal. Vapor saturado entra na turbina a 8 [MPa]](https://img.pdfslide.net/doc/110x75/5fe8e5f4f698127997391bc3/04-ciclo-de-rankine-ideal-exerccio-2020-6-16-gua-o-fluido-de-trabalho.jpg)