Embed Size (px)
Citation preview
Purdue UniversityPurdue e-Pubs
LARS Technical Reports Laboratory for Applications of Remote Sensing
1-1-1972
Potential Benefits of Remote Sensing: TheoreticalFramework and Empirical EstimateLudwig M. Eisgruber
Follow this and additional works at: http://docs.lib.purdue.edu/larstech
This document has been made available through Purdue e-Pubs, a service of the Purdue University Libraries. Please contact [email protected] foradditional information.
Eisgruber, Ludwig M., "Potential Benefits of Remote Sensing: Theoretical Framework and Empirical Estimate" (1972). LARSTechnical Reports. Paper 28.http://docs.lib.purdue.edu/larstech/28
Information Note 030872
POTENTIAL llENEFITS OF REMOTE SENSING:
THEORbTICAL FRAMEWORK AND EMPIRICAL ESTIMi\'I'I~
by
Ludwig M. Eisgruber
Laboratory for Applications of Remote Sensi ng (LARS)
Purdue University
West Lafayette, Indiana
Information Note 030872 LARS/Purdue University
POTENTIAL BENEFITS OF REMOTE SENSING:
THEORETICAL FRAMEWORK AND AN EMPIRICAL ESTIMATE
Ludwig M. EisgrUber
I. Statement of Problem and Objective
The use of public funds has always been subject to public scrutiny and political log-rolling, but the intensity of this public scrutipy has not been higher any time during the past several decades than it is now. Partly this is due to the less favorable economic situation. However, the more important factors are (a) more awareness of the many public projects (welfare, housing~ nutrition, pollution, transportation, etc.) and (b) better methods of accounting for costs and estimating of benefits of such projects. Thus, this high degree of public scrutiny can-be expected to persist and perhaps intensify.
Public scrutiny is particularly evident in relation to continued funding of efforts of developing "space technology." Remote sensing largely falls into the category "space technology ," and it is, therefore, ne cessary to undertake "technology assessment" as it relates to remote sensing, if this public scrutiny is to be met successfully.
It is the purpose of this paper to show that the basic theoretical framework exists for the estimation of social returns from research and applications of remote sensing. Further, it is the purpose to estimate the approximate magnitude (in dollars) of a
particular application of remote sensing, namely the estimation of production of corn, soybeans, and wheat. Finally. some comments will be made on the limitations of this procedure mld on the implications of the re~ults.
II. Theoretical Framework 1/
1. The ClaSSical Model for Measuring Social Benefit
It would be unsatisfactory to approach the task of estimation of potential benefits from remote sensing from the premise that the value of a thing (or service) to the user is equal to the price he pays for it. Instead a user purchases a good (or service) at any price which is equal to or less than the value of that particular good (or service) to him in use. For example, medical drugs tend to have a value :In use which is much higher than the cost of the drug. Thus, the value (or benefit) of goods (or services) does not have to be equal to their cost (or price), indeed, in general it is not. This is particularly evident in the public goods sector. For instance, the fact that there is no charge for the use of most highways cannot be interpreted to mean that the value (or
1/ The theoretical framework presented here is that described in [4]. [7], and [8], among oth ers •
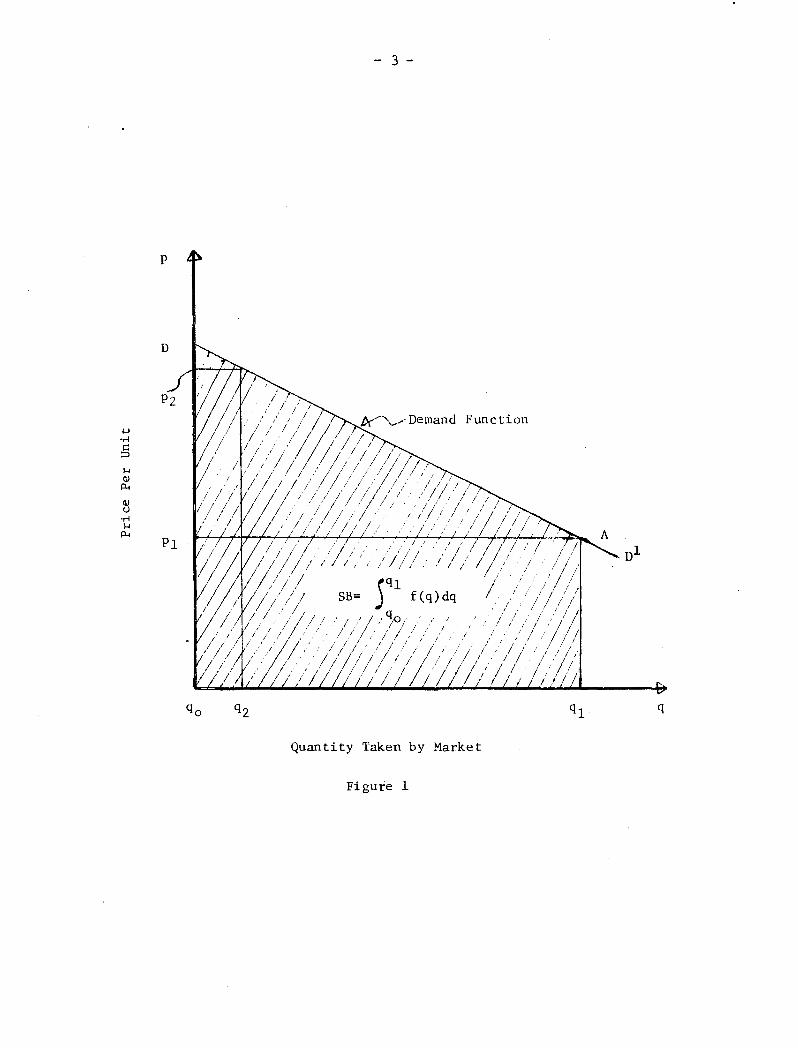
benefits) to individuals and society of these highways is zero. It merely points out the general fact that many users of goods and services would, if necessary, pay more for these goods and services than they actually do pay. Consequently, total benefits to society of a particular good or service cannot be obtained by simply multiplying the number of units consumed by what is paid for them (i.e. their price). Instead, total benefit to society is measured by the aggregate of the maximum prices that would be paid for the individual small units of the commodity corresponding to the costs of alternatives to the various users. This will be explained on hand of Figures 1 and 2.
Figure 1 shows a demand function·, DDl; i.e. the relationship between price, p, paid for a good and the quantity of a good taken by the market. For"example, if the price is PI (in Figure 1), the market will clear a quantity ql of the good. In such a situation there is a number of users (buyers) who would, if necessary, pay more than PI- Indeed, as many as (ql-l) units of the good would be expected to clear the market at a price slightly higher than Pl. Furthermore, a quantity q2 would still clear the market if the price were raised to P2. This implies that all those individuals who paid a price of only PI when they would have been willing to pay a higher price (such as PZ) for the good derived a value (benefit) from the good which is higher than the cost of that good.
From the above it follows that total social benefit, SB, derived from quantity ql is represented by the shaded area qoDAq~. Since price is a function of quant1ty, i.e. p=f(q),
- 2 -
social benefit can also be expressed as
SB f(q) dq ( 1)
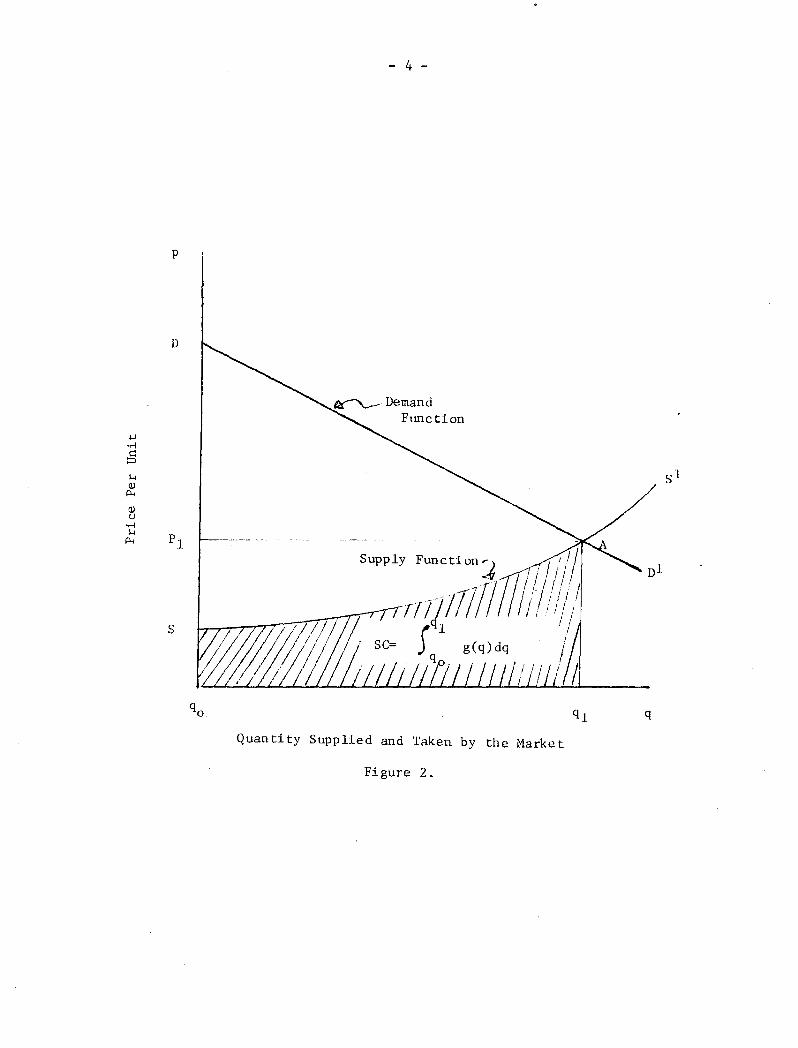
In the production of the good, society will incur costs (social costs). Generally, these costs will increase as larger and larger quanti ties of the good are produced. This is expressed in Figure 2 by SSl, the supply function, i.e. the relationship between price, p, paid for a good and the quanti ty of the good supplied to the market. For example, at a price of PI' a q uan ti ty of ql will be offered on the market, and total social cost, se, is represented by the area qoSAql or
Sc = )ql g(q) dq (2)
It follows from the above that social net benefit, SNB, is equal to the difference between the areas qoDAql and qlSAql in Figure 2 or
SNB= (ql
f(q)dq- j g(q)dq
qo
(3)
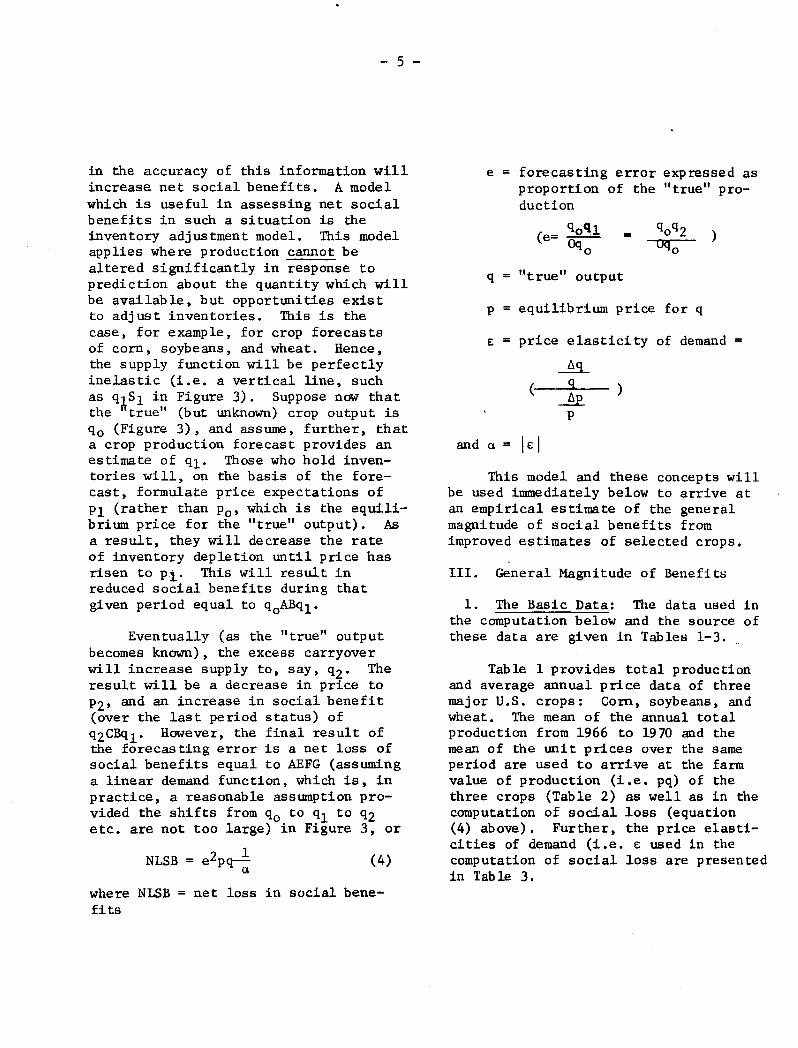
2. The Inventory Adjustment Model for Measuring Benefits from Crop Reporting '!:../
Erroneous information on the expected size of the crop distorts optimal inventory carryover. Thu8, improvements
'!:../ Based on [5].
p
D
.j..J
OM
§ H OJ
P-o
OJ ()
OM H
P-o Pi
- 3 -
.... .' / I /1/ / :'
5qi
SB= f (q) dq
Function
/
/ I'
Quantity Taken by Market
Figure 1
q
- 4 -
p
D
Sl
S
Supply Funct' . ~on:Jm' I /1 rrlf Ji/l!!/ /lj/d I
S<ll 1/ I I I /
S~ ;
q
q
Quantity Supplied and Taken by the Ma k r et
Figure 2.
- 5 -
in the accuracy of this information will increase net social benefits. A model which is useful in assessing net social benefits in such a situation is the inventory adjustment model. This model applies where production cannot be altered significantly in response to prediction about the quantity which will be available, but opportunities exist to adjust inventories. This is the case, for example, for crop forecasts of corn, soybeans, and wheat. Hence, the supply function will be perfectly inelastic (i.e. a vertical line, such as qt.Sl in Figure 3). Suppose now that the 'true" (but unknown) crop output is qo (Figure 3), and assume, further, that a crop production forecast provides an estimate of ql' Those who hold inventories will, on the basis of the forecast, formulate price expectations of PI (rather than Po' which is the equilibrium price for the "true" output). As a result, they will decrease the rate of inventory depletion until price has risen to Pl' This will result in reduced social benefits during that given period equal to qoABql'
Eventually (as the "true" output becomes known), the excess carryover will increase supply to, say, q2' The result will be a decrease in price to P2' and an increase in social benefit (over the last period status) of Q2CBql' However, the final result of the forecasting error is a net loss of social benefits equal to AEFG (assuming a linear demand function, which is, in practice, a reasonable assumption provided the shifts from qo to ql to q2 etc. are not too large) in Figure 3, or
(4)
where NLSB = net loss in social benefits
e = forecasting error exp ressed as proportion of the "true" pro-duction
(e= qoql - qoq2 ) Oqo Oqo
q = Utrue" output
p = equilibrium price for q
E: = price elasticity of demand =
~ ( 9. )
...Ae. p
and ex = 1£ I This model and these concepts will
be used immediately below to arrive at an empirical estimate of the general magnitude of social benefits from improved estimates of selected crops.
III. General Magnitude of Benefits
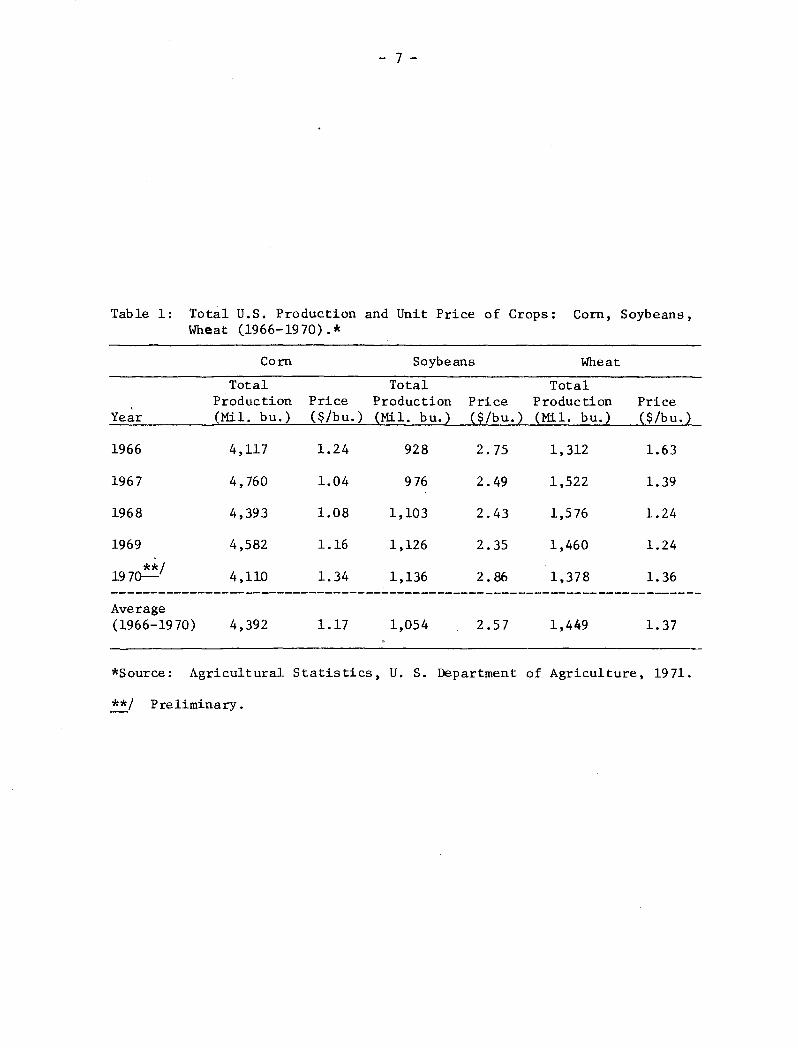
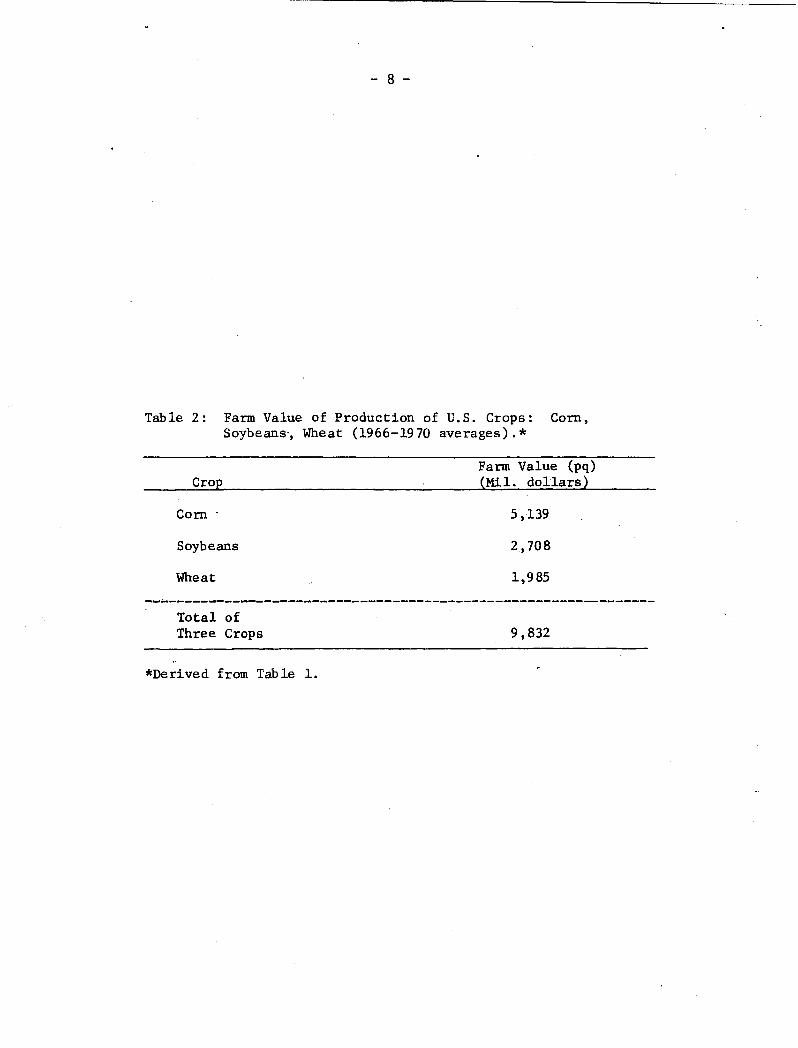
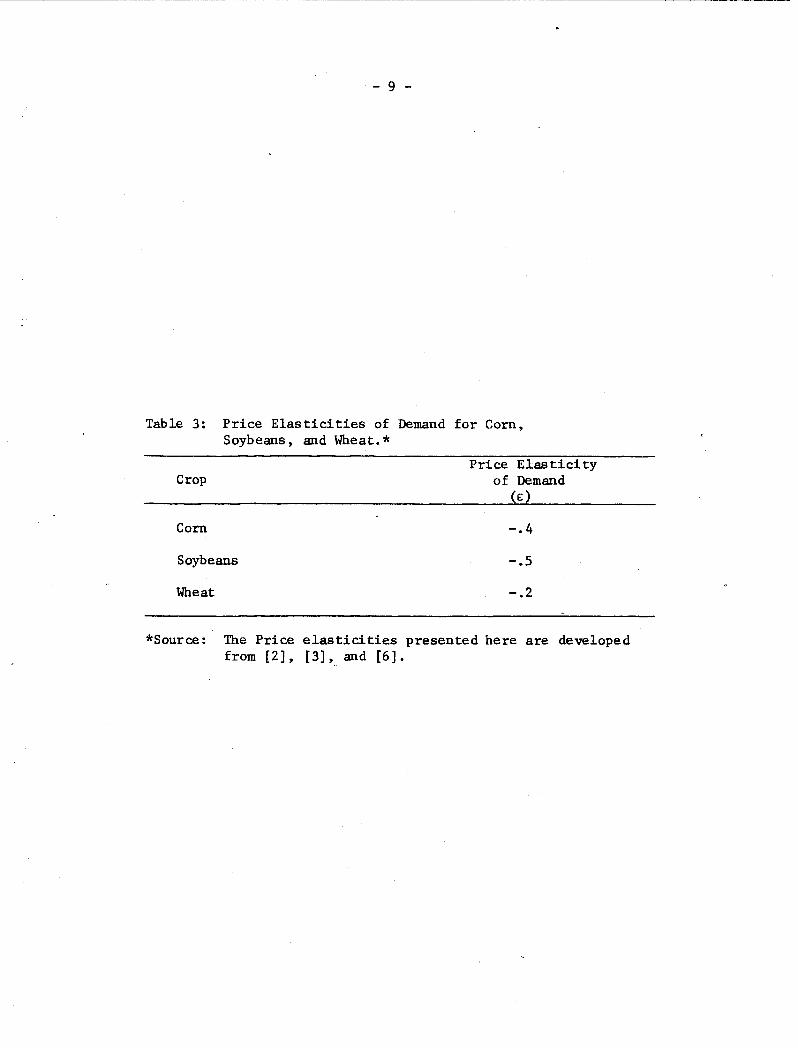
1. The Basic Data: The data used in the computation below and the source of these data are given in Tables 1-3 ..
Table 1 provides total production and average annual price data of three major U.S. crops: Corn, soybeans, and wheat. The mean of the annual total production from 1966 to 1970 and the mean of the unit prices over the same period are used to arrive at the farm value of production (i.e. pq) of the three crops (Table 2) as well as in the computation of social loss (equation (4) above). Further, the price elasticities of demand (i.e. £ used in the computation of social loss are presented in Table 3.
p 2 I
NLSB=e ·pqCiC
S:/lY F;:OtS
2 .
• •
P, t-----"'O':"l.. 8 ~
:J .Q
" Po ~ •
C» 0-. Q)
P2 """-'
CD F Demand Function . G (.) ...
Q.
o _ ql- qo q2 q
Quantity (e.g. Bushels of Corn)
figure 3.
.;
- 7 -
Table 1: Total U.S. Production and Unit Price of Crops: Corn, Soybeans, Wheat (1966-1970).*
. Year
1966
1967
1968
1969 "
**/ 1970--
Average (1966-1970)
Corn
Total Production (Mil. bu.)
4,117
4,760
4,393
4,582
4,110
4,392
Soybeans Wheat
Total Price Production ($/bu.) (Mil. bu.)
1.24 928
1.04 976
1.08 1,103
1.16 1,126
1.34 1,136
1.17 1,054
Total Price Production ($/bu.) (Mil. bu.)
2.75 1,312
2.49 1,522
2.43 1,576
2.35 1,460
2.86 1,378
2.57 1,449
Price ( $/bu.)
1.63
1.39
1.24
1.24
1.36
1.37
*Source: Agricultural Statistics, U. S. Department of Agriculture, 1971.
**/ Preliminary.
- 8 -
Table 2: Farm Value of Production of U.S. Crops: Corn, Soybeans', Wheat (1966-1970 averages). *
Crop
Com'
Soybeans
Wheat
Farm Value (pq) (Mi 1. dollars)
5,139
2,708
1,985
--~----------------~--------------------------------------------Total of Three Crops
*Derived from Table 1.
9,832
- 9 -
Table 3: Price Elasticities of Demand for Corn, Soybeans, and Wheat. *
Price Elas tici ty Crop of Demand
(c:)
Corn -.4
Soybeans -.5
Wheat -.2
*Source: The Price elasticities presented here are developed from [2], [3] '0 and [6].
- 10 -
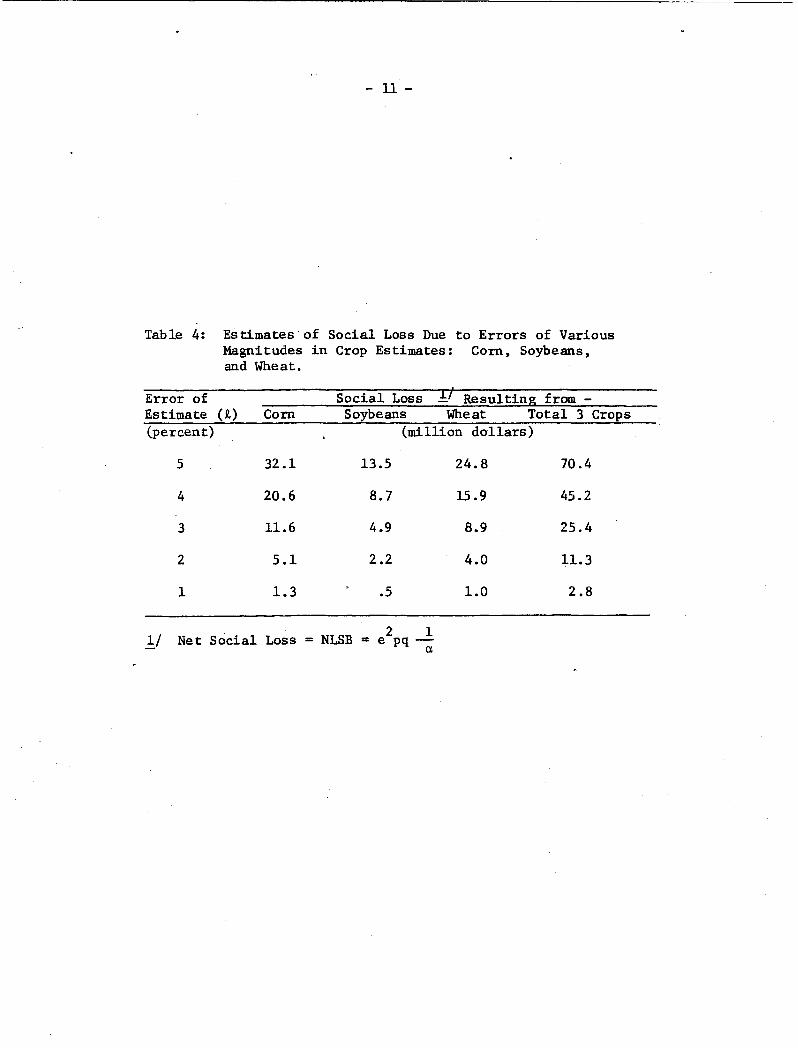
2. The Magnitude of Potential Benefits: The aforementioned data were used to estimate social loss due to errors of varying magnitude in crop estimates. The results of these calculations are tabulated in Table 4. For instance, if the error of crop estimate (i.e. e in equation 4) is five (5) percent, the social loss from corn is estimated at 32.1 million dollars per year; that from soybeans at 13.5 million dollars; that from wheat at 24.8 million dollars. The social loss from the three crops is, thus, 70.4 million dollars per year.
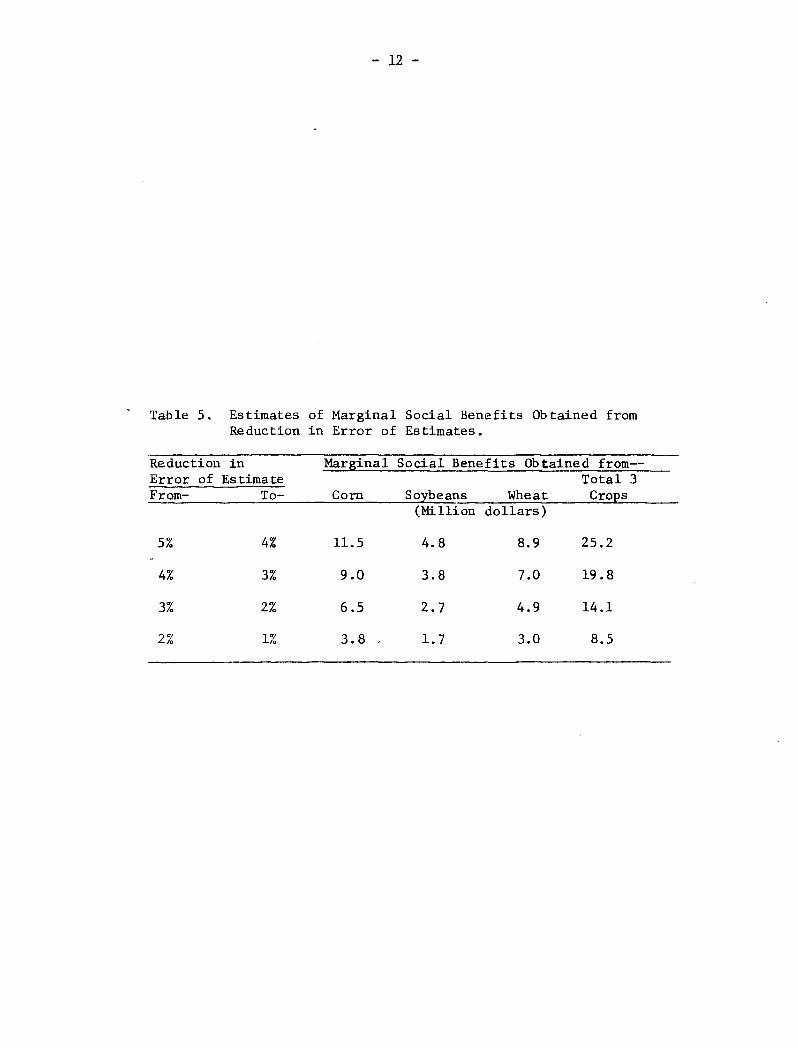
If the error of the crop es timate can be reduced from 5 to 4 percent, the social loss can be reduced from 32.1, 13.5, 24.8, and 70.4 million dollars, respectively, to 20.6, 8.7, 15.9 and 45.2 million dollars annually for the respective crops or group of crops. This reduction in social loss due to improvements in crop estimates can be viewed as the marginal social benefit accruing as a result of the technology which permits the reduction in the error of the crop estimate. Estimates of marginal social benefits occurring from reduction of the crop estimate error from 5 percent to 1 percent (in 1 percent intervals) are presented in Table 5. For example, assume that with existing techniques the error estimate for the three crops considered here is 2 percent. Suppose now that a new technology, such as remote sensing, will be introduced and this will result in a reduction in the error of the crop estimate from 2 to 1 percent. According to the estimates in Table 5, this reduction in the error of the crop estimate will yield marginal social benefits of 8.5 million dollars per year.
It is customary in discussions of this type to cite cost/benefit ratios or to present rates of return to investment. However, in the absence of a specific technique (i.e., a specific, operational remote sensing system) and associated cost functions it is neither possible to compute cost/benefit ratios nor rates of return. We can merely state that, given existing techniques with current crop estimate errors of 2 percent 1/, any new technique which will reduce the error by one percentage point can cost up to 8.5 million dollars more per year than the existing technique 4f before increased costs outweigh estimated marginal social benefits.
3. Reliability of the Es timates of Social Costs and Returns: The above empirical estimates of social returns and marginal social benefits may be unreliable for two reasons and misleading for a third reason.
Given a certain value for the error of estimate, e, the estimates of social loss are a function of the quantity of the crop, q, the price of the crop, p, and the price elasticity of demand, £ ••
While p and q are subject to error, this error is generally considered small
1/ Statistical Reporting Service techniques are currently designed to have an estimation error of about 2 percent for "major crops." Thus, some of the other crop estimates have a smaller error, some have a larger error.
~/ Not considering research investment in technology development.
- 11 -
Table 4: Estimates of Social Loss Due to Errors of Various Magnitudes in Crop Estimates: Corn, Soybeans, and Wheat.
Error of Estimate (R,) Corn (percent)
5 32.1
4 20.6
3 11.6
2 S.l
1 1.3
Net Social Loss
Social Loss ];/ Resulting from -Soybeans Wheat Total 3 Crops
(million dollars)
= NLSB
13.5
8.7
4.9
2.2
.S
2 1 = e pqa
24.8 70.4
15 .9 45.2
8.9 25.4
4.0 11.3
1.0 2.8
- 12 -
Table 5. Estimates of Marginal Social Benefits Ob tained from Reduction in Error of Estimates.
Reduction in Marginal Social Benefits Obtained from--Error of Estimate Total 3 From- To- Corn Soybeans Wheat Crops
(Million dollars)
5% 4% 11.5 4.8 8.9 25.2
4% 3% 9.0 3.8 7.0 19.8
3% 2% 6.5 2.7 4.9 14.1
2% 1% 3.8 . 1,7 3.0 8.5
- 13 -
enough to be negligible. However, econometricians have not yet been successful in computing highly reliable estimates of g. Most econometricians would concede that an error of .25g is a possibility for the elasticities presented in Table 3. In order to test how such an error affects our estimates of social costs and benefits, a sensitivity analysis was performed on the g'S (Table 6). This analysis shows that for extreme values of all g'S, the marginal social benefits derived from an improvement in crop estimate errors from 2 to 1 percent would be 11.6 million dollars (g -.25 g) and 6.8 million dollars (g+.25g) respectively, for the three crops. These results show that the brackets around the "most likely" estimate of 8.5 million dollars (Table 5), are relatively-narrow. However, these brackets are much wider as the error of crop estimates increases. ~/
A second factor which could be detracting from the reliability of the results may be due to inadequacies of the model. Specifically, the model used here assumes the following sequence of events: 'a) Crop estimate (with error, e), (b) adjustment from Po and qo (Figure 3) to PI and ql' (c) becoming available of "true production," (d) adjustment to P2 and q2' This may be a satisfactory approximation to a technique which provi4es crop estimates infrequently. However, with techniques such as remote sensing and automatic data analysis it may be possible to provide frequent estimats. Assuming that successive estimates are relatively
i/ Given the errors of estimate with current techniques (see footnote 3), the relevant ranges are also the narrower ones.
closer to the true output, it could be expected that marginal social benefit increases, since crop estimates may be frequent enough to prevent complete adjustment tOql and Pl' ~/
Third, the results may be misleading because the analysis considers only three crops for the U.S. If additional crops were included in the analysis, and if the analysis was to expanded to the international level, potential marginal benefits will increase substantially.
Finally, it must be emphasized that this analysis in no way permits a statement regarding the relative effectiveness of remote sensing vs. conventional (current) techniques in bringing about the marginal social benefits estimated in Figures 5 and 6.
IV. Some Implications
The foregoing discussion provides justification for a statement of the. following implications:
(1) The basic theoretical models and tools of analysis exist to perform cost/benefit analyses on potential applications of remote sensing. These basic models and tools need further development as well as adaptation to the unique characteristics of remote sensing research and applications. The simple (and in many ways naive) model and procedure presented in the foregoing discussion do not suffice for answering many important questions, such as the following:
6/ A model to account for this situation is currently being constructed, and we expect to have results available late in ]972.
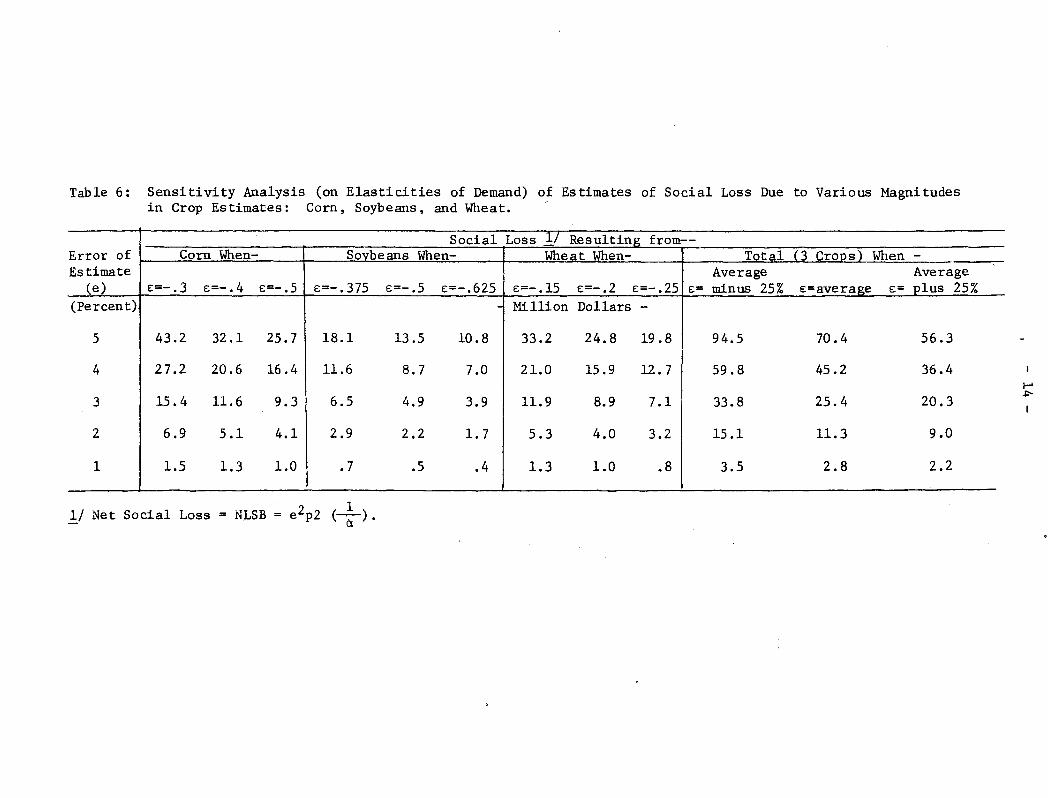
Table 6: Sensitivity Analysis (on Elasticities of Demand) of Estimates of Social Loss Due to Various Magnitudes in Crop Estimates: Corn, Soybeans, and Wheat.
Social Loss ~/ Resulting from--Error of Corn When- Soybeans When- Wheat When- Total i3 Cro~s) When -Estimate Average Average
(e) e:=-.3 e:=-.4 e:=-.5 e:=-.375 e:=-.5 e:=-.625 e:=- .15 e:=-.2 e:=-.25 e:= minus 25% e:=average e:= plus 25% (Percent) - Million Dollars -
5 43.2 32.1 25.7 18.1 13.5 10 .8 33.2 24.8 19.8 94.5 70.4 56.3
4 27.2 20.6 16.4 11.6 8.7 7.0 21.0 15.9 12.7 59.8 45.2 36.4
3 15.4 11.6 9.3 6.5 4.9 3.9 11.9 8.9 7.1 33.8 25.4 20.3
2 6.9 5.1 4.1 2.9 2.2 1.7 5.3 4.0 3.2 15.1 11.3 9.0
1 1.5 1.3 1.0 .7 .5 .4 1.3 1.0 .8 3.5 2.8 2.2 -- - --- - -- --- - - - - ------- - --- ---- - --- ---- --
1/ Net Social Loss = NLSB = e2p2 (-1-). - a
I-' ~
- 15 -
(a) Should further funds for research into advancement of remote sensing technology come from public or private funds? (b) Should operational systems be funded with public or private capital? (c) Should large-scale remote sensing systems be regulated like public utilities? (d) Who are the recipient groups (i.e. producers, processors, cons tuners , etc.) of the total potential social benefits derived from remote sensing applications? (e) Although social benefits from application of remote sensing to areas such as crop es tima tion appear high, should limi ted funds be invested here or in projects which have even higher social returns? What are these projects? etc. Many of these questions cannot be answered on a purely or even primarily economic basis. Thus, the theories, models and studies which are needed have to account for multiple decision criteria, including non-economic ones. In particular, for high level policy decision making it will frequently be more important to know who the recipients of the benefits are-ce.g. farmers, agribusiness, speculators, or the constuner) than what the magni tude of the total benefits is.
(2) Empirical estimates of potential social benefits to the particular application discussed in this paper appear high. However, a more realistic approach to the estimation of social benefits from remote sensing applications will have to recognize that an operational system would, in all likelihood, provide information simultaneously on crop estimates, insect and disease infestation, disaster monitoring, highway construction, land use planning, mineral exploitation, waste management, pollution monitoring, etc. It is currently not known, even in a general sense, what the relative
magnitudes of benefits from the various applications are within an integrated system. Yet, this knowledge would appear to be required before decisions can be made regarding resource commitments for developing various applications and particular forms of integrated systems.
(3) A number of cost/benefit analyses of remote sensing applications do exist. However, few of these can be joined into an integrated system because of differing theoretical bases (if any). different objectives, etc. It appears necessary that future work in this area be done on the basis of a sufficiently comprehensive conceptual model to provide for additivity of research.
(4) This paper has exclusively dealt with social benefits derived from a new technology but not at all with the social costs of this technology. The reason £or this is simple: Empiricalor experimental data are currently not available in usable form to develop the social cost function. 1/ Knowledge of these cost functions is not only necessary to assess cost effectiveness . of remote sensing relative to other techniques and to compute cost/beneH t ratios, but it is also required to ascertain high cost nodes of operational systems and to direct technology research to these nodes.
II The cost and requirements data accumulated as part of the 1971 Corn Blight Watch Experiment are the only such data available to date. These data are currently being analyzed. and results are expected to be available in summer of 1972.
- 16 -
References
[1] Agricultural Statistics, U.S. Department of Agriculture, Washington, D. C., 1971.
[2] Brandow, G. E., Interrelations among Demand for Farm Products and Implications for Control of Market Supply, Pennsylvania State University· Ag. Exp. Sta. Bu1. 680, 1961.
[3] Emerson, Peter M., An Economic Analysis of World Corn Trade. Unpublished Ph.D. Dissertation, Purdue, 1972.
[4] Gri1iches, Z., Research Costs and Social Returns: Hybrid Corn and Related Innovations, Journal of Political Economy, 66, October 1958, pp. 419-431.
[5] Hay ami , Y., and W. Peterson, Social Returns to Puplic Information Services: The Case of Statistical Reporting of U.S. Farm Commodities, American Economic Review, April 1972.
[6] Houck, J. P., and J. S. Mann, An Analysis of Domestic and Foreign Demand for U.S. Soybeans and Soybean Products, University of Minnesota Ag. Exp. Sta. Tech. Bu1. 256, 1968 •
. [7] Hote1ling, H., The General Welfare in Relation to Problems of Taxation
and of Railway Utility Rates, Econometrica, 6, July 1938, pp. 242-269.
[8] Marshall, A., Principles of Economics, Macmillan, London and New York, 9th edition, 1961.


![[REMOTE SENSING] 3-PM Remote Sensing](https://img.pdfslide.net/doc/110x75/61f2bbb282fa78206228d9e2/remote-sensing-3-pm-remote-sensing.jpg)


