Embed Size (px)
Citation preview

Subscriber access provided by CHINESE ACADEMY MED SCI LIB
Journal of Proteome Research is published by the American Chemical Society. 1155Sixteenth Street N.W., Washington, DC 20036Published by American Chemical Society. Copyright © American Chemical Society.However, no copyright claim is made to original U.S. Government works, or worksproduced by employees of any Commonwealth realm Crown government in the courseof their duties.
Article
Metabolomics of Four Biofluids from Dairy Cows:Potential Biomarkers for Milk Production and Quality
Huizeng Sun, Diming Wang, Bing Wang, Jia-kun Wang, Hongyun Liu, Le Luo Guan, and Jianxin LiuJ. Proteome Res., Just Accepted Manuscript • DOI: 10.1021/pr501305g • Publication Date (Web): 19 Jan 2015
Downloaded from http://pubs.acs.org on January 25, 2015
Just Accepted
“Just Accepted” manuscripts have been peer-reviewed and accepted for publication. They are postedonline prior to technical editing, formatting for publication and author proofing. The American ChemicalSociety provides “Just Accepted” as a free service to the research community to expedite thedissemination of scientific material as soon as possible after acceptance. “Just Accepted” manuscriptsappear in full in PDF format accompanied by an HTML abstract. “Just Accepted” manuscripts have beenfully peer reviewed, but should not be considered the official version of record. They are accessible to allreaders and citable by the Digital Object Identifier (DOI®). “Just Accepted” is an optional service offeredto authors. Therefore, the “Just Accepted” Web site may not include all articles that will be publishedin the journal. After a manuscript is technically edited and formatted, it will be removed from the “JustAccepted” Web site and published as an ASAP article. Note that technical editing may introduce minorchanges to the manuscript text and/or graphics which could affect content, and all legal disclaimersand ethical guidelines that apply to the journal pertain. ACS cannot be held responsible for errorsor consequences arising from the use of information contained in these “Just Accepted” manuscripts.

1
Metabolomics of Four Biofluids from Dairy
Cows: Potential Biomarkers for Milk
Production and Quality
Hui-Zeng SunЖ, Di-Ming WangЖ, Bing WangЖ, Jia-Kun WangЖ*, Hong-Yun LiuЖ,
Le Luo GuanЗ, and Jian-Xin LiuЖ*
ЖInstitute of Dairy Science, MoE Key Laboratory of Molecular Animal Nutrition,
College of Animal Sciences, Zhejiang University, Hangzhou 310058, P.R. China
ЗDepartment of Agricultural, Food & Nutritional Science, University of Alberta,
Edmonton, AB, Canada, T6G 2P5
Page 1 of 42
ACS Paragon Plus Environment
Journal of Proteome Research
123456789101112131415161718192021222324252627282930313233343536373839404142434445464748495051525354555657585960

2
ABSTRACT
The fundamental understanding of the mechanisms regulating milk protein synthesis is
limited. This study aimed to elucidate the metabolic mechanisms of milk production
affected by forage quality through studying metabolites from four biofluids (rumen
fluid, milk, serum and urine) collected from 16 lactating cows fed alfalfa hay (AH,
high-quality, n = 8) and corn stover (CS, low-quality, n = 8), respectively, using gas
chromatography-time of flight/mass spectrometry. The cows fed AH exhibited higher
milk yield (P < 0.01), milk protein yield (P = 0.04) and milk efficiency (P < 0.01) than
those fed CS. A total of 165, 195, 218 and 156 metabolites were identified in the
rumen fluid, milk, serum and urine, respectively, while 29 metabolites were found in
all four biofluids. In addition 55, 8, 28 and 31 metabolites in each biofluid,
respectively, were significantly different (VIP > 1 and P < 0.05) between the AH- and
CS-fed animals. These metabolites were involved in glycine, serine and threonine
metabolism; tyrosine metabolism; and phenylalanine metabolism. Further integrated
key metabolic pathway analysis showed that the AH-fed cows may have more
comprehensive amino acid metabolisms, suggesting that these metabolite-associated
pathways may serve as biomarkers for higher milk yield and better milk protein
quality.
KEY WORDS: biofluid, dairy cow, forage, gas chromatography-time flight/mass
spectrometry, metabolic pathway, metabolomics
Page 2 of 42
ACS Paragon Plus Environment
Journal of Proteome Research
123456789101112131415161718192021222324252627282930313233343536373839404142434445464748495051525354555657585960

3
INTRODUCTION
Bovine milk is an important food source for human consumption, and the high
demand for milk due to the human population growth represents a key component of
food security issues. Forage is the most important and variable input in dairy
production,1 and forage quality exerts large effects on the health and productive
performance of dairy cows and the quality of milk.2 To date, most studies have focused
on the improvement of dairy nutritional management strategies to enhance milk
production and quality, whereas the physiological and metabolic mechanisms involved
have not been well examined.
Since the beginning of 21st century, China has become one of the largest dairy
producers in the world due to changes of lifestyle and the shift in dietary structure.
However, a shortage of high-quality forage has led to a bottleneck for the development
of the dairy industry in China. As the corn grain’s by-products, corn stover is one of
the most abundant feed resources in China,3 and it is widely used in many small dairy
operations with low cost. However, the nutritional constraints of corn stover (CS), such
as the lower content of crude protein and easy-to-use carbohydrates when compared to
alfalfa,4 limit its use in modern dairy farms with high productivity. Due to such
limitation, the Chinese dairy industry has largely relied on importing alfalfa, while 80
million tons of CS have been disposed every year.5 Therefore, understanding the
physiological and metabolic mechanisms involved in milk production under
low-quality forage is helpful to developing strategies for reasonable and efficient
utilization of the abundant cereal straw and stover sources in milk production.
Metabolomics is an emerging research area that can quantitatively measure small
molecular metabolites in biological samples (biofluids or tissues) using
high-throughput approaches, such as 1H-nuclear magnetic resonance (NMR) and gas
Page 3 of 42
ACS Paragon Plus Environment
Journal of Proteome Research
123456789101112131415161718192021222324252627282930313233343536373839404142434445464748495051525354555657585960

4
chromatography–mass spectrometry (GC-MS).6,7 The identification and integrative
analysis of these metabolites may enable a comprehensive characterization of
metabolism mechanisms at the molecular and cellular level under internal or external
stimulating conditions. Among the technologies in metabolomics, gas
chromatography-time of flight/mass spectrometry (GC-TOF/MS) has been widely used
due to its high resolution and detection sensitivity.8, 9 However, the information on
metabolomics of dairy cows is limited, and most of metabolomic studies to date in
dairy cows have mainly focused on metabolites in a single biofluid, especially in the
rumen,10-12 milk,13,14 and blood15,16 using NMR and GC-MS. Recent studies have also
shown that proteomics can be a fundamental research tool for better characterization of
milk proteins.17 Future integration of metabolomics and proteomics can better
understand physiological and metabolic mechanisms involved in milk production.
In this study, we aimed to elucidate the metabolic mechanisms regarding how the
quality of forage impacts milk production, especially milk protein yield by studying
the metabolite profiles of various biofluids in dairy cows. GC-TOF/MS-based
metabolomics was performed to investigate the simultaneous responses of four
biofluids (rumen fluid, milk, serum, and urine) to different forage diets to establish the
correlations among the four biofluid metabolisms and to gain insights into the
mechanisms underlying forage quality-related milk production and quality in dairy
cows.
MATERIALS AND METHODS
Animals, Diets and Experimental Design
All experimental procedures involving the use of animals were approved by the
Animal Care Committee, Zhejiang University, Hangzhou, P. R. China. Sixteen
Page 4 of 42
ACS Paragon Plus Environment
Journal of Proteome Research
123456789101112131415161718192021222324252627282930313233343536373839404142434445464748495051525354555657585960
5
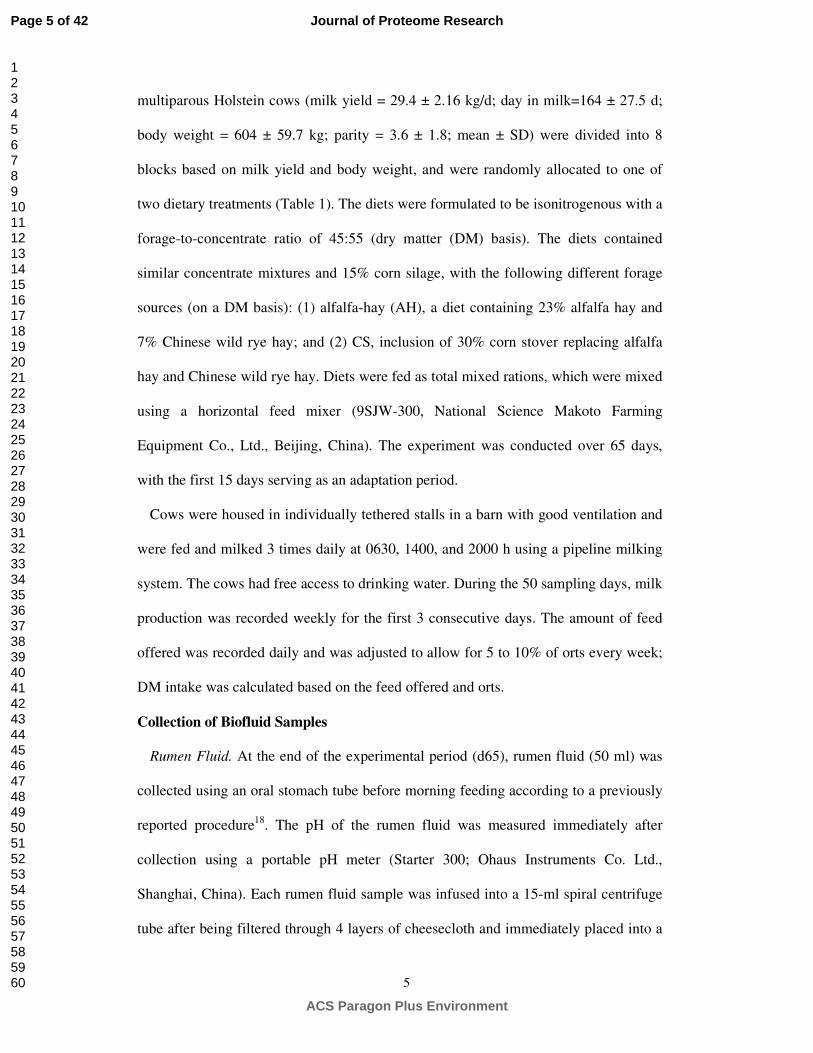
multiparous Holstein cows (milk yield = 29.4 ± 2.16 kg/d; day in milk=164 ± 27.5 d;
body weight = 604 ± 59.7 kg; parity = 3.6 ± 1.8; mean ± SD) were divided into 8
blocks based on milk yield and body weight, and were randomly allocated to one of
two dietary treatments (Table 1). The diets were formulated to be isonitrogenous with a
forage-to-concentrate ratio of 45:55 (dry matter (DM) basis). The diets contained
similar concentrate mixtures and 15% corn silage, with the following different forage
sources (on a DM basis): (1) alfalfa-hay (AH), a diet containing 23% alfalfa hay and
7% Chinese wild rye hay; and (2) CS, inclusion of 30% corn stover replacing alfalfa
hay and Chinese wild rye hay. Diets were fed as total mixed rations, which were mixed
using a horizontal feed mixer (9SJW-300, National Science Makoto Farming
Equipment Co., Ltd., Beijing, China). The experiment was conducted over 65 days,
with the first 15 days serving as an adaptation period.
Cows were housed in individually tethered stalls in a barn with good ventilation and
were fed and milked 3 times daily at 0630, 1400, and 2000 h using a pipeline milking
system. The cows had free access to drinking water. During the 50 sampling days, milk
production was recorded weekly for the first 3 consecutive days. The amount of feed
offered was recorded daily and was adjusted to allow for 5 to 10% of orts every week;
DM intake was calculated based on the feed offered and orts.
Collection of Biofluid Samples
Rumen Fluid. At the end of the experimental period (d65), rumen fluid (50 ml) was
collected using an oral stomach tube before morning feeding according to a previously
reported procedure18. The pH of the rumen fluid was measured immediately after
collection using a portable pH meter (Starter 300; Ohaus Instruments Co. Ltd.,
Shanghai, China). Each rumen fluid sample was infused into a 15-ml spiral centrifuge
tube after being filtered through 4 layers of cheesecloth and immediately placed into a
Page 5 of 42
ACS Paragon Plus Environment
Journal of Proteome Research
123456789101112131415161718192021222324252627282930313233343536373839404142434445464748495051525354555657585960
6
liquid nitrogen container to minimize any possible metabolite degradation. After
thawing, the rumen fluid samples were centrifuged at 4°C, 6,000 × g for 15 min, and
the supernatant was subsequently stored in a 1.5-ml centrifuge tube at -80°C until
further analysis.
Milk. Milk samples were collected using milk sampling devices (Waikato Milking
Systems NZ Ltd., Waikato, Hamilton, New Zealand). One 50-ml aliquot of each milk
sample was collected at the first day of every week in 50 sampling days and was
collected proportional to the yield (4:3:3, composite) in the morning, noon and evening
respectively to be more representative. The composite milk sample, with added
bronopol tablets (milk preservative, D & F Control Systems, San Ramon, CA, USA),
was stored at 4°C for the subsequent infrared analysis of the protein, fat and lactose
(Laporte and Paquin, 1999) using a spectrophotometer (Foss-4000, Foss, Hillerød,
Denmark).
Milk samples used for the metabolomics study were collected in the morning of day
65 with in-line milk meters. The samples were infused into 15-ml spiral centrifuge
tubes and immediately stored in a liquid nitrogen container to minimize any possible
metabolite degradation. After thawing, the milk samples were defatted by
centrifugation at 4°C, 3,000 × g for 15 min, and the skim milk was subsequently stored
in a 1.5-ml centrifuge tube at -80°C until further analysis of metabolites14,15.
Serum. Blood samples (10 ml) were obtained from the jugular vein before rumen
fluid collection using pro-coagulation 10-ml tubes. After collection, serum was
separated by centrifugation at 4°C, 3,000 × g for 15 min within 20 min of sample
collection, and the supernatant (serum) was stored in a 1.5-ml centrifuge tube at -80°C
until further analysis.
Page 6 of 42
ACS Paragon Plus Environment
Journal of Proteome Research
123456789101112131415161718192021222324252627282930313233343536373839404142434445464748495051525354555657585960

7
Urine. Urine samples were collected before feeding in the morning of day 65. Vulval
stimulation was used to induce cows to urinate. Urine samples (10ml) were infused
into 15-ml spiral centrifuge tubes and immediately stored in a liquid nitrogen container
to minimize any possible metabolite degradation. Urine samples were thawed and
subsequently stored in 1.5-ml centrifuge tubes at -80°C until further analysis.
Preparation of Samples for GC-TOF/MS
The samples of rumen fluid, milk and serum were prepared using the following
procedure. First, 350 µl of methanol and 50 µl of L-2-chlorophenylalanine were added
to a 100-µl biofluid sample, mixed by vortexing, and centrifuged at 4°C, 12,000 rpm
for 10 min; 0.35 ml of supernatant was then transferred into a 2-ml silylated vial. After
the extracts were dried using a vacuum concentrator, 80 µl of o-methyl hydroxylamine
hydrochloride was added and mixed gently; the solution was then incubated at 37°C
for 2 h. Subsequently, 100 µl of bis trifluoroacetamide (containing 1% TCMS, v/v)
was added to each sample, followed by incubation at 70°C for 1 h; the samples were
then subjected to detection by GC-TOF/MS.
For the urine sample, 10 µl of urease (160 mg/ml) was firstly added to 100 µl of
urine, and the mixture was then incubated in an oven for 1 h before adding any
chemicals. The later preparation steps were the same as the preparation of the other
three biofluids.
Identification and Quantification of Compounds Discovered by GC-TOF/MS
The retention time (RT) of an internal standard (L-2-chlorobenzene alanine) was
used to test the stability of the sample injection. The GC-TOF/MS was performed
using an Agilent 7890 GC system equipped with a Pegasus 4D TOFMS (LECO, St.
Joseph, MI, USA). The system was installed with a DB-5MS capillary column (30 m ×
250-µm inner diameter, 0.25-µm film thickness) coated with 95%
Page 7 of 42
ACS Paragon Plus Environment
Journal of Proteome Research
123456789101112131415161718192021222324252627282930313233343536373839404142434445464748495051525354555657585960

8
dimethylpolysiloxane cross-linked with 5% diphenyl. The injection of a 1-µl aliquot
was run in splitless mode, with helium as the carrier gas and a front inlet purge flow of
3 ml/min; the gas flow rate was 1 ml/min. The initial temperature of the column was
kept at 80°C for 0.2 min, increased to 180°C at a rate of 10°C/min, to 240°C at a rate
of 5°C/min, and further to 290°C at a rate of 20°C/min; the column was then
maintained for 11 min. The energy was -70 eV in electron impact mode. The
temperatures of injection, transfer line, and ion source were 280°C, 245°C, and 220°C,
respectively. The MS data were acquired at a rate of 100 spectra per second after a
solvent delay of 492 s with a mass-to-charge ratio (m/z) range of 20 to 600 in full-scan
mode.
Data analysis
The Chroma TOF4.3X software (LECO) and LECO-Fiehn Rtx5 database were used
for raw peaks extraction, data baselines filtering and calibration, peak alignment,
deconvolution analysis, peak identification, and integration of the peak area. For all 4
biofluids, a numerical simulation method that fills half of the minimum value was used
to simulate the missing value of the original data. Then, noise removal was conducted
using an interquartile range to filter data, and data were standardized by internal
standard normalization methods. The similarity value obtained from the LECO/Fiehn
Metabolomics Library was used for the evaluation of the accuracy of the
discriminating compound identification. A similarity greater than 700 indicates that the
metabolite identification is reliable. If the similarity is less than 200, the compound is
defined as an “analyte”. The compound with a similarity between 200 and 700 is
considered as a putative annotation.
The matrices which contain the relative concentration of 29 common metabolites
identified in four biofluids were imported into the online analyze platform
Page 8 of 42
ACS Paragon Plus Environment
Journal of Proteome Research
123456789101112131415161718192021222324252627282930313233343536373839404142434445464748495051525354555657585960

9
Metaboanalyst (http://www.metaboanalyst.ca/) to gain mutual results of pathway. The
analysis used bos taurus (cow) pathway library and integrated global test pathway
enrichment analysis and relative-betweeness centrality pathway topology analysis. All
matched pathways according to p values from pathway enrichment analysis and
pathway impact values from pathway topology analysis can be shown in the
metabolome view.
The SIMCA-P+ 13.0 software package (Umetrics, Umea, Sweden) was used for
pattern recognition multivariate analysis, including principal component analysis
(PCA), partial least squares discriminant analysis (PLS-DA), and orthogonal partial
least squares discriminant analysis (OPLS-DA). PCA was used to visualize the dataset
and display the similarity and difference. The PLS-DA model was validated by 7- fold
permutation tests to check its validity. To obtain maximal covariance between the
measured data and the response variable, OPLS-DA was performed. The data scale
conversion mode used in milk and serum samples was Ctr-formatted (Mean-Centered
Scaling) processing, whereas UV-formatted (Unit Variance Scaling) processing was
used in rumen fluid and urine samples.
Data on milk yield, DMI, milk composition, milk efficiency were analyzed using
PROC MIXED of SAS (SAS Institute, 2000). Statistical significance was defined at
P< 0.05, with highly significant values at P < 0.01.
Identification of Significantly Different Metabolites and Pathways between AH and
CS fed animals
As described above, OPLS-DA was used to identify the significantly different
metabolites between the AH and CS groups. To refine this analysis, the variable
importance for the projection (VIP) values along the predictive component were
obtained. The VIP values exceeding 1.0 were firstly selected as changed metabolites.
Page 9 of 42
ACS Paragon Plus Environment
Journal of Proteome Research
123456789101112131415161718192021222324252627282930313233343536373839404142434445464748495051525354555657585960

10
The remaining variables were then assessed using Student's t-test (t-test). If P > 0.05,
variables were discarded between two comparison groups. The fold change (FC) value
of each metabolite was calculated by comparing mean value of peak area obtained
from CS group to that from AH group. Differential metabolites were further identified
and validated by searching the online databases including the Kyoto Encyclopedia of
Genes and Genomes (KEGG), Bovine Metabolome Database (BMDB), PubChem
Compound, Chemical Entities of Biological Interest (ChEBI), Japan Chemical
Substance Dictionary Web (NIKKAJI), and Chemical Abstracts Service (CAS). Each
differential metabolite was then cross listed with the pathways in the KEGG, and the
top altered pathways were identified and finally constructed according to the potential
functional analysis.
RESULTS
Animal Performance Measurement
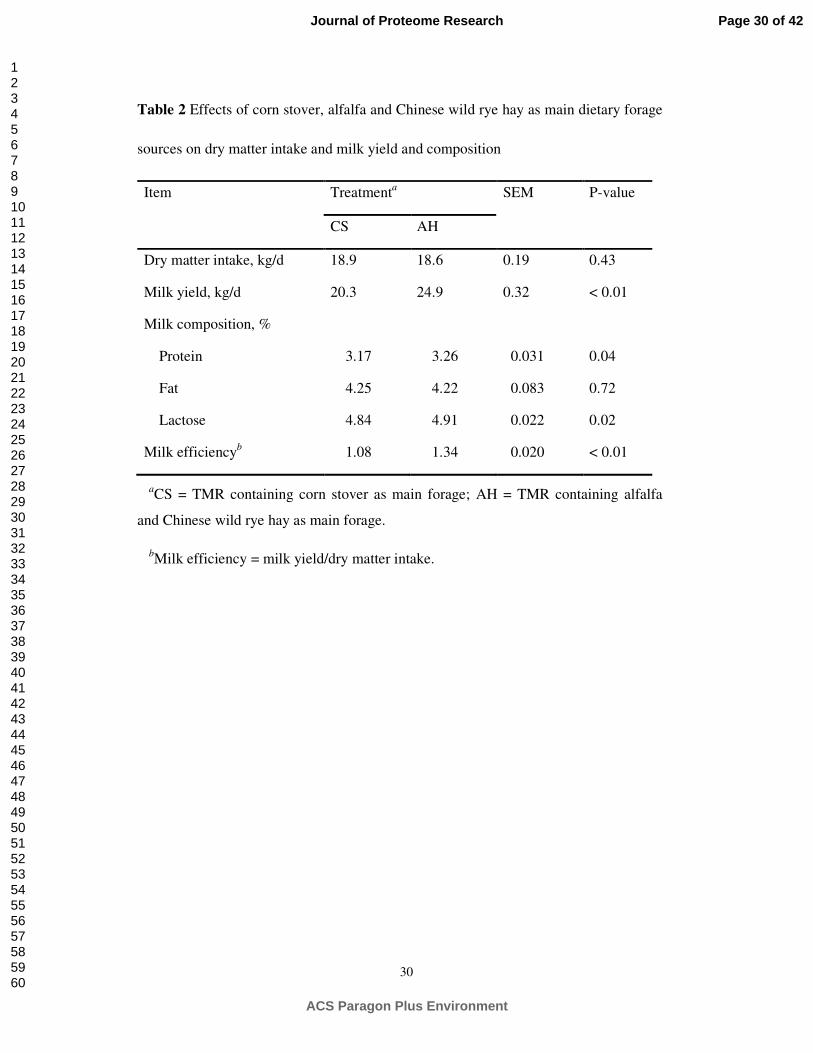
The animal performance-related features of feed intake, milk yield and composition
are presented in Table 2. The DM intake of diet did not differ (P = 0.43) between the
CS and AH diets, with an average of 18.7 kg/d. The milk yield in AH-fed cows was
higher than in CS-fed (P < 0.01) animals, resulting in higher milk efficiency (milk
yield/DM intake) for the AH group (P < 0.01). The milk protein content was also
higher (P = 0.04) for cows fed AH compared with those fed CS. The dietary treatments
did not have a significant effect on the milk fat content (P = 0.72), but the lactose
content was different between the two diets (P = 0.02).
Identification and Quantification of GC-MS Compounds
The GC-TOF/MS TIC chromatograms of four fluids from cows fed CS and AH diets
are shown in Figure 1. There were various differences in the shape and quantity of
Page 10 of 42
ACS Paragon Plus Environment
Journal of Proteome Research
123456789101112131415161718192021222324252627282930313233343536373839404142434445464748495051525354555657585960

11
peaks among the four biofluids, with unique peaks in each biofluid. In total, 268, 325,
319 and 251 valid peaks were identified in the rumen fluid, milk, serum and urine,
respectively. However, a clear discrimination in the abundance of typical peaks
(highlighted by arrows) was also observed between the CS and AH diets for each
biofluid (Figure 1). Thus, these TIC chromatograms identified by GC-TOF/MS could
directly reflect the difference in metabolite profiles among the four biofluids and
between the two diets within each biofluid.
Based on LECO/Fiehn Metabolomics Library, the majority of the peaks were
endogenous metabolites, and some of these peaks may be attributed to the derivatives
of byproducts. In total, 165, 195, 218, and 156 metabolites were quantified in the
rumen fluid, milk, serum, urine, of which 46, 56, 61, and 41 metabolites were unique
to each corresponding biofluid, respectively (Figure 2). The metabolites such as
2,4-diamino butyric acid, 4-aminobutyric acid, cellobiose and 43 others that were
produced by rumen fermentation were only detected in the rumen fluid, whereas
metabolites produced by the synthesis or degradation of milk composition, including
orotic acid, galactose, Thr, linoleic acid and 52 other metabolites, were only identified
in the milk. Metabolites such as cholesterol, 21-hydroxypregnenolone, cortexolone and
synephrine and 57 other metabolites were only detected in the serum, and hippuric
acid, allantoic acid and 38 other compounds were only identified in the urine. In
addition, 29 common metabolites were identified in all four biofluids, while 55 were
common in the rumen, milk and serum; 38 in the rumen fluid, milk, and urine; 41 in
the rumen fluid, serum, and urine; and 52 in the milk, serum, and urine. The numbers
of metabolites that were identified in any two biofluids were also illustrated in Figure
2. The detailed information of all the identified metabolites in four biofluids are
provided in the Supporting Information (Table S1).
Page 11 of 42
ACS Paragon Plus Environment
Journal of Proteome Research
123456789101112131415161718192021222324252627282930313233343536373839404142434445464748495051525354555657585960

12
Metabolic Pathway of Common Metabolites
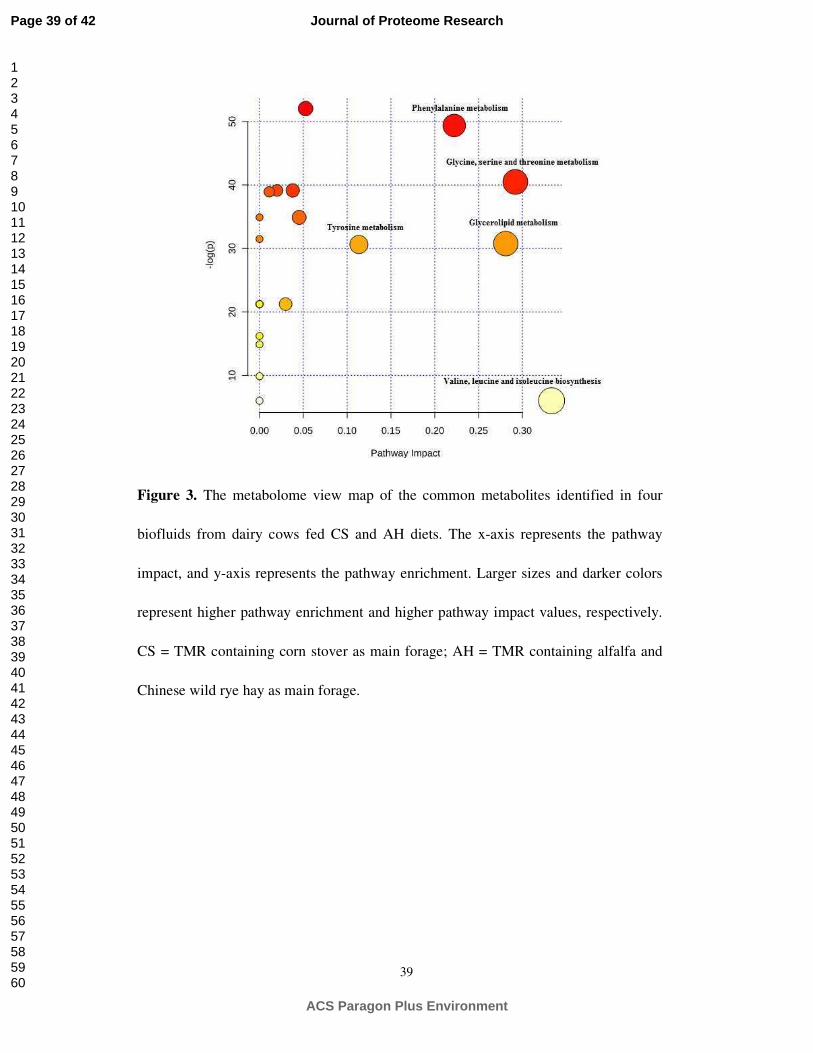
As shown in Figure 3, the metabolome view map revealed that the enriched
pathways (p < 0.05) for 29 metabolites identified in all four biofluids were galactose
metabolism, Phe metabolism, Gly, Ser and Thr metabolism, starch and sucrose
metabolism, glutathione metabolism, arginine and proline metabolism, citrate cycle,
glycerolipid metabolism, Tyr metabolism, primary bile acid biosynthesis, valine,
leucine and isoleucine biosynthesis. However, only 5 of them had pathway’s impact
value higher than 0.1, which is the cut-off value for the relevance. The impact value of
valine, leucine and isoleucine biosynthesis, Gly, Ser and Thr metabolism, glycerolipid
metabolism, Phe metabolism, and Tyr metabolism were 0.33, 0.29, 0.28, 0.22 and 0.11
respectively. Based on both p value and impact value, Gly, Ser and Thr metabolism,
glycerolipid metabolism, Phe metabolism and Tyr metabolism were characterized as
the significantly relevant pathways. The metabolites involved in three of them were
involved in amino acid metabolism.
Statistical Comparison of Metabolites in Biofluids between Two Diets
The PCA analysis of GC-TOF/MS metabolic profiles of four biofluids showed
significantly separated clusters between the AH and CS groups in each 3D-PCA score
plot (Figure 4 A, D, G and J). The R2X values of PCA model that represent explained
variance in rumen fluid, milk, serum, and urine were 0.707, 0.785, 0.530, and 0.825,
respectively. All the samples in the score plots of the four biofluids were within the
95% Hotelling T2 ellipse. The parameters for the assessment of the PLS-DA model
quality in discriminating CS and AS diets in the different biofluids could be
represented by the validation plots, as shown in Figure 4 B, E, H and K. The
corresponding Q2Y value of PLS-DA models in rumen fluid, milk, serum, and urine
were 0.899, 0.967, 0.982, and 0.899, respectively. The permutation tests of the four
Page 12 of 42
ACS Paragon Plus Environment
Journal of Proteome Research
123456789101112131415161718192021222324252627282930313233343536373839404142434445464748495051525354555657585960

13
biofluids were all in a better range with the R2Y values of the four biofluids all greater
than 0.899, indicating a satisfactory effectiveness of the model.
Figures 4 C, F, I and L display the OPLS-DA results of the rumen fluid, milk, serum
and urine from the two dietary treatments, respectively. All the samples in the score
plots of the rumen fluid, milk, and serum were inside the 95% Hotelling T2 ellipse,
whereas only one sample of urine was not inside the ellipse. Clear separation and
discrimination were found between the CS and AH diets, indicating that the OPLS-DA
model can be used to identify the difference between the two diets.
Significantly Different Metabolites and Key Different Metabolic Pathways between
the Two Diets
In total, 55, 28, 31 and 8 significantly different metabolites (VIP > 1 and P < 0.05)
were identified in the rumen fluid, serum, urine and milk, respectively, between the CS
and AH diets (Table 3). The fold-change (FC) value was used to indicate the specific
variable quantity in the CS diet compared with the AH diet. As shown in Table 3, out
of the 55 significantly different metabolites in rumen fluid, 49 had higher
concentrations in the AH-fed animals than in the CS-fed animals, with 15 metabolites
belonging to amino acids, peptides and analogues including methionine (FC=0.546),
lysine (FC=0.508), alanine (FC=0.417), norleucine (FC=0.127), phenylalanine
(FC=0.540), glutamic acid (FC=0.403), citrulline (FC=0.213), L-allothreonine
(FC=0.581), aspartic acid (FC=0.296), 5-aminovaleric acid (FC=0.458), aminomalonic
acid (FC=0.130); 6 carbohydrates metabolites and other 12 organic acids and
derivatives like malonic acid, azelaic acid, adipic acid, pimelic acid, etc. For 31
significantly different metabolites in urine including aromatic compounds, amino
acids, peptides and analogues, carbohydrates, and lipids, 22 metabolites were found at
higher concentrations in the CS-fed animals than in the AH-fed animals. In milk, 5
Page 13 of 42
ACS Paragon Plus Environment
Journal of Proteome Research
123456789101112131415161718192021222324252627282930313233343536373839404142434445464748495051525354555657585960

14
metabolites were found at higher concentrations in the AH-fed animals than in the
CS-fed animals among the 8 significantly different metabolites. Among the 28
significantly different metabolites in serum, 19 metabolites including aromatic
compounds, lipids, amino acids and carbohydrates were found at higher concentrations
in the CS-fed animals than in the AH-fed animals. Furthermore, the KEGG pathway
analysis of identified significantly different metabolites from four biofluids identified
that glycine (Gly), serine (Ser) and threonine (Thr) metabolism was the only one key
different metabolic pathway in all four biofluids between two diets, while tyrosine
(Tyr) and phenylalanine (Phe) metabolism was the key different metabolic pathways in
the rumen fluid, serum and urine (Table 4) between AH and CS.
Integrated Key Different Metabolic Pathways
The integrated key metabolic pathways were manually linked together based on the
results of common key different metabolic pathways from four biofluids and the
significantly changed pathways from common metabolites in four biofluids. Three key
metabolic pathways were displayed in Figure 5 including Gly, Ser and Thr
metabolism; Tyr metabolism; and Phe metabolism with 19 significantly different or
mutual metabolites in the four biofluids and the related key metabolic enzymes in each
pathway.
DISCUSSION
As an emerging technological and analytical approach, metabolomics has been used
to study metabolites in fluids or tissues19 and to understand the biosystem’s
physiological and biochemical status with further interpretation of the biological
principles.20 Although NMR-based metabolomics has been widely used because of its
easy preparation of samples and low cost, MS-based metabolomics is more sensitive in
Page 14 of 42
ACS Paragon Plus Environment
Journal of Proteome Research
123456789101112131415161718192021222324252627282930313233343536373839404142434445464748495051525354555657585960

15
detecting low-abundance metabolites.21 In this study, GC-TOF/MS based
metabolomics was used to compare the metabolites and to detect their changes in the
rumen, serum, urine and milks from dairy cows under two types of forage with
different quality, aiming to discover potential biomarkers for milk quality. This is the
first study to profile the metabolites of four different biofluids simultaneously. The
unique compounds identified in each of the four biofluids are in line with traditional
biochemical results and represent the typical characteristics of the four different
biofluids in dairy cows.22-24
The GC-TOF/MS based metabolomics approach enhanced the detection of
metabolites in dairy cows comparing to previous studies. In ruminants, the rumen is an
important organ where microbes ferment the plant materials to nutrients that can be
absorbed by the host. The metabolites in rumen fluid mainly contain the degraded feed
compositions such as amino acids, sugars and organic acids.25 Traditional method used
in animal nutrition studies can identify rumen metabolites including common amino
acids, short-chain fatty acids, organic acids, purine, and pyrimidine.22 Previous studies
identified 46 rumen metabolites by 1H-NMR11; and 256 rumen metabolites by used
multiple metabolomics platforms and technologies (combined NMR, inductively
coupled plasma mass spectroscopy (ICP-MS), gas chromatography-mass spectrometry
(GC-MS), direct flow injection (DFI) mass spectrometry and lipidomics with
computer-aided literature)13. Comparing to these studies, we identified 165 compounds
in the rumen fluid by GC-TOF/MS, the only one platform which identified secondary
metabolites and metabolic intermediates such as dihydroxyacetone,
3-hydroxyphenylacetic acid, and 5-aminovaleric acid that have not been reported from
previous studies. This suggests that GC-TOF/MS based metabolomics can detect
low-molecular-weight metabolites and their intermediates and provide more
Page 15 of 42
ACS Paragon Plus Environment
Journal of Proteome Research
123456789101112131415161718192021222324252627282930313233343536373839404142434445464748495051525354555657585960

16
information on rumen metabolisms. Moreover, we identified 195 compounds in the
milk by GC-TOF/MS. Comparing to 23 and 44 milk metabolites detected by NMR15
and GC-MS14, respectively; and to 120 milk metabolites reported by Boudonck et al.26
who used LC/MS/MS, higher number of metabolites identified in this study provides
evidence that the combination of TOF with GC-MS increases the extent of detection
and identification, which enhances the qualitative identification of metabolites. Our
results also clearly showed that the metabolites in each of the four biofluids were
different when cows were fed with different types of forage. In the rumen, 40 out of 55
significantly different metabolites had higher concentration including amino acids,
peptides and analogues as well as carbohydrates in AH-fed cows. These amino acids
and peptides can be used as substrates for synthesizing MCP, while carbohydrates can
provide energy for synthesizing MCP27. These suggest that cows may obtain more
nutrients from AH than from CS to produce more MCP.
It has been shown in many studies that metabolomics is a useful tool for elucidating
how diets under dietary intervention affect the urine metabolite profile.28-30 Based on
the current study, 71% of the significantly different metabolites in the urine were
higher for the CS group than the AH group. Most metabolites in the urine are end
metabolic products or metabolic wastes that are useless for the animal body. For
example, urea (6.84 fold higher in CS group) is an end product of protein catabolism
and constitutes about half of the total urinary solids, which has no physiological
function and is essentially a waste product. Among the 31 significantly different
metabolites, 16 metabolites represented the ineffectively-used nutrients including
amino acids, carbohydrates and lipids. In addition, aromatic compounds were
derivative or byproduct of aromatic amino acid such as 4-hydroxyphenylacetic acid
(2.85 fold higher in CS group) is a metabolite of tyrosine.31 Benzoic acid is the
Page 16 of 42
ACS Paragon Plus Environment
Journal of Proteome Research
123456789101112131415161718192021222324252627282930313233343536373839404142434445464748495051525354555657585960

17
simplest aromatic carboxylic acid and a byproduct of phenylalanine metabolism, most
often conjugated to glycine in the liver and excreted as hippuric acid. Higher
concentration of this product in CS-group (3.07 fold) suggests that less utilization of
glycine and more utilization of phenylalanine Overall, the higher concentration of
metabolites in the urine indicated that more metabolic wastes or ineffectively-used
nutrients were excreted when cows were fed the CS diet. These results are in
agreement with phenotype measures such as lower milk performance (Table 2) and
nutrient digestibility and lower feed efficiency in CS-fed animals.
The milk protein secretion in dairy cows is closely associated with the supply of
metabolizable protein that is derived from microbial protein and undegraded dietary
protein in the rumen.27 Urine metabolites such as purine derivatives have been used to
estimate microbial protein synthesis in the rumen.32 Microbial nucleic acids leave the
rumen and flow to the small intestine with extensive digestion so that purine
nucleotides are hydrolyzed into purine nucleoside.33 Purine nucleoside can be absorbed
from the intestinal lumen, degraded in the liver and finally excreted in the urine as their
derivatives. A strong correlation has been observed between allantoin and purine
metabolites in urine34. Allantoic acid is also a byproduct of purine metabolism and is a
direct intermediate compound that links allantoin to urea (KEGG map 00230). In this
study, allantoic acid was identified at the retention time of 31.85 min with a similarity
of 865 according to the LECO/Fiehn metabolomics library. Allantoic acid was
characterized as a significantly different urinary metabolite between the CS and AH
groups (VIP = 1.12, P = 0.048) with 402% higher in CS, further indicating the
mechanisms led to high urea, possibly low microbial protein yield in CS group. This
may partially explain the variation in terms of milk protein yield between CS and AH
groups. In addition, a negative relationship existed between allantoin and nitrogen
Page 17 of 42
ACS Paragon Plus Environment
Journal of Proteome Research
123456789101112131415161718192021222324252627282930313233343536373839404142434445464748495051525354555657585960

18
efficiency in the present study. These further reveals the potential mechanisms led to
low nitrogen efficiency when cows fed with CS.
In other studies, several common metabolites such as non-esterified fatty acid,
β-hydroxybutyric acid, triglyceride, glucose, and insulin were identified from serum
and characterized by indicators of lipomobilization and hepatic function in
high-yielding dairy cows.35 More small-molecule metabolites were detected in the
serum from this study, 19 out of 28 significantly different metabolites, such as
synephrine, cortexolone, and pyridoxine, were higher for the AH group than for CS,
indicating that cows in the AH group had higher levels of hormones, which may lead
to better fertility. 36
Current study not only detected the different metabolites between AH- and CS- diet,
but also pinpointed the pathways that these metabolites are involved in. Based on
metabolic pathway analysis, Gly, Ser and Thr metabolism; Tyr metabolism; and Phe
metabolism were the key different metabolic pathways identified from the four
biofluids which may also be the most important pathways associated with metabolic
changes in these biofluids of cows fed the CS diet. Key differences in the
metabolisms in the four biofluids revealed the comprehensive and essential metabolic
changes, as shown by the integrated pathways when cows were fed low-quality forage.
In the cows fed the CS diet, Gly, Ser and Thr metabolism was altered, as indicated by
increased 1,3-diaminopropane and decreased L-aspartic acid, glycocyamine and
L-allothreonine in rumen fluid; decreased serum glycocyamine; and increased milk
creatine and urine glycerate. Gly is the simplest amino acid and a basic nutrient. As
part of endogenous antioxidant glutathione, Gly is semi-essential amino acid. It has
been reported that Gly plays an important role in ischemia reperfusion injury, oxygen
stress, cell membrane injury, arthritis, liver fibrosis, tumor metastasis, and other
Page 18 of 42
ACS Paragon Plus Environment
Journal of Proteome Research
123456789101112131415161718192021222324252627282930313233343536373839404142434445464748495051525354555657585960

19
processes.37 The consumption of Gly had a close relationship with the proliferation rate
of cancer cells.38 The decreased Gly in milk under CS diet suggests that maybe fewer
mammary gland cells are needed to repair the cell damage for alfalfa-fed cows.39
Although glycine was not significantly different between two diets, the concentration
of glycine tended to be lower in rumen fluid (P =0.064), milk (P=0.054), serum
(P=0.072) and urine (P=0.092), respectively in CS animals than that in AH group.
Therefore, we speculate that the glycine pathway was affect by the CS, and the
variation of other significantly different metabolites in the pathway may affected by
glycine. In addition, the higher concentration of Gly in rumen fluid (FC=1.64), milk
(FC=17.4), serum (FC=1.09) and serum (FC=1.23), respectively, in AH may lead to
more glycocyamine (286 fold higher in AH group in rumen fluid and 2.38 fold higher
in AH group in serum), which is a metabolite in the urea cycle and metabolism of
amino groups, and a precursor of creatine as an essential substrate for muscle energy
metabolism.40 L-allothreonine (1.72 fold higher in AH group in rumen) can be directly
generated through Gly and is also the substrate of Ser hydroxymethyl transferase, a
coenzyme that catalyzes the invertible interaction of Gly and Ser.41 Glyceric acid (2.20
fold higher in CS group in urine) is usually obtained from the oxidation of glycerol and
is mediated in the transfer of glucose carbon to Ser in cows.42 When glyceric acid is
secreted excessively in the urine, the animal body may suffer from D-glyceric aciduria
and D-glycerate anemia, resulting in metabolic acidosis, progressive neurological
impairment, seizures, hypotonia, and other adverse effects.43 These findings suggest
that feeding low-quality forage to cows not only leads to low yield and quality milk
production but may also lead to poor health.
Based on the integrated key metabolic pathway analysis of the 29 mutual
metabolites of the four biofluids (Figure 5), Tyr metabolism and Phe metabolism can
Page 19 of 42
ACS Paragon Plus Environment
Journal of Proteome Research
123456789101112131415161718192021222324252627282930313233343536373839404142434445464748495051525354555657585960

20
be associated with each other through several metabolites (Figure 5). Phe is an
essential amino acid and the precursor of catecholamines, which are neurotransmitters
and adrenalin-like substances.44 Hyperactivity and developmental problems in
children45 have been reported to be associated with a genetic error in Phe metabolism
that is associated with phenylketonurics. Phe is the precursor of Tyr and usually
converts to Tyr through Phe hydroxylase and biopterin cofactor.46 Tyr is an important
amino acid in many proteins, peptides and even enkephalins and is also the precursor
for hormones such as thyroid and catecholestrogens.47 As is well known, liver is the
important amino acid metabolic pool and the vital place for most amino acid except
branched chain amino acid decomposition and utilization for dairy cow.48 The
concentrations of Phe and Tyr in rumen fluid exhibited lower FC values (0.54 and 1.19,
respectively) than those in the serum (1.01 and 1.34, respectively). Therefore, Phe and
Tyr may be utilized more in the liver in the AF-fed cows than in the animals fed CS.
Compared with the rumen fluid and serum, the higher FC value (FC = 2.84) of Tyr in
the urine of the CS-fed cows indicates that Tyr was not used efficiently. It is likely that
this finding represents the main difference in amino acid metabolism in the liver
between the two dietary treatments.
CONCLUSIONS
In summary, by using the GC-TOF/MS, metabolomics profiling of the rumen fluid,
milk, serum and urine from lactating dairy cows fed AH or CS diets indicated
significant changes in the metabolites and metabolic pathways between two nutritional
conditions. Most metabolites decreased in the rumen fluid and increased in the urine
when the cows were fed with the low-quality CS forage, indicating higher N loss and
low N utilization efficiency when low quality of forage was fed. The variable
Page 20 of 42
ACS Paragon Plus Environment
Journal of Proteome Research
123456789101112131415161718192021222324252627282930313233343536373839404142434445464748495051525354555657585960

21
metabolic pathways were closely related to the improvement of milk performance,
especially Gly, Ser and Thr metabolism; Tyr metabolism; and Phe metabolism. The
results from the present study provide further insights into the mechanism at a
metabolomics level that can partially explain the variation of milk production in dairy
cows under different quality of forages, providing a better understanding of the use of
CS. The identified differential metabolites and related pathways may serve as potential
biomarkers for milk yield and quality, which are essential to develop strategies for
better utilization of CS and other low quality forages to improve milk production and
quality in China.
ASSOCIATED CONTENT
Supporting Information Available:
Table S1. Information of identified metabolites. This material is available free of
charge via the Internet at http://pubs.acs.org.
AUTHOR INFORMATION
* Co-Corresponding Authors
Phone & fax: +86-571-88982389. E-mail: [email protected];
Phone & fax: +86 571 88982097. E-mail: [email protected]
Notes
The authors declare no competing financial interests.
ACKNOWLEDGMENTS
This research was supported by grants from the National Basic Research Program of
the China Ministry of Science and Technology (No. 2011CB100801) and from the
National Natural Science Foundation of China (No. 31472121). The authors gratefully
thank the personnel of Hangjiang Dairy Farm (Hangzhou, China) for their assistance in
Page 21 of 42
ACS Paragon Plus Environment
Journal of Proteome Research
123456789101112131415161718192021222324252627282930313233343536373839404142434445464748495051525354555657585960

22
the feeding and care of the animals. We are grateful to Mr. Junliang Deng (Biotree
Biotech Co., Ltd., Shanghai, China) for providing helps in data analysis. We also
acknowledge the members of the Institute of Dairy Science at Zhejiang University
(Hangzhou, China) for their assistance in the sampling and analysis of the samples.
REFERENCES
(1) Kendall, C.; Leonardi, C.; Hoffman, P.; Combs, D. Intake and milk production of
cows fed diets that differed in dietary neutral detergent fiber and neutral detergent fiber
digestibility. J. Dairy Sci. 2009, 92(1), 313-323.
(2) Weiss, W. P.; St-Pierre, N. R.; Willett, L. B. Varying type of forage,
concentration of metabolizable protein, and source of carbohydrate affects nutrient
digestibility and production by dairy cows. J. Dairy Sci. 2009, 92(11), 5595-5606.
(3) Jin, Q.; Zhang, H.; Yan, L.; Qu, L.; Huang, H. Kinetic characterization for
hemicellulose hydrolysis of corn stover in a dilute acid cycle spray flow-through
reactor at moderate conditions. Biomass Bioenergy 2011, 35(10), 4158-4164.
(4) Wang, L.; Shahbazi, A.; Hanna, M. A. Characterization of corn stover, distiller
grains and cattle manure for thermochemical conversion. Biomass Bioenergy 2011,
35(1), 171-178.
(5) Lv K. Y.; Qiu H. G.; Bai J. F.; Xu Z. G. Development of direct return of corn
stalk to soil: current status, driving forces and constraints. China Popul. Res. Envir.
2013, 23(3), 171-176.
(6) Nicholson, J. K.; Lindon, J. C. Systems biology: metabonomics. Nature 2008,
455(7216), 1054-1056.
Page 22 of 42
ACS Paragon Plus Environment
Journal of Proteome Research
123456789101112131415161718192021222324252627282930313233343536373839404142434445464748495051525354555657585960

23
(7) He, Q.; Kong, X.; Wu, G.; Ren, P.; Tang, H.; Hao, F.; Huang, R.; Li, T.; Tan, B.;
Li, P. Metabolomic analysis of the response of growing pigs to dietary L-arginine
supplementation. Amino Acids 2009, 37(1), 199-208.
(8) Lindon, J. C.; Holmes, E.; Nicholson, J. K. Metabonomics techniques and
applications to pharmaceutical research & development. Pharmac. Res. 2006, 23(6),
1075-1088.
(9) Oliver, M. J.; Guo, L.; Alexander, D. C.; Ryals, J. A.; Wone, B. W.; Cushman, J.
C. A sister group contrast using untargeted global metabolomic analysis delineates the
biochemical regulation underlying desiccation tolerance in Sporobolus stapfianus.
Plant Cell 2011, 23(4), 1231-1248.
(10) Ametaj, B. N.; Zebeli, Q.; Saleem, F.; Psychogios, N.; Lewis, M. J.; Dunn, S.
M.; Xia, J.; Wishart, D. S. Metabolomics reveals unhealthy alterations in rumen
metabolism with increased proportion of cereal grain in the diet of dairy cows.
Metabolomics 2010, 6(4), 583-594.
(11) Saleem, F.; Ametaj, B. N.; Bouatra, S.; Mandal, R.; Zebeli, Q.; Dunn, S. M.;
Wishart, D. S. A metabolomics approach to uncover the effects of grain diets on rumen
health in dairy cows. J. Dairy Sci. 2012, 95(11), 6606-6623.
(12) Saleem, F.; Bouatra, S.; Guo, A. C.; Psychogios, N.; Mandal, R.; Dunn, S. M.;
Ametaj, B. N.; Wishart, D. S. The bovine ruminal fluid metabolome. Metabolomics
2013, 9(2), 360-378.
(13) Klein, M. S.; Buttchereit, N.; Miemczyk, S. P.; Immervoll, A.-K.; Louis, C.;
Wiedemann, S.; Junge, W.; Thaller, G.; Oefner, P. J.; Gronwald, W. NMR
metabolomic analysis of dairy cows reveals milk glycerophosphocholine to
phosphocholine ratio as prognostic biomarker for risk of ketosis. J. Proteome Res.
2011, 11(2), 1373-1381.
Page 23 of 42
ACS Paragon Plus Environment
Journal of Proteome Research
123456789101112131415161718192021222324252627282930313233343536373839404142434445464748495051525354555657585960

24
(14) Sundekilde, U. K.; Gustavsson, F.; Poulsen, N. A.; Glantz, M.; Paulsson, M.;
Larsen L. B.; Bertram H. C. Association between the bovine milk metabolome and
rennet-induced coagulation properties of milk. J. Dairy Sci. 2014, 97(10), 6076-6084.
(15) Hailemariam, D.; Mandal, R.; Saleem, F.; Dunn, S.M.; Wishart, D.S.; Ametaj,
B.N. Identification of predictive biomarkers of disease state in transition dairy cows. J.
Dairy Sci. 2014, 97(5), 2680-2693.
(16) Sun, L.W.; Zhang, H.Y.; Wu, L.; Shu, S.; Xia, C.; Xu, C.; Zheng, J.S.
1H-Nuclear magnetic resonance-based plasma metabolic profiling of dairy cows with
clinical and subclinical ketosis. J. Dairy Sci. 2014, 97(3), 1552-1562.
(17) Roncadaa, P.; Pirasb, C.; Soggiuc, A.; Turkd, R.; Urbanie, A.; Bonizzic, L.
Farm animal milk proteomics. J. Proteomics 2012, 75(14), 4259- 4274.
(18) Imhasly, S.; Naegeli, H.; Baumann, H.; Bergen, M.; Luch, A.; Jungnicke, H.;
Potratz, S.; Gerspach, C. Metabolomic biomarkers correlating with hepatic lipidosis in
dairy cows. BMC Vet. Res. 2014, 10, 122.
(19) Psychogios, N.; Hau, D. D.; Peng, J.; Guo, A. C.; Mandal, R.; Bouatra, S.;
Sinelnikov, I.; Krishnamurthy, R.; Eisner, R.; Gautam, B. The human serum
metabolome. PLoS One 2011, 6(2), e16957.
(20) Zhao, S.; Zhao, J.; Bu, D.; Sun, P.; Wang, J.; Dong, Z. Metabolomics analysis
reveals large effect of roughage types on rumen microbial metabolic profile in dairy
cows. Lett. Appl. Microbiol. 2014, 59(1), 79-85.
(21) Scano, P; Murgia, A; Pirisi, F. M.; Caboni, P. A gas chromatography-mass
spectrometry-based metabolomic approach for the characterization of goat milk
compared with cow milk. J. Dairy Sci. 2014, 97(10), 6057-6066.
Page 24 of 42
ACS Paragon Plus Environment
Journal of Proteome Research
123456789101112131415161718192021222324252627282930313233343536373839404142434445464748495051525354555657585960

25
(22) Folman, Y.; Neumark, H.; Kaim, M.; Kaufmann, W. Performance, rumen and
blood metabolites in high-yielding cows fed varying protein percents and protected
soybean. J. Dairy Sci. 1981, 64(5), 759-768.
(23) MacIntosh, D. L.; Needham, L. L.; Hammerstrom, K. A.; Ryan, P. B.
Longitudinal investigation of selected pesticide metabolites in urine. J. Expos. Anal.
Environ. Epidemiol. 1999, 9(5), 494-501.
(24) Wittenburg, D.; Melzer, N.; Willmitzer, L.; Lisec, J.; Kesting, U.; Reinsch, N.;
Repsilber, D. Milk metabolites and their genetic variability. J. Dairy Sci. 2013, 96(4),
2557-2569.
(25) Donzé, G.; McMahon, C.; Guerin, P. M. Rumen metabolites serve ticks to
exploit large mammals. J. Exp. Biol. 2004, 207, 4283-4389.
(26) Boudonck, K. J.; Mitchell, M. W.; Wulff, J.; Ryals, J. A. Characterization of the
biochemical variability of bovine milk using metabolomics. Metabolomics 2009, 5(4),
375-386.
(27) NRC. 2001. Nutrient Requirements of Dairy Cattle. 7th rev. ed. Natl. Acad. Sci.,
Washington, DC.
(28) Bertram, H. C.; Yde, C. C.; Zhang X.; Kristensen N. B. Effect of dietary
nitrogen content on the urine metabolite profile of dairy cows assessed by nuclear
magnetic resonance (NMR)-based metabolomics. J. Agr. Food Chem. 2011, 59,
12499-12505.
(29) Chen, X. B.; Mejia, A. T.; Kyle, D. J.; Ørskov, E. R. Evaluation of the use of
purine derivative-creatinine ratio in spot urine and plasma samples as an index of
microbial protein supply in ruminants studies in sheep. J. Agric. Sci. 1995, 125,
137-143.
Page 25 of 42
ACS Paragon Plus Environment
Journal of Proteome Research
123456789101112131415161718192021222324252627282930313233343536373839404142434445464748495051525354555657585960

26
(30) Shingfield, K. J.; Offerb N.W. Simultaneous determination of purine
metabolites, creatinine and pseudouridine in ruminant urine by reversed-phase
high-performance liquid chromatography. J. Chromatogr. B. 1999, 723(1-2), 84-91.
(31) Brier, S; Fagnocchi, L; Donnarumma, D; Scarselli, M.; Rappuoli, R; Nissum,
M.; Delany, I.; Norais, N. Structural insight into the mechanism of DNA-binding
attenuation of the neisserial adhesion repressor NadR by the small natural ligand
4-hydroxyphenylacetic acid. Biochem. 2012, 51 (34), 6738–6752.
(32) Boudra, H.; Doreau, M.; Noziere, P. Simultaneous analysis of the main markers
of nitrogen status in dairy cow's urine using hydrophilic interaction chromatography
and tandem mass spectrometry detection. J. Chromatogr. A. 2012, 1256 (21), 169-176.
(33) Boeroa, P. O.; Seradjb, A.R.; Fondevilac, M.; Noland, J.; Balcellsb, J.
Modelling urinary purine derivatives excretion as a tool to estimate microbial rumen
outflow in alpacas (Vicugna pacos). Small Ruminant Res. 2012, 107(2-3), 101-104.
(34) George, S. K.; Verma, A. K.; Mehra. U. R.; Dipu, M.T.; Singh, P. Evaluation of
purine metabolites - creatinine index to predict the rumen microbial protein synthesis
from urinary spot samples in Barbari goats. J. Anim. Feed Sci. 2011, 20, 509–525.
(35) González, F. D.; Muiño, R.; Pereira, V.; Campos, R.; Benedito, J. L.
Relationship among blood indicators of lipomobilization and hepatic function during
early lactation in high-yielding dairy cows. J. Vet. Sci. 2011, 12(3), 251-255.
(36) Higgins, H. M.; Ferguson, E.; Smith, R. F.; Green, M. J. Using hormones to
manage dairy cow fertility: The clinical and ethical beliefs of veterinary practitioners.
PLoS One 2013, 8(4), e62993.
(37) Zhang, W. C.; Shyh-Chang, N.; Yang, H.; Rai, A.; Umashankar, S.; Ma, S.;
Soh, B. S.; Sun, L. L.; Tai, B. C.; Nga, M. E. Glycine decarboxylase activity drives
Page 26 of 42
ACS Paragon Plus Environment
Journal of Proteome Research
123456789101112131415161718192021222324252627282930313233343536373839404142434445464748495051525354555657585960

27
non-small cell lung cancer tumor-initiating cells and tumorigenesis. Cell 2012, 148(1),
259-272.
(38) Jain, M.; Nilsson, R.; Sharma, S.; Madhusudhan, N.; Kitami, T.; Souza, A. L.;
Kafri, R.; Kirschner, M. W.; Clish, C. B.; Mootha, V. K. Metabolite profiling identifies
a key role for glycine in rapid cancer cell proliferation. Science 2012, 336(6084),
1040-1044.
(39) Zhang, J. F. Study on protein synthesis in mammary gland in lactating cows fed
different diets. Ph. D. Dissertation, Inner Mongolian Agric. Univ., China. 2013, 46-48.
(40) Brosnan, M. E.; Edison, E. E.; da Silva, R.; Brosnan, J. T. New insights into
creatine function and synthesis. Adv. Enzyme Regul. 2007, 47(1), 252-260.
(41) Heo, J. C.; Lee, S. H. Alleviation of asthma-related symptoms by a derivative of
L-allothreonine. Intl. J. Molec. Medic. 2013, 31(4), 881-887.
(42) Black, A.; Kleiber, M.; Baxter, C. Glucose as a precursor of amino acids in the
intact dairy cow. Biochim. Biophys. Acta 1955, 17, 346-353.
(43) Sass, J. O.; Fischer, K.; Wang, R.; Christensen, E.; SchollϋBürgi, S.; Chang,
R.; Kapelari, K.; Walter, M. D-glyceric aciduria is caused by genetic deficiency of
D-glycerate kinase (GLYCTK). Human Mutation 2010, 31(12), 1280-1285.
(44) Waisbren, S. E.; Noel, K.; Fahrbach, K.; Cella, C.; Frame, D.; Dorenbaum, A.;
Levy, H. Phenylalanine blood levels and clinical outcomes in phenylketonuria: a
systematic literature review and meta-analysis. Molec. Genet. Metab. 2007, 92(1),
63-70.
(45) Alonso-Fernández J. R.; Colón C. Newborn screening in Spain, with particular
reference to Galicia: Echoes of Louis I. Woolf. Mol. Genet. Metab. 2010, 101(2-3),
95-98.
Page 27 of 42
ACS Paragon Plus Environment
Journal of Proteome Research
123456789101112131415161718192021222324252627282930313233343536373839404142434445464748495051525354555657585960

28
(46) Gilbert, H. F. Basic Concepts in Biochemistry: A Students Survival Guide.
McGraw-Hill Health Professions Division: 2000.
(47) Lemmon, M. A.; Schlessinger, J. Cell signaling by receptor tyrosine kinases.
Cell 2010, 141(7), 1117-1134.
(48) Haque, M. N.; Rulquin, H.; Andrade, A.; Faverdin, P.; Peyraud, J. L.;
Lemosquet, S. Milk protein synthesis in response to the provision of an “ideal” amino
acid profile at 2 levels of metabolizable protein supply in dairy cows. J. Dairy Sci.
2012, 95(10), 5876-5887.
Page 28 of 42
ACS Paragon Plus Environment
Journal of Proteome Research
123456789101112131415161718192021222324252627282930313233343536373839404142434445464748495051525354555657585960
29
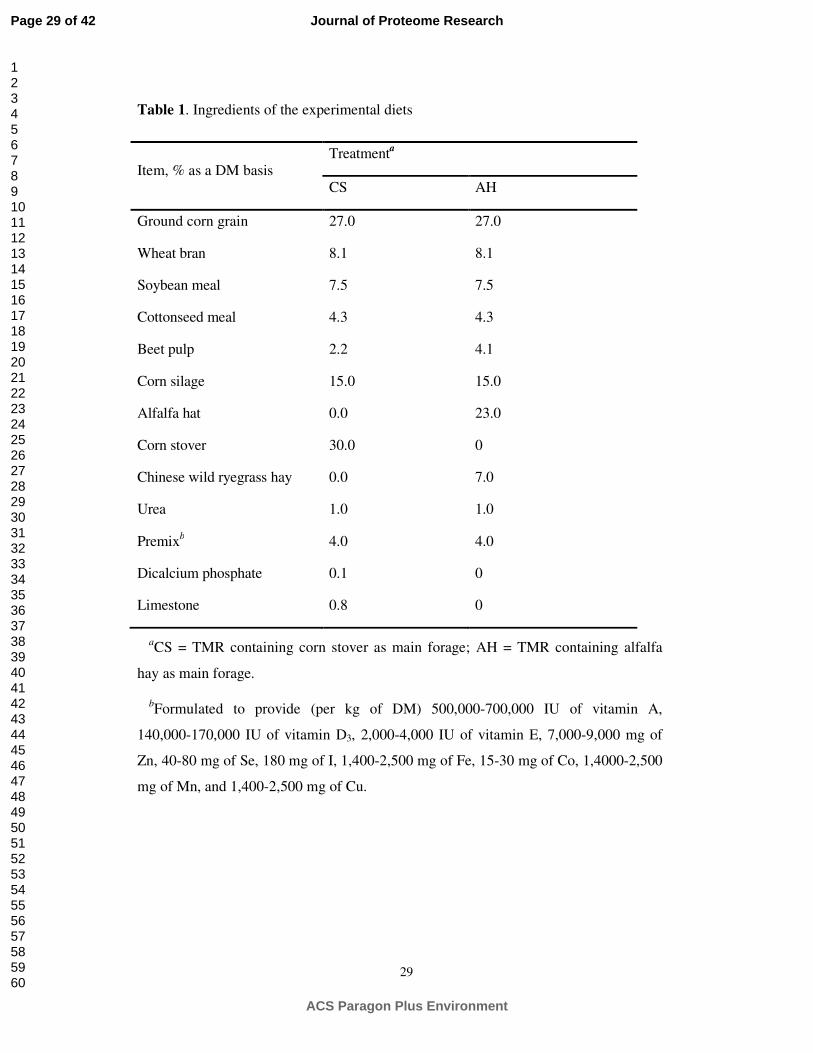
Table 1. Ingredients of the experimental diets
Item, % as a DM basis Treatmenta
CS AH
Ground corn grain 27.0 27.0
Wheat bran 8.1 8.1
Soybean meal 7.5 7.5
Cottonseed meal 4.3 4.3
Beet pulp 2.2 4.1
Corn silage 15.0 15.0
Alfalfa hat 0.0 23.0
Corn stover 30.0 0
Chinese wild ryegrass hay 0.0 7.0
Urea 1.0 1.0
Premixb 4.0 4.0
Dicalcium phosphate 0.1 0
Limestone 0.8 0
aCS = TMR containing corn stover as main forage; AH = TMR containing alfalfa
hay as main forage.
bFormulated to provide (per kg of DM) 500,000-700,000 IU of vitamin A,
140,000-170,000 IU of vitamin D3, 2,000-4,000 IU of vitamin E, 7,000-9,000 mg of
Zn, 40-80 mg of Se, 180 mg of I, 1,400-2,500 mg of Fe, 15-30 mg of Co, 1,4000-2,500
mg of Mn, and 1,400-2,500 mg of Cu.
Page 29 of 42
ACS Paragon Plus Environment
Journal of Proteome Research
123456789101112131415161718192021222324252627282930313233343536373839404142434445464748495051525354555657585960
30
Table 2 Effects of corn stover, alfalfa and Chinese wild rye hay as main dietary forage
sources on dry matter intake and milk yield and composition
Item Treatmenta SEM P-value
CS AH
Dry matter intake, kg/d 18.9 18.6 0.19 0.43
Milk yield, kg/d 20.3 24.9 0.32 < 0.01
Milk composition, %
Protein 3.17 3.26 0.031 0.04
Fat 4.25 4.22 0.083 0.72
Lactose 4.84 4.91 0.022 0.02
Milk efficiencyb 1.08 1.34 0.020 < 0.01
aCS = TMR containing corn stover as main forage; AH = TMR containing alfalfa
and Chinese wild rye hay as main forage.
bMilk efficiency = milk yield/dry matter intake.
Page 30 of 42
ACS Paragon Plus Environment
Journal of Proteome Research
123456789101112131415161718192021222324252627282930313233343536373839404142434445464748495051525354555657585960

31
Table 3 Identification of significantly different metabolites in rumen fluid, milk, serum
and urine between the CS and AH groups
Metabolites name RTa Mass Similarity VIP P-value FCb
Rumen fluid
Lactic acid 7.066 117 966 1.683 0.005 0.435
Glycolic acid 7.251 147 935 1.330 0.027 0.665
Citrulline 7.410 157 770 1.645 0.002 0.213
Alanine 7.766 73 671 1.517 0.021 0.417
Prostaglandin E2 8.793 117 643 1.309 0.020 0.216
Oxoproline 9.111 55 706 1.117 0.018 0.389
2-Ketoadipate 9.357 84 574 1.358 0.032 0.224
Dihydroxyacetone 9.485 42 510 1.304 0.046 0.788
Benzoic acid 9.533 105 972 1.616 0.008 0.573
Phenylacetic acid 10.14 73 956 1.937 0.001 0.489
Succinic acid 10.19 129 940 1.800 0.002 0.313
Nicotinic acid 10.44 196 563 1.607 0.006 0.504
Uracil 10.51 99 940 1.447 0.029 0.531
Itaconic acid 10.54 117 941 1.106 0.005 0.436
L-Allothreonine 11.01 112 911 1.169 0.046 0.581
Thymine 11.30 113 887 1.519 0.016 0.503
Hydrocinnamic acid 11.68 104 982 1.476 0.023 1.391
Oxalic acid 11.86 55 872 1.309 0.002 0.290
5-Dihydrocortisol 12.57 73 899 1.674 0.010 0.502
Adipic acid 12.67 111 745 2.087 <0.001 0.302
Aspartic acid 12.82 73 476 1.888 0.002 0.296
Methionine 12.90 128 734 1.253 0.034 0.546
Pimelic acid 13.08 125 753 1.379 0.024 0.696
Tropic Acid 13.34 118 489 1.241 0.021 0.330
Norleucine 13.537 158 514 1.327 0.022 0.127
Fructose 13.540 142 682 1.435 0.029 0.157
Page 31 of 42
ACS Paragon Plus Environment
Journal of Proteome Research
123456789101112131415161718192021222324252627282930313233343536373839404142434445464748495051525354555657585960

32
Metabolites name RTa Mass Similarity VIP P-value FCb
4-Vinylphenol dimer 13.66 192 847 1.612 0.024 0.481
3-(4-hydroxyphenyl)-
propionic acid 13.67 179 830 1.512 0.013 0.365
3-Hydroxyphenylacetic acid 14.15 164 788 1.384 0.023 0.037
Glutamic acid 14.21 84 476 1.016 0.015 0.403
Cyclohexylsulfamic
acid 14.26 208 860 1.071 0.032 0.290
2-Deoxyuridine 14.28 170 786 1.919 0.003 0.007
Aminomalonic acid 14.34 56 869 1.181 0.012 0.130
5-Aminovaleric acid 14.46 174 801 1.847 0.002 0.458
Phenylalanine 14.47 218 839 1.225 0.033 0.540
1,3-Diaminopropane 14.75 174 555 1.411 0.028 1.422
Azelaic acid 15.45 55 932 1.608 0.005 0.523
Valine 15.82 152 424 1.859 0.002 1.491
Glycocyamine 15.94 208 811 1.925 0.001 0.003
Fucose 15.96 73 902 2.352 <0.001 0.034
2,3-Dihydroxybenzoic acid 16.11 355 936 2.200 <0.001 0.004
5-Methoxytryptamine 16.13 174 684 1.389 0.029 0.553
Hydroxyurea 16.82 277 872 1.514 0.003 0.269
Hypoxanthine 17.20 265 497 1.463 0.019 0.397
L-Threose 18.70 205 771 1.260 0.008 0.342
Lysine 18.95 73 812 1.378 0.032 0.508
Pentadecanoic acid 20.07 75 687 1.539 0.015 0.581
Tartaric acid 20.24 73 620 1.319 0.042 1.293
Glucuronic acid 21.59 202 688 2.024 0.001 0.149
10-Hydroxydecanoic
acid 21.60 75 674 1.726 0.007 0.463
Malonic acid 23.06 73 500 1.274 0.034 0.628
Dihydrocarveol 24.01 73 718 1.689 0.007 4.497
Norvaline 24.45 73 816 1.359 <0.001 2.852
Lactose 26.72 73 739 1.421 0.039 0.390
Page 32 of 42
ACS Paragon Plus Environment
Journal of Proteome Research
123456789101112131415161718192021222324252627282930313233343536373839404142434445464748495051525354555657585960

33
Metabolites name RTa Mass Similarity VIP P-value FCb
Cellobiose 27.12 73 790 1.561 0.032 0.451
Milk
Alanine 7.796 116 620 1.907 0.044 28.00
Hydroxylamine 12.17 71 415 1.974 0.042 0.093
Phosphomycin 12.65 70 615 3.048 0.019 0.078
Thymol 12.67 207 574 1.473 0.026 7.930
Creatine 13.44 115 936 1.543 0.032 2.998
Putrescine 13.95 174 731 1.569 0.015 2.990
Ribulose-5-phosphate 21.79 315 519 2.710 0.044 <0.001
Citraconic acid 24.97 89 668 2.122 0.040 4.966
Serum
Mono(2-ethylhexyl)phthalate 7.093 221 642 2.439 0.002 0.123
Synephrine 12.17 71 842 4.007 <0.001 <0.001
Glutamine 7.444 155 644 2.089 0.015 2.163
Putrescine 7.717 174 717 1.144 0.035 0.624
DL-Anabasine 8.287 156 700 3.023 0.001 <0.001
Indolelactate 8.470 130 647 2.415 0.014 5.138
Malonamide 8.769 96 553 1.323 <0.001 0.296
Naringenin 9.059 128 530 1.669 0.036 0.390
Oxoproline 9.087 156 674 2.871 0.017 3.211
Succinate semialdehyde 9.091 89 969 3.676 0.001 <0.001
Cortexolone 10.19 213 846 3.235 0.001 <0.001
Halostachine 9.341 110 512 1.262 0.050 0.275
Pyridoxine 9.701 280 585 3.514 <0.001 0.051
Malonic acid 9.744 221 642 2.295 0.004 2.533
Phenylacetaldehyde 10.21 70 518 4.425 <0.001 <0.001
Glycocyamine 13.02 171 634 2.174 0.004 0.422
2-Keto-isovaleric acid 10.36 186 736 3.396 0.001 <0.001
Nicotinoylglycine 10.40 57 502 2.071 0.015 0.350
5-Methoxytryptamine 10.68 174 762 2.420 0.010 2.313
Glutaraldehyde 10.75 112 366 2.118 0.029 6.914
Page 33 of 42
ACS Paragon Plus Environment
Journal of Proteome Research
123456789101112131415161718192021222324252627282930313233343536373839404142434445464748495051525354555657585960

34
Metabolites name RTa Mass Similarity VIP P-value FCb
2-Amino-1-phenylethanol 10.79 174 868 1.335 0.003 2.307
Synephrine 7.352 116 842 3.098 <0.001 0.200
D-Altrose 15.45 103 807 1.667 0.035 0.587
Tricetin 10.23 128 632 4.309 <0.001 <0.001
Monoolein 18.18 73 683 1.394 0.014 0.616
Phytanic acid 23.17 117 549 3.705 <0.001 0.124
Phytosphingosine 26.75 73 699 1.909 0.033 10.39
Galactinol 27.97 73 777 2.439 0.002 1.919
Urine
2-Hydroxypyridine 8.538 152 890 1.587 0.028 3.130
21-Hydroxypregnenolone 9.453 157 668 1.576 0.038 3.557
Benzoin 13.39 179 673 1.174 0.033 2.647
Benzoic acid 13.63 105 836 1.779 0.011 3.069
N-Methyl-L-glutamic acid 13.90 98 974 2.104 <0.001 0.033
D-Glyceric acid 15.46 189 666 1.084 0.044 2.196
Carbamoyl-aspartic acid 17.24 116 703 1.352 0.045 4.912
DL-Anabasine 17.34 239 912 1.853 0.014 3.703
5-Methylresorcinol 18.37 268 630 2.232 0.011 7.687
Ethanolamine 19.88 267 862 2.275 0.001 0.089
4-Vinylphenol dimer 21.18 83 766 1.650 0.020 4.044
4-Hydroxyphenylacetic acid 22.85 73 723 1.351 0.031 2.847
Lyxose 23.07 103 869 1.877 0.015 550.7
Caffeic acid 24.31 101 679 2.729 <0.001 <0.001
2,3-Dihydroxybenzoic acid 25.04 355 769 2.372 <0.001 <0.001
Conduritol b epoxide 25.07 73 799 1.207 0.047 2.492
Gentisic acid 25.49 73 580 1.215 0.043 0.469
Aminooxyacetic acid 26.13 146 589 1.618 0.018 0.363
5-Hydroxytryptophan 27.47 290 642 1.237 0.044 2.418
Hippuric acid 27.57 105 989 1.929 0.017 5.966
Pentadecanoic acid 31.47 117 806 1.554 0.039 3.125
Allantoic acid 28.29 331 793 1.124 0.048 4.021
Page 34 of 42
ACS Paragon Plus Environment
Journal of Proteome Research
123456789101112131415161718192021222324252627282930313233343536373839404142434445464748495051525354555657585960

35
Metabolites name RTa Mass Similarity VIP P-value FCb
Tyrosine 33.12 179 554 1.380 0.020 2.836
Stearic acid 33.34 117 911 1.911 0.040 7.878
Lactobionic Acid 33.62 73 738 1.548 0.020 8.399
Glucose-1-phosphate 34.27 217 701 1.164 0.035 3.146
Malonic acid 35.15 73 195 1.660 0.003 0.290
2-Monoolein 35.98 73 817 1.700 0.036 4.227
Galactinol 36.69 204 670 1.990 0.002 1.919
Sedoheptulose 37.96 73 729 1.928 0.002 0.187
Gluconic lactone 38.87 73 628 1.325 0.032 0.261
aRT=Retention time.
bFC=fold change, mean value of peak area obtained from CS group / mean value of
peak area obtained from AH group., if the FC value less than 1, it means that
metabolites is less in CS than AH.
Page 35 of 42
ACS Paragon Plus Environment
Journal of Proteome Research
123456789101112131415161718192021222324252627282930313233343536373839404142434445464748495051525354555657585960

36
Table 4 The metabolic pathways identified from the significantly different metabolites
(SDMs) from the four biofluids between AH and CS diets
SDM
Metabolic pathways
Gly, Ser and Thra Tyrb Phec
Rume
n fluid
(1.42)d1,3-Diaminopropa
ne
(0.30)L-Aspartic acid
(0.0035)Glycocyamine
(0.58)L-Allothreonine
(0.037)3-hydroxyphen
yl-
acetic acid
(0.31)Succinic acid
(0.023)3-hydroxyphenyl-
acetic acid
(0.57)Benzoic acid
(0.037)Phenylacetic acid
(0.31)Succinic acid
(0.54)Phenylalanine
Milk (3.00)Creatine
Serum (0.42)Glycocyamine (1.3*10-7)Succinate-
semialdehyde
(4.5*10-7)Phenylacetaldehy
de
Urine (2.20)D-Glycerate (2.85)4-Hydroxy-
phenylacetic acid
(0.47)Gentisic acid
(2.84)Tyrosine
(2.85)4-Hydroxy-
phenylacetic acid
(3.07)Benzoic acid
(2.84)Tyrosine
aGly, Ser and Thr = glycine, serine and threonine metabolism.
bTyr = tyrosine metabolism.
cPhe = phenylalanine metabolism.
dThe number in the bracket is the fold change (CS/AH) value.
Page 36 of 42
ACS Paragon Plus Environment
Journal of Proteome Research
123456789101112131415161718192021222324252627282930313233343536373839404142434445464748495051525354555657585960

37
Figure 1. GC-TOF/MS TIC chromatograms of rumen fluid (a and b), milk (c and d), serum (e and f) and urine (g and h) for cows fed CS (a, c, e and g) and AH (b, d, f and h). CS = TMR containing corn stover as main forage; AH = TMR containing alfalfa and Chinese wild rye hay as main forage. Arrows indicate significantly different peaks when AH and CS were compared.
Page 37 of 42
ACS Paragon Plus Environment
Journal of Proteome Research
123456789101112131415161718192021222324252627282930313233343536373839404142434445464748495051525354555657585960

38
Figure 2. Unique and mutual metabolites identified in the rumen fluid, milk, serum,
and urine of dairy cows.
Page 38 of 42
ACS Paragon Plus Environment
Journal of Proteome Research
123456789101112131415161718192021222324252627282930313233343536373839404142434445464748495051525354555657585960
39
Figure 3. The metabolome view map of the common metabolites identified in four
biofluids from dairy cows fed CS and AH diets. The x-axis represents the pathway
impact, and y-axis represents the pathway enrichment. Larger sizes and darker colors
represent higher pathway enrichment and higher pathway impact values, respectively.
CS = TMR containing corn stover as main forage; AH = TMR containing alfalfa and
Chinese wild rye hay as main forage.
Page 39 of 42
ACS Paragon Plus Environment
Journal of Proteome Research
123456789101112131415161718192021222324252627282930313233343536373839404142434445464748495051525354555657585960

40
Figure 4. PCA 3D score map (A, D, G and J), corresponding validation plots of
PLS-DA (B, E, H and K), and OPLS-DA score plots (C, F, I and L) derived from the
GC-TOF/MS metabolite profiles of rumen fluid (A−C), milk (D−F), serum (G−I) and
urine (J-L) for cows fed CS and AH. Black represents cows fed CS, and red represents
cows fed AH. CS = TMR containing corn stover as main forage; AH = TMR
containing alfalfa and Chinese wild rye hay as main forage.
Page 40 of 42
ACS Paragon Plus Environment
Journal of Proteome Research
123456789101112131415161718192021222324252627282930313233343536373839404142434445464748495051525354555657585960

41
Figure 5. Kyoto Encyclopedia of Genes and Genomes pathways are manually linked
together. The map illustrates significantly different metabolites in the four biofluids
and three key metabolic pathways including glycine, serine and threonine metabolism;
tyrosine metabolism; and phenylalanine metabolism.
Page 41 of 42
ACS Paragon Plus Environment
Journal of Proteome Research
123456789101112131415161718192021222324252627282930313233343536373839404142434445464748495051525354555657585960

42
Abstract Graphic
Page 42 of 42
ACS Paragon Plus Environment
Journal of Proteome Research
123456789101112131415161718192021222324252627282930313233343536373839404142434445464748495051525354555657585960