Embed Size (px)
Citation preview

February 2004 • NREL/SR-550-35037
The Potential Economic Impact of Constructing and Operating Solar Power Generation Facilities in Nevada
R. K. Schwer and M. Riddel Center for Business and Economic Research University of Nevada Las Vegas, Nevada
National Renewable Energy Laboratory 1617 Cole Boulevard Golden, Colorado 80401-3393 NREL is a U.S. Department of Energy LaboratoryOperated by Midwest Research Institute • Battelle
Contract No. DE-AC36-99-GO10337

February 2004 • NREL/SR-550-35037
The Potential Economic Impact of Constructing and Operating Solar Power Generation Facilities in Nevada
R. K. Schwer and M. Riddel Center for Business and Economic Research University of Nevada Las Vegas, Nevada
NREL Technical Monitor: M. Mehos Prepared under Subcontract No. ACX-3-33466-01
National Renewable Energy Laboratory 1617 Cole Boulevard Golden, Colorado 80401-3393 NREL is a U.S. Department of Energy LaboratoryOperated by Midwest Research Institute • Battelle
Contract No. DE-AC36-99-GO10337

NOTICE
This report was prepared as an account of work sponsored by an agency of the United States government. Neither the United States government nor any agency thereof, nor any of their employees, makes any warranty, express or implied, or assumes any legal liability or responsibility for the accuracy, completeness, or usefulness of any information, apparatus, product, or process disclosed, or represents that its use would not infringe privately owned rights. Reference herein to any specific commercial product, process, or service by trade name, trademark, manufacturer, or otherwise does not necessarily constitute or imply its endorsement, recommendation, or favoring by the United States government or any agency thereof. The views and opinions of authors expressed herein do not necessarily state or reflect those of the United States government or any agency thereof.
Available electronically at http://www.osti.gov/bridge
Available for a processing fee to U.S. Department of Energy and its contractors, in paper, from:
U.S. Department of Energy Office of Scientific and Technical Information P.O. Box 62 Oak Ridge, TN 37831-0062 phone: 865.576.8401 fax: 865.576.5728 email: [email protected]
Available for sale to the public, in paper, from: U.S. Department of Commerce National Technical Information Service 5285 Port Royal Road Springfield, VA 22161 phone: 800.553.6847 fax: 703.605.6900 email: [email protected] online ordering: http://www.ntis.gov/ordering.htm
Printed on paper containing at least 50% wastepaper, including 20% postconsumer waste

Table of Contents
EXECUTIVE SUMMARY ................................................................................................ 1
I. INTRODUCTION ..................................................................................................... 3
II. ECONOMIC IMPACTS AND THE REMI MODEL ............................................... 3
III. THE SCENARIOS..................................................................................................... 5
IV. SCENARIO A............................................................................................................ 6
Construction Direct Costs ..................................................................................... 6
Operations and Maintenance Costs ....................................................................... 7
Economic Impacts ................................................................................................. 8
Employment...................................................................................................... 8
Personal Income.............................................................................................. 10
Gross State Product......................................................................................... 10
V. SCENARIO B.......................................................................................................... 11
Construction Direct Costs ................................................................................... 11
Economic Impacts ............................................................................................... 14
Employment.................................................................................................... 14
Personal Income.............................................................................................. 15
Gross State Product......................................................................................... 16
VI. SCENARIO C.......................................................................................................... 16
Construction and O&M Direct Costs .................................................................. 17
Economic Impacts ............................................................................................... 19
Employment.................................................................................................... 19
Personal Income.............................................................................................. 20
Gross State Product......................................................................................... 20
VII. CONCLUSION........................................................................................................ 22
REFERENCES ................................................................................................................. 23

EXECUTIVE SUMMARY
Nevada has a vast potential for electricity generation using solar power. An examination of the stock of renewable resources in Nevada proves that the state has the potential to be a leader in renewable-electric generation. Solar resources for concentrating collectors range between 7,000 and 7,500 watt hours per square meter (whm2), making southern Nevada one of the best sources for this type of generation in the world (see Riddel and Schwer, 2003).
The purpose of this study is to estimate the economic impact, in terms of employment, personal income, and gross state product (GSP) of developing some portion of Nevada’s solar energy generation resources. At present, it is impossible to know what level of investment in solar generation capacity will occur in Nevada over the coming decades. The level of investment will depend on federal and state energy policy, energy prices, technology, and a host of other variables. “Sustainable” development would be something on the order of 5GWs over 10 years so 500MW/year (communication Mark Mehos NREL November 2003). This level of investment is unlikely in the near future given current prices and policy. Thus, this report focuses on likely investment scenarios to gain an understanding of possible economic impacts from different levels of investment in CSP generation in Nevada. We examine three scenarios by varying the number of 100-MWe plants constructed and operated in the state. We find that developing the state’s solar resources will have a significant, positive effect on Nevada’s economy. The degree of impact depends on the scenario and the timing of the construction and operations and maintenance (O&M) schedule.
Under Scenario A, one “representative plant,” a 100 megawatt (MWe) trough facility, is constructed. The direct construction impact, including labor, capital, land, and contingencies, totals $485.6 million. Each year, 817 jobs are directly tied to constructing the facility. Indirect and induced job creation totals another 1,570 jobs during the construction phase, suggesting an employment multiplier of 2.9. Not surprisingly, employment impacts during the O&M phase are significantly less than during the construction phase. Employment impacts average 140 jobs annually. Total personal income in Nevada attributable to the construction phase (2004 through 2006) and the O&M phase (2007 through 2035) is estimated to be $1.15 billion. GSP will be boosted by $1.14 billion.
Scenario B assumes that 10 representative plants are constructed over an 11-year construction cycle. This scenario offers the highest economic impact. Employment impacts are largest during the early years of the construction phase. Initial employment impact is 3,830 jobs in the first year of construction, rising quickly to a peak of over 6,940 jobs in 2005. The first post-construction year enjoys employment impacts of 1,090 jobs. Over the O&M phase, employment impacts average 1,800 jobs. Total personal income and GSP generated between 2004 and 2035 totals $9.37 and $9.85 billion, respectively.
1

Scenario C represents and intermediate case between A and B where three 100-MWe plants are constructed over a two-tear build cycle, with new plants beginning construction in 2004, 2005, and 2006. All construction is complete by 2008. This level of investment is equivalent to meeting approximately 2/3 of the Nevada Renewable Portfolio Standard (RPS) of 15 percent of the electricity generated in Nevada by investor owned utilities come from renewable sources.
As in Scenario B, employment impacts in Scenario C peak early in the construction phase. In 2005, nearly 7,000 jobs may be attributed to the construction of the facilities. The average annual employment impact over the construction phase is 4,900 jobs. The average employment impact over the O&M phase is 475 jobs. Taken together, the construction and O&M for the three plants injects $3.4 billion in personal income into the Nevada economy from 2004 through 2035. GSP is augmented by $3.5 billion over that same period.
The results reveal significant economic benefits, in terms of GSP, new employment, and personal income to the state of Nevada. As such, CSP generation is a potential source of economic development throughout the state. Rural Nevada has been shedding high-paying natural-resource-based jobs for the past decade. Solar power generation does not contribute to global warming or diminish air quality, but provides opportunities for the skilled labor force that has been left unemployed in rural Nevada. Thus, tallying the economic and environmental benefits of solar-power generation, it is clear that it could be an important contributor to sustainable economic development in rural Nevada.
2

I. INTRODUCTION
Disenchantment with the environmental degradation associated with fossil-fuel use has led to interest in alternatives to fossil fuel. In Nevada, almost 90 percent of the electricity generated comes from coal (53 percent) or natural gas (36 percent). Fossil-fuel consumption is associated with air-quality problems and acid rain, and may affect global temperatures in the long run. Perhaps even more importantly, fossil fuels are nonrenewable. As resources become scarce, prices will certainly rise and alternatives will be necessary.
Nevada has a vast potential for electricity generation using solar power. An examination of the stock of renewable resources in Nevada proves that the state has the potential to be a leader in renewable electric generation. Solar resources for concentrating collectors range between 7,000 and 7,500 watt hours per square meter (whm2), making southern Nevada one of the best sources for this type of generation in the world (see Riddel and Schwer, 2003).
The purpose of this study is to examine the potential of solar power generation facilities for economic development in Nevada. We focus on one type of solar power generation that has enjoyed success in experimental facilities: concentrating solar power (CSP) generation. We estimate direct, indirect, and induced impacts, in terms of employment, personal income, and gross state product (GSP) within the state of Nevada. The economic impacts are estimated using the REMI model, a multivariate, multi-equation model of the Nevada economy.
We examine three different levels of CSP-generation capacity: Scenario A with 100 MWe of capacity, Scenario B with 1,000 MWe of capacity, and finally Scenario C where enough capacity is built to meet one-half of Nevada’s legislated goal of 15 percent of the total state’s generation from renewable sources.
We find that the economic impact of constructing and operating CSP facilities within Nevada could provide a substantial and needed economic driver for rural Nevada.
II. ECONOMIC IMPACTS AND THE REMI MODEL
Economic impacts arise from new expenditures over and above existing expenditures. They may also include shifts in the level of environmental externalities such as changes in air or water quality. For simplicity, we focus on tangible and easily quantifiable economic impacts on employment, personal income, and GSP. Employment impacts may arise from a variety of sources. There will be direct employment impacts from constructing and maintaining renewable-energy generation facilities. Second round, or indirect employment impacts, can follow as Nevada firms that supply labor and or materials to generation facilities expand. Finally, new jobs can be created in the retail, services, and other sectors that support consumption activities. Similarly, direct GSP impacts will arise from the construction, maintenance, and operation of CSP-generation facilities. Indirect and induced effects from increased demand for renewable-energy
3

generation products and increased household wealth, respectively, are also an important source of economic activity.
We estimate the economic impacts using the REMI model from Regional Economic Models, Inc. The REMI model is a state-of-the-art econometric forecast model that accounts for dynamic feedbacks between economic and demographic variables. The REMI model is nationally recognized by the business and academic community as the best regional forecast tool available. The REMI model forecasts county employment based on a model that includes over 100 stochastic and dynamic relationships and a number of identities. The national economy is taken as exogenous. The relationships span 53 sectors of employment figures, detailed population and demographic forecasts that include economic and non-economic migration, capital formation, and county-level import export relationships. A complete explanation of all of the relationships contained in the model is given in Regional Economic Modeling: A Systematic Approach to Economic Forecasting and Policy Analysis by George I. Treyz.
The REMI model allows for an open economy, thus the model explicitly accounts for trade amongst the counties in Nevada and throughout the U.S. If, for instance, a downturn in California causes employment and personal income to fall, this is reflected by a drop in tourism to northern Nevada and Washoe County. The same is true for all other industries in Washoe County; if demand for exported products from local industries falls anywhere in the U.S., it is automatically included in the forecast. This type of detailed trade modeling, though rare, is particularly important for a small economy such as Nevada which is very dependent on exports for its economic base.
The REMI model works particularly well for economic impact modeling because it is a dynamic model. The word “dynamic” in economics means that past events are allowed to influence current and future events. So, for example, an increase in demand for electricity will cause electricity prices to rise in the model in the next period. The price rise will translate into less electricity demanded in the future, all else equal.
Another important component of the REMI model is the detailed provision for capital investment. Investment in the economic sense is buildings and equipment that are used for producing goods and services. Therefore, the model incorporates data on past investment, including the cost of new casino and hotel construction, in the estimation process. Demand for labor and capital investment is included through a block of equations in the model. Another important block of equations is the population and labor-supply block. This block relates migration and changes in population to the supply of workers for the different industries in the county. A unique feature of this block of equations is the decomposition of migrants into those drawn by economic variables and those from non-economic, including retired persons. Again, this feature is helpful when modeling the economy of a state with a disproportionately high percentage of retired persons. Finally, the REMI model has a block of equations that accounts for wages, prices, and profits of firms.
4

In the REMI, the labor and capital-demand block, the population and labor-supply block, and the wage, prices and profits block are allowed to interact, thereby mimicking the economic relationships. The dynamic relationships allow for eventual return to equilibrium. For example, if wages are high relative to those in Utah, the model will draw migrants from Utah to work in Nevada. Over time, as new migrants come and increase the supply of labor, wages are forced down and are eventually equilibrated with those of Utah. This allows for economic-impact estimates that are reflective of theoretically sound economic relationships.
The model employed divides Nevada into five regions—Clark County, Nye County, Lincoln County, Washoe County and Carson City, and the remaining counties are combined to form a fifth region. The data used to construct the model begin in 1969. Because Bureau of Labor Statistics’ (BLS) personal income data are reported with a two-year lag, the most recent historical data in the model are from 1998. In an effort to ensure that the most current data are used in the forecast, we update the model with employment figures from the Nevada Department of Employment, Training, and Rehabilitation.
The exogenous parameters of the REMI model are estimated using a variety of simultaneous and single-equation techniques. The endogenous parameters are found by choosing values so that the system of labor, capital-demand, population, labor-supply, wage, prices and profits equations is satisfied. For a detailed description of parameter estimation and model solution methods (see Treyz 1993).
Once solved, the REMI model provides forecasts for economic and demographic variables, such as population, inflation-adjusted GSP, and industry-specific final demand, on which we may base our tax forecasts. It is very important to note that the final-demand forecasts used to ultimately forecast taxable sales, sales tax, and room tax encompass all of the information contained in the REMI model. Thus, the economic impacts arising from the model are based on complicated, but statistically accurate models of the Nevada and U.S. economies.
III. THE SCENARIOS
At present, it is impossible to know what level of investment in solar generation capacity will occur in Nevada over the coming decades. The level of investment will depend on federal and state energy policy, energy prices, technology, and a host of other variables. “Sustainable” development would be something on the order of 5GWs over 10 years so 500MW/year (communication Mark Mehos NREL November 2003). This level of investment is unlikely in the near future given current prices and policy. Thus, this report focuses on likely investment scenarios to gain an understanding of possible economic impacts from different levels of investment in CSP generation in Nevada. We examine three scenarios by varying the number of 100-MWe plants constructed and operated in the state.
5

Scenario A: We describe economic impacts from a typical single-plant CSP-generation facility built in Nevada. The “representative plant” is a 100 MW trough facility built according to that described in “Assessment of Parabolic Trough and Power Tower Solar Technology Cost and Performance Forecasts” released by the Sargent and Lundy Consulting Group (hereafter called S&L). We assume construction and operations and maintenance expenditures correspond to a plant beginning a three-year construction period in 2004.
Scenario B: This scenario explores the economic impacts of developing multiple CSP plants within Nevada resulting in a total installed capacity of 1000MW. We assume that 1,000 MWe of CSP generating capacity is added to Nevada’s energy infrastructure by constructing ten new 100-MWw plants each with a two-year build cycle. The first plant begins construction in 2004 and a new plant begins construction each of after that for nine years. Operations for the first plant built begin in 2006 with a new plant starting operations each of the nine years following.
Scenario C: Scenario C represents and intermediate case where three 100-MWe plants. This level of investment is equivalent to meeting approximately 2/3 of the Nevada Renewable Portfolio Standard (RPS) of 15 percent of the electricity generated in Nevada by investor owned utilities come from renewable sources. Construction begins with one plant in 2004 and a new plant begins construction in each of the two years following. All construction is complete by 2008.
For each of the three scenarios described above, we tabulate economic impacts in terms of gross state product, employment by major industries, and fiscal impacts. The economic impact is decomposed into: 1) direct impacts from constructing facilities, and 2) indirect impacts from stimulating secondary economic activity within the state, and 3) induced effects arising from changes in income and consumption by Nevada residents.
IV. SCENARIO A.
Scenario A estimates the economic impact on Nevada of building one 100-MWe plant in the state. Economic impacts arise during the construction, then the O&M phases. Capital and labor costs differ significantly over the two phases. As such, we describe each in turn.
Construction Direct Costs
Construction costs for a 100-MWe trough CSP plant are given in Table 1. The costs are broken down into capital and labor costs by major cost component of the construction project. Contingencies are added that vary over the major cost component. Columns 7 and 8 in Table 1 give the total costs, with the contingency, for capital and labor, respectively, by major cost component. Labor cost totals $107 million, whereas capital costs come to $344 million.
6

Table 1. Construction Capital and Labor Costs for One 100MWe Trough Collecting Solar Power Plant. (From Sargent & Lundy draft study and NREL).
Total Total Adjusted Capital Labor
Equip Labor Total Total SpendingSpending Category ($Thous)($Thous)($Thous)Contingency($Thous) ($Thous) ($Thous) Structures & Improvements 0 7,243 7,243 0.20 8,692 0 8,692Collector System 205,509 42,529 248,038 0.05 260,440 215,785 44,655Thermal Storage System 74,296 21,511 95,807 0.10 105,388 81,725 23,663Steam Gen or HX System 8,570 2,742 11,313 0.10 12,444 9,427 3,017Aux Heater/Boiler 0 0 0 0.10 0 0 0EPGS 24,371 12,342 36,713 0.10 40,384 26,808 13,577Master Control System 0 0 0 0.10 0 0 0Engineering & Project Maint. 32,911Land Cost 1,854Balance of Plant 9,140 12,206 21,346 0.10 23,481 10,054 13,427Total Direct Costs 321,886 98,575 420,461 485,594 343,799 107,030
The S&L study assumes that engineering, construction, and project management will cost an additional 7.3 percent of the $451 million in Table 1 amounting to $32 million dollars. Land costs are expected to total $1.854 million.
Construction capital costs enter the REMI model through the output variables: construction sales, new electric-utility facilities. Labor costs are entered by transforming labor spending into full-time employment (FTE) using the REMI construction wage as follows: FTE=Total Labor Spending/Annual Construction Wages. We assume a three-year build cycle. The plant is constructed in years 1, 2, and 3 and begins operation in year 4.
Operations and Maintenance Costs
Operations and maintenance capital costs and expenditures are also taken from the S&L study. Table 2 gives a tally of the expected operations and maintenance costs.
Table 2. Operation and Maintenance Costs for One 100MWe Trough Collecting Solar Power Plant. ( From Sargent & Lundy draft study and NREL).
Administrativ Technical e (FTE) (FTE) Capital Costs ($ Thous)
7 37.9 $5,472 Wage (2004 $Thous) $45 $66 Total Cost (2004 $ Thous) $314 $2,496 $5,472 Grand Total Annual O&M Costs $8,282
The labor O&M costs are entered into the REMI model as FTE. Administrative employment enters the model through the employment category: services, miscellaneous business services. Technical employment is entered using the REMI category
7
employment: public utilities. The wages given in Table 2 are those used in the REMI model. As such, the total O&M budget under our assumptions differs slightly from that of the S&L study. Nevertheless, the REMI wage data is Nevada-specific and we feel that it is appropriate to use wages that reflect the Nevada, rather than a national, labor market.
Capital expenditures for O&M enter the model through the output block: public utility sales. Total capital expenditures are $5.5 million annually beginning in 2006 and are set to grow at the rate of general-price inflation through the final model year, 2035.
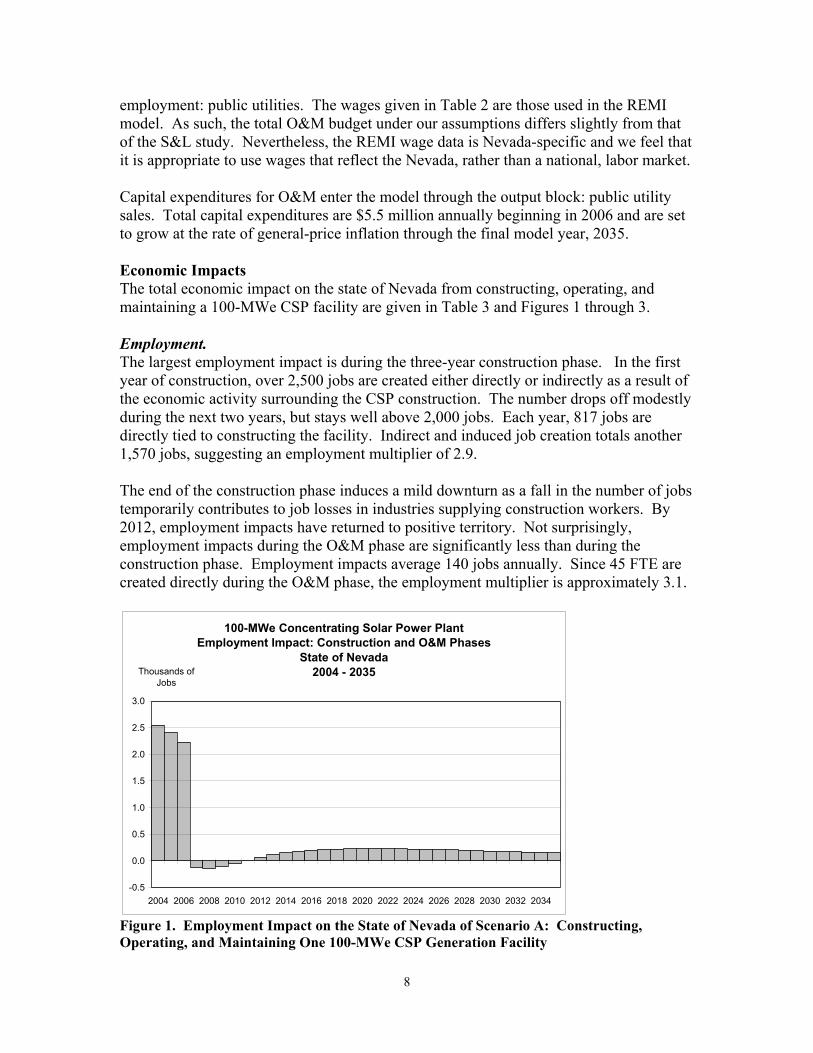
Economic Impacts The total economic impact on the state of Nevada from constructing, operating, and maintaining a 100-MWe CSP facility are given in Table 3 and Figures 1 through 3.
Employment. The largest employment impact is during the three-year construction phase. In the first year of construction, over 2,500 jobs are created either directly or indirectly as a result of the economic activity surrounding the CSP construction. The number drops off modestly during the next two years, but stays well above 2,000 jobs. Each year, 817 jobs are directly tied to constructing the facility. Indirect and induced job creation totals another 1,570 jobs, suggesting an employment multiplier of 2.9.
The end of the construction phase induces a mild downturn as a fall in the number of jobs temporarily contributes to job losses in industries supplying construction workers. By 2012, employment impacts have returned to positive territory. Not surprisingly, employment impacts during the O&M phase are significantly less than during the construction phase. Employment impacts average 140 jobs annually. Since 45 FTE are created directly during the O&M phase, the employment multiplier is approximately 3.1.
100-MWe Concentrating Solar Power Plant Employment Impact: Construction and O&M Phases
State of Nevada 2004 - 2035
-0.5
0.0
0.5
1.0
1.5
2.0
2.5
3.0
2004 2006 2008 2010 2012 2014 2016 2018 2020 2022 2024 2026 2028 2030 2032 2034
Thousands of Jobs
Figure 1. Employment Impact on the State of Nevada of Scenario A: Constructing, Operating, and Maintaining One 100-MWe CSP Generation Facility
8

9
Table 3. P Impacts of Scenario A: g, Operating, and Maintaining One 100-MWe CSP Plant in Nevada
Year Employment
(Thous)
Personal Income
(Bil Nominal $
GSP (Bil Nominal
$) 2004 0.125 0.1652005 0.138 0.1622006 0.143 0.1552007 0.029 0.0072008 0.017 0.0042009 0.013 0.0052010 0.012 0.0082011 0.012 0.0112012 0.014 0.0142013 0.015 0.0172014 0.018 0.0192015 0.020 0.0222016 0.022 0.0232017 0.023 0.0252018 0.024 0.0262019 0.025 0.0262020 0.026 0.0272021 0.026 0.0272022 0.026 0.0282023 0.027 0.0282024 0.027 0.0282025 0.028 0.0282026 0.029 0.0282027 0.030 0.0292028 0.031 0.0292029 0.032 0.0292030 0.033 0.0292031 0.034 0.0292032 0.035 0.0292033 0.037 0.0292034 0.038 0.0292035 0.039 0.029
Employment, Personal Income, and GS Constructin
2.55 2.40 2.22
-0.12 -0.14 -0.10 -0.04 0.02 0.07 0.11 0.15 0.18 0.20 0.21 0.22 0.22 0.23 0.23 0.23 0.22 0.22 0.22 0.21 0.21 0.20 0.19 0.19 0.18 0.17 0.17 0.16 0.15

Personal Income. The volume of construction activity from 2004 – 2006 means that personal income impacts are largest during the CSP facility construction phase. Personal income averages $140 million annually during this time. The number falls considerably in the O&M phase as capital expenditures decline and employment effects taper off. Personal-income impacts remain in positive territory even after the end of the construction phase, falling from just over $143 million to $29 million annually. Personal income averages $30 million each year over the baseline forecast for the state during the O&M phase. Total personal income in Nevada attributable to the construction phase (2004 through 2006) and the O&M phase (2007 through 2035) is estimated to be $1.15 billion.
100-MWe Concentrating Solar Power Plant Personal Income Impact: Construction and O&M Phases
State of Nevada 2004 - 2035
0.00
0.02
0.04
0.06
0.08
0.10
0.12
0.14
0.16
2004 2006 2008 2010 2012 2014 2016 2018 2020 2022 2024 2026 2028 2030 2032 2034
Billions of Dollars
Figure 2. Personal-Income Impact on the State of Nevada of Scenario A: Constructing, Operating, and Maintaining One 100-MWe CSP Generation Facility
Gross State Product. Mirroring personal-income activity, the construction phase offers the highest economic impact in terms of GSP. In the initial year of construction, over $160 million of GSP is generated either directly or indirectly from constructing the CSP facility. The average annual construction impact totals $160 million.
As with employment and personal income, the phase-out of construction activity causes the economic impact to fall markedly: GSP impacts fall from $155 million in 2006 to $7 million in 2007. The impact steadily increases to $29 million annually by 2027. The average annual economic impact, in terms of GSP, is $22.7 million during the O&M phase. In all, Nevada GSP will be boosted by $1.14 billion.
10

100-MWe Concentrating Solar Power Plant Gross State Product Impact: Construction and O&M Phases
State of Nevada 2004 - 2035
0.00
0.02
0.04
0.06
0.08
0.10
0.12
0.14
0.16
0.18
2004 2006 2008 2010 2012 2014 2016 2018 2020 2022 2024 2026 2028 2030 2032 2034
Billions of Dollars
Figure 3. GSP Impact on the State of Nevada of Scenario A: Constructing, Operating, and Maintaining One 100-MWe CSP Generation Facility
V. SCENARIO B.
Under Scenario B, we assume that 1,000 MWe of CSP generating capacity is added to Nevada’s energy infrastructure. We assume that the plants are constructed on a two-year build cycle with construction ongoing during years 1 and 2 and operation beginning in year 3. The first plant begins construction in 2004 and a new plant begins construction each of the following nine years. In all, ten 100-MWe plants are constructed adding 1,000 MWe to Nevada’s generation capacity.
Construction Direct Costs
Engineering-cost estimates assume that costs of construction will fall as engineers, project managers, and installers familiarize themselves with installation and construction. This is true for many new technologies: learning at all levels of the development and construction phases helps to contain costs. Further, economies of scale can lead to lower costs for production of CSP capital and equipment. Taken together, it is reasonable to assume that learning and economies of scale should make subsequent plants less costly.
That said, it is difficult to predict the actual costs savings but they are important when analyzing economic impacts. Increased efficiency means lower construction costs and fewer dollars spent in Nevada. As a result, cost-savings act to dampen economic impacts. Engineering-based estimates put these between 10 and 20 percent for subsequent plants. For our model, we assume a conservative value of 10 percent, but allow the base cost to grow at the rate of general-price inflation. The result is prices falling by between 7 and 8 percent for each plant.
11

12
Table 4. nstructing, Operating, and Maintaining Ten 100-MWe CSP Facilities in Nevada
Year
O&M Technical
FTE
O&M Administrative
FTE Construction
FTE
O&M Capital ($000)
Construction Capital ($000)
2004 0 1,230.341 0.000 171,899.650 2005 0 2,283.777 0.000 329,727.080 2006 38.9 2,049.619 5,471.916 305,887.655 2007 77.8 1,840.140 11,163.138 283,780.544 2008 116.7 1,651.323 17,081.839 263,318.470 2009 155.6 1,485.459 23,237.795 244,404.259 2010 194.5 1,336.767 29,645.187 226,956.173 2011 233.4 1,203.355 36,338.150 210,992.559 2012 272.3 1,085.250 43,307.069 196,276.835 2013 311.2 979.669 50,560.116 182,616.380 2014 350.1 501.485 58,103.541 96,332.674 2015 389 0 65,940.871 0 2016 389 0 67,346.289 0 2017 389 0 68,778.950 0 2018 389 0 70,235.248 0 2019 389 0 71,722.395 0 2020 389 0 73,242.394 0 2021 389 0 74,806.062 0 2022 389 0 76,418.206 0 2023 389 0 78,070.815 0 2024 389 0 79,765.890 0 2025 389 0 81,500.227 0 2026 389 0 83,283.441 0 2027 389 0 85,123.946 0 2028 389 0 87,008.520 0 2029 389 0 88,937.966 0 2030 389 0 90,908.275 0 2031 389 0 92,929.064 0 2032 389 0 95,007.945 0 2033 389 0 97,136.104 0 2034 389 0 99,307.932 0 2035 389 0 101,517.820 0
Table 4 gives the employment and capital costs over the construction and O&M phases. The construction phase begins in 2004 with the construction of the first plant and ends in 2014 with the completion of the tenth plant. Direct employment peaks in 2006 when the second and third plants are under construction. Cost savings from learning acts to lower
Direct FTE and Capital Costs for Co
0 0 7
14 21 28 35 42 49 56 63 70 70 70 70 70 70 70 70 70 70 70 70 70 70 70 70 70 70 70 70 70

13
labor costs and corresponding FTE so that direct construction employment falls modestly over time. , direct employment falls markedly to 459 jobs per year. Table 5. Personal Income, and GSP Impacts of Scenario B: Constructing, Operating, and Maintaining Ten 100-MWe CSP Plants in Nevada
Employment
(Thous) Pers Inc
(Bil Nominal $)
GSP (Bil Nominal
$) 2004 0.188 0.2482005 0.376 0.4632006 0.383 0.4332007 0.377 0.4022008 0.368 0.3792009 0.357 0.3612010 0.349 0.3532011 0.345 0.3522012 0.344 0.3562013 0.347 0.3652014 0.275 0.2832015 0.189 0.1942016 0.187 0.2052017 0.194 0.2192018 0.203 0.2322019 0.214 0.2442020 0.225 0.2562021 0.235 0.2652022 0.244 0.2732023 0.253 0.2802024 0.261 0.2862025 0.269 0.2912026 0.277 0.2962027 0.285 0.3002028 0.294 0.3042029 0.302 0.3072030 0.311 0.3102031 0.321 0.3132032 0.333 0.3172033 0.344 0.3192034 0.356 0.3222035 0.369 0.325
When the construction phase ends
Employment,
3.83 6.94 6.11 5.35 4.74 4.25 3.89 3.65 3.50 3.43 2.26 1.09 1.26 1.44 1.60 1.73 1.84 1.91 1.96 1.99 2.00 2.00 1.99 1.97 1.95 1.92 1.88 1.84 1.81 1.76 1.72 1.68

Capital costs parallel the employment trends. Capital spending is highest during the early years of the construction phase before cost savings from learning and economies of scale set in. Direct construction-capital spending ranges from a high of $2.2 billion in 2005 to a low of $501 million in the last year of construction, 2014. Capital cost are still substantial in the O&M phase, averaging $82 million. As in Scenario A, capital costs are assumed to grow with the rate of general-price inflation.
Economic Impacts
The total economic impact on the state of Nevada from constructing, operating, and maintaining ten 100-MWe CSP facilities are given in Table 5 and Figures 4 through 6.
Employment. Table 5 and Figure 4 give the employment impacts of Scenario B. Employment impacts are largest during the early years of the construction phase. Initial employment impact is 3,830 jobs in the first year of construction, rising quickly to a peak of over 6,940 jobs in 2005. Employment impacts taper off after that point as construction costs, including labor costs fall in response to learning savings and economies of scale.
Unlike the one-plant scenario A, O&M employment impacts are significant. The first year post construction enjoys direct, indirect, and induced employment impacts of 1,090 jobs. The number falls modestly, mainly as a result of the downturn from the end of construction cycle, but the employment impact quickly revives. By 2025, nearly 2,000 jobs are created over and above the baseline forecast for that year. Over the O&M phase, employment impacts average 1,800 jobs. Direct O&M jobs total 459, suggesting an employment multiplier of 3.9 during the O&M phase of the facility.
1,000 MWe: 10 Concentrating Solar Power Plants Employment Impact: Construction and O&M Phases
State of Nevada 2004 - 2035
0.0
1.0
2.0
3.0
4.0
5.0
6.0
7.0
8.0
2004 2006 2008 2010 2012 2014 2016 2018 2020 2022 2024 2026 2028 2030 2032 2034
Thousands of Jobs
Figure 4. Employment Impact on the State of Nevada of Scenario B: Constructing, Operating, and Maintaining Ten 100-MWe CSP Generation Facilities
14

Personal Income. Table 5 and Figure 6 give the personal-income impacts from Scenario B on the state of Nevada. The personal income impact climbs from $188 million in 2004 to over $383 million at the peak of construction in 2006. Impacts fall off and drop to just under $200 million annually after the construction phase ends.
O&M personal impacts for the 10-plant scenario are significant. Impacts climb steadily throughout the O&M phase from just under $189 million in 2015 to $369 million in 2035. Much of the increase can be attributed to general-price inflation. But, the average growth rate of 4 percent is well in excess of the average general-price inflation rate forecast rate of 2.2 percent.
1,000 MWe: 10 Concentrating Solar Power Plants Personal Income Impact: Construction and O&M Phases
State of Nevada 2004 - 2035
0.00
0.05
0.10
0.15
0.20
0.25
0.30
0.35
0.40
2004 2006 2008 2010 2012 2014 2016 2018 2020 2022 2024 2026 2028 2030 2032 2034
Billions of Dollars
Figure 5. Personal-Income Impact on the State of Nevada of Scenario B: Constructing, Operating and Maintaining Ten 100-MWe CSP Generation Facilities
15

1,000 MWe: 10 Concentrating Solar Power Plants Gross State Product Impact: Construction and O&M Phases
State of Nevada 2004 - 2035
0.00
0.05
0.10
0.15
0.20
0.25
0.30
0.35
0.40
0.45
0.50
2004 2006 2008 2010 2012 2014 2016 2018 2020 2022 2024 2026 2028 2030 2032 2034
Billions of Dollars
Figure 6. GSP Impact on the State of Nevada of Scenario B: Constructing, Operating, and Maintaining Ten 100-MWe CSP Generation Facilities
Gross State Product. The pattern of GSP impacts is in line with that of employment and personal income. The construction phase contributes considerable economic benefit to Nevada: at its peak, GSP impacts from Scenario B inject $463 million into the Nevada economy. Over the construction phases, GSP impacts average $349 million annually. The total economic impact, in terms of GSP, in the construction phase is $3.99 billion.
Like employment and income, the O&M phase also offers a substantial source of economic growth for Nevada. GSP impacts total $5.86 billion in the 22 years of full operation, 2014-2035. The average annual GSP impact is $283 million over that same period.
VI. SCENARIO C
The Renewable Portfolio Standard (RPS) was part of the 1997 Electric Restructuring Legislation passed by the Nevada Legislature. The goal of the RPS was to increase the use of renewable energy in Nevada. Electric providers within the state were required to acquire renewable-electric generation or purchase renewable-energy credits representing 1 percent of total consumption. The law was revised June 8, 2001. The revised law, purported to be the most aggressive RPS in the country, requires a steady shift toward renewable generation through 2013. The law requires renewable energy generation to increase by five percent by 2003, seven percent by 2005, nine percent by 2007, eleven percent by 2009, thirteen percent by 2011, culminating in a fifteen percent increase by 2013.
16

The third and final scenario links economic impact of CSP-generation development to RPS requirements. We ask: What is the economic impact of constructing enough CSP-generation capacity to meet approximately 2/3 of the Nevada’s long-term RPS requirement of 15 percent of total generation from investor-owned utilities?
First, we must estimate how much solar power generation must increase to meet 10 percent (or 2/3 of the fifteen percent) required by the RPS. We estimate that 29,000 GWH of electricity will be generated in Nevada in 2003. Therefore, meeting the RPS requirement would mean generating 2,900 gigawatt hours (GWH) using CSP technology. Generating this much electricity would require constructing 290 MWe of new generation capacity. We assume that three 100-MWe plants will meet this goal. Therefore, Scenario C represents an intermediate case between scenarios A and B.
Our assumptions under Scenario C are modeled after those in B. The major difference is that three plants, rather than 10, are constructed under Scenario C. The plants have a two-tear build cycle, with new plants beginning construction in 2004, 2005, and 2006. All construction is complete by 2008.
Construction and O&M Direct Costs
We assume that learning and economies of scale in Scenario C affect costs at the same rate as in Scenario B. Namely, each successive plant enjoys 10 percent lower capital and labor construction costs than its predecessor. Table 6 offers a tally of capital and labor costs for the construction and O&M phases from 2004 through 2035. Employment cost is translated into FTE using REMI industry wages as in Scenario B.
17

18
Table 6. Direct FTE and Capital Costs for Scenario C: Constructing, Operating, and Maintaining Three 100-MWe CSP Facilities in Nevada
Year
O&M Technical
FTE
O&M Administrative
FTE Construction
FTE
O&M Capital ($000)
Construction Capital ($000)
2004 0 0.00 171,899.65 1,230.34 2005 0 0.00 329,727.08 2,283.78 2006 38.9 5,471.92 305,887.65 2,049.62 2007 77.8 11,163.14 150,762.59 977.60 2008 116.7 17,081.84 0.00 0.00 2009 116.7 17,428.35 0.00 0.00 2010 116.7 17,787.11 0.00 0.00 2011 116.7 18,169.08 0.00 0.00 2012 116.7 18,560.17 0.00 0.00 2013 116.7 18,960.04 0.00 0.00 2014 116.7 19,367.85 0.00 0.00 2015 116.7 19,782.26 0.00 0.00 2016 116.7 20,203.89 0.00 0.00 2017 116.7 20,633.68 0.00 0.00 2018 116.7 21,070.57 0.00 0.00 2019 116.7 21,516.72 0.00 0.00 2020 116.7 21,972.72 0.00 0.00 2021 116.7 22,441.82 0.00 0.00 2022 116.7 22,925.46 0.00 0.00 2023 116.7 23,421.24 0.00 0.00 2024 116.7 23,929.77 0.00 0.00 2025 116.7 24,450.07 0.00 0.00 2026 116.7 24,985.03 0.00 0.00 2027 116.7 25,537.18 0.00 0.00 2028 116.7 26,102.56 0.00 0.00 2029 116.7 26,681.39 0.00 0.00 2030 116.7 27,272.48 0.00 0.00 2031 116.7 27,878.72 0.00 0.00 2032 116.7 28,502.38 0.00 0.00 2033 116.7 29,140.83 0.00 0.00 2034 116.7 29,792.38 0.00 0.00 2035 116.7 30,455.35 0.00 0.00
0 0 7
14 21 21 21 21 21 21 21 21 21 21 21 21 21 21 21 21 21 21 21 21 21 21 21 21 21 21 21 21

19
Economic Impacts The total economic impact on the state of Nevada from constructing, operating, and maintaining three 100-MWe CSP facilities are given in Table 7 and Figures 7 through 9. Employment. Table 7 and Figure 7 give the sum of the direct, indirect, and induced employment impacts from building three 100-MWe plants in the state. s in Scenario B, employment impacts peak early in the construction phase. ay be attributed to the construction of the facilities. e average annual employment impact over the construction phase is 4,900 jobs. Table 7. Personal Income, and GSP Impacts of Scenario C: Constructing, Operating, and Maintaining Three 100-MWe CSP Plants in Nevada
Year Employment
(Thous)
Pers Inc (Bil Nominal
$)
GSP (Bil Nominal
$) 2004 0.188 0.2482005 0.376 0.4632006 0.383 0.4332007 0.232 0.2182008 0.068 0.0232009 0.048 0.0222010 0.040 0.0272011 0.039 0.0352012 0.042 0.0442013 0.047 0.0522014 0.052 0.0602015 0.059 0.0662016 0.064 0.0722017 0.069 0.0762018 0.073 0.0802019 0.076 0.0822020 0.078 0.0842021 0.080 0.0862022 0.081 0.0872023 0.083 0.0892024 0.085 0.0902025 0.087 0.0912026 0.090 0.0922027 0.093 0.0932028 0.097 0.0932029 0.100 0.0942030 0.103 0.094
AIn 2005, nearly 7,000 jobs mTh
Employment,
3.832 6.938 6.105 2.679
-0.272 -0.234 -0.104 0.044 0.190 0.323 0.434 0.520 0.584 0.629 0.657 0.674 0.681 0.685 0.685 0.681 0.674 0.665 0.654 0.641 0.625 0.607 0.587

2031 0.569 0.106 0.095 2032 0.551 0.110 0.095 2033 0.533 0.115 0.096 2034 0.515 0.118 0.096 2035 0.499 0.122 0.097
Three 100-MWe Concentrating Solar Power Plants Employment Impact: Construction and O&M Phases
State of Nevada Thousands of 2004 - 2035
Jobs
8.0
7.0
6.0
5.0
4.0
3.0
2.0
1.0
0.0
-1.0 2004 2006 2008 2010 2012 2014 2016 2018 2020 2022 2024 2026 2028 2030 2032 2034
Figure 7. Employment Impact on the State of Nevada of Scenario C: Constructing, Operating, and Maintaining Three 100-MWe CSP Generation Facilities
With the end of construction in 2008, the decline in employment opportunity has a short-lived contractionary impact on the Nevada labor market. As a result, the employment impact is negative for three years following the end of the construction phase. The labor market quickly picks up, however, and by 2020, over 680 jobs can be ascribed to direct, indirect, and induced impacts from the three plants’ operations. The average employment impact over the O&M phase is 475 jobs.
Personal Income. Table 7 and Figure 8 give personal-income impacts from the three 100MWe Scenario 3. Average annual personal income exceeds the baseline forecast by $295 million during the construction phases and $79.5 million during the O&M phase. Taken together, the construction and O&M for the three plants injects $3.4 billion into the Nevada economy from 2004 through 2035.
Gross State Product. Table 7 and Figure 9 give the GSP impacts of the three-plant Scenario C. Much like Scenario A, the lion’s share of the GSP lift comes during the construction phase. From 2004 through 2007, construction and subsequent operation of the three facilities inject over $340 million into the Nevada economy. The total economic impact, in terms of GSP during the construction phase amounts to $1.36 billion.
20

Economic impacts during the O&M phase are smaller, but still significant. On average, operating and maintaining the facilities account for $75 million through direct, indirect, and induced economic activity. The total GSP injection during the O&M phase is $2.1 billion. In sum, construction and O&M of the three-plant scenario lead to increased spending activity of $3.47 billion.
Three 100-MWe Concentrating Solar Power Plants Personal Income Impact: Construction and O&M Phases
State of Nevada 2004 - 2035
0.00
0.05
0.10
0.15
0.20
0.25
0.30
0.35
0.40
0.45
2004 2006 2008 2010 2012 2014 2016 2018 2020 2022 2024 2026 2028 2030 2032 2034
Billions of Dollars
Figure 8. Personal Income Impact on State of Nevada of Scenario C: Constructing, Operating, and Maintaining Three 100-MWe CSP Generation Facilities
Three 100-MWe Concentrating Solar Power Plants Gross State Product Impact: Construction and O&M Phases
State of Nevada 2004 - 2035
0.00
0.05
0.10
0.15
0.20
0.25
0.30
0.35
0.40
0.45
0.50
2004 2006 2008 2010 2012 2014 2016 2018 2020 2022 2024 2026 2028 2030 2032 2034
Billions of Dollars
Figure 9. Gross State Product Impact on State of Nevada of Scenario C: Constructing, Operating, and Maintaining Three 100-MWe CSP Generation Facilities
21

VII. CONCLUSION
This report provides an assessment of the potential economic impact of three levels of developing Nevada’s solar power resource. We show that the economic benefits can be significant, particularly if multiple plants are considered. In the most conservative one-plant Scenario A, total personal income in Nevada attributable to the construction phase (2004 through 2006) and the O&M phase (2007 through 2035) is estimated to be $1.15 billion. GSP will be boosted by $1.14 billion. If approximately 2/3 of the Nevada RPS is met with CSP generation, the state can expect additional personal income and GSP of $3.41 and $3.47, respectively. At the largest investment level, Scenario B, ten 100-MWe plants would be constructed. Direct, induced, and indirect benefits in terms of personal income and GSP would reach $9.37 and $9.85, respectively.
We limited this study to an examination of the tangible benefits of moving toward renewable-power generation. Nevertheless, the intangible benefits of improving air quality and reducing the threat of global warming are certainly important. Taken together, the tangible and intangible benefits to the state make CSP generation an attractive option.
Another factor to consider is the regional economic development potential of CSP generation in rural Nevada. The CSP-generation industry could support sustainable economic development in places that are currently seeking opportunities for economic development. New jobs in the relatively highly paid utility industry could provide a core of income for counties that are fast losing traditional income sources such as mining.
22

REFERENCES
Mary Riddel and R. Keith Schwer. 2003. “The Potential Economic Impact of Nevada’s Renewable Energy Resources,” Research Paper, Center for Business and Economic Research, University of Nevada, Las Vegas.
Sargent and Lundy Consulting Group, LLC. 2002. “Draft Assessment of Parabolic Trough and Power Tower Solar Technology Cost and Performance Forecasts.”
George Treyz. 1993. “Regional Economic Modeling: A Systematic Approach to Economic Forecasting and Policy Analysis,” Kluwer Aceademic Press, Norwell, MA.
23

REPORT DOCUMENTATION PAGE Form Approved OMB NO. 0704-0188
Public reporting burden for this collection of information is estimated to average 1 hour per response, including the time for reviewing instructions, searching existing data sources, gathering and maintaining the data needed, and completing and reviewing the collection of information. Send comments regarding this burden estimate or any other aspect of this collection of information, including suggestions for reducing this burden, to Washington Headquarters Services, Directorate for Information Operations and Reports, 1215 Jefferson Davis Highway, Suite 1204, Arlington, VA 22202-4302, and to the Office of Management and Budget, Paperwork Reduction Project (0704-0188), Washington, DC 20503.
1. AGENCY USE ONLY (Leave blank) 2. REPORT DATE February 2004
3. REPORT TYPE AND DATES COVERED Subcontract report
4. TITLE AND SUBTITLE The Potential Economic Impact of Constructing and Operating Solar Power Generation Facilities in Nevada
5. FUNDING NUMBERS
ACX-3-33466-01 CP03.2000
6. AUTHOR(S) R. K. Schwer and M. Riddel
7. PERFORMING ORGANIZATION NAME(S) AND ADDRESS(ES) Center for Business and Economic Research, University of Nevada Las Vegas, Nevada
8. PERFORMING ORGANIZATION REPORT NUMBER
9. SPONSORING/MONITORING AGENCY NAME(S) AND ADDRESS(ES) National Renewable Energy Laboratory 1617 Cole Blvd. Golden, CO 80401-3393
10. SPONSORING/MONITORING AGENCY REPORT NUMBER NREL/SR-550-35037
11. SUPPLEMENTARY NOTES
NREL Technical Monitor: Mark Mehos 12a. DISTRIBUTION/AVAILABILITY STATEMENT
National Technical Information Service U.S. Department of Commerce 5285 Port Royal Road Springfield, VA 22161
12b. DISTRIBUTION CODE
13. ABSTRACT (Maximum 200 words)
Nevada has a vast potential for electricity generation using solar power. An examination of the stock of renewable resources in Nevada proves that the state has the potential to be a leader in renewable-electric generation—one of the best in the world. This study provides estimates on the economic impact in terms of employment, personal income, and gross state product (GSP) of developing a portion of Nevada’s solar energy generation resources.
14. SUBJECT TERMS solar; solar power; electricity generation; renewable energy; renewable resources; concentrating solar collectors (CSP); Nevada
15. NUMBER OF PAGES
16. PRICE CODE
17. SECURITY CLASSIFICATION OF REPORT Unclassified
18. SECURITY CLASSIFICATION OF THIS PAGE Unclassified
19. SECURITY CLASSIFICATION OF ABSTRACT Unclassified
20. LIMITATION OF ABSTRACT
UL
NSN 7540-01-280-5500 Standard Form 298 (Rev. 2-89) Prescribed by ANSI Std. Z39-18
298-102