Embed Size (px)
Citation preview

7/2/2014
1
Potential Failure and RCA
Helene Eckrich & Leon Spackman
Potential Failure and Root Cause Analysis: Key Tools to Identify Potential Failures and Solve Problems to Attain High Reliability
Workshop B // March 6, 2014 // 8:15am-noon
Attaining High Reliability and Safety for Patients –
Collaborating for Change. Patient Safety Collective of the
Southwest (PSCS). March 6-7, 2014; Albuquerque, NM
CE Disclosure
In compliance with the ACCME/NMMS Standards for Commercial
Support of CME:
Helene Eckrich, RN, MSN
Leon Spackman, MS
have been asked to advise the audience that each has no relevant
financial relationships to disclose or does have relevant financial
relationships to disclose which they will disclose here.
Attaining High Reliability and Safety for Patients –
Collaborating for Change. Patient Safety Collective of the
Southwest (PSCS). March 6-7, 2014; Albuquerque, NM

7/2/2014
2
Key Tools to Identify Potential Failures and Solve
Problems to Attain High Reliability
Patient Safety Conference March 2014 *
Potential Failure and Root Cause
Analysis
Leon Spackman
PMP, LSS Master Black
Belt
Manager, PMO
TriCore Reference
Laboratories
Helene
Eckrich
RN, MSN
Agenda
*
● Introductions
● What is FMEA?
➢When do you use it?
➢How to use a FMEA worksheet?
➢How do you interpret a FMEA?
➢Pareto Charts--show results
● Root Cause Analysis
➢Develop a Fishbone Diagram
● Summary
Patient Safety Conference March 2014
2

7/2/2014
3
FMEA vs Root Cause Analysis
● FMEA will address risks that have not yet happened
➢Identify potential events that may happen in the
future
➢Identify the effect
➢Prioritize
● Root Cause Analysis will identify the Root Cause of
an event that has already occurred
➢Focus on prevention so it doesn’t happen again
➢Find Root Cause(s) not symptoms
3
Risks in Healthcare
● Medication Errors
● Hospital Infections
● Surgical Errors ➢Wrong patient, wrong site, wrong procedure
➢Retention of foreign bodies
●Delay in Treatment
●Safety Issues (slips, trips, falls)
Costs: $20 Billion - $1 Trillion
Source: The Joint Commission 4

7/2/2014
4
What is FMEA?
*
FMEA--a tool to identify risks in your process ● Can be used in multiple places in process
improvement ➢Determine where problems are ➢Help identify cause/effect relationships ➢Highlight risks in solutions and actions to take
● Starts with input from processes
● Identifies three risk categories ➢Severity of impact ➢Probability of occurrence ➢Ability to detect the occurrence
Patient Safety Conference March 2014 5
When to Use
*
● Early stages (Define) to understand process and identify problem areas
● Analyze data (Analyze) to help identify root causes
● Determine best solutions (Improve) with lowest risk
● Close out stage (Control) to document improvement and identify actions needed to continue to reduce risk
Patient Safety Conference March 2014 6

7/2/2014
5
FMEA Worksheet
*
Process or Product
Name
Prepared by: Page _____ of ______
Person Responsible Date (Orig) ___________ Revised __________
Process
Step
Key
Process
Input
Potential
Failure
Mode
Potential
Failure Effect
Sev Potential Causes Oc
c
Current Controls Det RP
N
Actions
Recommended
Sev Oc
c
Det RP
N
Sev - Severity of the failure (what impact will it have on our process?)
Occ – How likely is the event to occur (probability of occurrence)
Det – How likely can the event be detected in time to do something about it
RPN – Risk Priority Number (multiply Sev, Occ, and Det)
Patient Safety Conference March 2014 7
How To Complete the FMEA
General Suggestions
● Use large white board or flip chart with a
FMEA form drawn on it during the generation
phase
● Focus the team on the specific area of study
(product or process)
● Have process map available
● Have all subassemblies and component part
of a product
* Patient Safety Conference March 2014 8

7/2/2014
6
Process Mapping
● Before we can identify risk (FMEA)
or Root Causes, we must understand
and define our process
● Mapping provides a clear, visual way
to examine processes
● Helps identify redundancies, waste,
and weaknesses
9
Why Map Processes?
The way it really functions.
What the customer expects, and is willing to pay for.
The way you think it is.
10

7/2/2014
7
Process Symbols
Boundary
Task
Decision
Embedded Process
Reference Document
Multiple Documents
Connector
Data Base
1
1
Putting It All Together
No
Yes
Data
Base
12

7/2/2014
8
Process to Change Oil in a Car
*
5000
miles
driven
Drive car
on lift
Fill with
new oil
Drain Oil Replace
Filter
Take Car
off lift Process
Complete
Patient Safety Conference March 2014
Sele
ct Oil
Get
Correct
Oil
Wrong
13
How to Complete the FMEA
*
Step 1. Complete header information
Step 2. Identify steps in the process
Step 3. Brainstorm potential ways the area of
study could
theoretically fail (failure modes)
Patient Safety Conference March 2014 14

7/2/2014
9
FMEA Worksheet
*
Process or Product
Name
Change Oil in Car Prepared by: Leon Page _1____ of __1____
Person Responsible Leon Mechanic Date (Orig) __6 March 2014 __________
Process
Step
Key
Process
Input
Potential
Failure
Mode
Potential
Failure Effect
Sev Potential
Causes
Oc
c
Current Controls Det RP
N
Actions
Recommended
Sev Oc
c
Det RP
N
Fill with new oil
New Oil—Mechanic
Wrong type of oil
Engine wear
No oil added
Engine Failure
Sev - Severity of the failure (what impact will it have on our process?)
Occ – How likely is the event to occur (probability of occurrence)
Det – How likely can the event be detected in time to do something about it
RPN – Risk Priority Number (multiply Sev, Occ, and Det)
Patient Safety Conference March 2014 15
How to Complete the FMEA
Step 4
● For each failure mode, determine impact or
effect on the product or operation using criteria
table (next slide)
● Rate this impact in the column labeled SEV
(severity)
* Patient Safety Conference March 2014 16

7/2/2014
10
Severity (SEV) Rating
SEV Severity Product/Process Criteria
1 None No effect
2 Very Minor Defect would be noticed by most discriminating customers. A portion of the product may have to be reworked on line but out of station
3 Minor Defect would be noticed by average customers. A portion of the product (<100%) may have to be reworked on line but out of station
4 Very Low Defect would be noticed by most customers. 100% of the product may have to be sorted and a portion (<100%) reworked
5 Low Comfort/convenience item(s) would be operable at a reduced level of performance. 100% of the product may have to be reworked
6 Moderate Comfort/convenience item(s) would be inoperable. A portion (<100%) of the product may have to be scrapped
7 High Product would be operable with reduced primary function. Product may have to be sorted and a portion (<100%) scrapped.
8 Very High Product would experience complete loss of primary function. 100% of the product may have to be scrapped
9 Hazardous Warning
Failure would endanger machine or operator with a warning
10 Hazardous w/out Warning
Failure would endanger machine or operator without a warning
* Patient Safety Conference March 2014 17
FMEA Worksheet
*
Process or Product
Name
Change Oil in Car Prepared by: Leon Page _____ of ______
Person Responsible Leon Mechanic Date (Orig) __6 March 2014___ Revised __________
Process
Step
Key
Process
Input
Potential
Failure
Mode
Potential
Failure Effect
Sev Potential
Causes
Oc
c
Current Controls Det RP
N
Actions
Recommended
Sev Oc
c
Det RP
N
Fill with new oil
New Oil—Mechanic
Wrong type of oil
Engine wear
2
No oil added
Engine Failure
10
Sev - Severity of the failure (what impact will it have on our process?)
Occ – How likely is the event to occur (probability of occurrence)
Det – How likely can the event be detected in time to do something about it
RPN – Risk Priority Number (multiply Sev, Occ, and Det)
Patient Safety Conference March 2014 18

7/2/2014
11
How to Complete the FMEA
Step 5
● For each potential failure mode identify one or
more potential causes
● Rate the probability of each potential cause
occurring based on criteria table (next slide)
● Place the rating in the column labeled OCC
(occurrence).
* Patient Safety Conference March 2014 19
FMEA Occurrence (OCC Rating)
OCC Occurrence Criteria
1 Remote 1 in 1,500,000 Very unlikely to occur
2 Low 1 in 150,000
3 Low 1 in 15,000 Unlikely to occur
4 Moderate 1 in 2,000
5 Moderate 1 in 400 Moderate chance to occur
6 Moderate 1 in 80
7 High 1 in 20 High probability that the event will occur
8 High 1 in 8
9 Very High 1 in 3 Almost certain to occur
10 Very High > 1 in 2
* Patient Safety Conference March 2014 20

7/2/2014
12
FMEA Worksheet
*
Process or Product
Name
Change Oil in Car Prepared by: Leon Page _____ of ______
Person Responsible Leon Mechanic Date (Orig) __6 March 2014___ Revised __________
Process
Step
Key
Process
Input
Potential
Failure
Mode
Potential
Failure Effect
Sev Potential
Causes
Oc
c
Current Controls Det RP
N
Actions
Recommended
Sev Oc
c
Det RP
N
Fill with new oil
New Oil—Mechanic
Wrong type of oil
Engine wear
2 Mis-labeled 3
No oil added
Engine Failure
10 Hurrying 3
Sev - Severity of the failure (what impact will it have on our process?)
Occ – How likely is the event to occur (probability of occurrence)
Det – How likely can the event be detected in time to do something about it
RPN – Risk Priority Number (multiply Sev, Occ, and Det)
Patient Safety Conference March 2014 21
How to Complete the FMEA
Step 6
● Identify current controls or detection
● Rate ability of each current control to prevent or
detect the failure mode once it occurs using
criteria table (next slide)
● Place rating in DET column
* Patient Safety Conference March 2014
22

7/2/2014
13
FMEA Detection (DET) Rating
DET Detection Criteria
1 Almost Certain
Current Controls are almost certain to detect/prevent the failure mode
2 Very High Very high likelihood that current controls will detect/prevent the failure mode
3 High High Likelihood that current controls will detect/prevent the failure mode
4 Mod. High Moderately High likelihood that current controls will detect/prevent the failure mode
5 Moderate High Likelihood that current controls will detect/prevent the failure mode
6 Low Low likelihood that current controls will detect/prevent failure mode
7 Very Low Very Low likelihood that current controls will detect /prevent the failure mode
8 Remote Remote likelihood that current controls will detect/prevent the failure mode
9 Very Remote Very remote likelihood that current controls will detect/prevent the failure mode
* Patient Safety Conference March 2014 23
FMEA Worksheet
*
Process or Product
Name
Change Oil in Car Prepared by: Leon Page _____ of ______
Person Responsible Leon Mechanic Date (Orig) __6 March 2014___ Revised __________
Process
Step
Key
Process
Input
Potential
Failure
Mode
Potential
Failure
Effect
S
e
v
Potential Causes Oc
c
Current Controls Det RPN Actions
Recommended
Sev Oc
c
Det RP
N
Fill with new oil
New Oil from supplier
Wrong type of oil
Engine wear 2 Misread oil chart for vehicle
3 None 9
No oil added
Engine Failure
10 Hurrying 3 Engine light 3
Sev - Severity of the failure (what impact will it have on our process?)
Occ – How likely is the event to occur (probability of occurrence)
Det – How likely can the event be detected in time to do something about it
RPN – Risk Priority Number (multiply Sev, Occ, and Det)
Patient Safety Conference March 2014 24

7/2/2014
14
How to Complete the FMEA
Step 7 Multiply SEV, OCC and DET ratings and place the value in the RPN (risk priority number) column. The largest RPN numbers should get the greatest focus. For those RPN numbers which warrant corrective action, recommended actions and the person responsible for implementation should be listed.
Process
Step
Key
Process
Input
Potential
Failure
Mode
Potential
Failure
Effect
Sev Potential
Causes
Occ Current
Controls
Det RPN Actions
Recommended
Sev Occ Det RPN
Fill with new oil
New Oil from supplier
Wrong type of oil
Engine wear
2 Misread oil chart for vehicle
3 None 9 54
No oil added
Engine Failure
10 Hurrying 3 Engine light 3 90
*
SEV * OCC * DET = RPN ( 2 * 3 * 9 = 54 )
Patient Safety Conference March 2014 25
FMEA Rankings
Severity Occurrence Detection
Hazardous without warning
Very high and almost inevitable
Cannot detect or detection with very low probability
Loss of primary function
High repeated failures Remote or low chance of detection
Loss of secondary function
Moderate failures Low detection probability
Minor defect Occasional failures Moderate detection probability
No effect Failure Unlikely Almost certain detection
*
Rating
10
1
High
Low Source: The Black Belt Memory Jogger, Six Sigma Academy
Patient Safety Conference March 2014 26
7/2/2014
15
Action Results
*
Step 8
● After corrective action has been taken, place
summary of the results in the ‘Actions
Recommended’ block
● Assign new value for: ➢Severity
➢Occurrence
➢Detection
● Calculate new RPN number
Patient Safety Conference March 2014 27
FMEA Worksheet
*
Process or Product
Name
Change Oil in Car Prepared by: Leon Page _____ of ______
Person Responsible Leon Mechanic Date (Orig) __6 March 2014___ Revised __________
Process
Step
Key
Process
Input
Potential
Failure
Mode
Potential
Failure Effect
Sev Potential
Causes
Oc
c
Current Controls Det RPN Actions
Recommended
Sev Occ Det RP
N
Fill with new oil
New Oil from supplier
Wrong type of oil
Engine wear 2 Misread oil chart for vehicle
3 None 9 54
No oil added
Engine Failure
10 Hurrying 3 Engine light 3 90 Oil level checked by partner
10 3 1 30
Sev - Severity of the failure (what impact will it have on our process?)
Occ – How likely is the event to occur (probability of occurrence)
Det – How likely can the event be detected in time to do something about it
RPN – Risk Priority Number (multiply Sev, Occ, and Det)
Patient Safety Conference March 2014 28

7/2/2014
16
FMEA Example
*
Process or Product Name: Emergency Room Visit (Heart) Prepared by: Page _____ of ______
Person Responsible: Helene Quality Date (Orig) ___________ Revised __________
Process Step Key
Process
Input
Potential Failure
Mode
Potential
Failure Effect
S
e
v
Potential Causes Occ Current
Controls
D
e
t
R
P
N
Actions
Recommended
S
e
v
O
c
c
D
et
RPN
Intake Desk Triage Wrong
Assessment
Wait too long
and have
cardiac arrest
10 Did not recognize
heart attack
symptoms—
unusual
symptoms
2 None 9 180
Diagnosis Triage
nurse
report
Waiting for tests
(Labor EKG)
Cardiac
Arrest
10 Understaffed 4 Staffing
patterns
2 80
Treat-ment Testing Inconclusive
Test Results
Send home
instead of
admit—
Cardiac
Arrest
10 Read wrong
patient test
results
2 When
medical staff
saw correct
patient name
and ID
2 40
Patient Safety Conference March 2014 29
Pareto Chart
*
● Sorted Bar Chart with the bars arranged in descending order from left to right
● Useful in taking a spreadsheet of data and showing which category stands out from the rest.
● Identify where the biggest “pain” occurs in process
● Help determine where to focus our efforts ● Based on 80/20 rule
Patient Safety Conference March 2014 30

7/2/2014
17
Pareto Chart—Example
* Patient Safety Conference March 2014
R
P
N
Nu
m
be
r
31
Pareto Chart Hints
● List categories in descending order on horizontal
line & frequencies on vertical line
● Look for the 80/20 breakpoint
● Break down tall pole into another Pareto Chart for
further analysis
● Involve customer/sponsor in selecting area to
focus on
* Patient Safety Conference March 2014 32

7/2/2014
18
Group Exercise #1
*
● Build a FMEA to identify problem areas to be
addressed in your process (Breast Surgery)
➢Identify process step(s) to analyze
➢Brainstorm for possible failure modes, effects,
causes and detection controls
➢Rate severity, occurrence, and detection
➢Analyze results with a Pareto Chart
● Report to the group
Patient Safety Conference March 2014 33
Out Patient Breast Surgery
*
Patien
t
Arrive
s
Holding
Area
(Prep
Patient)
Anesthesia
Operating
Room
PAC
U
Out Patient
Surgery
Unit
and
Discharge
Go Home
Patient Safety Conference March 2014 34

7/2/2014
19
Summary
*
● FMEA identifies risk in our processes ➢Impact/Severity
➢Probability of Occurrence
➢Detection
● Helps identify what can go wrong and what
we should fix
● Can be used in multiple stages of process
improvement
● Pareto Chart—Measures pain in the process
Patient Safety Conference March 2014 35
Root Cause Analysis

7/2/2014
20
Overview
● What is a root cause analysis?
● Why is it important? ● How do you do it? ● Summary
37
What is Root Cause Analysis
● Event has occurred and we don’t want it to happen again.
● Practice to solve problems by attempting to identify and correct the root causes of events, as opposed to simply addressing their symptoms.
● Studying the process, analyzing all data, and finding the real reason for the failure/event
Source: Wikipedia
38

7/2/2014
21
What is Root Cause Analysis
● Aiming corrective measures at root cause is more effective than merely treating the symptoms of a problem
● Must be performed systematically, and conclusions must be backed up by evidence
● There is usually more than one root cause for any given problem
39
Why Root Cause Analysis
● Solves the problem once and for all at the
place that it occurs
● Focuses on prevention, not detection
● Reduces waste
● Frees personnel to do their jobs--not chase
symptoms
40
7/2/2014
22
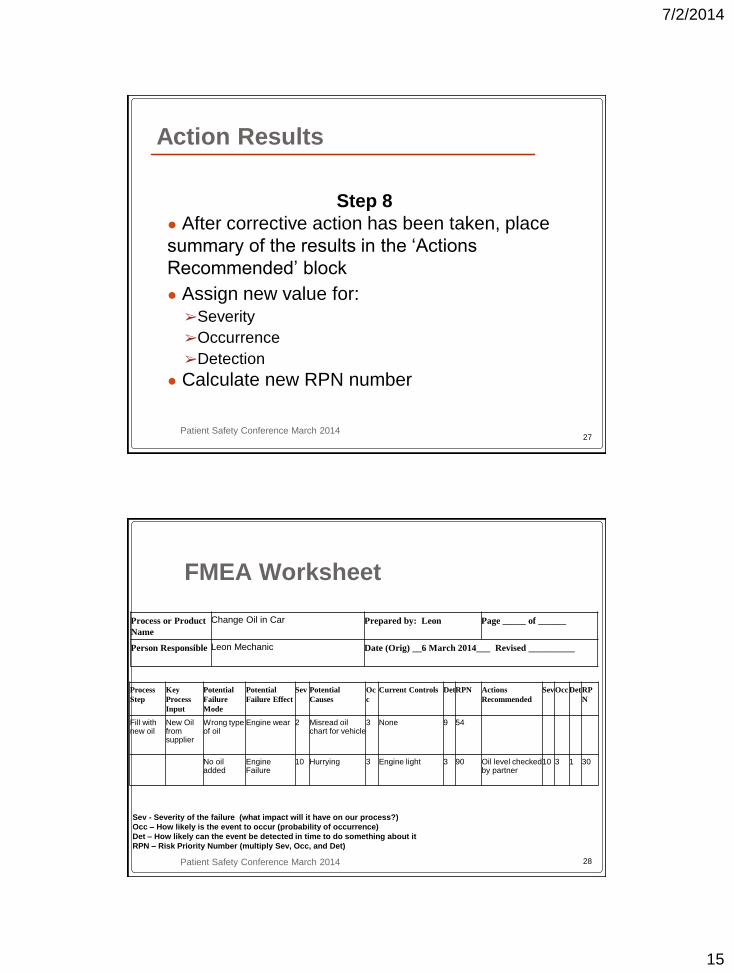
● Solving symptoms not root cause
● Emphasis on action vs. solving problems
● Temporary solutions or symptoms can cause
many more problems & create waste if they
become the “preferred solution”
Band-Aid Fixes
41
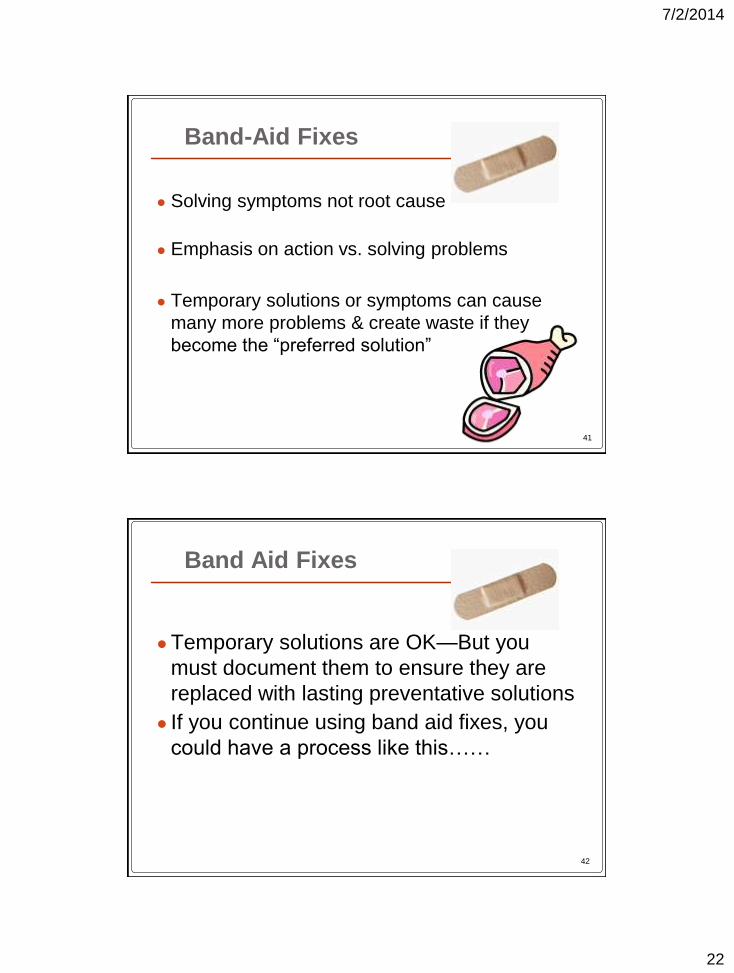
● Temporary solutions are OK—But you
must document them to ensure they are
replaced with lasting preventative solutions
● If you continue using band aid fixes, you
could have a process like this……
Band Aid Fixes
42

7/2/2014
23
Root Cause Analysis
• Understand the process – map it
• Gather data
• Identify possible root causes (the vital
few)
• Tool—Fishbone Diagram • Validate Fishbone Diagram with
data/knowledge • Identify solutions based on root
causes
44

7/2/2014
24
Gather Data
● Collect data about the event that has
occurred
● Analyze the data
● Identify key measures in process
➢How often has event occurred?
➢What is effect of problem?
45
Brainstorming Definition
●Brainstorming is a group
technique for generating
a large quantity of ideas
about a specific topic in
a relatively short period
of time.
46

7/2/2014
25
Brainstorming
● Get as many ideas as you can
● Organize using tools (Pareto Chart)
● Don’t jump to problem solving until you
have identified the root cause
47
● Call out ideas and collect on flip charts ➢Round robin, pass if no idea
➢Anonymously writes on stickies
➢Record every idea in the speaker’s words
● Don’t criticize until after ideas are generated
● Fast pace--fosters high energy and anything
goes atmosphere
● Go for Quantity
● Don’t quit at the first pass; pause; and press
on
Brainstorming
48

7/2/2014
26
“The best way to get a good idea is to get
a lot of ideas.”
-- Linus Pauling
Brainstorming
49
MEASUREMENTS METHODS PEOPLE
ENVIRONMENT TOOLS MATERIALS
(problem to be
analyzed goes
here)
Fishbone
Diagram
Ask “why” each of these
categories affects the problem
When you record a cause, ask
“why” again to identify any sub
causes
50

7/2/2014
27
MEASUREMENTS METHODS PEOPLE
ENVIRONMENT TOOLS MATERIALS
(problem to be
analyzed goes
here)
Fishbone
Diagram
Causes here
Causes here
Sub causes here
51
Group Activity #2
● Build a Fishbone Diagram based on
patient scenario
● Use markers and paper on table
● Determine the root causes for Heparin
Overdose
● Report Out from each group
52

7/2/2014
28
Report Out
● Each group reports outs
● Please be courteous while others
reporting out
53
Solve the Root Cause
● Verify the root cause
● Brainstorm for solutions to problem
● Select “best” solution(s)
● Implement and measure to ensure
improvement
● Monitor and control ➢Policies and Procedures
➢Audits
➢Scorecards
54

7/2/2014
29
Summary: Root Cause Analysis
● What: Studying the process, analyzing all data,
and identify the real reason for the failure/event
● Why do RCA:
➢We often focus on symptoms
➢Need to solve the problem once and for all
➢Gets rid of waste
➢Focuses on prevention not detection
➢Frees up personnel to focus on important tasks
56

7/2/2014
30
Summary
● FMEA
➢Identify Risk
➢Prioritize what has the most effect
● Root Cause
➢Prevent an event from happening again
➢Find the Root Cause not a symptom
● Continuous Improvement
57
Continuous Improvement
*
● Process improvement not a linear process
● Never really ends
● Journey not a destination
Define
Measure
Analyze Improve
Control
Patient Safety Conference March 2014 58

7/2/2014
31
Challenge
*
“We are what we repeatedly do.
Excellence, therefore, is not an
act but a habit.”
-- Aristotle
Patient Safety Conference March 2014 59
Questions?
Helene Eckrich RN, MSN Leon Spackman
Manager, PMO TriCore Reference Laboratories [email protected] (505) 938-8348 (Work) (505) 999-8982 (Cell)
Attaining High Reliability and Safety for Patients –
Collaborating for Change. Patient Safety Collective of the
Southwest (PSCS). March 6-7, 2014; Albuquerque, NM
Sdkljfgaskjfha;hfas;
dhfas;dflknasd;lfks
dfl’kasdf’lasdkjfas;
djfasd’l;fksld/kfj’as
djasd’jasd