Embed Size (px)
Citation preview

Potential Geographic Distribution of the Novel Avian-Origin Influenza A (H7N9) VirusGengping Zhu1*, A. Townsend Peterson2
1 Tianjin Key Laboratory of Animal and Plant Resistance, College of Life Sciences, Tianjin Normal University, Tianjin, China, 2 Biodiversity Institute, University of Kansas,
Lawrence, Kansas, United States of America
Abstract
Background: In late March 2013, a new avian-origin influenza virus emerged in eastern China. This H7N9 subtype virus hassince infected 240 people and killed 60, and has awakened global concern as a potential pandemic threat. Ecological nichemodeling has seen increasing applications as a useful tool in mapping geographic potential and risk of disease transmission.
Methodology/Principals: We developed two datasets based on seasonal variation in Normalized Difference VegetationIndex (NDVI) from the MODIS sensor to characterize environmental dimensions of H7N9 virus. One-third of well-documented cases was used to test robustness of models calibrated based on the remaining two-thirds, and modelsignificance was tested using partial ROC approaches. A final niche model was calibrated using all records available.
Conclusions/Significance: Central-eastern China appears to represent an area of high risk for H7N9 spread, but suitableareas were distributed more spottily in the north and only along the coast in the south; highly suitable areas also wereidentified in western Taiwan. Areas identified as presenting high risk for H7N9 spread tend to present consistent NDVIvalues through the year, whereas unsuitable areas show greater seasonal variation.
Citation: Zhu G, Peterson AT (2014) Potential Geographic Distribution of the Novel Avian-Origin Influenza A (H7N9) Virus. PLoS ONE 9(4): e93390. doi:10.1371/journal.pone.0093390
Editor: Srinand Sreevatsan, University of Minnesota, United States of America
Received October 8, 2013; Accepted March 3, 2014; Published April 1, 2014
Copyright: � 2014 Zhu, Peterson. This is an open-access article distributed under the terms of the Creative Commons Attribution License, which permitsunrestricted use, distribution, and reproduction in any medium, provided the original author and source are credited.
Funding: No current funding sources were specifically designate for this study, however, partial support was from the talent introduction program award to GZin Tianjin Normal University (5RL127). No additional funding was received for this study. The funder had no role in study design, data collection and analysis,decision to publish, or preparation of the manuscript.
Competing Interests: The authors have declared that no competing interests exist.
* E-mail: [email protected]
Introduction
In March and early April 2013, a new avian-origin influenza A
(H7N9) virus emerged in eastern China, this H7N9 is causing
disease in humans. People infected with H7N9 usually showed
symptoms including fever, coughing, and severe acute respiratory
illness, and the virus has now infected at least 240 and killed 60
people in China, causing global concern regarding potential
pandemic threats [1–2]. Since the first case was reported,
researchers focused on improving diagnosis, understanding
location of origin, and methods of cure; however, little is known
about the geographic potential of H7N9 or environmental
correlates of its transmission, except Butler [3] and He and Chen
[4], who presented ideas based on lessons from the previous avian
influenza threat (i.e. H5N1), and Shi [5] and Fang [6], who
mapped the spread potential of H7N9 using spatial regression
method.
The first known human H7N9 infections were reported on 31
March 2013, with two cases in Shanghai and one in the
neighboring province of Anhui. By 22 April 2013, the World
Health Organization (WHO) tallied 104 confirmed cases, over an
expanded area including neighboring Jiangsu and Zhejiang
provinces [3]. Most human H7N9 cases remain concentrated
around Shanghai, but cases have been detected in Beijing in the
north, Henan and Anhui provinces in the interior, and Hunan,
Jiangxi, Fujian and Guangdong provinces in the south (Figure 1).
The source of H7N9 human infections is unclear, but it appears to
be carried by poultry, in their secretions or excretions [7–8].
Ecological niche modeling (ENM) offers a means by which to
characterize environmental conditions suitable for species or
phenomena such as disease transmission, and identify where those
suitable environments are manifested in geographic space [9].
Although applications of ENM to understanding the geography
and ecology of disease transmission are in early stages of
exploration and development, it has been successfully applied to
transmission of several diseases (e.g. [10–11]), including avian
influenza (e.g. H5N1; [12]). This contribution aims to present a
first range-wide ENM-based analysis of H7N9 in China.
Materials and Methods
H7N9 case occurrencesH7N9 cases have been documented in detail since the initiation
of the outbreak; in particular, a real-time H7N9 reporting system
was launched (http://goo.gl/maps/ZsVW8; [1]), from where we
obtained 87 georeferenced occurrences for analysis; an additional
9 points were obtained from the literature or Internet (Table S1 in
Supporting Information). Only the laboratory confirmed cases
were used in this study. The 96 occurrence points varied in terms
of spatial clumping, so we subsampled them to reduce sampling
bias and effects of spatial autocorrelation, as follows. We first
generated models using all available occurrence points, and
PLOS ONE | www.plosone.org 1 April 2014 | Volume 9 | Issue 4 | e93390
measured spatial autocorrelation among model pseudoresiduals (1
– probability of occurrence generated by model) by calculating
Moran’s I at multiple distance classes using SAM v4.0 [13];
significance was determined using permutation tests. A minimum
distance of 13 km was detected, after which we created a grid with
cell dimensions of 0.11760.117u, and selected the occurrence
point closest to the centroid of each grid cell; this procedure
reduced the number of occurrences to 77 points for final model
calibration.
Environmental dataWe sought environmental data that would match the occur-
rence data in spatial resolution and temporal coverage, and
provide a rich characterization of environmental landscapes for
model calibration. The best match was multitemporal Normalized
Difference Vegetation Index (NDVI) data from the MODIS
(Moderate Resolution Imaging Spectroradiometer) satellite. Six-
teen-day NDVI composites were obtained for January 2012 to
June 2013 at a resolution of 1 km2 (http://modis.gsfc.nasa.gov/
data/). We used two approaches by which to reduce dimension-
ality from the initial 34 data layers. The first was to extract the first
10 principal component axes to summarize major axes of variation
among the 34 NDVI layers (97.5% of overall variation); this
dataset captured major dimensions of environmental variation
across eastern China. The second ‘bioNDVI’ was based on all
biweekly images from January 2012 – June 2013, transformed into
data layers parallel to ‘bioclimatic’ variables (i.e. mean, maximum,
minimum, range, and standard deviation) over the entire period,
plus a parallel data set (mean, maximum, minimum, range,
standard deviation) over spring 2013 (March-May) only, the
period which we believe most relevant to the H7N9 outbreak.
Ecological niche modelingWe used a maximum entropy algorithm (Maxent; [14]) to
estimate an ecological ‘niche’ for H7N9 virus. Maxent follows the
principle of maximum entropy, spreading out probabilities as
uniformly as possible, subjects to the constraints of observed values
(i.e. known occurrences). We thresholded model predictions to
produce binary maps by assessing the highest suitability value at
which 90% of input occurrence points were included in the
predicted suitable area (i.e. Maxent’s 10% training presence
threshold). This approach is conservative in estimating ecological
niches, as it eliminates extreme values that may result from
erroneous identifications or georeferencing [15].
To evaluate niche models, we used a spatial subsetting approach
to erect a rigorous test of model predictions: we sorted occurrences
by latitude and separately by longitude, and set aside the central
third as evaluation data, using the remaining two-thirds for model
calibration. Hence, we developed two evaluation data sets (i.e.
subsetting by latitude and subsetting by longitude) for models
produced in relation to the two NDVI datasets, for a total of four
tests. Significance was assessed by means of a cumulative binomial
test, comparing success in anticipating the spatial distribution of
known occurrences against null expectations based on the
proportional area identified as suitable. A final niche model was
calibrated using all of the 77 records.
Results
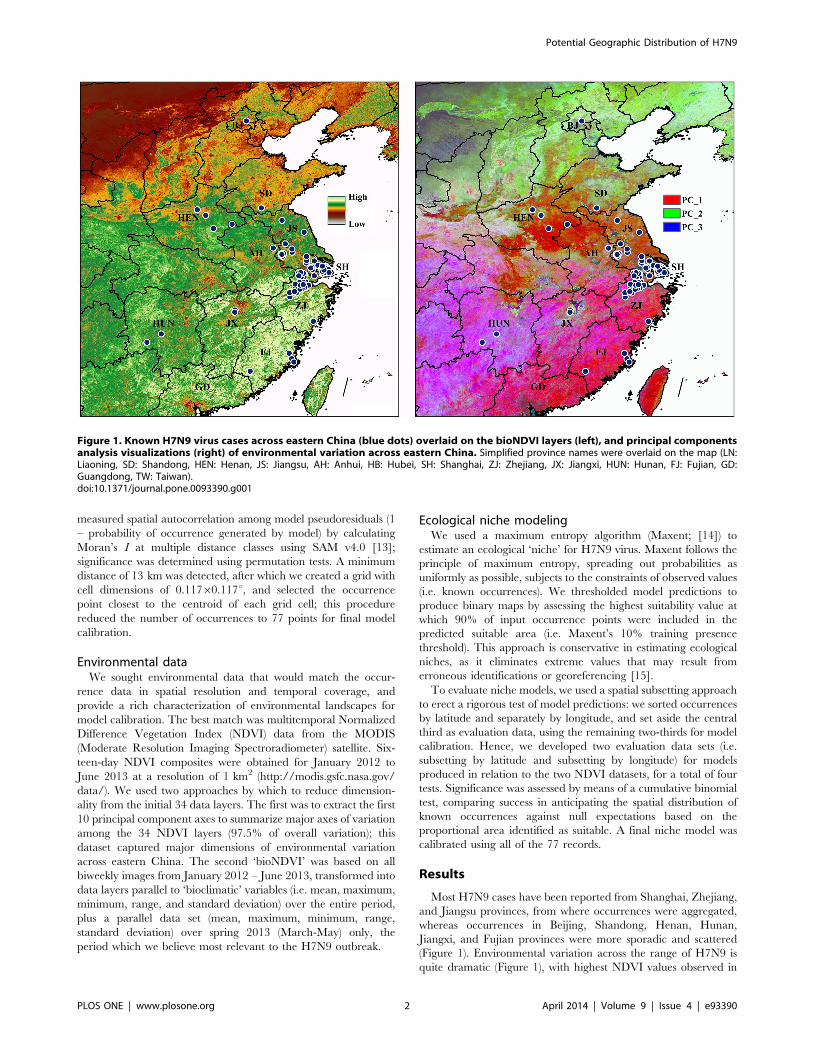
Most H7N9 cases have been reported from Shanghai, Zhejiang,
and Jiangsu provinces, from where occurrences were aggregated,
whereas occurrences in Beijing, Shandong, Henan, Hunan,
Jiangxi, and Fujian provinces were more sporadic and scattered
(Figure 1). Environmental variation across the range of H7N9 is
quite dramatic (Figure 1), with highest NDVI values observed in
Figure 1. Known H7N9 virus cases across eastern China (blue dots) overlaid on the bioNDVI layers (left), and principal componentsanalysis visualizations (right) of environmental variation across eastern China. Simplified province names were overlaid on the map (LN:Liaoning, SD: Shandong, HEN: Henan, JS: Jiangsu, AH: Anhui, HB: Hubei, SH: Shanghai, ZJ: Zhejiang, JX: Jiangxi, HUN: Hunan, FJ: Fujian, GD:Guangdong, TW: Taiwan).doi:10.1371/journal.pone.0093390.g001
Potential Geographic Distribution of H7N9
PLOS ONE | www.plosone.org 2 April 2014 | Volume 9 | Issue 4 | e93390

southern China; the independent variation in the principal
components can be appreciated in Figure 1.
In model evaluations, our niche models showed good perfor-
mance in anticipating the spatial distribution of independent
testing records in three of the four tests (P,0.05; Table 1; Figure 2).
Omission rates in models with longitude-based subsetting were
higher than in models with latitude-based subsetting (Table 1),
which might result from the broader geographic spread in
longitude (Figure 2). In final model predictions, environmental
variables with highest gain [14] in isolation were principal
component 5 and standard deviation of the entire period;
environmental variables that decreased gain most when omitted
were principal component 1 and standard deviation of the entire
period.
In final models, models based on both environmental datasets
identified a particularly suitable zone in east-central China,
including Shanghai, Zhejiang, southern Jiangsu, northwestern
Fujian and Jiangxi, and parts of Anhui provinces (Figure 3). The
model based on the ‘bioNDVI’ dataset was somewhat more
conservative in predictions. Hubei Province was identified as
highly suitable, although no H7N9 cases have been reported there
(Figure 3). Suitable areas in the north were distributed less
continuously, whereas suitable areas in the south were only along
the coast. Western Taiwan was also identified as highly suitable by
models based on both environmental datasets (Figure 3).
Attempting to visualize conditions under which models identi-
fied suitability, suitable areas tended to present conditions that
were generally constant through the year (i.e. not much seasonal
variation), with only gentle seasonal fluctuations. Unsuitable areas,
in contrast, showed much more seasonal variation: NDVI values
rose sharply in June–August and declined during September–
December (Figure 4).
Discussion
Limitations on the materials employed in this study have to be
addressed here. The general distributional pattern of H7N9 has
not been understood in detail to date, such that the distributional
pattern so far has manifested sporadic and small clusters (Figure 1).
Knowledge about the main virus reservoirs and the extent and
distribution of the virus in animals remains limited, in spite of
considerable efforts (e.g. [8]), it is likely that most human cases
were exposed to the H7N9 virus through contact with infected
poultry or contaminated environments, including markets that sell
live poultry [16]. However clear links between infections in poultry
and human cases have been difficult to establish, because this virus
does not appear to cause clinical signs in infected poultry.
Information to date also does not support sustained human-to-
human transmission [17]. Effective and predictive risk maps can
provide a useful means by which to design targeted surveillance
efforts [3–6], and ecological niche modeling approaches are
offering novel views of the geography of potential for disease
transmission [9,18]. Many aspects of the natural history,
geography, and ecology of H7N9 virus remain poorly known or
unknown; in such cases, niche modeling can only be applied to the
outputs of the overall cycle as a ‘‘black box’’, attempting to capture
the integration of relevant niche components in H7N9 virus.
Consisting with the regression model, which integrated agro-
ecological, environmental and meteorological factors to map the
spread potential of H7N9 [5–6], our niche model also identified
the central coastal areas in Guangdong Province as high suitable,
which were validated by the new emerging cases in 2014.
The First Law of Geography was introduced by Tobler [19],
stating that everything is related to everything else, but that near
things are more related than distant things; recent extension was to
add dimensions of time in understanding and expressing distance
and adjacency, resulting in a concept of spatiotemporal proximity
proposed during the SARS (Severe Acute Respiratory Syndrome)
Figure 2. Model performance in anticipating the geographic distribution of independent latitude (left) and longitude (right)records using the principal component axes. Blue dots were sites used to calibrate the niche model, black crosses indicate independent testingrecords (inner panels), dark red suggests high suitability.doi:10.1371/journal.pone.0093390.g002
Potential Geographic Distribution of H7N9
PLOS ONE | www.plosone.org 3 April 2014 | Volume 9 | Issue 4 | e93390

outbreaks [20]. Here, we developed multitemporal vegetation
index datasets to match the H7N9 outbreaks in spatiotemporal
coverage; the hope was to characterize ecological requirements of
H7N9 optimally, although many questions concerning the
sporadic outbreaks of H7N9 remain up in the air. Using these
datasets, models showed good performance in anticipating the
Table 1. Model performance in anticipating a ‘left out’ third of distributions of cases of H7N9 with respect to latitude andlongitude.
Subsetting criterion Layer set 10% training presence threshold* Omission on evaluation data P
Latitude PCA 24.656 6/32 ,0.05
Latitude bioNDVI 13.998 6/32 ,0.05
Longitude PCA 19.56 11/32 ,0.1
Longitude bioNDVI 14.016 10/32 ,0.05
*Maxent cumulative output.doi:10.1371/journal.pone.0093390.t001
Figure 3. Final suitability model predictions for H7N9 across eastern China using principal components (top row) and the bioNDVIdataset (bottom row). Right-hand panels show greater detail for the areas indicated in the left-hand panels; dark red indicates zones of highsuitability.doi:10.1371/journal.pone.0093390.g003
Potential Geographic Distribution of H7N9
PLOS ONE | www.plosone.org 4 April 2014 | Volume 9 | Issue 4 | e93390

known geographic distribution of independent occurrence records
(including the new emerging cases in January 2014); however,
given that H7N9 is likely still in the process of spreading out to its
full distributional and environmental potential, we are most
confident in our result as near-term and local solution rather than
as global summaries.
For H5N1, researchers integrated large data sets combining
information on poultry trade routes, numbers of birds being
transported, distribution of live-bird markets, supply routes,
waterfowl numbers, land use, and human population densities to
trace H5N1 transmission (e.g. [21–22]). For H7N9, such analyses
are only just beginning [3–6], particularly as sources of data on the
virus and routes by which it infects humans remain unclear. Birds
at live poultry markets have been suspected as a source, but broad
testing of poultry and other animals have not turned up significant
infection rates [3]; only isolates from Shanghai live poultry
markets showed high homology with viruses causing human
infections [8]. Based on experience with H5N1, Butler [3]
suggested that high suitability areas for H7N9 might include
Shandong Province and a belt extending around the Bohai Sea to
Liaoning Province in the north.
However, H5N1 dynamics offer only a starting point for
identifying areas at risk, since ecological requirements and natural
history of H5N1 and H7N9 might well be different. Our models
identified high-risk zones for H7N9 in east-central China.
Continued vigilance therefore is needed within affected and
neighboring areas to detect infections in animals and humans, as
the current distributional pattern suggest that H7N9 would be in
previously affected and possibly neighboring areas, and potentially
in travelers from these areas returning to other countries.
Attention should be paid to transmission of H7N9 between the
mainland and Taiwan, since highly suitable areas were observed
along both the eastern seaboard of mainland China and in western
Taiwan.
Supporting Information
Table S1 H7N9 case occurrences used in ecologicalniche modeling.
(DOC)
Author Contributions
Conceived and designed the experiments: GZ ATP. Performed the
experiments: GZ. Analyzed the data: GZ. Wrote the paper: GZ ATP.
References
1. He JK, Ning LW, Tong Y (2013) Origins and evolutionary genomics of the
novel 2013 avian-origin H7N9 influenza A virus in China: Early findings. Arxiv:
1304.1985. Available: http://arxiv.org/abs/1304.1985. Accessed 2013 Jun 1.
2. Uyeki TM, Cox NJ (2013) Global concerns regarding novel influenza a (H7N9)
virus infections. New England Journal of Medicine. 368: 1862–1864.
3. Butler D (2013) Mapping the H7N9 avian flu outbreaks. Nature. doi:10.1038/
nature.2013.12863.
4. He JK, Chen Y (2013) Predicting the global transmission potential of H7N9
avian flu. Available: http://blog.sciencenet.cn/blog-514529-686019.html Ac-
cessed 2013 Jul 1.
5. Shi BY, Xia S, Yang GJ, Zhou XN, Liu JM (2013) Inferring the potential risks of
H7N9 infection by spatiotemporally characterizing bird migration and poultry
distribution in eastern China. Infectious Diseases of Poverty 2013, 2:8.
6. Fang LQ, Li XL, Liu K, Li YJ, Yao HW, et al. (2014) Mapping spread and risk
of avian influenza A (H7N9) in China. Scientific Reports 3: 2722.
Figure 4. Visualization of year-round trends in MODIS NDVI greenness indices in modeled unsuitable (top) and suitable (bottom)areas for H7N9 virus based on a 10% omission threshold.doi:10.1371/journal.pone.0093390.g004
Potential Geographic Distribution of H7N9
PLOS ONE | www.plosone.org 5 April 2014 | Volume 9 | Issue 4 | e93390

7. Wu SQ Wu, Wu FQ, He J (2013) Emerging risk of H7N9 influenza in China.
Lancet 381: 1539–1540.8. Shi JZ, Deng GH, Liu PH, Zhou JP, Guan LZ, et al. (2013) Isolation and
characterization of H7N9 viruses from live poultry markets—Implication of the
source of current H7N9 infection in humans. Chinese Science Bulletin. 58:1857–1863.
9. Peterson AT, Soberon J, Anderson RP, Pearson RG, Martınez-Meyer E, et al.(2011) Ecological Niches and Geographic Distributions. Princeton University
Press, Princeton.
10. Reed KD, Meece JK, Archer JR, Peterson AT (2008) Ecologic niche modelingof Blastomyces dermatitidis in Wisconsin. PLoS ONE 3: e2034.
11. Giles J, Peterson AT, Almeida A (2011) Ecology and geography of plaguetransmission areas in northeastern Brazil. PLOS Neglected Tropical Diseases 5:
e925.12. Williams RA, Xiao XM, Peterson AT (2011) Continent-wide association of
H5N1 outbreaks in wild and domestic birds in Europe. Geospatial Health 5:
247–253.13. Rangel TF, Diniz-Filho JAF, Bini LM (2006) Towards an integrated
computational tool for spatial analysis in macroecology and biogeography.Global Ecology and Biogeography 15: 321–327.
14. Phillips SJ, Anderson RP, Schapire RE (2006) Maximum entropy modeling of
species geographic distributions. Ecological Modelling 190: 231–259.
15. Peterson AT, Papes M, Soberon J (2008) Rethinking receiver operating
characteristic analysis applications in ecological niche modelling. EcologicalModelling 213: 63–72.
16. Wang CM, Wang J, Su W, Gao SS, Luo J, et al. (2013) Relationship between
domestic and wild birds in live poultry market and a novel human H7N9 virus inChina. The Journal of Infectious Disease, doi: 10.1093/infdis/jit478.
17. Xu R, de Vries RP, Zhu XY, Nycholat CM, McBride R, et al. (2013)Preferential recognition of avian-like receptors in human influenza A H7N9
viruses. Science 342: 1230–1235.
18. Peterson AT (2008) Biogeography of diseases: a framework for analysis.Naturwissenschaften 95: 483–491.
19. Tobler ERW (1970) A computer movie simulating urban growth in the Detroitregion. Economic Geography 46: 234–240.
20. Li XW, Cao CX, Chang CY (2007) The first law of geography and spatialtemporal proximity. Chinese Journal of Nature 29: 68–71.
21. Gilbert M, Xiao XM, Pfeiffer DU, Epprecht M, Boles S, et al. (2008) Mapping
H5N1 highly pathogenic avian influenza risk in Southeast Asia. Proceedings ofthe National Academy of Sciences of the United States of America 105: 4769–
4774.22. Martin V, Pfeiffer DU, Zhou XY, Xiao XM, Prosser DJ, et al. (2011) Spatial
distribution and risk factors of highly pathogenic avian influenza (HPAI) H5N1
in China. PLoS Pathogens 7: e1001308.
Potential Geographic Distribution of H7N9
PLOS ONE | www.plosone.org 6 April 2014 | Volume 9 | Issue 4 | e93390