Embed Size (px)
Citation preview
1
Potential limitations in the use of KillerRed for fluorescence microscopy
Marcus Nordgren*, Bo Wang*, Oksana Apanasets*, Chantal Brees*, Paul P. Van
Veldhoven*, and Marc Fransen*
* Laboratory of Lipid Biochemistry and Protein Interactions, Department of Molecular Cell
Biology, Katholieke Universiteit Leuven, Leuven, Belgium
Correspondence to: Dr. Marc Fransen, Department of Molecular Cell Biology, Faculty of
Medicine, Katholieke Universiteit Leuven, Herestraat 49 box 601, 3000 Leuven, Belgium.
Phone: +32(0)16330114; fax: 32(0)16330642; e-mail: [email protected]
Running Head: Spectral properties of KillerRed
Keywords: fluorescent proteins, image analysis, spectral bleed-through, co-localization, LC3,
peroxisomes
2
Summary
KillerRed, a bright red fluorescent protein, is a genetically-encoded photosensitizer
which generates radicals and hydrogen peroxide upon green light illumination. The protein is
a potentially powerful tool for selective light-induced protein inactivation and cell killing, and
can also be used to study downstream effects of locally increased levels of reactive oxygen
species (ROS). The initial aim of this study was to investigate whether or not KillerRed-
mediated ROS production inside peroxisomes could trigger the sequestration of these
organelles into autophagosomes. Green fluorescent protein (GFP)-tagged microtubule-
associated protein 1 light chain 3 (LC3) was used as autophagosome marker. We observed
that KillerRed also emits weak green fluorescence upon excitation at 480 nm, and this may
lead to erroneous data interpretation in conditions where green fluorophores are used. We
discuss this potential pitfall of KillerRed for biological imaging and formulate
recommendations to avoid misinterpretation of the data.
3
Introduction
Fluorescence imaging has become a powerful tool to study complex and dynamic
processes in biological systems. The portfolio of fluorescent compounds that find wide use in
intracellular imaging is rapidly expanding and includes tracker dyes, nanoparticles, and
genetically-encoded reporter proteins (Terasaki & Jaffe, 2004; Chudakov et al., 2010; Hinner
& Johnsson, 2010; Swanson et al., 2011). The green fluorescent protein (GFP) from the
jellyfish Aequorea victoria is one of the most widely used fluorescent probes for the labelling
of individual proteins or cell compartments for live cell fluorescence microscopy, and the
number of GFP variants and GFP-like proteins with distinct spectral characteristics and
various maturation rates is rapidly growing (Terasaki & Jaffe, 2004). Nowadays, these
proteins are widely used to (i) monitor promoter activity and gene expression, (ii) visualize
particular cell types in tissues, organs, and even whole animals, (iii) study protein-protein
interactions, (iv) track protein movement, (v) image Ca2+, pH, and ROS, and (vi) generate
ROS in a spatially and temporally controlled manner (Chudakov et al., 2010; Swanson et al.,
2011).
We recently investigated the usefulness of targeted variants of KillerRed (KR) and
roGFP2 to locally increase and measure ROS levels in different subcellular compartments in
mammalian cells (Ivashchenko et al., 2011). RoGFP2 is a redox-sensitive variant of the
enhanced GFP (EGFP) which contains engineered cysteine residues on adjacent surface-
exposed -strands that form a disulfide bond under oxidizing conditions (Hanson et al.,
2004). As oxidation of the dithiol pair causes reciprocal changes in emission intensity when
excited at 400 and 490 nm, the ratio of roGFP2 emissions (at 510 nm) can provide a non-
destructive read-out of the redox environment of the fluorophore (Hanson et al., 2004; Meyer
& Dick, 2010). KR is a red fluorescent genetically-encoded photosensitizer that produces

4
radicals and hydrogen peroxide upon green light illumination (Carpentier et al., 2009; Vegh et
al., 2011). The protein has excitation and emission maxima at 585 nm and 610 nm,
respectively, and ROS production is accompanied by profound photobleaching (Bulina et al.,
2006).
Until now, KR has been used for light-induced cell killing, chromophore-assisted light
inactivation (CALI), and manipulation of complex cellular and developmental processes by
regulated generation of ROS (Del Bene et al., 2010; Lukyanov et al., 2010; Serebrovskaya et
al., 2011). The initial aim of this study was to investigate whether or not this photosensitizer
can also be used to selectively damage peroxisomes in mammalian cells and target these
organelles for autophagic sequestration. The availability of such an assay may facilitate future
studies on the identification of specific signals and markers that target non-functional
peroxisomes for autophagic degradation. However, we unexpectedly found that the intrinsic
spectral properties of KR complicated the interpretations of the results. As we expect KR to
find broad application in live-cell fluorescence imaging, we believe some caution is
warranted, especially in case the subcellular localization of green fluorescent reporters will be
assayed or quantitative measurements in the green emission channel are necessary.
5
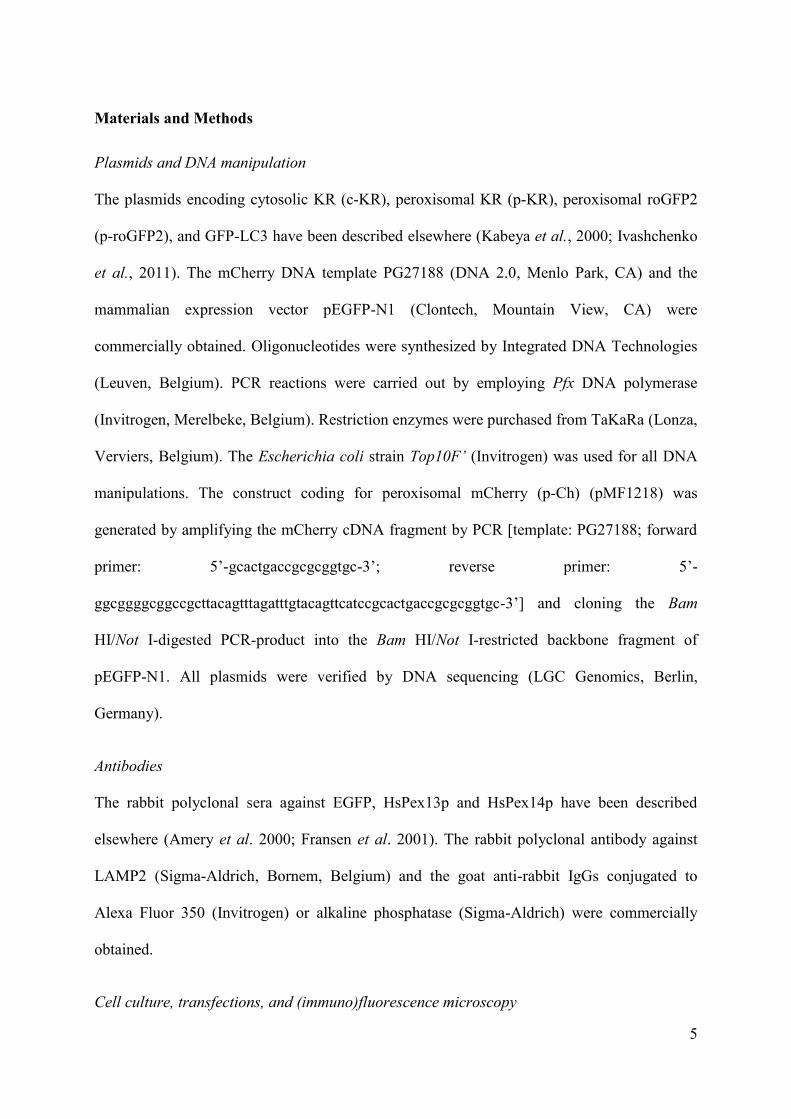
Materials and Methods
Plasmids and DNA manipulation
The plasmids encoding cytosolic KR (c-KR), peroxisomal KR (p-KR), peroxisomal roGFP2
(p-roGFP2), and GFP-LC3 have been described elsewhere (Kabeya et al., 2000; Ivashchenko
et al., 2011). The mCherry DNA template PG27188 (DNA 2.0, Menlo Park, CA) and the
mammalian expression vector pEGFP-N1 (Clontech, Mountain View, CA) were
commercially obtained. Oligonucleotides were synthesized by Integrated DNA Technologies
(Leuven, Belgium). PCR reactions were carried out by employing Pfx DNA polymerase
(Invitrogen, Merelbeke, Belgium). Restriction enzymes were purchased from TaKaRa (Lonza,
Verviers, Belgium). The Escherichia coli strain Top10F’ (Invitrogen) was used for all DNA
manipulations. The construct coding for peroxisomal mCherry (p-Ch) (pMF1218) was
generated by amplifying the mCherry cDNA fragment by PCR [template: PG27188; forward
primer: 5’-gcactgaccgcgcggtgc-3’; reverse primer: 5’-
ggcggggcggccgcttacagtttagatttgtacagttcatccgcactgaccgcgcggtgc-3’] and cloning the Bam
HI/Not I-digested PCR-product into the Bam HI/Not I-restricted backbone fragment of
pEGFP-N1. All plasmids were verified by DNA sequencing (LGC Genomics, Berlin,
Germany).
Antibodies
The rabbit polyclonal sera against EGFP, HsPex13p and HsPex14p have been described
elsewhere (Amery et al. 2000; Fransen et al. 2001). The rabbit polyclonal antibody against
LAMP2 (Sigma-Aldrich, Bornem, Belgium) and the goat anti-rabbit IgGs conjugated to
Alexa Fluor 350 (Invitrogen) or alkaline phosphatase (Sigma-Aldrich) were commercially
obtained.
Cell culture, transfections, and (immuno)fluorescence microscopy
6
The m5-7;GFP-LC3 mouse embryonic fibroblast (MEF) cell line, in which GFP-LC3 is stably
expressed and the expression of the autophagy-related gene 5 (ATG5) can be regulated by
doxycycline administration, and the SV40 large T-antigen immortalized MEFs have been
described elsewhere (Hosokawa et al., 2006; Ivashchenko et al., 2011). Cells were cultured at
37°C in a humidified 5% CO2 incubator in minimum essential medium Eagle alpha (MEMα;
BioWhittaker) (Lonza) supplemented with 10% (v/v) heat-inactivated South-American fetal
calf serum (Invitrogen), 2 mM Glutamax (Invitrogen), and Mycozap (Lonza). m5-7;GFP-LC3
MEFs were cultivated in the presence of 350 µg/ml G418 (Sigma-Aldrich). Cells were
transfected by employing the Neon Transfection System (Invitrogen; 1350 V, 30 ms pulse
width, 1 pulse) and kept in the dark as much as possible. Cells grown on glass coverslips were
fixed and processed for immunofluorescence microscopy as described (Huybrechts et al.,
2009). Cells for live-cell imaging were seeded and imaged in FD-35 Fluorodish cell culture
dishes (World Precision Instruments, Hertfordshire, England). Fluorescence was evaluated on
a motorized inverted IX-81 microscope, controlled by Cell-M software and equipped with (i)
a temperature, humidity, and CO2-controlled incubation chamber, (ii) a 100x Super
Apochromat oil immersion objective, (iii) the band-pass (BP) excitation filters BP360-370,
BP470-495, BP545-580, and D405/20x; (iv) the barrier (BA) filters BA420-460, BA510-550,
and BA610IF, (v) dichromatic mirrors with cut-offs at 400, 425, 505, and 600 nm, and (vi) a
CCD-FV2T digital B/W camera (Olympus, Aartselaar, Belgium). The camera exposure time
was set to 100 and 20 ms to acquire images of peroxisomal roGFP2 (p-roGFP2) at 400 and
480 nm excitation wavelengths, respectively. To generate KillerRed-mediated ROS, the cells
were irradiated with green light (100x oil objective, 545-580nm, 1300 µW/cm2) for the
indicated time frames. The Olympus image analysis and particle detection software were used
for quantitative image analysis.
Cell fractionation and immunoblotting

7
Fractionations of m5-7;GFP-LC3 cells were performed as described (Fransen et al., 2004).
Protein extracts were prepared by standard techniques, separated by SDS-PAGE, and
analyzed by immunoblotting.
Statistical analysis
Statistics were performed on the VassarStats statistical computation website
(http://faculty.vassar.edu/lowry//VassarStats.html). One-way analysis of variance was used to
determine the differences among independent groups of numerical values, and individual
differences were further explored with a Student’s t-test. The significance level was chosen to
be p<0.05.
Spectral analysis
The spectral analysis data of the E. coli-expressed (His)6-KR were kindly provided by
Evrogen JSC (Moscow, Russia). The recombinant protein was purified by using immobilized
metal ion affinity chromatography. The ratio between the absorbances at 585 nm and 280 nm
was greater than 2.0. Emission spectra were recorded with a Varian Cary Eclipse fluorescence
spectrophotometer (excitation and emission slits 5 nm).
8
Results
Expression of peroxisomal KR in m5-7;GFP-LC3 cells: a fluorescence microscopic
analysis
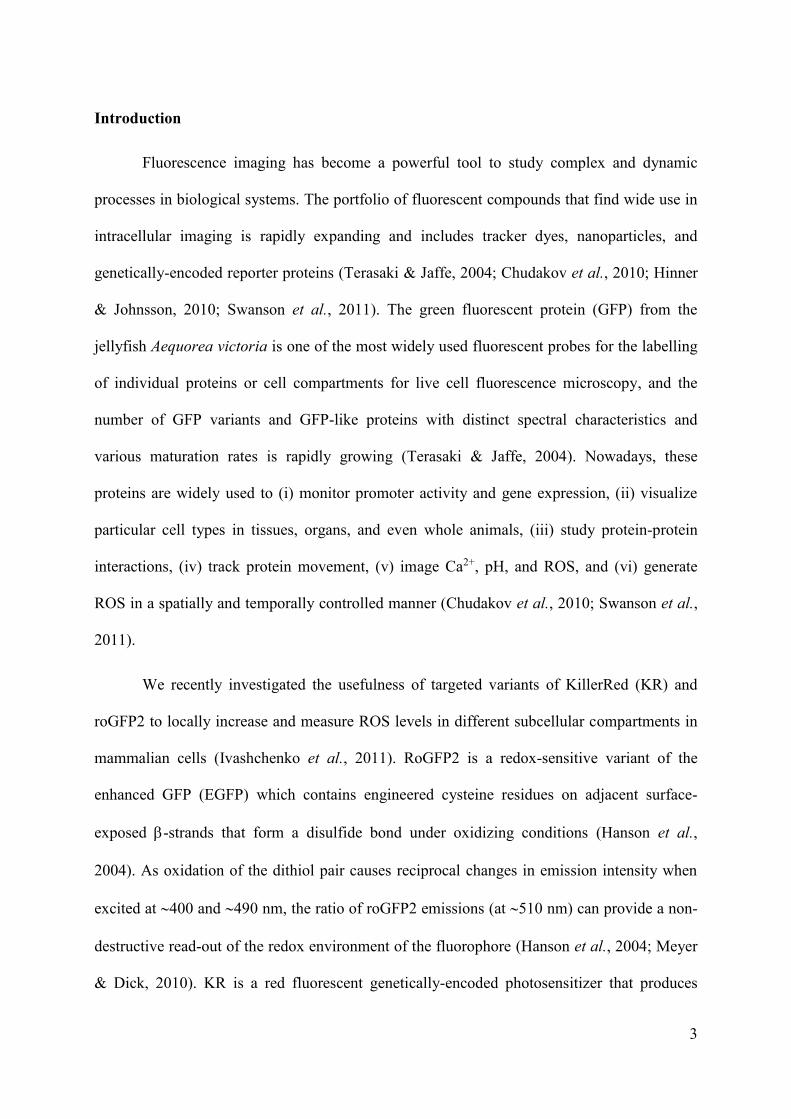
As superfluous and non-functional peroxisomes are proposed to be removed by
autophagy (Iwata et al., 2006; Kim et al., 2008; Hara-Kuge & Fujiki, 2008; Huybrechts et al.,
2009), we intended to investigate the cellular fate of photodamaged peroxisomes in mouse
embryonic fibroblasts (MEFs) stably expressing GFP-LC3, a widely used marker of
autophagosomes in mammalian cells (Hosokawa et al., 2006). Therefore, we transfected these
cells with a construct coding for p-KR, a peroxisomal variant of KR (Ivashchenko et al.,
2011), and analyzed the co-localization of GFP-LC3 puncta with Pex14p, a peroxisomal
marker protein, under different experimental conditions. We surprisingly found that GFP-LC3
and Pex14p displayed a weak but clear co-localization even in the absence of photoirradation
(Fig. 1A). No such co-localization could be observed when p-mCherry (p-Ch), another
peroxisomally located red fluorescent protein, was expressed in these cells (Fig. 1B) or when
p-KR and EGFP were transiently co-expressed in wild-type MEFs (Fig. 1C). Interestingly,
expression of p-KR in GFP-LC3 cells also resulted in a small but significant decrease in
peroxisome density (Fig. S1A). However, as many of these cells contain peroxisomal
aggregates (Fig. S1B), it is not clear whether or not this reduction in peroxisome number can
be attributed to the clustering effect (see below). Nevertheless, taken together with our finding
that expression of p-KR slightly increases the intraperoxisomal redox status in wild-type
MEFs (Fig. S1C), these data suggest that p-KR has a noxious effect on peroxisomes and may
target these organelles for autophagic degradation.

9
Expression of peroxisomal KR in m5-7;GFP-LC3 cells: a subcellular fractionation
analysis
To confirm that GFP-LC3 is indeed recruited to peroxisomes upon expression of p-
KR, we fractionated the postnuclear supernatant of m5-7;GFP-LC3 cells expressing cytosolic
or peroxisomal KR by ultracentrifugation using a discontinuous Nycodenz density gradient
(Fransen et al., 2004). To our surprise, we couldn’t observe a p-KR-dependent banding of
GFP-LC3 in peroxisome-enriched fractions (Fig. S2A). This finding suggests that p-KR
expression by itself does not target peroxisomes for autophagic degradation.
KillerRed displays a weak green emission peak upon excitation at 480 nm
To find an explanation for the apparently conflicting fluorescence microscopy and
subcellular fractionation data, we explored two possibilities. First, as (i) the amount of GFP-
LC3 associated with peroxisomes may be below the detection limit of our immunoblot
analysis, (ii) GFP-LC3 may dissociate from the peroxisomal membrane during the
fractionation procedure, or (iii) peroxisomes sequestered in GFP-LC3-positive
autophagosomes may acquire a reduced buoyant density which is very similar to lysosomes
(Berg et al., 1994), we examined whether or not expression of p-KR resulted in a decreased
abundance of peroxisomal proteins in total cell lysates. However, as this was not the case
(Fig. S2B), we conclude that the reduced number of peroxisomes in these cells is the result of
organelle aggregation, and not organelle degradation. Note that this aggregation phenotype,
which can already be observed one day post-transfection (Fig. S3A), is dependent on the
expression levels of p-KR (Fig. S3B,C), but not GFP-LC3 (Fig. S3B,D). Second, as the green
fluorescence intensities at the peroxisome correlated with the fluorescence intensities of p-KR
(Fig. S4), we investigated whether or not p-KR and GFP-LC3 displayed fluorescence cross-
10
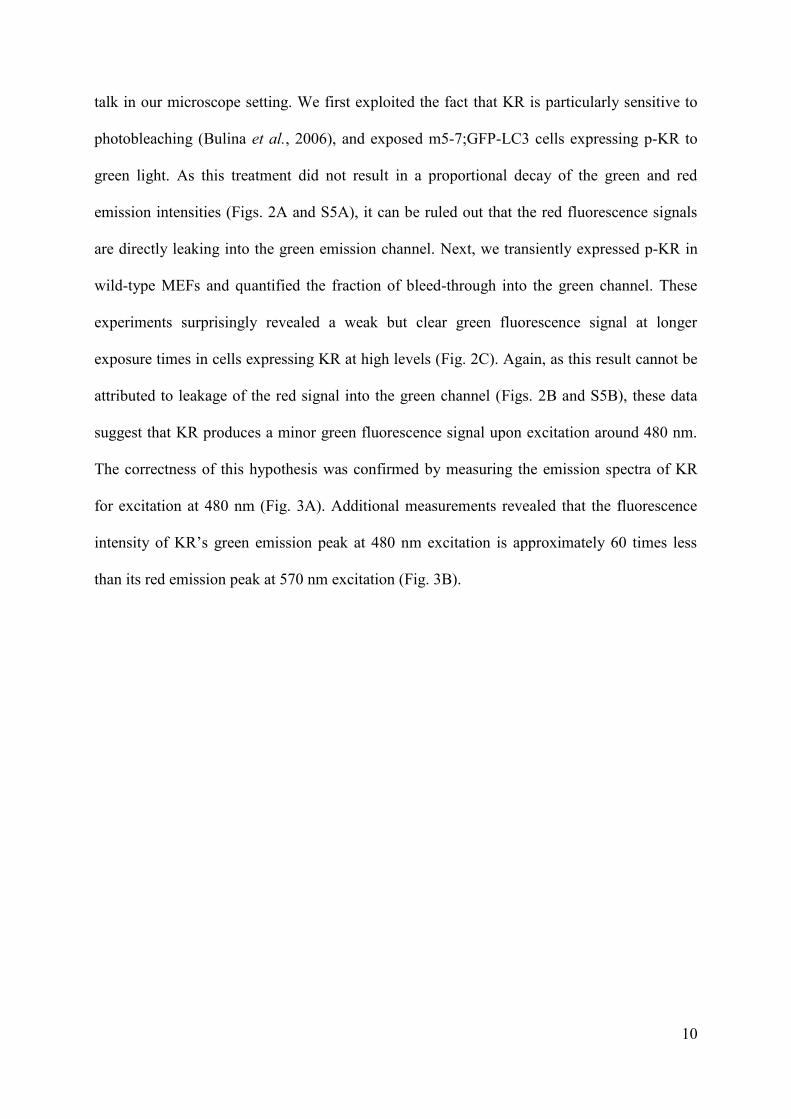
talk in our microscope setting. We first exploited the fact that KR is particularly sensitive to
photobleaching (Bulina et al., 2006), and exposed m5-7;GFP-LC3 cells expressing p-KR to
green light. As this treatment did not result in a proportional decay of the green and red
emission intensities (Figs. 2A and S5A), it can be ruled out that the red fluorescence signals
are directly leaking into the green emission channel. Next, we transiently expressed p-KR in
wild-type MEFs and quantified the fraction of bleed-through into the green channel. These
experiments surprisingly revealed a weak but clear green fluorescence signal at longer
exposure times in cells expressing KR at high levels (Fig. 2C). Again, as this result cannot be
attributed to leakage of the red signal into the green channel (Figs. 2B and S5B), these data
suggest that KR produces a minor green fluorescence signal upon excitation around 480 nm.
The correctness of this hypothesis was confirmed by measuring the emission spectra of KR
for excitation at 480 nm (Fig. 3A). Additional measurements revealed that the fluorescence
intensity of KR’s green emission peak at 480 nm excitation is approximately 60 times less
than its red emission peak at 570 nm excitation (Fig. 3B).
11
Discussion
The initial aim of this study was to investigate whether or not KR-mediated ROS-
production inside peroxisomes could selectively target these organelles for degradation by
autophagy. However, during these studies, we discovered that KR produces a minor green
fluorescence signal upon excitation around 480 nm, thereby complicating the interpretation of
the results. Indeed, as shown in this study, this spectral bleed-through artifact can be easily
confused with co-localization of KR and a green fluorophore (in casu GFP-LC3) in case the
intensities of fluorescence emission are not equally balanced.
As our observations indicate that the apparent co-localization of p-KR and GFP-LC3
in fluorescence microscopy most likely represents a KR-associated artifact, we also faced the
problem of how to interpret our observation that the intraperoxisomal redox status slightly
increased upon p-KR expression. As (i) oxidation of the dithiol pair of roGFP2 causes an
increase in 510 nm emission ratio when excited at 400 and 480 nm (Hanson et al., 2004), and
(ii) KR produces a green fluorescence signal upon excitation around 480 but not 400 nm (Fig.
3C), one would expect to see a slight decrease in the emission ratios of p-roGFP2 in case p-
KR does not elicit oxidative stress. Nevertheless, as it has also been reported that KR’s red
chromophore (absorption peak at 585 nm) can be converted into a green chromophore
(absorption peak 400 nm) during the early stages of photobleaching and upon treatment with
2-mercaptoethanol (Pletnev et al., 2009), we cannot rigorously rule out the possibility that the
small but significant increase in p-roGFP2 oxidation upon p-KR expression is also a KR-
associated artifact. However, such an artifact cannot explain why peroxisomes cluster in cells
highly overexpressing p-KR. It also remains to be established whether or not KR-containing
peroxisomes can be selectively sequestered within autophagosomes upon activation of the
photosensitizer. Indeed, due to the unforeseen fact that KR emits green weak fluorescence

12
upon excitation at 480 nm, it is not possible to address this issue within the current
experimental set-up in which a GFP-tagged version of LC3 is used as marker for
autophagosomal membranes. However, to address this issue, one can envision other
experiments in which – for example – the cells are fixed at well-defined time points after KR-
activation and subsequently processed for immunostaining with a primary antibody against an
autophagosome marker and a secondary antibody conjugated to a blue fluorophore.
As KR has great potential in a wide range of fluorescence-based applications, we
believe it is important for the investigator to be aware of its limitations. Special care should be
taken in the design of KR-based studies, in particular when the co-localization of KR and
green fluorophores is under investigation or signal intensity measurements are necessary.
Potential problems can be circumvented by rigorously controlling the expression levels of KR
or by using a threshold value for KR emission. This value, which may vary considerably with
different experimental set-up (e.g. filter set, signal integration time needed to collect green
image data, …), can be determined by taking fluorescence images of single labeled samples.
Alternatively, one can make use of software algorithms for spectral unmixing. In conclusion,
the results of this study shed more light on the spectral properties of KR and demonstrate that
some caution is warranted in interpreting KR-associated results when the photosensitizer is
used in combination with green fluorophores.

13
Acknowledgements
We thank Dr. N. Mizushima (Tokyo Medical and Dental University, Japan) for the m5-
7;GFP-LC3 MEF cell line, Dr. M. Pavlenko (Evrogen JSC, Russia) for the emission spectra
of KR, and Dr. T. Yoshimori (Osaka University, Japan) for the plasmid encoding GFP-LC3.
This work is supported by grants from the ‘Fonds voor Wetenschappelijk Onderzoek-
Vlaanderen (Onderzoeksproject G.0754.09)’ and the ‘Bijzonder Onderzoeksfonds van de
K.U.Leuven (OT/09/045)’. B. W. is supported by a fellowship of the Chinese Research
Council.

14
References
Amery, L., Fransen, M., De Nys, K., Mannaerts, G.P. & Van Veldhoven, P.P. (2000)
Mitochondrial and peroxisomal targeting of 2-methylacyl-CoA racemase in humans. J.
Lipid Res. 41, 1752-1759.
Berg, T.O., Strømhaug, P.E., Berg, T. & Seglen, P.O. (1994) Separation of lysosomes and
autophagosomes by means of glycyl-phenylalanine-naphthylamide, a lysosome-
disrupting cathepsin-C substrate. Eur. J. Biochem. 221, 595-602.
Bulina, M.E., Lukyanov, K.A., Britanova, O.V., Onichtchouk, D., Lukyanov, S. & Chudakov,
D.M. (2006) Chromophore-assisted light inactivation (CALI) using the phototoxic
fluorescent protein KillerRed. Nat. Protoc. 1, 947-953.
Carlsson, S.R., Roth, J., Piller, F. & Fukuda, M. (1988) Isolation and characterization of
human lysosomal membrane glycoproteins, h-lamp-1 and h-lamp-2. Major
sialoglycoproteins carrying polylactosaminoglycan. J. Biol. Chem. 263, 18911-18919.
Carpentier, P., Violot, S., Blanchoin, L. & Bourgeois, D. (2009) Structural basis for the
phototoxicity of the fluorescent protein KillerRed. FEBS Lett. 583, 2839-2842.
Chudakov, D.M., Matz, M.V., Lukyanov, S. & Lukyanov, K.A. (2010) Fluorescent proteins
and their applications in imaging living cells and tissues. Physiol. Rev. 90, 1103-1163.
Del Bene, F., Wyart, C., Robles, E., Tran, A., Looger, L., Scott, E.K., Isacoff, E.Y. & Baier,
H. (2010) Filtering of visual information in the tectum by an identified neural circuit.
Science 330, 669-673.
Fransen, M., Terlecky, S.R. & Subramani, S (1998). Identification of a human PTS1 receptor
docking protein directly required for peroxisomal protein import. Proc. Natl. Acad. Sci.
USA 95, 8087-8092.
15
Fransen, M., Vastiau, I., Brees, C., Brys, V., Mannaerts, G.P. & Van Veldhoven, P.P. (2004)
Potential role for Pex19p in assembly of PTS-receptor docking complexes. J. Biol.
Chem. 279, 12615-12624.
Fransen, M., Wylin, T., Brees, C., Mannaerts, G.P.& Van Veldhoven, P.P. (2001) Human
Pex19p binds peroxisomal integral membrane proteins at regions distinct from their
sorting sequences. Mol. Cell. Biol. 21, 4413-4424.
Hanson, G.T., Aggeler, R., Oglesbee, D., Cannon, M., Capaldi, R.A., Tsien, R.Y. &
Remington, S.J. (2004) Investigating mitochondrial redox potential with redox-sensitive
green fluorescent protein indicators. J. Biol. Chem. 279, 3044-13053.
Hara-Kuge, S. & Fujiki, Y. (2008) The peroxin Pex14p is involved in LC3-dependent
degradation of mammalian peroxisomes. Exp. Cell Res. 314, 3531-3541.
Hinner MJ & Johnsson K. (2010) How to obtain labeled proteins and what to do with them.
Curr. Opin. Biotechnol. 21, 766-776.
Hosokawa, N., Hara, Y. & Mizushima, N. (2006) Generation of cell lines with tetracycline-
regulated autophagy and a role for autophagy in controlling cell size. FEBS Lett. 580,
2623-2629.
Huybrechts, S.J., Van Veldhoven, P.P., Brees, C., Mannaerts, G.P., Los, G.V. & Fransen, M.
(2009) Peroxisome dynamics in cultured mammalian cells. Traffic 10, 1722-1733.
Ivashchenko, O., Van Veldhoven, P.P., Brees, C., Ho, Y.S., Terlecky, S.R. & Fransen, M.
(2011) Intraperoxisomal redox balance in mammalian cells: oxidative stress and
interorganellar crosstalk. Mol. Biol. Cell 22, 1440-1451.
Iwata, J., Ezaki, J., Komatsu, M., Yokota, S., Ueno, T., Tanida, I., Chiba, T., Tanaka, K. &
Kominami, E. (2006) Excess peroxisomes are degraded by autophagic machinery in
mammals. J. Biol. Chem. 281, 4035-4041.
16
Kabeya, Y., Mizushima, N., Ueno, T., Yamamoto, A., Kirisako, T., Noda, T., Kominami, E.,
Ohsumi, Y. & Yoshimori, T. (2000) LC3, a mammalian homologue of yeast Apg8p, is
localized in autophagosome membranes after processing. EMBO J. 19, 5720-5728.
Kim, P.K., Hailey, D.W., Mullen, R.T. & Lippincott-Schwartz, J. (2008) Ubiquitin signals
autophagic degradation of cytosolic proteins and peroxisomes. Proc. Natl. Acad. Sci.
USA 105, 20567-20574.
Lukyanov, K.A., Serebrovskaya, E.O., Lukyanov, S. & Chudakov, D.M. (2010) Fluorescent
proteins as light-inducible photochemical partners. Photochem. Photobiol. Sci. 9, 1301-
1306.
Meyer, A.J. & Dick, T.P. (2010) Fluorescent protein-based redox probes. Antioxid. Redox
Signal. 13, 621-650.
Pletnev, S., Gurskaya, N.G., Pletneva, N.V., Lukyanov, K.A., Chudakov, D.M., Martynov,
V.I., Popov, V.O., Kovalchuk, M.V., Wlodawer, A., Dauter, Z. & Pletnev, V. (2009)
Structural basis for phototoxicity of the genetically encoded photosensitizer KillerRed.
J. Biol. Chem. 284, 32028-32039.
Serebrovskaya, E.O., Gorodnicheva, T.V., Ermakova, G.V., Solovieva, E.A., Sharonov, G.V.,
Zagaynova, E.V., Chudakov, D.M., Lukyanov, S., Zaraisky, A.G. & Lukyanov, K.A.
(2011) Light-induced blockage of cell division with a chromatin-targeted phototoxic
fluorescent protein. Biochem. J. 435, 65-71.
Swanson, S., Choi, W.G., Chanoca, A. & Gilroy, S. (2011) In vivo imaging of Ca(2+), pH,
and reactive oxygen species using fluorescent probes in plants. Annu. Rev. Plant Biol.
62, 273-297.
Terasaki, M. & Jaffe, L.A. (2004) Labeling of cell membranes and compartments for live cell
fluorescence microscopy. Methods Cell Biol. 74, 469-489.

17
Vegh, R.B., Solntsev, K.M., Kuimova, M.K., Cho, S., Liang, Y., Loo, B.L., Tolbert, L.M. &
Bommarius, A.S. (2011) Reactive oxygen species in photochemistry of the red
fluorescent protein "Killer Red". Chem. Commun. 47, 4887-4889.
18
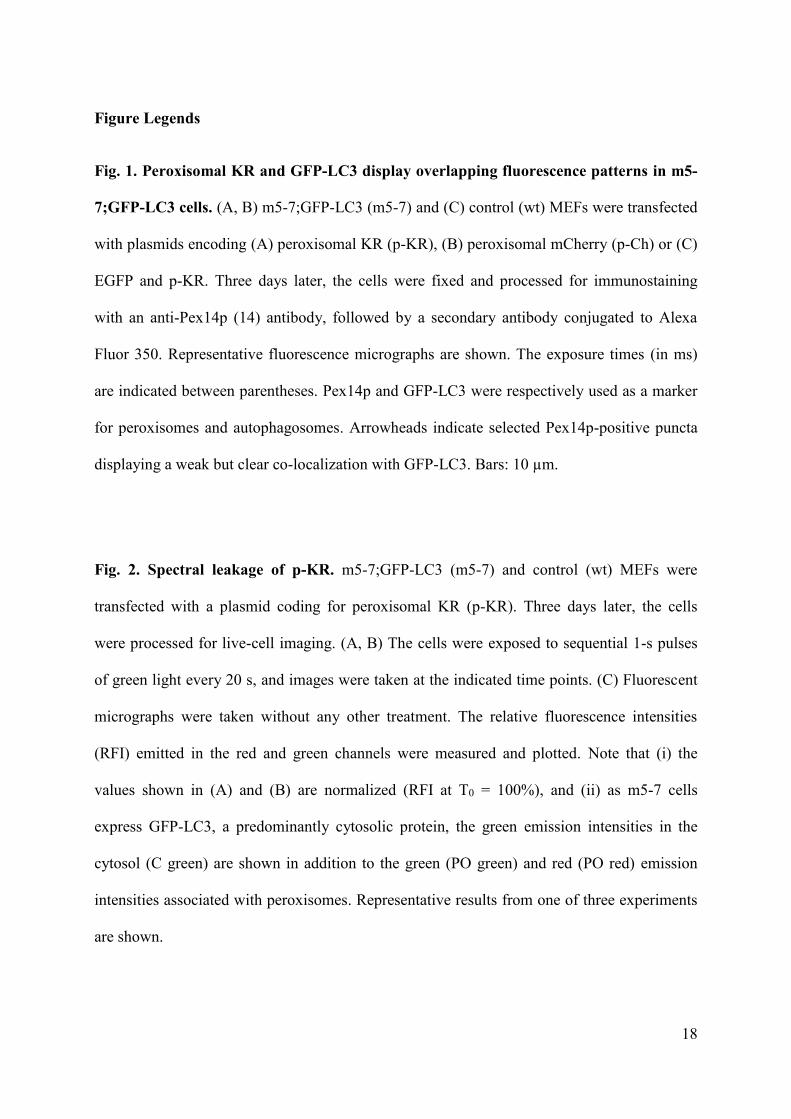
Figure Legends
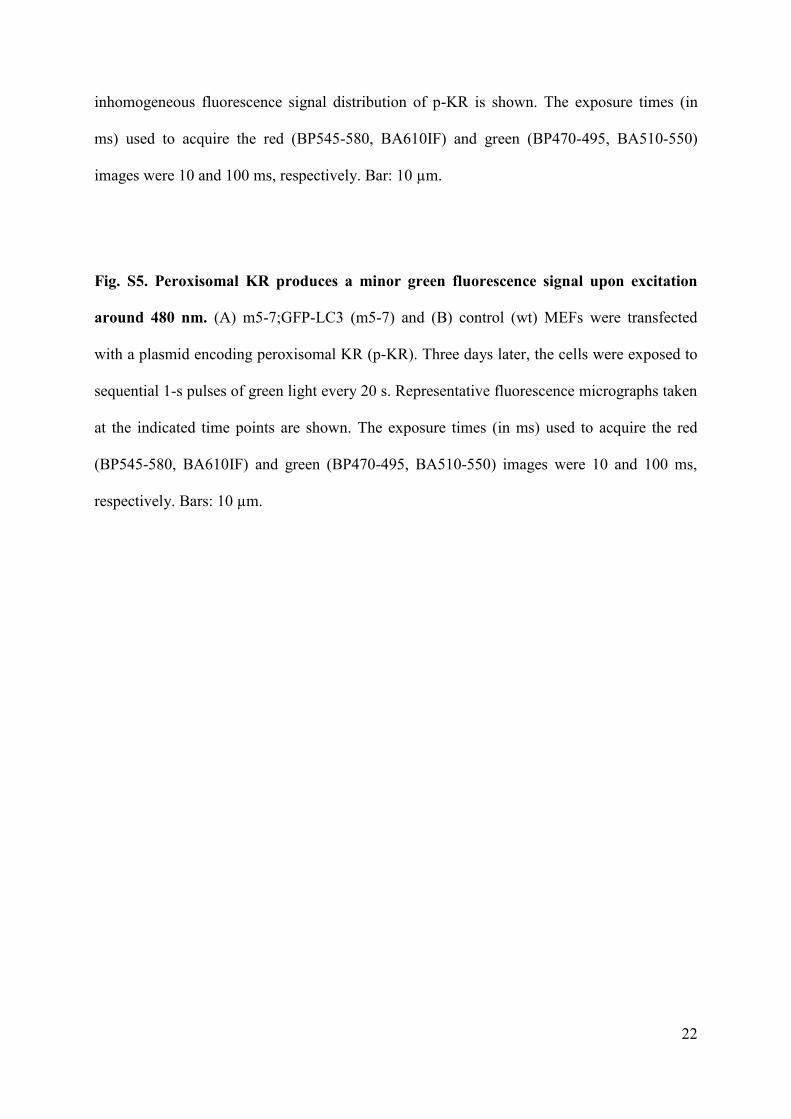
Fig. 1. Peroxisomal KR and GFP-LC3 display overlapping fluorescence patterns in m5-
7;GFP-LC3 cells. (A, B) m5-7;GFP-LC3 (m5-7) and (C) control (wt) MEFs were transfected
with plasmids encoding (A) peroxisomal KR (p-KR), (B) peroxisomal mCherry (p-Ch) or (C)
EGFP and p-KR. Three days later, the cells were fixed and processed for immunostaining
with an anti-Pex14p (14) antibody, followed by a secondary antibody conjugated to Alexa
Fluor 350. Representative fluorescence micrographs are shown. The exposure times (in ms)
are indicated between parentheses. Pex14p and GFP-LC3 were respectively used as a marker
for peroxisomes and autophagosomes. Arrowheads indicate selected Pex14p-positive puncta
displaying a weak but clear co-localization with GFP-LC3. Bars: 10 µm.
Fig. 2. Spectral leakage of p-KR. m5-7;GFP-LC3 (m5-7) and control (wt) MEFs were
transfected with a plasmid coding for peroxisomal KR (p-KR). Three days later, the cells
were processed for live-cell imaging. (A, B) The cells were exposed to sequential 1-s pulses
of green light every 20 s, and images were taken at the indicated time points. (C) Fluorescent
micrographs were taken without any other treatment. The relative fluorescence intensities
(RFI) emitted in the red and green channels were measured and plotted. Note that (i) the
values shown in (A) and (B) are normalized (RFI at T0 = 100%), and (ii) as m5-7 cells
express GFP-LC3, a predominantly cytosolic protein, the green emission intensities in the
cytosol (C green) are shown in addition to the green (PO green) and red (PO red) emission
intensities associated with peroxisomes. Representative results from one of three experiments
are shown.
19
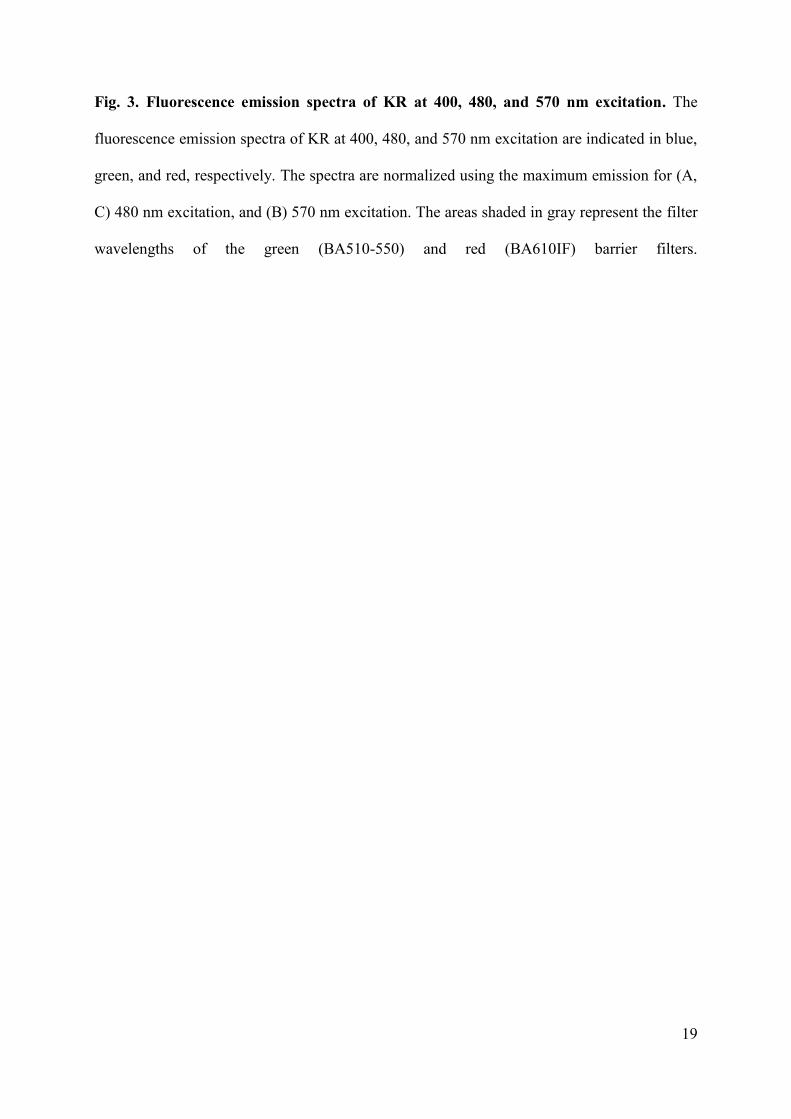
Fig. 3. Fluorescence emission spectra of KR at 400, 480, and 570 nm excitation. The
fluorescence emission spectra of KR at 400, 480, and 570 nm excitation are indicated in blue,
green, and red, respectively. The spectra are normalized using the maximum emission for (A,
C) 480 nm excitation, and (B) 570 nm excitation. The areas shaded in gray represent the filter
wavelengths of the green (BA510-550) and red (BA610IF) barrier filters.
20
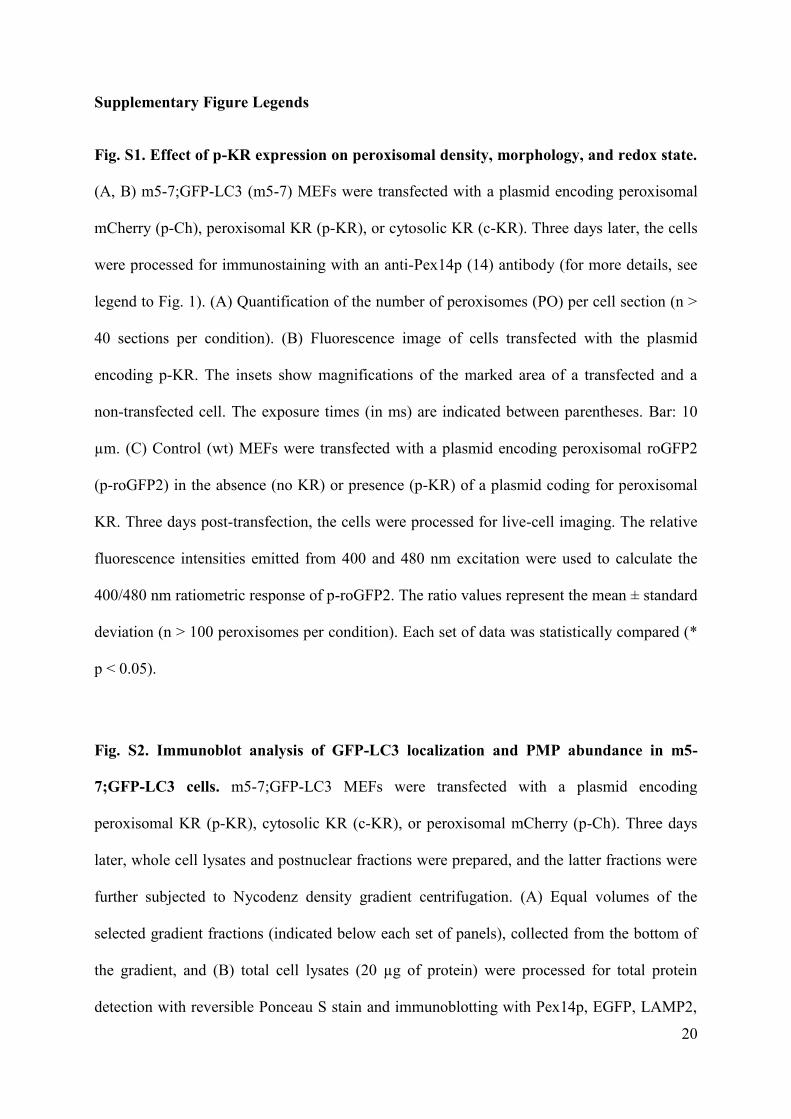
Supplementary Figure Legends
Fig. S1. Effect of p-KR expression on peroxisomal density, morphology, and redox state.
(A, B) m5-7;GFP-LC3 (m5-7) MEFs were transfected with a plasmid encoding peroxisomal
mCherry (p-Ch), peroxisomal KR (p-KR), or cytosolic KR (c-KR). Three days later, the cells
were processed for immunostaining with an anti-Pex14p (14) antibody (for more details, see
legend to Fig. 1). (A) Quantification of the number of peroxisomes (PO) per cell section (n >
40 sections per condition). (B) Fluorescence image of cells transfected with the plasmid
encoding p-KR. The insets show magnifications of the marked area of a transfected and a
non-transfected cell. The exposure times (in ms) are indicated between parentheses. Bar: 10
µm. (C) Control (wt) MEFs were transfected with a plasmid encoding peroxisomal roGFP2
(p-roGFP2) in the absence (no KR) or presence (p-KR) of a plasmid coding for peroxisomal
KR. Three days post-transfection, the cells were processed for live-cell imaging. The relative
fluorescence intensities emitted from 400 and 480 nm excitation were used to calculate the
400/480 nm ratiometric response of p-roGFP2. The ratio values represent the mean ± standard
deviation (n > 100 peroxisomes per condition). Each set of data was statistically compared (*
p < 0.05).
Fig. S2. Immunoblot analysis of GFP-LC3 localization and PMP abundance in m5-
7;GFP-LC3 cells. m5-7;GFP-LC3 MEFs were transfected with a plasmid encoding
peroxisomal KR (p-KR), cytosolic KR (c-KR), or peroxisomal mCherry (p-Ch). Three days
later, whole cell lysates and postnuclear fractions were prepared, and the latter fractions were
further subjected to Nycodenz density gradient centrifugation. (A) Equal volumes of the
selected gradient fractions (indicated below each set of panels), collected from the bottom of
the gradient, and (B) total cell lysates (20 µg of protein) were processed for total protein
detection with reversible Ponceau S stain and immunoblotting with Pex14p, EGFP, LAMP2,
21
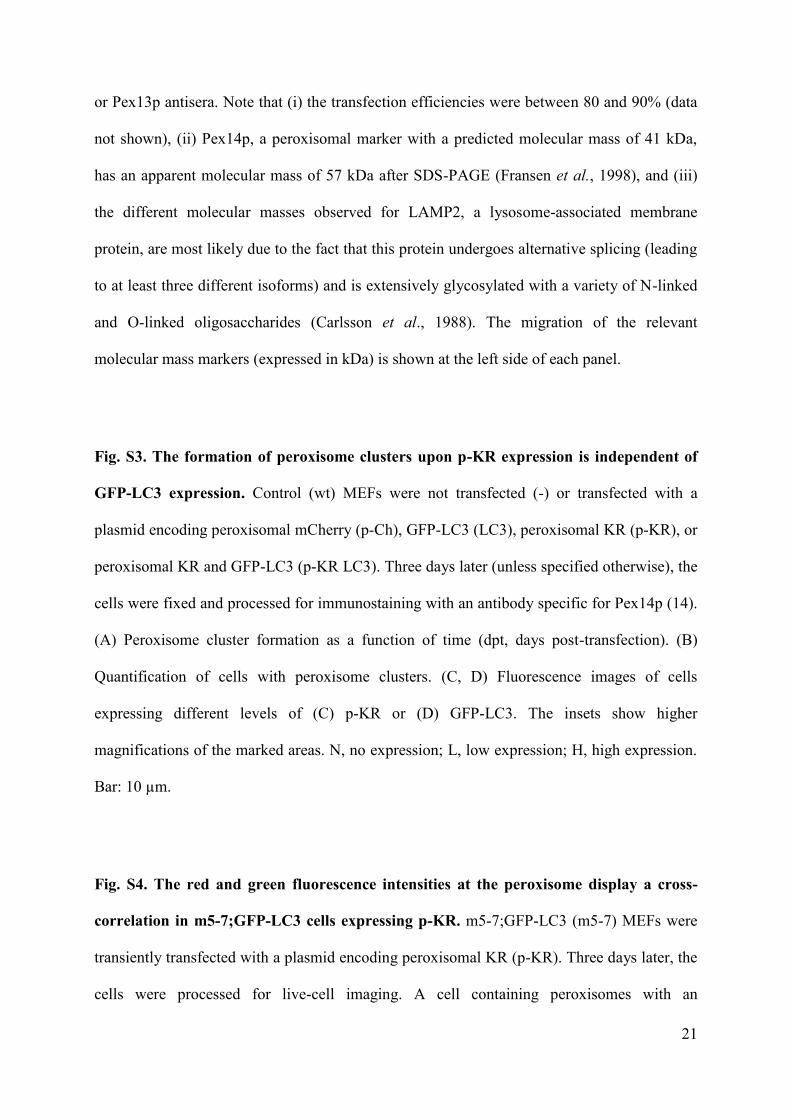
or Pex13p antisera. Note that (i) the transfection efficiencies were between 80 and 90% (data
not shown), (ii) Pex14p, a peroxisomal marker with a predicted molecular mass of 41 kDa,
has an apparent molecular mass of 57 kDa after SDS-PAGE (Fransen et al., 1998), and (iii)
the different molecular masses observed for LAMP2, a lysosome-associated membrane
protein, are most likely due to the fact that this protein undergoes alternative splicing (leading
to at least three different isoforms) and is extensively glycosylated with a variety of N-linked
and O-linked oligosaccharides (Carlsson et al., 1988). The migration of the relevant
molecular mass markers (expressed in kDa) is shown at the left side of each panel.
Fig. S3. The formation of peroxisome clusters upon p-KR expression is independent of
GFP-LC3 expression. Control (wt) MEFs were not transfected (-) or transfected with a
plasmid encoding peroxisomal mCherry (p-Ch), GFP-LC3 (LC3), peroxisomal KR (p-KR), or
peroxisomal KR and GFP-LC3 (p-KR LC3). Three days later (unless specified otherwise), the
cells were fixed and processed for immunostaining with an antibody specific for Pex14p (14).
(A) Peroxisome cluster formation as a function of time (dpt, days post-transfection). (B)
Quantification of cells with peroxisome clusters. (C, D) Fluorescence images of cells
expressing different levels of (C) p-KR or (D) GFP-LC3. The insets show higher
magnifications of the marked areas. N, no expression; L, low expression; H, high expression.
Bar: 10 µm.
Fig. S4. The red and green fluorescence intensities at the peroxisome display a cross-
correlation in m5-7;GFP-LC3 cells expressing p-KR. m5-7;GFP-LC3 (m5-7) MEFs were
transiently transfected with a plasmid encoding peroxisomal KR (p-KR). Three days later, the
cells were processed for live-cell imaging. A cell containing peroxisomes with an
22
inhomogeneous fluorescence signal distribution of p-KR is shown. The exposure times (in
ms) used to acquire the red (BP545-580, BA610IF) and green (BP470-495, BA510-550)
images were 10 and 100 ms, respectively. Bar: 10 µm.
Fig. S5. Peroxisomal KR produces a minor green fluorescence signal upon excitation
around 480 nm. (A) m5-7;GFP-LC3 (m5-7) and (B) control (wt) MEFs were transfected
with a plasmid encoding peroxisomal KR (p-KR). Three days later, the cells were exposed to
sequential 1-s pulses of green light every 20 s. Representative fluorescence micrographs taken
at the indicated time points are shown. The exposure times (in ms) used to acquire the red
(BP545-580, BA610IF) and green (BP470-495, BA510-550) images were 10 and 100 ms,
respectively. Bars: 10 µm.
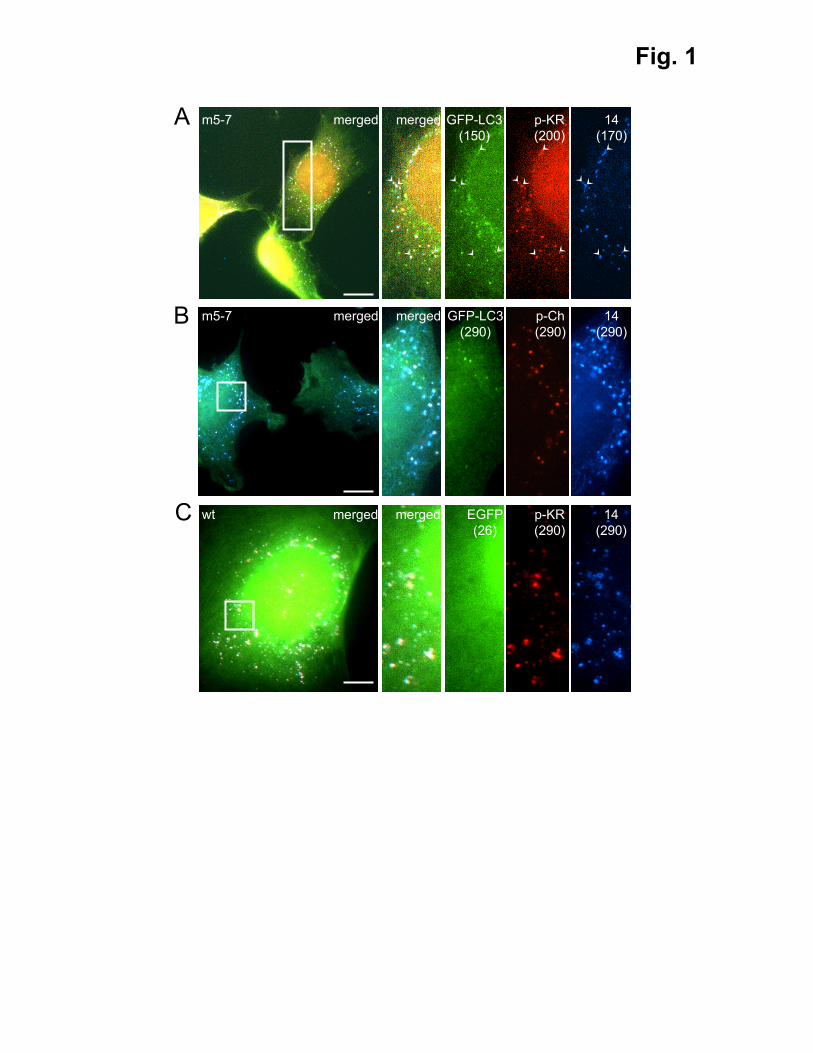
Fig. 1
p-KR(200)
14(170)
merged GFP-LC3(150)
merged
p-Ch(290)
14(290)
merged GFP-LC3(290)
merged
p-KR(290)
14(290)
merged EGFP(26)
merged
m5-7
m5-7
wt
A
B
C
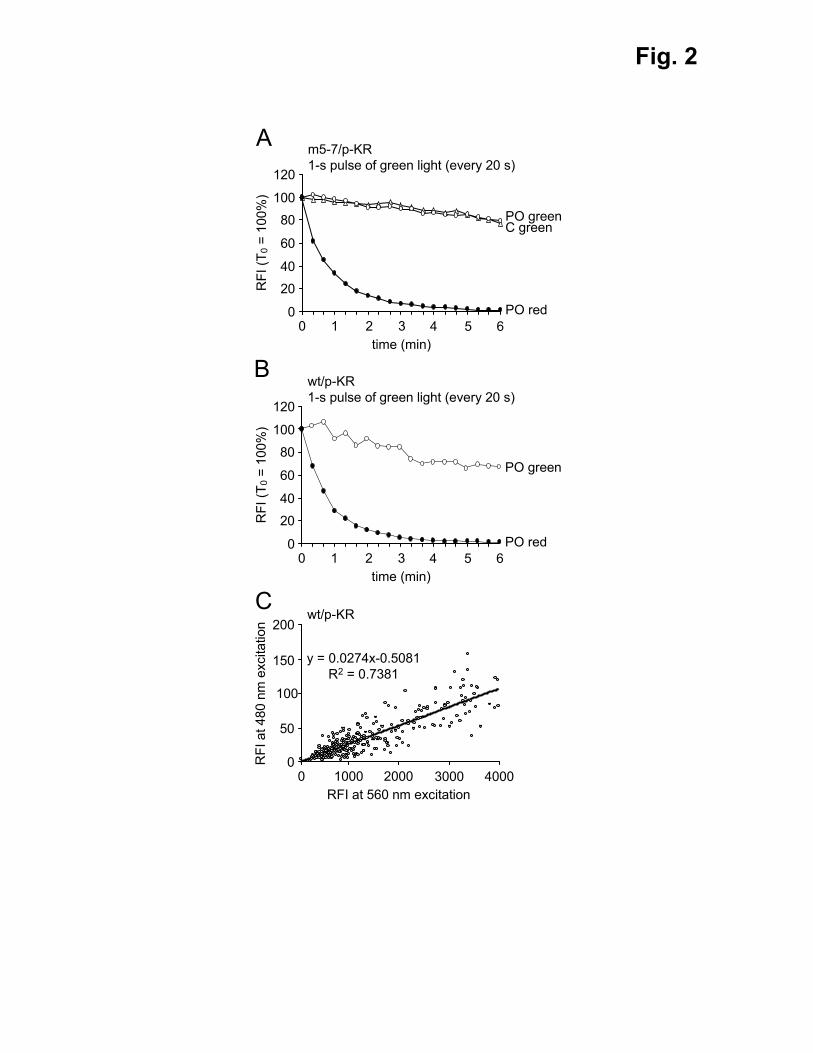
Fig. 2
0
20
40
60
80
100
120
RFI
(T0
= 10
0%)
0 1 2 3PO red
PO greenC green
m5-7/p-KR1-s pulse of green light (every 20 s)
time (min)4 5 6
0
20
40
60
80
100
120
RFI
(T0
= 10
0%)
0 1 2 3
wt/p-KR1-s pulse of green light (every 20 s)
time (min)4 5 6
PO red
PO green
B
A
0
50
100
150
200
RFI
at 4
80 n
m e
xcita
tion
0 1000 2000
wt/p-KR
RFI at 560 nm excitation3000 4000
y = 0.0274x-0.5081R2 = 0.7381
C
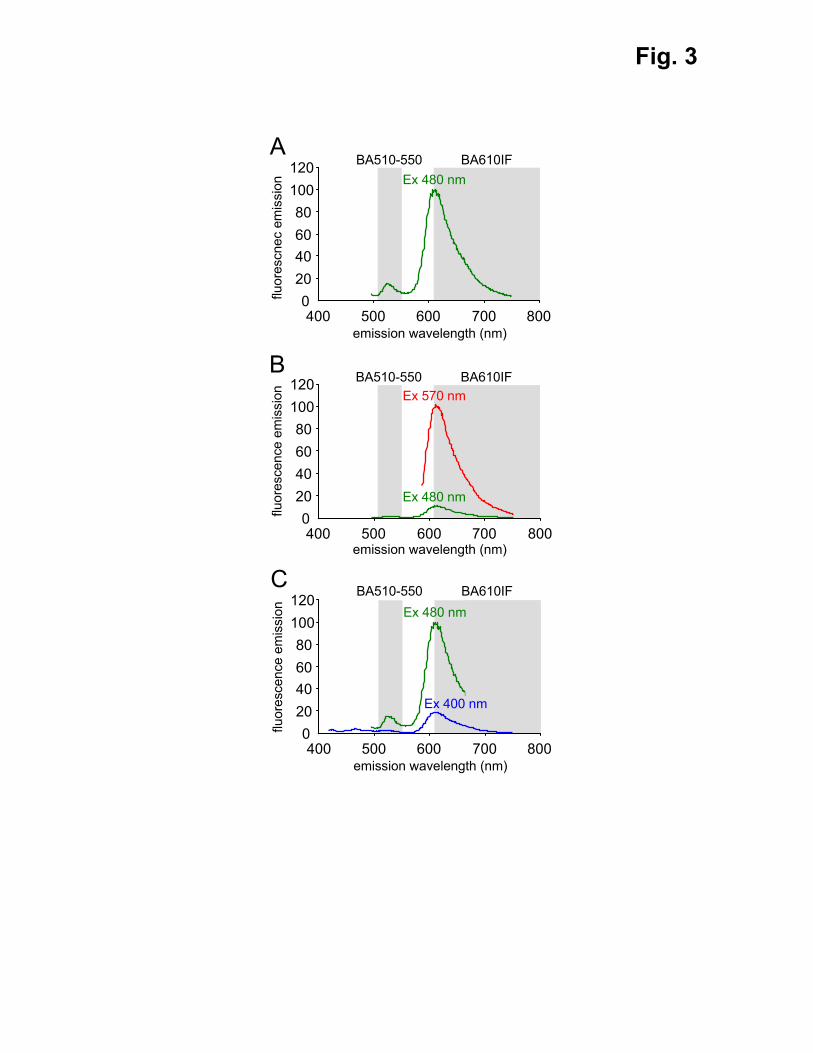
Fig. 3
020406080
100120
400 500 600 700 800
fluor
escn
ec e
mis
sion
emission wavelength (nm)
Ex 480 nm
ABA510-550 BA610IF
020406080
100120
400 500 600 700 800
fluor
esce
nce
emis
sion
emission wavelength (nm)
Ex 480 nm
Ex 570 nm
B
020406080
100120
400 500 600 700 800
fluor
esce
nce
emis
sion
emission wavelength (nm)
Ex 480 nm
C
Ex 400 nm
BA510-550 BA610IF
BA510-550 BA610IF

Fig. S1
mergedB
no KR
p-KR
merged
no KR(170)
14(200)
GFP-LC3(150)
m5-7
0.0
0.1
0.2
0.3
0.4
0.5
0.6
no KR p-KR
400/
480
nm ra
tiom
etric
resp
onse
of p
-roG
FP2
C
*
merged
p-KR(170)
14(200)
GFP-LC3(150)
wt + p-roGFP2
0
80
100
120
140
p-Ch p-KR
PO /
mm
2(x
103 ) *
A m5-7
20
40
60
c-KR
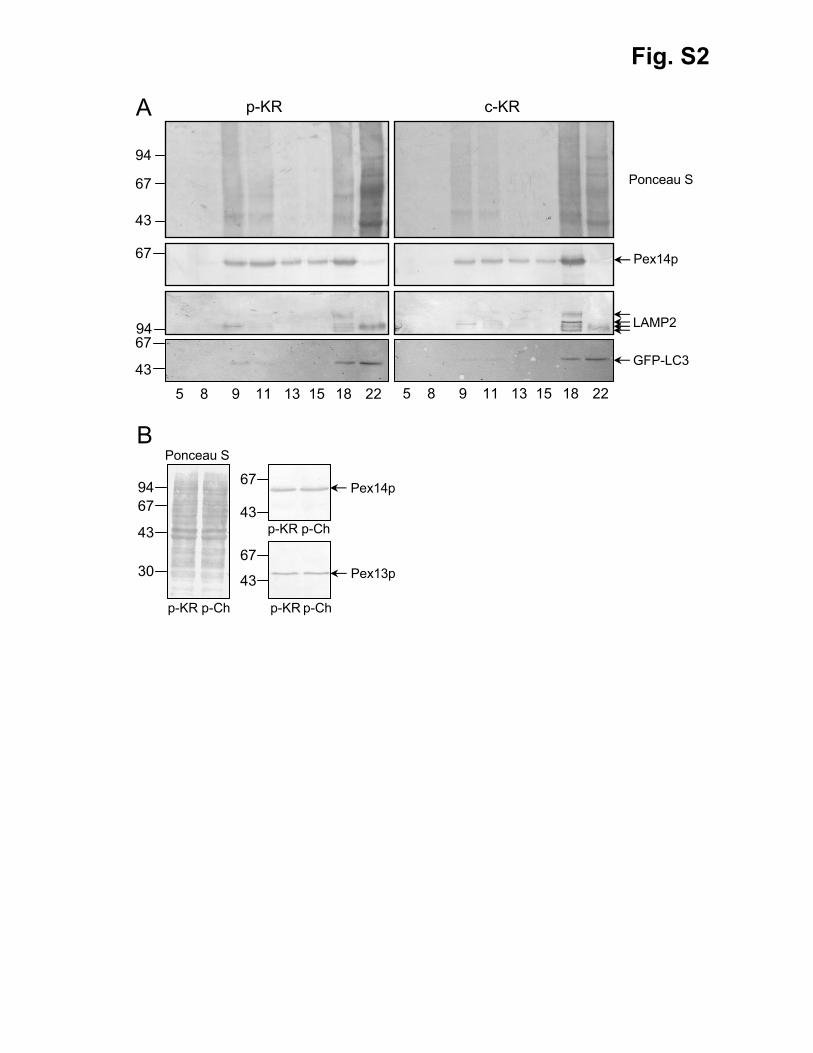
Fig. S2
9467
43
30
67
43
67
43
B
Pex14p
Pex13p
p-KR
Ponceau S
p-Ch
p-KR p-Ch
p-KR p-Ch
A p-KR
94
67
43
Ponceau S
43
67GFP-LC3
5 8 9 11 13 15 18 22
c-KR
Pex14p67
LAMP2
5 8 9 11 13 15 18 22
94