Embed Size (px)
Citation preview
i
Potential of Cave Bacteria in Drug Discovery: Investigation of Sphingopyxis terrae and other Bacteria from a BC Cave
By
Raniyah Alnahdi
A THESIS SUBMITTED IN PARTIAL FULFILLMENT OF
THE REQUIREMENTS FOR THE DEGREE OF
MASTER OF SCIENCE
In
THE FACULTY OF SCIENCE
GRADUATE STUDIES
(Department of Biological Sciences)
THOMPSON RIVERS UNIVERSITY
(Kamloops)
14/05/2014
© Raniyah Alnahdi
May 2014
ii
Acknowledgements
I would like to extend my sincere appreciation and gratitude to Allah and to all those who
encouraged and assisted me in this study. Completion of this thesis would not have been
possible without Allah, my supervisor, my family and friends.
I would like to express my gratitude and deepest appreciation to my supervisor: Dr.
Naowarat Cheeptham (Ann), for her invaluable advices, supervision and encouragement
throughout this study.
My sincere gratitude is given to the examining committee, Drs. Kingsley Donkor, Ken
Wagner, Julian Davies (UBC) and Laura Lamb.
I would like to express my special gratitude to my mother, father and Jafer, my husband,
who were instrumental in my pursuit of this degree. I am also thankful to my lovely
siblings, who without their love I wouldn’t have accomplished my study goals.
I would like to thank most sincerely, Saudi Arabia’s Ministry of Higher Education for
their granting me a scholarship pursue my master’s degree in Canada. I am also deeply
grateful to Saudi Cultural Bureau in Ottawa for their support.
Finally, I am grateful to all participants who helped me make this study possible.
Raniyah Salem Alnahdi
1
Potential of Cave Bacteria in Drug Discovery: Investigation of Sphingopyxis terrae
and other Bacteria from a BC Cave
Raniyah Alnahdi
Supervisor: Dr. Naowarat Cheeptham (Ann)
Thesis Committee: Drs. Kingsley Donkor, Ken Wagner, Julian Davies and Laura
Lamb
Abstract
The discovery of new and more effective antibiotics continues to be a priority
given the frequency of the emerging multi-drug resistant pathogenic microorganisms.
Thus, scientists are searching for new antibiotics from microorganisms selected from
extreme habitats such as very old caves. Various cave bacteria species were isolated and
could be sources of new antibiotics. The objective of our work is to isolate cave bacteria
from a volcanic cave in Wells Gray Provincial Park in BC and to test if they produce
metabolites with antimicrobial activity against some microorganisms including multi-
drug resistant pathogens. This study used 16 cave strains previously isolated and screened
against a panel of microorganisms including drug resistant pathogens. Upon retesting, 4
out of 16 cave bacterial isolates, RA001, RA003, RA004, and PM58B-RA, demonstrated
antimicrobial activity against Mycobacterium smegmatis, Micrococcus luteus,
Acinetobacter baumannii and MDR-Staphylococcus aureus. To study the conditions for
best growth and antimicrobial production, these four bacteria were cultured in different
fermentation media (namely Hickey-Tresner, R2A, V-8 juice and ISP-2) and incubated at
12 and 25°C for 14 days. During the course of fermentation, the percentage of packed
cell volume (%PCV), antimicrobial activity and pH were observed and recorded daily. It
was found that each of the bacteria demonstrated antimicrobial activity against different
microorganisms at various times of fermentation and temperature. Overall, R2A broth
2
medium and the lower temperature of 12°C appear to be best for antimicrobial production
by the cave bacteria used in this study. Isolation and purification of the antimicrobial
compounds produced by these isolates is under investigation using the best growth
conditions determined in this study. We identified these bacteria using chemotaxonomic
studies; 16S rRNA sequencing and Matrix-assisted laser desorption/ionization-time of
flight (MALDI-TOF), all isolates were identified to the species level. PM58B was found
to be Bacillus licheniformis, RA001, and RA004 were identified as Arthrobacter agilis
that may be of different variants. While RA003 was identified as Sphingopyxis terrae.
Active compounds from RA003 fermentation broth were further studied by extraction
and purification.
In conclusion, cave bacteria are promising sources of potential novel
antimicrobial compounds. Isolation, optimization of screening, growth media and
conditions of cave bacteria may be useful in the discovery of new antimicrobial drugs.
Additionally, the knowledge obtained from this study with respect to cave bacteria and
their roles in cave formation and degradation will add to existing information on cave
conservation.
3
Table of Contents
Acknowledgements................................................................................................................................................... ii
List of Tables................................................................................................................................................................ 6
List of Figures .............................................................................................................................................................. 7
1 Introduction ............................................................................................................................................................. 9
1.1 Summary ........................................................................................................................................................... 9
1.2 The Objectives of This Research .......................................................................................................... 12
1.3 Literature Review....................................................................................................................................... 13
1.3.1 Antibiotics ............................................................................................................................................. 13
1.3.2 Mechanism of Action of Antibiotics ........................................................................................... 14
1.3.3 Antibiotic Resistance........................................................................................................................ 15
1.3.4 The Need for New Antibiotic Agents ......................................................................................... 20
1.3.5 The Cave Habitat as a Source of Novel Antibiotic-‐Producing Bacteria....................... 22
1.3.6 Techniques Used to Analyze and Identify Cave Bacteria.................................................. 26
1.3.7 Approaches for Screening Bacteria for the Production of Novel Antimicrobial Agents ................................................................................................................................................................ 28
1.3.8 Study of Culture Conditions for Cave Bacteria...................................................................... 29
2.0 Materials and Methods ................................................................................................................................. 33
2.1 Isolation of microorganism from cave .............................................................................................. 33
2.1.1 Collecting samples............................................................................................................................. 33
2.1.2 Isolation of cave microorganisms............................................................................................... 33
2.2 Optimizing the fermentation conditions of the cave strains ................................................... 34
2.2.1 Primary optimization of the cave strains ................................................................................ 34
2.2.2 Growing tested microorganisms for the antimicrobial assay ........................................ 35
2.2.3 Primary screening of the cave bacteria isolates for antimicrobial production ...... 36
2.3 Further of the secondary metabolite production of four cave bacteria isolates ............ 37
2.3.1 Study of the fermentation periods of the cave bacteria .................................................... 38
2.3.2 Testing the percentage of packed cell volume (%PCV) and the pH value of the inoculated broths .......................................................................................................................................... 38
2.4 The antimicrobial activity detection assay ..................................................................................... 39
4
2.4.1 The cross-‐streak assay .................................................................................................................... 39
2.4.2 Paper disc diffusion method ......................................................................................................... 40
2.5 Identification of antimicrobial production by the cave isolates ............................................ 40
2.5.1 Morphological observations ......................................................................................................... 41
2.5.2 Chemotaxonomy ................................................................................................................................ 41
2.5.3 Molecular identification of the antimicrobial-‐producing cave strains using 16S rRNA gene sequencing................................................................................................................................ 42
2.5.4 Using Matrix-‐assisted laser desorption/ionization (MALDI-‐TOF) to identify the four antimicrobial-‐producing isolates ................................................................................................. 44
2.6 Extraction and Purification of the Secondary Metabolite......................................................... 47
3.0 Results.................................................................................................................................................................. 51
3.1 Sample collection and isolation of cave microorganisms ......................................................... 51
3.2 Primary screening of the antimicrobial activity of the sixteen bacterial isolates .......... 52
3.3 Further screening of the antimicrobial activity of the four selected isolates .................. 54
3.3.1 Effect of fermentation broth on antimicrobial activity ..................................................... 54
3.3.2 Effect of inoculation volume on antimicrobial activity ..................................................... 56
3.3.3 Effect of the length of fermentation on antimicrobial activity ....................................... 57
3.3.4 Effect of pH and packed cell volume (PCV%) on antimicrobial activity .................... 58
3.3.5 Effect of fermentation temperature on antimicrobial activity....................................... 63
3.4 Test of the antimicrobial activity of the four isolates against each other using the cross-‐streak assay and paper disc diffusion method ......................................................................... 67
3.4 Identification of the four isolates with antimicrobial activity ................................................ 70
3.4.1 Morphological observations and chemotaxonomic study ............................................... 70
3.4.2 Production of pigments by the isolates.................................................................................... 76
3.4.3 Molecular identification of the four antimicrobial cave isolates by 16S rRNA gene sequencing ....................................................................................................................................................... 76
3.4.4 Identification of the four antimicrobial cave isolates by MALDI-‐TOF MS................. 78
3.5 Extraction and purification of the bioactive antimicrobial compounds produced by the four isolates .......................................................................................................................................................... 82
4.0 Discussion........................................................................................................................................................... 84
4.1 Sample collection and initial selection.............................................................................................. 84
4.2 Antimicrobial activity of the 16 bacterial isolates in different media ................................. 84
4.3 Selection of best media for further antimicrobial activity assays ......................................... 88
4.3. 1 Production of pigments by the isolates................................................................................... 90
5
4.4 Study of fermentation conditions for the four selected isolates............................................ 90
4.4.1 Temperature ........................................................................................................................................ 91
4.4.2 pH.............................................................................................................................................................. 92
4.4.3 Fermentation period ........................................................................................................................ 92
4.4.4 Inoculation volume ........................................................................................................................... 94
4.5 Classification and identification of the cave isolates .................................................................. 95
4.6 Assay of the antimicrobial activity of the isolates against each other................................. 97
References................................................................................................................................................................100
Appendix...................................................................................................................................................................113
Appendix B...............................................................................................................................................................117
Appendix C-‐ Isolates sequences from using 800R and 518F primer. ............................................121
Appendix D-‐ Actual mass spectrum of RA003, RA001, RA004, PM58B-‐RA isolate .................129
6
List of Tables
Table 1: Examples of microorganisms found in various caves…………………….23
Table 2: The list of tested microorganisms used in this project……………………35
Table 3: Primers used in amplification......................................................................42
Table 4: The Accession Numbers of isolates………………………………………43
Table 5: The zones of inhibition (mm) observed in the 16 bacterial isolates ……..52
Table 6: Evaluation of the impact of growth medium……………………………..54
Table 7: The inhibition zone diameter for the four bacterial isolates……………...63
Table 8: Best culture conditions for the antimicrobial activity of each isolate…….66
Table 9: Inhibition zones for each the four isolates against one another…………..67
Table 10: Microscopic morphological features of the four cave isolates…………..70
Table 11: Taxonomic status of the four isolates…………………………………....75
Table 12: Identification of the four cave isolates using MALDI-TOF MS………...76
7
List of Figures Figure 1: General structure of penicillin ………………………………………………...61
Figure 2: Timeline showing the discovery of antibiotics and resistance .......................... 15
Figure 3: Map of the Helmcken Falls Cave...................................................................... 34
Figure 4: The discs used to test the antimicrobial activity ............................................... 37
Figure 5: Isolation of cave microorganisms by culture on different selective media
(Moote 2010). ................................................................................................................... 51
Figure 6: Primary screening of the 16 cave strains........................................................... 54
Figure 7: Identification of the best fermentation broth…………………………………..56
Figure 8: Effect of the duration of culture on the antimicrobial activity of the PM-58B-
RA isolate………………………………………………………………………………..59
Figure 9: Effect of the duration of culture on the antimicrobial activity of the RA001
isolate. ............................................................................................................................... 60
Figure 10: Effect of the duration of culture on the antimicrobial activity of the RA004
isolate. ............................................................................................................................... 61
Figure 11: Effect of the duration of culture on the antimicrobial activity of the RA003
isolate. ............................................................................................................................... 62
Figure 12: Effect of temperature on the growth of the RA001 isolate. ............................ 64
Figure 13: Effect of temperature on the growth of the RA003 isolate. ............................ 65
Figure 14: Effect of temperature on the growth of the RA004 isolate. ............................ 65
Figure 15: Effect of temperature on the growth of the PM58B-RA isolate. .................... 66
Figure 16: Test of the antimicrobial activity of each of the four isolates against the other
isolates using the cross-streak assay.. ............................................................................... 69
Figure 17: Test of the antimicrobial activity of each of the four isolates against the other
isolates using the paper disc diffusion assay. ................................................................... 69
Figure 18: Morphology of the colonies of the PM58B-RA, RA001, RA004 and RA003
isolates .............................................................................................................................. 70
8
Figure 19: Thin layer chromatography analysis of the amino acid composition of whole
cell hydrolysates of the RA003 isolate.. ........................................................................... 72
Figure 20: Thin layer chromatography analysis of the amino acid composition of whole
cell hydrolysates of the RA004 isolate. ............................................................................ 73
Figure 21: Thin layer chromatography analysis of the amino acid composition of whole
cell hydrolysates of the PM58B-RA isolate. .................................................................... 74
Figure 22: Thin layer chromatography analysis of the amino acid composition of whole
cell hydrolysates of the RA001 isolate.. ........................................................................... 75
Figure 23: MALDI-TOF MS spectra for the RA003 isolate ............................................ 79
Figure 24: MALDI-TOF MS spectra for the RA001 isolate…………………………….79
Figure 25: MALDI-TOF MS spectra for the RA004 isolat .............................................. 80
Figure 26: MALDI-TOF MS spectra for the PM58B-RA isolate. ................................... 81
Figure 27: Inhibition zone of the active fraction RA003E0102 ....................................... 83
9
1 Introduction 1.1 Summary
The objective of this study was to isolate bacteria from a volcanic cave in Wells
Gray Provincial Park in BC, and investigate whether these bacteria can produce
metabolites with antimicrobial activity against various tested microorganisms including
pathogens and non-pathogens. Previous studies demonstrated that a diverse community
of microorganisms inhabiting the Helmcken Falls Cave could inhibit various tested
microorganisms and indicated that some of these microorganisms have the ability to
produce antimicrobial agents; Rule and Cheeptham, 2013; Cheeptham et al., 2013). The
present study confirms that a wide variety of microorganisms inhabiting the Helmcken
Falls Cave possess antimicrobial activities that can inhibit the growth of some tested
bacteria.
Sixteen cave bacterial isolates were examined using the disc-diffusion (Kirby-
Bauer) method against the tested microorganisms such as Mycobacterium smegmatis,
Micrococcus luteus, multi-drug resistant Staphylococcus aureus (MDR-MRSA),
Acinetobacter baumannii, ESBL E. coli and Candida albicans. In total, four isolates
demonstrated effective antimicrobial activity, as they had the ability to kill and inhibit the
growth of tested microorganisms such as Gram-positive and/or negative-bacteria.
Interestingly, one of the isolates (RA003) displayed antimicrobial activity against MDR-
MRSA.
This study also demonstrated that the media selection was critical in the
antimicrobial activity of the isolates. R2A broth was the optimal medium for the
antimicrobial activity of all four isolates selected for further study. Production of
antimicrobial activity was not observed for some isolates in some of the media tested, and
some of the isolates displayed varying levels and/or loss of antimicrobial activity during
the fermentation course when cultured in various media. Notably, the RA001, RA004 and
PM58B-RA isolates lost their antimicrobial activity on specific days of culture and then
antimicrobial activity reappeared on subsequent days of culture. These observations were

10
consistent with repeating experiments. The reasons are not clear as to why they lost their
activity, these need to be further studied. Additionally, the characteristics of secondary
metabolites are not completely understood at this time, their chemical structures need to
be further studied. One plausible explanation may be due to their functions, the
antimicrobial activity of secondary metabolites in the laboratory may not reflect their role
in nature (Bibb, 2005).
Temperature, pH, fermentation period, seed inoculum volume and the type of
media all had effects on the antimicrobial activity, growth and production of pigments by
the four isolates. In general, when inoculated using a 2% seed culture, cultured at 12 or
25°C and pH 7.8-8.5 with shaking at 250 rpm over 14 days, the optimum fermentation
period for antimicrobial activity was between days 3-11 for all four isolates. Production
of pigments by the isolates was also affected by various physical factors: culture media,
fermentation period and temperature; previous studies have shown that a variety of
factors can affect bacterial pigmentation(Reasoner and Geldreich, 1985) (Reasoner and
Geldreich, 1984; Goswami, 2010).
All in all, this study has confirmed using a combination of techniques; we were
able to reliably identify with 16S rRNA sequencing, three isolates identified to the
species level and one isolate to the genus level matching with 99% similarity were
identified on the basis of 16S rRNA gene sequencing, enabling identification of the
PM58B-RA, RA001 and RA004 isolates to the species level. MALDI-TOF MS
confirmed the results of the 16S rRNA gene sequencing; however, MALDI-TOF MS also
identified the RA003 isolate to the species level.
In conclusion, four isolates with antimicrobial activity isolated from the
Helmcken Falls Cave were studied and identified, and the effect of different fermentation
conditions on the antimicrobial activity of the isolates was investigated. In the future, a
variety of temperatures such as 7°C, 12°C, 15°C, 25°C and 30°C should be tested in
order to optimize the antimicrobial activity of each isolate, as 12°C and 25°C may not be
close to the optimal temperatures for each isolate. Additionally, further research is
required to purify and identify chemical structures of the antimicrobial secondary
metabolites, and investigate the mechanisms underlying the effects of different

11
fermentation conditions on the production of antimicrobial secondary metabolites by
these isolates. It will also be important to determine the mode of action study of these
antimicrobial compounds and investigate their antimicrobial activities against different
tested microorganisms using in vitro assays.
12
1.2 The Objectives of This Research
1-‐ To isolate and screen cave bacteria to determine if they produce metabolites with
antimicrobial activity against the pathogenic microorganisms Micrococcus luteus,
MDR-MRSA, Acinetobacter baumanni, Mycobacterium smegmatis, Candida
albicans, Escherichia coli, Klebsiella pneumoniae and Pseudomonas aeruginosa.
2- To partially purify the secondary metabolites produced by the cave isolates to study
their structure.
13
1.3 Literature Review
1.3.1 Antibiotics
Antimicrobial agents are “chemical substances that kill or inhibit the growth of
microorganisms” (Cushnie and Lamb, 2005), and the term includes antibacterial,
antifungal, antiparasitic and antiviral compounds (Kujumgiev et al., 1999). Professor
Selman A. Waksman first defined antibiotics in the 1940s as “chemical substances of
microbial origin that possess antibiotic capacity”. In general, antibiotics are substances
derived from plants, animals or microbes that can inhibit bacterial growth (Kannel et al.,
1971; Strohl, 1997; Davies, 2006).
There are three classifications of antibacterial agents: natural, semi-synthetic and
synthetic. Natural antibiotics are antibiotics originally derived from microorganisms,
fungi, plants or animals (Topliss et al., 2002); microorganisms may develop resistance to
natural antimicrobials more rapidly as they have been pre-exposed to these compounds in
nature. Semi-synthetic drugs are natural compounds that have been chemically altered to
reduce their toxicity and increase their effectiveness. Synthetic drugs may be
advantageous as bacteria have not previously been exposed to these compounds (Topliss
et al., 2002). However, on the other hand, natural antibiotics and semi-synthetic drugs are
less effective than synthetic antibiotics (Topliss et al., 2002).
14
Figure 1: General structure of penicillin (Baldo, 1999)
Penicillin and tyrothricin were the first antibiotics used to kill gram-positive
bacteria (Figure 1; Spector et al., 2012; Brozak, 2013). During the 1940s, Selman
Waksman first isolated the antibiotic streptomycin, which is an inhibitor of several gram-
negative and -positive bacteria and provided the first effective treatment for tuberculosis
(Davies, 2010). Most modern antibiotics were discovered between 1945 and 1960, a
period regarded as "The Golden Era of Antibiotic Discovery"; a wide range of antibiotics
effective against a variety of pathogens including gram-positive and gram-negative
bacteria were identified during this time (Spector et al., 2012).
1.3.2 Mechanism of Action of Antibiotics
Different antibiotics have varying mechanisms of action and target sites within
bacterial cells, based on their structure. The major targets of common antibiotics are
proteins related to DNA synthesis, protein synthesis, cell wall synthesis, nucleic acid
synthesis and other metabolic processes (Bauer and Dicks, 2005). For example,
15
penicllins, cephalosporins and vancomycin inhibit bacterial cell wall synthesis, and these
antibiotics do not affect human and animals cells as they do not have cell walls.
1.3.3 Antibiotic Resistance
1.3.3.1 The Appearance of Antibiotic Resistance
Antibiotic resistance is a significant threat to human health, as it counteracts the
beneficial effects of the antibiotic compound targeting the pathogen (Cushnie and Lamb,
2005), often resulting in treatment failure, which can cause severe health consequences
and may lead to death (Tenover, 2006). Resistance both pathogenic and non-pathogenic
microorganisms can develop rapidly following the deployment of a new antibiotic
(Figure 2).
Figure 2: Timeline showing the discovery of antibiotics and the first appearance of resistance (Clatworthy et al., 2007).
More than 70 years ago, the antibiotic era started with sulfonamide (Figure 2),
16
and scientists identified bacterial resistance to sulfonamide in the 1940s (Fleming, 1945).
Resistance to almost every available antibiotic has been observed in both Gram-negative
and Gram-positive bacteria (Ash 2002; Rice, 2006; Baquero et al., 2008;). Today, the
growing emergence of antibiotic-resistant bacterial strains makes antibiotics ineffective
for the treatment of infectious diseases. The Infectious Disease Society of America
reported that approximately 70% of hospital-acquired infections in the United States are
resistant to one or more antibiotic (Chadwick et al., 1996; Davies, 2010).
The continual discovery of resistance against novel antimicrobial agents is not
unexpected, as antibiotics and other related organic molecules are similar to other natural
products. Nevertheless, bacterial resistance is a particular problem in healthcare settings,
and the appearance of novel resistance genes in the clinic is alarming as it necessitates the
controlled use of antibiotics (Levy, 2002).
1.3.3.2 Major Species of Antibiotic-Resistant Bacteria
The increasing prevalence of multidrug-resistant (MDR) strains, such as
methicillin-resistant Staphylococcus aureus (MRSA), MDR Acinetobacter baumannii,
and extended-spectrum beta-lactamase (ESBL)-producing Escherichia coli,
Mycobacterium tuberculosis, Klebsiella pneumoniae, Salmonella spp. and P. aeruginosa,
is a serious risk to human health. Such pathogens are resistant to most available
antibiotics, reducing the number of curative options and making treatment of these
infections more expensive (Conly, 2002; Dapkevicius, 2013).
Acinetobacter species are common nosocomial Gram-negative pathogens, which
cause blood stream infections, secondary meningitis and urinary tract infections (Camp et
al., 2010). Three Acinetobacter species cause disease; however, 80% of these infections
are associated with A. baumannii (Camp et al., 2010). Approximately 12,000 healthcare-
associated Acinetobacter infections occur in the United States every year (Camp et al.,
2010). MDR Acinetobacter strains are frequently resistant to penicillin, ampicillin,
17
aminoglycosides, erythromycin, cephalosporins, chloramphenicol, norfloxacin,
streptomycin and tetracycline (Camp et al., 2010).
MRSA is a Gram-positive bacterium and a major cause of nosocomial and
society-acquired infections (Matsui et al., 2011). MRSA causes bloodstream infections,
pneumonia and surgical-site infections, and is resistant to methicillin and other penicillin-
class agents (Pray et al., 2008; Russo and Johnson, 2003). In 2004, the Centers for
Disease Control reported that 63% of Staphylococcus infections were due to MRSA
(Camp et al., 2010).
Even though the Gram-negative bacterium E. coli is a component of the normal
human and animal intestinal flora (Tadesse et al., 2012), it is the second-most common
cause of human infections after S. aureus (Russo & Johnson, 2003). E. coli causes
intestinal, extra-intestinal and urinary tract infections; such infections kill around 7200
people in the United States each year (Russo & Johnson, 2003). Furthermore, E. coli
causes diarrhea, which kills about 1 million people each year worldwide; most of these
cases are children and immuno-compromised individuals (Russo & Johnson, 2003).
Tadesse et al., (2012) studied the evolution of drug resistance in E. coli strains from the
1950s through to 2002 and found resistance to ampicillin, sulfonamide and tetracycline.
Another recent study by Olson et al. (2009) reported that E. coli is resistant to a
sulfonamide used to treat urinary tract infections.
1.3.3.3 Genetics of Antibiotic Resistance
Antibiotic resistance genes acquired via horizontal gene transfer between bacteria
are responsible for the phenomenon of resistance (Levy, 2002; Davies, 2010). Antibiotic
exposure provides a pressure that selects for bacteria possessing resistance genes.
Resistance develops as a result of two factors: the antibiotic itself and the resistance gene.
The antibiotic acts as a selective agent that helps to select for organisms possessing the
resistance gene; both of these factors are required for resistance to develop.
18
Scientists have conducted functional studies of bacteria isolated from different
environments to identify the sources of antibiotic-resistance genes (White, 2013; Bhullar,
2011). Bacterial DNA was collected from different environments such as soil, processed
sewage and the human intestine, and antibiotic-resistance genes were found in each
environment tested (White, 2013). In 2012, Forsberg and colleagues described natural
environments as reservoirs of antibiotic-resistance genes that enable the genes to be
transferred between soil bacteria and clinical pathogens. Additionally, seven resistance
genes found in soil microbes were highly similar to the resistance genes found in clinical
isolates of human pathogens.
Bhullar (2011) investigated microbes isolated from the Lechuguilla cave, New
Mexico. The microorganisms inhabiting this ‘isolated cave’ are unlikely to have had
contact with surface water or influences for 4-6 million years, and even today, human
access to this cave is extremely limited. The authors reported that genetic diversity was a
critical measure of resistance in the cave isolates. For example, some of the bacteria were
highly resistant to different commercially available antibiotics, which the cave bacteria
are extremely unlikely to have encountered in their natural environment. Together, these
studies support the suggestion that antibiotic resistance is a naturally occurring process
which is encoded for by ancient microbial genes (Hughes and Datta, 1983; Barlow and
Hall, 2002; Bhullar, 2011).
Numerous recent studies have indicated that resistance genes arise due to the
frequent use of antibiotics (Levy, 2002; Davies, 2010; Bhullar, 2011). However, other
studies suggest that some resistance genes existed before humans used antibiotics to treat
diseases (White 2013). Several studies of antibiotic-resistance genes have reported that
decreasing the use of antibiotics will help alleviate the problem of resistance (White
2013). Furthermore, using an alternative approaches such as antimicrobial vaccines or
bacteriophages may help to decrease the spread of drug resistance and provide a tool for
combating highly resistant infections (Dantas et al., 2008).
19
1.3.3.4 Mechanisms Contributing to the Evolution of Antibiotic Resistance
Microorganisms use various mechanisms to protect themselves from other
organisms. Bacteria can transfer the genes responsible for antibiotic resistance into other
bacteria via plasmids. A single plasmid can carry genes conferring resistance to multiple
antibiotics (Bennett, 2008). A. baumannii expresses a single enzyme, β-lactamase, that
confers resistance to penicillins, cephalosporins and carbapenems (Levy, 2002). A.
baumannii can also acquire other genes, such as acetyltransferases, phosphotransferases
and nucleotidyltransferases, which confer resistance to fluoroquinolones and
aminoglycosides (Levy, 2002). Extra-chromosomal elements such as plasmids can
transfer genes between bacteria, and resistance genes can be transferred between Gram-
positive and Gram-negative bacteria (Levy, 2002). Other mechanisms, such as
bacteriophages and naked-DNA mechanisms, also contribute to the evolution of
resistance by moving resistance genes between different bacterial species and
populations; however, these mechanisms do not function in all types of bacteria (Levy,
2002).
1.3.3.5 The Impact of Human Activities on the Evolution of Drug Resistance
The increasing prevalence of antimicrobial resistance is the result of bacteria
evolving over time in response to natural and societal pressures that constrain their ability
to grow and disperse (Spellberg, 2012). The role played by human activities is a central
issue in antibiotic resistance. Antibiotic resistance began to spread soon after humans
started using antibiotics widely in medicine and agriculture. The misuse of drugs to
promote human and animal health and increase food production has accelerated the
evolution of antimicrobial resistance (Bhullar, 2011). In addition, the same antibiotics
have been used to treat humans as well as animals and agricultural crops, which may
have contributed to the high levels of resistance observed today (Bhullar, 2011).

20
The frequent release of antibiotics into bodies of water and wastewater is also
believed to contribute to the spread of antibiotic-resistance genes (Baquero et al., 2008).
For example, an increase in the use of avoparcin, a glycopeptide used as a growth
promoter in poultry farms, was found to lead to the spread of vancomycin-resistant
Enterococci in the intestinal flora of poultry animals. When the use avoparcinuse was
reduced, glycopeptide resistance diminished in the animal flora (Bhullar, 2011). There
are similar examples of human activity contributing to resistance to tylosin,
virginiamycin and other antibiotics (Bhullar, 2011). It is important to educate people by
arranging workshops and training, especially farmers and workers, about community
safety to reduce antibiotic resistance in human and agricultural populations. Education
may be the most effective means to reduce the transmission of antibiotic-resistant
organisms within communities (Bhullar, 2011).
Additionally, antibiotic-resistant organisms can spread within healthcare
communities. For example, MRSA has become a widespread problem in healthcare
facilities and hospitals around the world. Antibiotic-resistant bacteria can spread via the
transfer of patients between hospitals or more widely via medical tourism. In addition,
40, 25, and 10% of patients receiving antibiotic treatments carried two or more, three or
more, and four or more drug resistant-bacteria, respectively, in 10% of their E. coli
(Bhullar, 2011). Additionally, the discovery of resistance in commensal strains may
indicate future problems with resistance to an agent in clinical pathogens in that hospital
or community (Levy, 2002).
1.3.4 The Need for New Antibiotic Agents
Drug discovery must focus on finding novel structures, mechanism and targets to
inhibit bacterial growth (Strohl, 1997; Brozak, 2013). There are a number of reasons
driving scientists to discover and develop new antibiotics with novel structures and
activities (Strohl, 1997). New infectious diseases that were previously unknown to
21
scientists have emerged. Additionally, some crucial antibiotics such as gentamicin and
other aminoglycosides have high toxicities that constrain their effectiveness (Strohl,
1997). However, the increase in the spread of antibiotic-resistant bacteria, particularly
MDR pathogens, has become one of the most serious problems in healthcare (Wright,
2007; Davies, 2010; Cheeptham, 2013; Strohl, 1997) and is the major reason driving the
search for new antibiotics.
Between 1983 to 1987, 16 new antibiotics were approved for use in humans. In
contrast, only two new antibiotics were approved between 2008 and 2012 (Spellberg,
2012). Fluoroquinolones, a class of drugs discovered 40 years ago and used to treat
Gram-negative bacilli infections, were the last new class of antibiotics to be discovered
(Spellberg, 2012). Hence, due to the lack of novel antibiotic agents, the prevalence of
antibiotic resistance among Gram-negative bacteria is increasing (Pallett and Hand, 2010;
Spellberg, 2012).
Strohl (1997) stated that the continued development of new antibiotics over the
next decade is required to enter a “new era of antibiotics”; otherwise, antibiotics may
become increasingly ineffective against drug-resistant pathogens. Dr. Margaret Chan, the
head of the World Health Organization, declared that the world faces a post-antibiotic era
in which infectious diseases will be increasingly difficult to treat using antibiotics
(Brozak, 2013). Dr. Keiji Fukuda (2013), the Assistant Director General of the World
Health Organization, declared that the rapid emergence of antibiotic resistance is a global
risk to human health. Therefore, researchers, companies and governments must help to
develop new methods for drug discovery in order to provide novel, more effective
antibiotics. Otherwise, we may become unable to treat a number of pathogenic
microorganism infections. For example, novel antibiotics with new mode of action need
to be developed to enable effective combination therapy against MRSA.
New sources of microorganisms must be found to increase the chances of
discovering and developing new antibiotics. Natural resources are a major source of
drugs. Over half of the drugs used today were discovered as natural products in plants,
22
animals, the oceans, caves or soil (Ji et al., 2009). It is important to search for new
sources of drugs in extreme environments to broaden our chances of finding novel
antimicrobial agents (Strohl, 1997).
For example, Mars could be a potential source of pharmacologically active agents
(Gabriel and Northup, 2013). Microbiologists have hypothesized about the existence of
cave-dwelling microorganisms on Mars and the potential of such organisms to be a new
source of secondary metabolites with useful properties (Boston et al., 2001; Leveille and
Datta, 2010). Mars is an extreme environment with a strong surface radiation, making life
on the surface of Mars impossible. Some of the conditions on Mars are similar to those
on Earth, such as warm temperatures and the presence of water (Baker et al., 1991; Beaty
et al., 2005). Cushing et al. (2007) and Deak (2010) presented high-quality pictures of
lava-tube caves beneath the surface of Mars, and Boston et al. (2006) reported that the
Martian lava tubes might be much larger than those on Earth because of the lower gravity
on Mars. One day, looking for microorganisms in the Martian lava-tube caves may lead
to the discovery of new antibiotics.
1.3.5 The Cave Habitat as a Source of Novel Antibiotic-Producing Bacteria
Caves are unique in nature, unexploited, and poorly studied (Cheeptham, 2013;
Gabriel and Northup, 2013). Caves are extreme environments in which highly specialized
microorganisms grow, making them attractive places to look for new microorganisms
that could produce novel bioactive compounds. Several novel organisms have been found
in caves (Gabriel & Northup, 2013; see Table 1). Lee et al. (2000) identified two new
species belonging to the genus Saccharothrix, Saccharothrixviolacea sp. nov. and
Saccharothrixalbidocapillata comb. nov., in soil samples collected from a gold mine in
Korea. Lee (2006) also studied the biodiversity of cave bacteria in a natural cave in Korea
and discovered a novel actinomycete, Nocardiajejuensis sp. Cheng et al. (2013) isolated
the novel species Microlunatuscavernae sp. nov. from an ancient cave in China.
Margesin et al. (2004) discovered a new species belonging to the genus Arthrobacter,
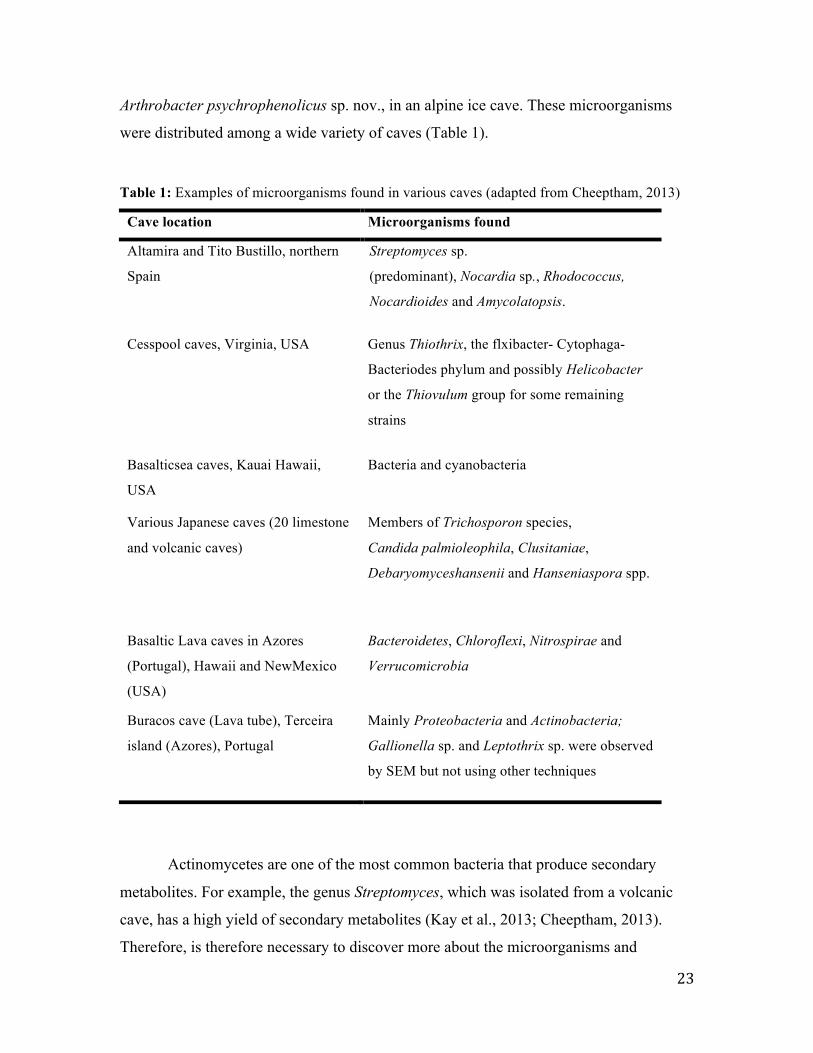
23
Arthrobacter psychrophenolicus sp. nov., in an alpine ice cave. These microorganisms
were distributed among a wide variety of caves (Table 1).
Table 1: Examples of microorganisms found in various caves (adapted from Cheeptham, 2013)
Cave location Microorganisms found
Altamira and Tito Bustillo, northern
Spain
Streptomyces sp.
(predominant), Nocardia sp., Rhodococcus,
Nocardioides and Amycolatopsis.
Cesspool caves, Virginia, USA
Genus Thiothrix, the flxibacter- Cytophaga-
Bacteriodes phylum and possibly Helicobacter
or the Thiovulum group for some remaining
strains
Basalticsea caves, Kauai Hawaii,
USA
Bacteria and cyanobacteria
Various Japanese caves (20 limestone
and volcanic caves)
Members of Trichosporon species,
Candida palmioleophila, Clusitaniae,
Debaryomyceshansenii and Hanseniaspora spp.
Basaltic Lava caves in Azores
(Portugal), Hawaii and NewMexico
(USA)
Bacteroidetes, Chloroflexi, Nitrospirae and
Verrucomicrobia
Buracos cave (Lava tube), Terceira
island (Azores), Portugal
Mainly Proteobacteria and Actinobacteria;
Gallionella sp. and Leptothrix sp. were observed
by SEM but not using other techniques
Actinomycetes are one of the most common bacteria that produce secondary
metabolites. For example, the genus Streptomyces, which was isolated from a volcanic
cave, has a high yield of secondary metabolites (Kay et al., 2013; Cheeptham, 2013).
Therefore, is therefore necessary to discover more about the microorganisms and
24
environmental conditions inside caves.
1.3.5.1 Effect of the Cave Habitat on Microorganisms and Antibiotic Production
The environmental conditions inside caves include various factors that could
influence microbial communities (Cheeptham, 2013). The factors influencing cave
conditions include light, temperature, energy and nutrient availability. Caves are harsh
environments, deficient in light and nutrients (Dapkevicius, 2013). Previous studies of
volcanic environments revealed that the lack of sunlight in caves forced some common
bacteria to adapt (Northup et al., 2011; Cheeptham, 2013).
The ability of different microbes to grow in caves suggests that caves may be
ideal environments that provide diverse habitats for microbes. However, it is not known
how organisms obtain energy in caves, where energy sources are often rare.
Heterotrophic bacteria have a variety of mechanisms to obtain organic carbon (Barton
and Jurado, 2007). For example, running streams and rivers may bring organic carbon in
the form of plant material into caves from the surface. In addition, airflow can carry
various carbon sources into caves. Animals and humans can also bring organic carbon
into caves (Gabriel and Northup, 2013); such visitors may induce the production of
antimicrobial agents in caves (Montano and Henderson, 2013).
Chemolithoautotrophs are bacteria that obtain energy by oxidizing inorganic
compounds such as ammonia, iron, nitrogen, hydrogen and hydrogen sulfide (Gabriel and
Northup, 2013). Chemolithoautotrophs inhabit caves, such as the arid-land caves in New
Mexico, where microbes obtain energy from reduced gases that pass through springs
(Gabriel and Northup, 2013). While energy is essential for the production of bacterial
metabolites, inorganic compounds such as nitrogen, iron, sulfur and carbon dioxide also
play an important role in the production of bacterial metabolites (Northup at el., 2011).
Temperature, humidity, and light are also important factors determining bacterial
diversity in cave systems. Temperature and humidity vary more inside lava caves than
25
outside the cave (Cropley, 1965). Northup et al. (2011) studied the microbial
communities in three lava-tube caves that differed significantly in temperature (14-19°C
in Hawaii, 15-16°C in the Azores and -2 to 9°C in New Mexico) and humidity. Despite
the diversity of conditions between these caves, there were similarities in the bacterial
species compositions at the phylum level, as indicated by a combination of SEM and
molecular methods (DNA extraction, PCR, 16S rRNA sequencing and phylogenetic
analysis; Northup et al., 2011).
Gabriel and Northup (2013) reported that the low temperatures in some lava caves
could cause microorganisms to produce secondary metabolites related to cold resistance,
although they did not specifically examine the influence of temperature on the production
of secondary metabolites. Cheeptham et al. (2013) investigated antimicrobial activity in
actinomycetes isolated from a cold volcanic cave (7.5-12.2°C) in British Columbia,
Canada, and found that the cave bacteria had the ability to produce secondary metabolites
that possessed anti-microbial activity against pathogens. Their results also suggested that
the same species of cave bacteria can be found in caves with different conditions and in
different locations (Cheeptham et al., 2013).
Surface microbes have developed mechanisms to defend themselves against the
damaging effects of UV radiation (Walter, 1983; Yasui and McCready, 1998). Cave
bacteria, which exist mostly in the dark, have adapted to low-light conditions. Gabriel
and Northup (2013) hypothesized that there is correlation between such adaption and the
depth of the cave: bacteria in deeper caves are more adapted to low-light conditions
(Gabriel and Northup, 2013). In contrast, Snider et al. (2009) hypothesized that the lack
of light does not affect the adaptation of microbes living in caves (Snider et al., 2009). In
addition, Cheeptham and Rule (2013) studied the effects of UV light on the antimicrobial
activities of cave-dwelling actinomycetes, and found that UV light influenced the
antimicrobial activity of the cave actinomycetes, suggesting that UV light exposure could
potentially be used as a new screening strategy for antibiotic discovery (Cheeptham and
Rule, 2013).
26
1.3.6 Techniques Used to Analyze and Identify Cave Bacteria
Various techniques have been used to identify cave isolates. It is important to
determine if the isolates have been previously identified and to evaluate their production
of new or previously identified antibiotic compounds. In previous studies, various soil
isolates were phenotypically and genotypically characterized (Fakruddin and Mannan,
2013).
A number of studies have suggested that microbial diversity and species
composition differ significantly between limestone caves and lava tubes (Cheeptham,
2013). An enormous number of techniques have been used to analyze the
microorganisms which inhabit these two types of caves, including molecular methods and
cultivation-independent methods. Limited data exists regarding mineral-microorganism
interactions in caves, and community composition analyses have primarily been based on
culture techniques (Aman et al., 1995; Hugenholtz et al., 1998).
Groth et al. (1999) and Laiz et al. (2003) found that a wide diversity of
microorganisms inhabit Karstic caves using culture methods. However, these studies used
different media and aerobic Petri films for isolation, while the first group also applied
morphological, and physiological, techniques for identification.
Molecular methods are now considered standard analyses for identifying
organisms (Fakruddin and Mannan, 2013; Sacchi, 2002). For example, 16S rRNA gene
sequences have been widely used to determine bacterial phylogenies and identify
unknown isolates at the genus and species levels (Sacchi, 2002). Recently, Northup et al.
(2011) identified various phyla of bacteria (Chloroflexi, Nitrospirae, Verrucomicrobia,
etc.; see Table 1) in three diverse lava-tube caves using a combination of scanning
electron microscopy (SEM) and molecular techniques (DNA extraction, PCR, 16S rRNA
sequencing and phylogenetic analysis). Despite some problems and drawbacks such as
high cost and technical considerations, 16S rRNA gene sequencing has several
27
advantages for microbial identification, as it is accurate, objective and comprehensive,
and the 16S rDNA gene is present in all bacteria and does not contain extensive
mutations. Analysis of the nucleotide sequences of bacterial 16S rRNA genes allows the
determination of phylogenetic relationships that could not be obtained by phenotypic
methods (Clarridge, 2004; Song et al., 2005). However, none of these approaches are
100% accurate for the identification of bacteria (Clarridge, 2004).
In general, methods for studying bacterial metabolism vary. Bacterial metabolism
can be studied through different processes, including isolation, purification, optimization
of conditions, screening for antimicrobial activity, and identification of unknown
organisms (Ripa et al., 2009; Bhullar, 2011; Rule, 2013; Ababutain et al., 2013;
Lueschow et al., 2013). We studied cave bacteria using traditional methods and a
combination of other techniques including culture-based techniques for isolation, liquid
enrichment for optimization, and morphological, chemotaxonomic, molecular (16S rRNA
sequencing) and matrix-assisted laser desorption/ionization-time of flight (MALDI-TOF)
techniques for identification (see Chapter 2 for further details of these techniques) (Kay
et al., 2013; Cheeptham, 2013).
Recently, MALDI-TOF has used to identify unknown bacteria at the species level
by characterizing the components of cellular proteins (Sacchi, 2002). Peptide spectra
produced by MALDI-TOF were used to identify Arcanobacterium and Trueperella
isolates collected from pigs and cows (Hijazin et al., 2012). MALDI-TOF has several
clear advantages: it is fast, accurate and a large database of bacterial reference spectra is
available (Sacchi, 2002). However, MALDI-TOF has some disadvantages. One important
requirement for MALDI-TOF is that the bacterial cultures have to be pure. The resolving
power of MALDI-TOF is lower than 16s r RNA analysis, and the technique is based on a
chemical testing method which is not always 100% accurate for the identification of
bacterial species.
It is important to use a combination of complementary techniques to study
microbial communities in different environments (Fakruddin and Mannan, 2013). The
28
advantage of a combined strategy is that it increases our knowledge and ability to study
bacteria that are difficult to culture (Fakruddin and Mannan, 2013), and such an approach
may help to avoid rediscovering antibiotics and increase the chances of discovering novel
organisms and/or antibiotics. By using a combination of techniques, Gurtner et al. (2000)
reduced the instances of finding common organisms, in confirmation of the importance of
using a combination of methods to study bacterial communities (Cheeptham, 2013).
Using molecular techniques in combination with MALDI-TOF may help confirm
bacterial identities. It is very important to confirm bacterial taxonomies using different
techniques and strategies to determine if the target bacteria have been previously
identified.
1.3.7 Approaches for Screening Bacteria for the Production of Novel Antimicrobial Agents
With the widespread increase in antibiotic resistance, there is an urgent need for
rapid methods to determine antibiotic resistance and metabolite production in novel
microorganisms. Scientists and laboratories in the United States, Japan, Britain and
Russia have developed screening procedures to identify new compounds based on the
ability of microorganisms to produce secondary metabolites that can inhibit the growth of
microbes (Porter, 1997). Such screening methods are considered a traditional approach
for antibiotic discovery and are still in widespread use today (Guo et al., 2013).
Agar dilution and disc diffusion are a primary method of screening for selected
antimicrobial agents (Holasva et al., 2004). An inhibition zone around a disc on an agar
plate indicates a positive result (see Chapter 2 for further details of these techniques).
Valgaerts et al., (2007) reported the advantages of the disc-diffusion method, including
its simplicity, low cost, absence of the need for specialist equipment and high flexibility,
including the ability to test newly-available drugs. The effectiveness of the disc-diffusion
method for identifying antimicrobial activities was supported by the results of Holasva et
al. (2004), who used the disc-diffusion method as the primary method of screening the
29
antimicrobial activity of 16 cave isolates, and found that the method was an easy way of
observing the inhibition zone produced by cave bacteria against microorganisms and
against each other. The disc-diffusion method can also be used to qualitatively assess
drug susceptibility and resistance (Valgaerts et al., 2007). These characteristics make the
disc-diffusion method a good technique for preliminary screening of the antimicrobial
activity of environmental isolates (Reller et al., 2009). However, Valgaerts et al. (2007)
reported that the disc-diffusion method has several disadvantages, including long assay
times and high cost, although the method does produce clear inhibition zones.
1.3.8 Study of Culture Conditions for Cave Bacteria
Many studies have attempted to optimize antimicrobial production by
microorganisms (Bajpai and Reuss, 1981), and the effects of media components on
different traits such as cell growth, cellulose production, and the production of
metabolites and antimicrobial compounds by cave isolates have been studied (Judaibi,
2011; Dayal et al., 2013). Optimizing the media and fermentation conditions will increase
the production of antimicrobial compounds by bacteria. The production of antimicrobial
compounds can be influenced by the nature and concentration of the carbon, nitrogen and
phosphorus sources (Yegneswaran et al., 1988). In general, the nutrient sources, which
include carbon, nitrogen, ammonia, phosphate can inhibit or enhance antibiotic
production by microorganism in culture media (Omura et al., 1986).
In general, optimizing the culture media is a challenging process by which
researchers try to create an ideal environment for microbial communities. In particular,
bacteria isolated from cave habitats are adapted to environments that contain limited
nutrients and organic compounds, and therefore optimization can be challenging.
Development of an optimized medium is important for growing cave-adapted
microorganisms, which generally grow very slowly (Pankratov et al., 2008).
30
1.3.8.1 Carbon sources
Gram-negative and Gram-positive bacteria need carbon for energy and structural
components (Sánchez et al., 2010); however, the carbon source used in bacterial
fermentation is very important for the production of antimicrobial compounds. Different
carbon sources such as glucose have different effects on the production of antimicrobial
compounds by bacteria (Sánchez et al., 2010). For example, using glucose as a carbon
source had a positive effect on phenazine production by Pseudomonas chloraphis,
whereas fructose, sucrose and ribose had a negative effect (Rij et al., 2004), and E. coli
exhibited strong antimicrobial activity when grown on medium containing fructose and
yeast extract (Vijavakumar et al., 2012).
Gram-positive bacteria have the ability to produce drugs through ribosomal and
non-ribosomal mechanisms (Sánchez et al., 2010). Gram-positive cell walls have
multiple layers of peptidoglycan, protein and teichoic acid. Nevertheless, Gram-positive
bacteria respond differently to growth on glucose (Sánchez et al., 2010). In particular, the
antimicrobial activity of Bacillus sp. significantly decreased in the absence of a carbon
source in the fermentation media (Vijavakumaret al., 2012). In another example,
anthracycline production by Streptomyces peucetius was inhibited by high concentrations
of glucose (Escalante et al., 1999).
1.3.8.2 Nitrogen sources
The nitrogen source is also an important factor in antimicrobial production.
Vijavakumar et al. (2012) studied the effects of nitrogen sources on antibacterial
production by Bacillus sp., and concluded that growth and the production of antibacterial
compounds were maximized when nitrogen sources such as yeast extract, calcium nitrate,
ammonium sulfate and potassium nitrate were included in the fermentation media
separately. Ripa et al. (2009) concluded that yeast extract was the optimal nitrogen source
for the production of bioactive metabolites in Streptomyces sp. RUPA-08PR, which was
isolated from soil in Bangladesh.
31
1.3.8.3 Temperature, pH and incubation period
There have been many studies of the effects of temperature and pH on the
production of antimicrobial compounds. In particular, Laiz et al. (2003) studied
microorganisms isolated from different caves with varying temperatures in Spain (5, 13,
20, 28, and 40°C), and reported that most bacteria could grown in the range 13-40°C;
however, lower temperatures (13°C) were optimal for the growth of a higher diversity of
species. Khizhnyak et al. (2011) isolated bacteria from water in a cave where the air
temperature varied between 0 and 5°C, and found that the bacteria could grow at a low
temperature (7°C), but the bacteria altered their morphology and consequently died at the
higher temperature (35°C), indicating that the cave bacteria were adapted to the cold,
which is also referred to as psychrophilic.
Ripa et al. (2009) incubated a strain of actinomycetes isolated from the soil in
northern Bangladesh at different temperatures (25-49°C), and found that the optimum
temperature and pH for a new Streptomyces species, RUPA-08PR, were 39°C and 8,
respectively, indicating that the new organism was mesophilic. In addition, the bacteria
began producing bioactive metabolites after 7 days of incubation in fermentation broth,
and optimal production was observed after 10 days and slowly decreased thereafter. Usha
et al. (2011) found an initial pH of 7 and 30°C to be the optimal conditions for bioactive
metabolite production by the rare actinomycete strain Pseudonocardia VUK-10.
Rule and Cheeptham (2013) reported that 100 actinomycete strains, which were
collected from a volcanic cave, showed the greatest metabolite production when their
fermentation broth was incubated at 25°C for 10 days. Kay et al. (2013) incubated
actinomycetes collected from a volcanic cave for 10 days, and found that strain E9 in the
genus Streptomyces produced a high yield of secondary metabolites at pH 7 on day 4 of
incubation at 28°C.
32
Cladera et al., (2004) studied bacteriocin production by Bacillus licheniformis P40
when cultured under aerobic conditions. During 50 h of cultivation, the organism showed
the highest level of bacteriocin production after 15 h. Pattnaik et al. (2001) studied
bacteriocin production by B. licheniformis 26 L-10/3RA cultured under anaerobic and
aerobic conditions, and observed aerobic growth within 18 h and gradually increasing
antimicrobial production after 1 day. However, it is not necessary that bacteria achieve
optimal growth in order to maximize the production of antibacterial compounds (Leal et
al., 2002) as, for example B. licheniformis 26 L-10/3RA lost its antimicrobial activity
when exposed to an aerobic environment.
1.3.8.4 Salts and minerals
The salt concentration also affects cell growth and the production of bioactive
metabolites. Ripa et al. (2009) studied the optimum culture conditions for a new species
of Streptomyces, RUPA-08PR, and showed that 1% NaCl maximized the production of
bioactive metabolites, but the growth of the strain decreased when the NaCl
concentration was greater than 1%. Vijayakumar et al. (2012) reported that the marine
Streptomyces sp. VPTS3-1 produced maximum levels of secondary metabolites at a NaCl
concentration of 4%, which is a suitable concentration for the growth of the organism.
However, higher NaCl concentrations did not improve secondary metabolite production.
Ripa et al. (2009) reported that K2HPO4 enhanced the production of bioactive metabolites
by the actinomycete Pseudonocardia VUK-10 and the Streptomyces species RUPA-
08PR; however, 5% K2HPO4 was optimal.
In conclusion, optimization of the sources and concentration of carbon, nitrogen,
salts and minerals, as well as the temperature, pH and incubation period are very
important during the discovery and isolation of novel antibiotics (Himabindu and Jetty,
2006).
33
2.0 Materials and Methods
2.1 Isolation of microorganism from cave
2.1.1 Collecting samples
A total of 15 samples were previously collected from different sites of a volcanic
cave at Wells Gray Provincial Park in British Columbia (BC), Canada (Figure 3). The
samples collected included rocks, sterile swabs of percolating material, sediment, cave
popcorn. Aseptic techniques were used to collect the samples and the samples were
placed in sterile falcon tubes and zip-lock bags. All samples were kept cold in a
refrigerator at 5oC until the isolation process was complete. (This work was done by Paul
Moote and Devon Rule)
2.1.2 Isolation of cave microorganisms
One gram of each of the cave samples was diluted in sterile saline solution and
plated onto different selective media using the glass spreading technique (Moote, 2010).
These media consist of Actinomycetes Agar, Bennett’s Agar, Hickey Tresner (HT),
Starch Casein Nitrate Agar, and Modified Soil Agar (Appendix A-1). After incubating all
of the sample plates at 25oC for four weeks, microorganism colonies appeared. The
colonies were sub-cultured and then purified on R2A media using the streak plate method
(Katz 2010).
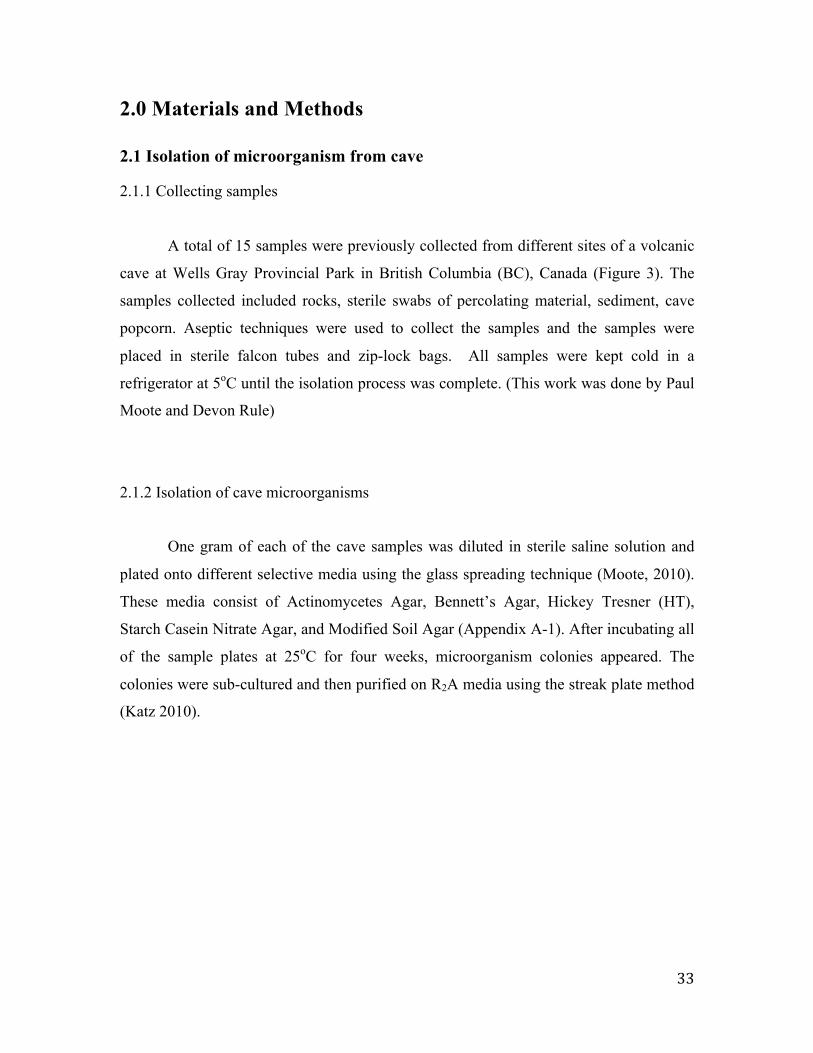
34
Figure 3: Cave contour map of the Helmcken Falls Cave in Wells Gray Provincial Park in British Columbia, Canada. Seventeen cave samples were collected from different sites in the cave. 1, 2 and 10 were collected near the cave’s entrance; 3, 4 and 9 were collected from its south wall; 5 and 6 were collected from its east corner; 7 was collected from its centre; 8 was collected from its northwestern side; 12 and 17 were from close to its northern wall; and 13, 14 and 15 were collected from its east wall (Moote 2009 and Rule 2010).
2.2 Optimizing the fermentation conditions of the cave strains
2.2.1 Primary optimization of the cave strains
The fermentation conditions of the cave strains were optimized to maximize their
metabolite production. To do this, 16 cave isolates (from initial studies of Dr.
Cheeptham’s former students, Paul Moote and Devon Rule) were inoculated into small
test tubes (150 x 25 mm) containing 15 ml each of four different broths: Hickey-Tresner,
ISP2 (International Streptomycetes Project), V-8 juice, and R2A (Appendix B). Also,
extra tubes (150 x 25 mm) containing these broths were diluted tenfold. The aim of
performing the dilutions was to create media similar to that of the parental environment,
which contains a very low nutrient level, so as to increase results. All inoculated broths
were incubated at 25oC with 250 rpm reciprocal shaking for 14 days. The isolates were
then tested for antimicrobial production using the bioassay method described below.
35
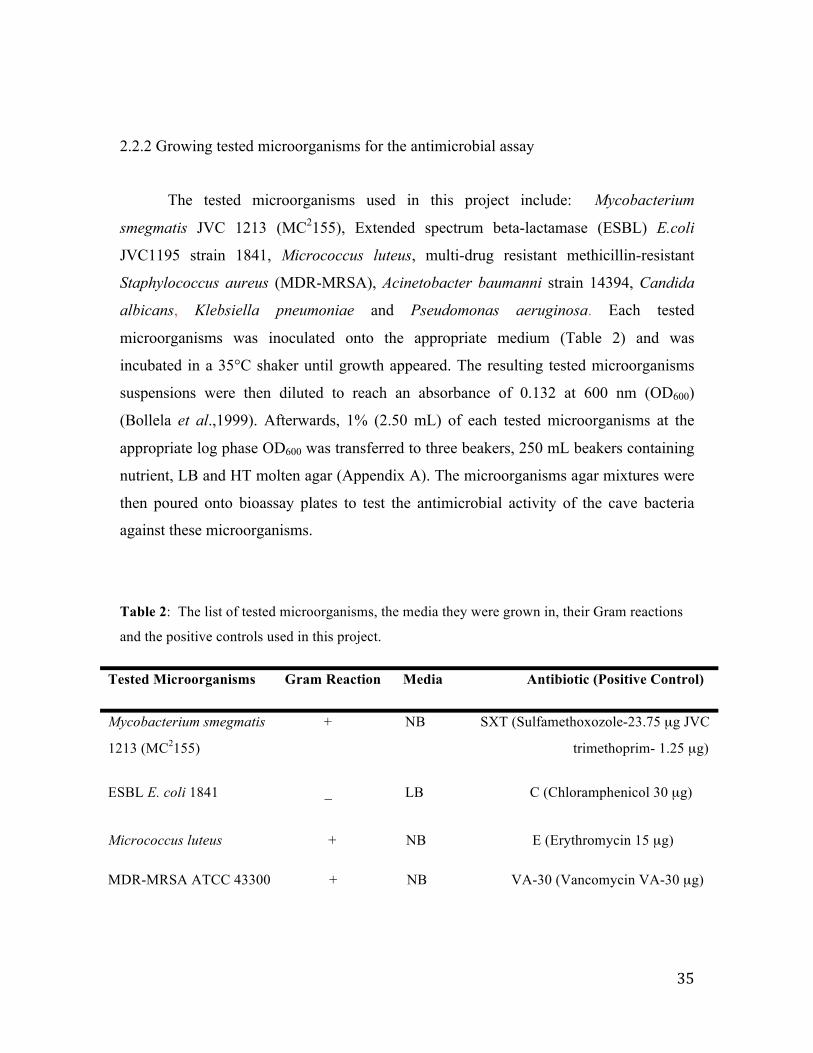
2.2.2 Growing tested microorganisms for the antimicrobial assay
The tested microorganisms used in this project include: Mycobacterium
smegmatis JVC 1213 (MC2155), Extended spectrum beta-lactamase (ESBL) E.coli
JVC1195 strain 1841, Micrococcus luteus, multi-drug resistant methicillin-resistant
Staphylococcus aureus (MDR-MRSA), Acinetobacter baumanni strain 14394, Candida
albicans, Klebsiella pneumoniae and Pseudomonas aeruginosa. Each tested
microorganisms was inoculated onto the appropriate medium (Table 2) and was
incubated in a 35°C shaker until growth appeared. The resulting tested microorganisms
suspensions were then diluted to reach an absorbance of 0.132 at 600 nm (OD600)
(Bollela et al.,1999). Afterwards, 1% (2.50 mL) of each tested microorganisms at the
appropriate log phase OD600 was transferred to three beakers, 250 mL beakers containing
nutrient, LB and HT molten agar (Appendix A). The microorganisms agar mixtures were
then poured onto bioassay plates to test the antimicrobial activity of the cave bacteria
against these microorganisms.
Table 2: The list of tested microorganisms, the media they were grown in, their Gram reactions
and the positive controls used in this project.
Tested Microorganisms Gram Reaction Media Antibiotic (Positive Control)
Mycobacterium smegmatis + NB SXT (Sulfamethoxozole-23.75 µg JVC
1213 (MC2155) trimethoprim- 1.25 µg)
ESBL E. coli 1841 _ LB C (Chloramphenicol 30 µg)
Micrococcus luteus + NB E (Erythromycin 15 µg)
MDR-MRSA ATCC 43300 + NB VA-30 (Vancomycin VA-30 µg)
36
Acinetobacter baumannii _ LB C (Chloramphenicol 30 µg)
ATCC19606 (JVC 119)
Candida albicans Mold H.T N/A – antifungal (Nystatin- 20 µg)
Klebsiella pneumoniae _ LB E (Erythromycin 15 µg)
ATCC BAA 1705
Pseudomonas aeruginosa _ MH E (Erythromycin 15 µg)
Hickey Tresner (HT), Nutrient Broth (NB), Mueller Hinton (MH), Luria Bertani (LB)
2.2.3 Primary screening of the cave bacteria isolates for antimicrobial production
To determine whether any of the cave isolates produced antimicrobial compounds
in pure culture, we searched for the presence of any diffusible materials that inhibited the
growth of the tested microorganisms in the bioassay plates. The procedure for testing 16
microbial isolates for antimicrobial activity is the disc diffusion method (Pieboji 2009).
This method uses sterile, 8 mm discs that are impregnated with bacterial fermentation
broth and are placed on a glass plate in a fume hood to air dry (Figure 2). The positive
control used for each bacterium is listed in Table 2, and the negative controls were discs
soaked in the sterile broth medium appropriate for each bacterium.
37
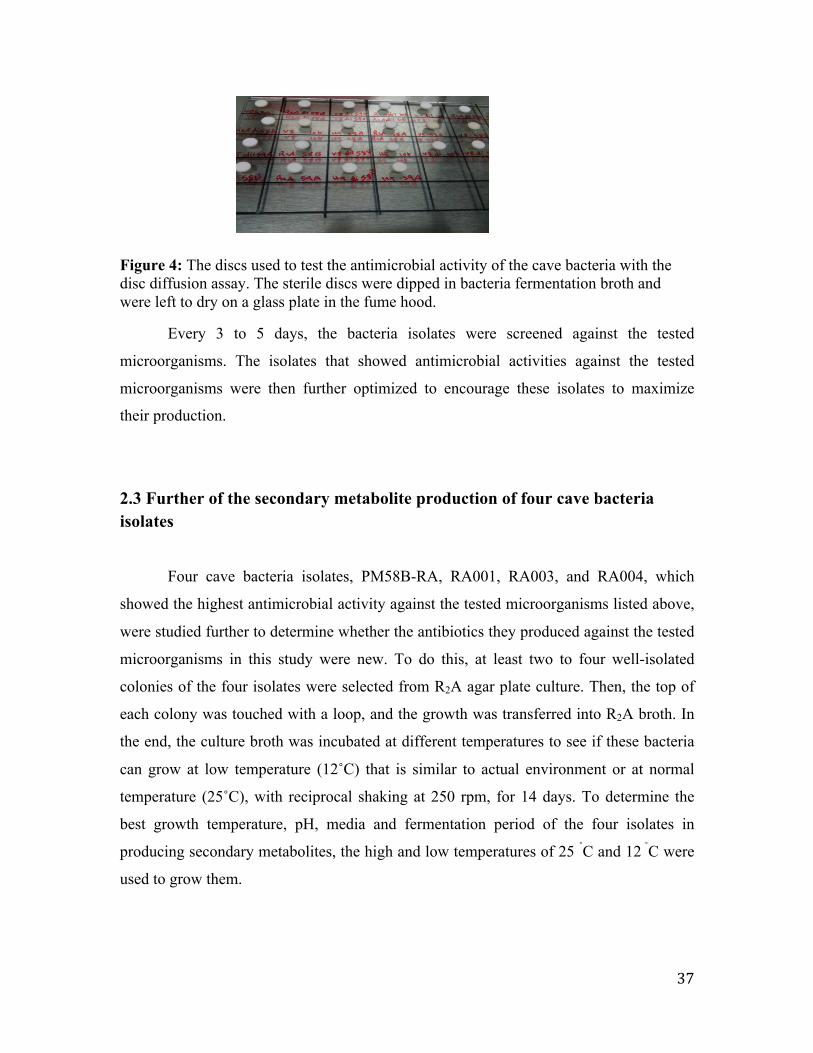
Figure 4: The discs used to test the antimicrobial activity of the cave bacteria with the disc diffusion assay. The sterile discs were dipped in bacteria fermentation broth and were left to dry on a glass plate in the fume hood.
Every 3 to 5 days, the bacteria isolates were screened against the tested
microorganisms. The isolates that showed antimicrobial activities against the tested
microorganisms were then further optimized to encourage these isolates to maximize
their production.
2.3 Further of the secondary metabolite production of four cave bacteria isolates
Four cave bacteria isolates, PM58B-RA, RA001, RA003, and RA004, which
showed the highest antimicrobial activity against the tested microorganisms listed above,
were studied further to determine whether the antibiotics they produced against the tested
microorganisms in this study were new. To do this, at least two to four well-isolated
colonies of the four isolates were selected from R2A agar plate culture. Then, the top of
each colony was touched with a loop, and the growth was transferred into R2A broth. In
the end, the culture broth was incubated at different temperatures to see if these bacteria
can grow at low temperature (12˚C) that is similar to actual environment or at normal
temperature (25˚C), with reciprocal shaking at 250 rpm, for 14 days. To determine the
best growth temperature, pH, media and fermentation period of the four isolates in
producing secondary metabolites, the high and low temperatures of 25 ˚C and 12 ˚C were
used to grow them.
38
2.3.1 Study of the fermentation periods of the cave bacteria
The fermentation periods of the cave bacteria strains were optimized using a
method described by Nanjwade and Shamarez (2010). The purpose of this procedure was
to find the harvesting time at which the bacteria produced the highest yield of the
antimicrobial agent (Fermentation time course). To do this, the primary seed cultures of
the four isolates were incubated at 25˚C until growth occurred. Then, the seed cultures
were used to inoculate 166 ml into 500 ml flasks and 333 ml into 1000 ml Erlenmeyer
flasks containing R2A broth (Tabaraie et al., 2012). After that, the sterilized R2A broth
was inoculated with 1% (1.66 ml) and 2% (6.66 ml) of the PM58B, RA001, RA003, and
RA004 isolates, separately. Different inoculum volume (1% and 2%) was used to decide
the most suitable volume for producing antimicrobial compound(s). Then, the flasks were
incubated at 12˚C and 25˚C for 14 days. The production was determined daily by testing
the packed cell volume (%PCV), the pH value, and the antimicrobial activities of the
inoculated broths.
Note that the antimicrobial production by cave microorganisms is normally an
aerobic procedure. In addition, the broth cultures were centrifuged at 3000 rpm for 5
minutes and then the supernatant was filtered by syringe (Kumari et al., 2013). The
resulting filtrates were used for further antimicrobial activity.
2.3.2 Testing the percentage of packed cell volume (%PCV) and the pH value of the inoculated broths
The expected growth times of the bacteria strains were determined daily during
the fermentation process by using a %PVC cell counting kit. Three milliliters of broth of
each of the four isolates was transferred into 15 ml centrifuge tubes, which were
centrifuged at 250 rpm for 1 minute to measure the cell pellet volume after
centrifugation. After that, the antimicrobial activities of the isolates were tested against
those of the tested microorganisms mentioned below. In addition, the pH value of the
fermentation broth of each isolate was recorded daily.
39
Another method, employed by Stettler et al., 2006 and Jordan, 2005, was used to
determine the PCV measurements when the first method gave negative results first of all,
1 ml of each isolate broth was transferred into a PCV tube (13 mm x 43 mm) (Techno
Plastics Products AG, Trasadingen, Switzerland) whose maximum capillary volume is 5
µl. Then, the tubes were centrifuged using a microcentrifuge for 1 minute at 5000 rpm.
After centrifugation, the isolate cells were pelleted within the capillary. The height of the
cell pellet defines the volume of the cells in the capillary. This volume can be converted
into the PCV (%) using the formula described by Jordan (2005): PCV (%) = (volume of
cell pellet/volume of sample) x 100 (1000 µl was the sample volume for each tube).
2.4 The antimicrobial activity detection assay
2.4.1 The cross-streak assay
In this study, the agar diffusion method (or the cross-streak assay) was used to
determine how cave isolates communicate through their metabolites. This method was
used by Northup et al. (2013) when they tested the antimicrobial activity of cave isolates
against that of such tested microorganisms as Staphylococcus aureus (ATCC 6538),
Kelbsiella pneumoniae (ATCC 13883), Shigella flexneri (ATCC 9199) and Streptococcus
pneumoniae (ATCC 6303). In this study, they inoculated the cave isolates onto a nitrate
broth and incubated them at 15-20˚C for 48 hours until visible growth appeared. After
that, the cave cultures were inoculated using the cross-streak assay as described below.
In our study, to carry out the agar diffusion assay, the cave isolates RA001,
RA003, RA004 and PM58B were inoculated onto a R2A broth and were incubated at
25˚C until growth was observed. Then, the cave isolates were streaked in one vertical line
onto HT agar and R2A agar plates and incubated at 25˚C for 48 hours in order to obtain a
thin line of growth. Subsequently, another layer of R2A and HT medium was added over
the first layer of the medium on the original R2A and HT plates, and the plates were
solidified. After that, each cave isolate was horizontally inoculated onto its vertical streak

40
and the plates were incubated at 25˚C for 48 hours. Then, any zones of inhibition were
evaluated.
2.4.2 Paper disc diffusion method
The first use of the paper disc diffusion method was in the 1940s (Vincent 1944).
This method can be easily used in the laboratory to detect the antimicrobial activity of
bacteria culture and its low cost. In addition, it is suitable for use if there is no
requirement to determine the concentration or type of the present antibiotic (Driscoll
2012). For these reasons, this method was used instead of the cross-streaking assay
method that was previously described to detect the communication of the four isolates
through their metabolites. Sterile, 8 mm discs were impregnated with 80 µl of broth from
the four bacterial isolates that exhibited the most antimicrobial activity against the tested
microorganisms. The discs were placed on a glass plate in a fume hood to air dry. Then,
1% (2.50 mL) of the isolates was transferred into 250 ml flasks containing the R2A agar.
The isolate-agar mixture was poured onto bioassay plates to test the four isolates’
antimicrobial activities against one another. When the plates were solidified, the paper
discs of the strains that were not combined with the R2A Agar were placed onto the
bioassay plates. For example, if the R2A agar was inoculated with the RA003 isolate, the
papers discs were soaked with RA001, RA004, PM58B-RA and Streptomyces griseus,
which was used as a positive control. After that, the plates were incubated at 25˚C and
were checked daily for one week for results.
2.5 Identification of antimicrobial production by the cave isolates
Cave isolate identification is essential to determine if these isolates are novel
species, have new type of antimicrobial compounds and new microbial interaction.
Different traditional methods were used to identify the four isolates, including phenotypic
identification using Gram staining, culturing and the biochemical method. However,
41
these methods were insufficient to yield accurate results. Thus, a 16S rRNA sequencing
method and software for the four isolates identifications was used to attain the definitive
isolates identification.
2.5.1 Morphological observations
Both the microscopic and macroscopic characteristics of isolates RA001, RA003,
RA004, and PM58B-RA were observed and used to identify the isolates. Macroscopic
morphologies such as the shapes and colours of the colonies and the diffusible
pigmentation of the isolates were recorded. In addition to the observation of
morphological traits, chemotaxonomy was also used to enhance the identification of the
strains.
2.5.2 Chemotaxonomy
In addition to the observation of morphological traits, chemotaxonomy was also
used to enhance the identification of the cave bacteria strains used in this project. This
method is simple in principle, and separates the amino acids in the cell walls of the four
isolates; it was employed to investigate whether these substances, which belong to the
four isolates, are similar to those of Streptomyces griseus, which was used as a positive
control (see 3.0 Results Figures 17, 18, 19 and 20).
2.5.2.1 Thin Layer chromatography of whole cell hydrolysates
To better identify the bacteria isolates used in this project, the hydrolysates in the
cell walls of the four antimicrobial-producing actinobacterial strains were analyzed for
amino acid content using thin layer chromatography and cell wall hydrolysis (Staneck,
1974).
42
First, the four isolates were grown on R2A media at 25˚C with reciprocal shaking
at 250 rpm. Then, the cells were collected at the maximal growth stage by centrifuging
them at 2000 rpm for 10 minutes, washing them with 10 mL of saline water, and
centrifuging them again at 2000 rpm. One ml of distilled water was then added to the
collected cells and the cells were hydrolyzed and sonicated. Hydrolysis occurred when 1
ml of 6M of HCl was added to 5 mL of the cells’ pellets and then placed in a 161x300
glass 15 mL test tube, which was placed in an autoclave at 121˚C for 15 minutes. After
cooling, the tube was opened and its contents were centrifuged. Then, the liquid
hydrolysate was evaporated in a 50˚C water bath to remove most of the HCl.
Subsequently, ascending chromatography was performed on the pellets of the
cells for approximately 18 to 22 hours using the solvent system of methanol: distilled
water: 6M HCL: pyridine (80:26:4:10, v/v). Then, the chromatogram was air-dried and
its amino acid spots were visualized by spraying the chromatogram with 0.2% ninhydrin
in acetone, leaving it to dry for 3 hours, and then placing it in the chromatography oven at
100˚C for three minutes to visualize the spots. The cells were also sonicated, after
washing them with 10 mL of saline water for about one minute to remove cell
components, and were subsequently centrifuged at about 10,000 rpm for 10 to 20
minutes. Streptomyces griseus was used as a positive control in the TLC. Its cells, except
the amino acid standard, were also hydrolyzed and sonicated. The migration of the
standard DAP spot and the other amino acids was observed in the TLC after three
minutes of heating the TLC.
2.5.3 Molecular identification of the antimicrobial-producing cave strains using 16S rRNA gene sequencing
To prepare the four antimicrobial-producing strains, RA001, RA003, RA004 and
PM58B-RA, for 16S rRNA sequencing, the strains were cultured in R2A agar medium for
three days at 25 ˚C. When the cave bacteria appeared on the plates, the plates were sent to
Seoul, Korea for 16S rRNA gene sequencing. There, polymerase chain reaction (PCR)
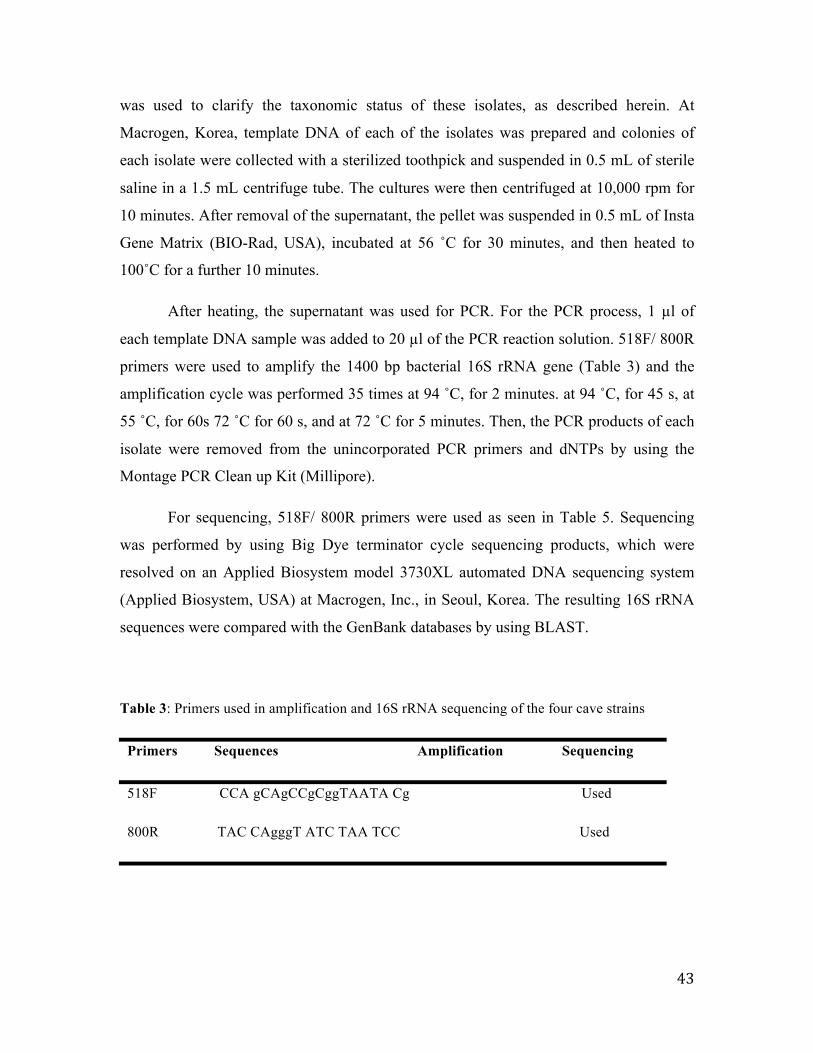
43
was used to clarify the taxonomic status of these isolates, as described herein. At
Macrogen, Korea, template DNA of each of the isolates was prepared and colonies of
each isolate were collected with a sterilized toothpick and suspended in 0.5 mL of sterile
saline in a 1.5 mL centrifuge tube. The cultures were then centrifuged at 10,000 rpm for
10 minutes. After removal of the supernatant, the pellet was suspended in 0.5 mL of Insta
Gene Matrix (BIO-Rad, USA), incubated at 56 ˚C for 30 minutes, and then heated to
100˚C for a further 10 minutes.
After heating, the supernatant was used for PCR. For the PCR process, 1 µl of
each template DNA sample was added to 20 µl of the PCR reaction solution. 518F/ 800R
primers were used to amplify the 1400 bp bacterial 16S rRNA gene (Table 3) and the
amplification cycle was performed 35 times at 94 ˚C, for 2 minutes. at 94 ˚C, for 45 s, at
55 ˚C, for 60s 72 ˚C for 60 s, and at 72 ˚C for 5 minutes. Then, the PCR products of each
isolate were removed from the unincorporated PCR primers and dNTPs by using the
Montage PCR Clean up Kit (Millipore).
For sequencing, 518F/ 800R primers were used as seen in Table 5. Sequencing
was performed by using Big Dye terminator cycle sequencing products, which were
resolved on an Applied Biosystem model 3730XL automated DNA sequencing system
(Applied Biosystem, USA) at Macrogen, Inc., in Seoul, Korea. The resulting 16S rRNA
sequences were compared with the GenBank databases by using BLAST.
Table 3: Primers used in amplification and 16S rRNA sequencing of the four cave strains
Primers Sequences Amplification Sequencing
518F CCA gCAgCCgCggTAATA Cg Used
800R TAC CAgggT ATC TAA TCC Used
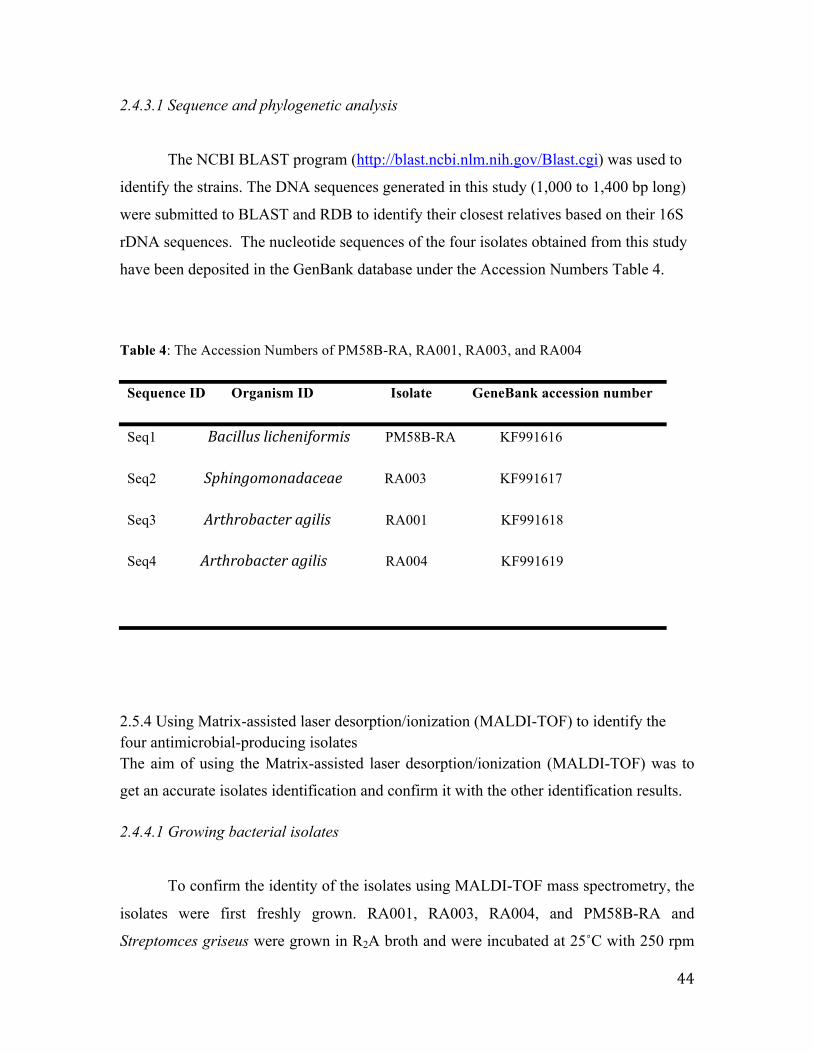
44
2.4.3.1 Sequence and phylogenetic analysis
The NCBI BLAST program (http://blast.ncbi.nlm.nih.gov/Blast.cgi) was used to
identify the strains. The DNA sequences generated in this study (1,000 to 1,400 bp long)
were submitted to BLAST and RDB to identify their closest relatives based on their 16S
rDNA sequences. The nucleotide sequences of the four isolates obtained from this study
have been deposited in the GenBank database under the Accession Numbers Table 4.
Table 4: The Accession Numbers of PM58B-RA, RA001, RA003, and RA004
Sequence ID Organism ID Isolate GeneBank accession number
Seq1 Bacillus licheniformis PM58B-RA KF991616
Seq2 Sphingomonadaceae RA003 KF991617
Seq3 Arthrobacter agilis RA001 KF991618
Seq4 Arthrobacter agilis RA004 KF991619
2.5.4 Using Matrix-assisted laser desorption/ionization (MALDI-TOF) to identify the four antimicrobial-producing isolates The aim of using the Matrix-assisted laser desorption/ionization (MALDI-TOF) was to
get an accurate isolates identification and confirm it with the other identification results.
2.4.4.1 Growing bacterial isolates
To confirm the identity of the isolates using MALDI-TOF mass spectrometry, the
isolates were first freshly grown. RA001, RA003, RA004, and PM58B-RA and
Streptomces griseus were grown in R2A broth and were incubated at 25˚C with 250 rpm
45
shaking until growth appeared, as described previously. The isolates were also cultured
on R2A agar plates at 25˚C for 4 days. Streptomces griseus was used as a positive control
in both cases. The purpose of using different growth conditions is to find out which
growth conditions show accurate results.
2.5.4.2 Sample preparation for formic acid extraction
Sample preparation of two different growth conditions of the four strains for
formic acid extraction was performed for direct identification of bacteria as described
previously by Bruker and Daltonik (2013). First, strains colonies present in the R2A broth
were collected by centrifugation. To do this, 1 mL of each bacteria isolate was
transferred into separate Eppendorf tubes using a sterile pipette tip. Then, the tubes were
centrifuged for 3 minutes at 13,000 rpm. Next, the supernatant was removed, and 300 µL
of deionized water and 900µL of EtOH were added to the remaining liquid. After
centrifugation at 14,000 rpm for 2 minutes, the supernatant was decanted and centrifuged
again. Then, the residual EtOH was removed by carefully pipetting it off without
disturbing the pellet. Following this, the pellet was allowed to dry at room temperature
for three minutes. Twenty-five µL of 70% formic acid was added to the pellet and was
mixed well by vortexing. After that, 25 µL of ACN was added, and the tube was mixed
carefully and centrifuged for 2 minutes at 14,000 rpm. Then, 1 µL of the supernatant was
transferred onto a MALDI target plate (Bruker Daltonics, Breman Germany), the plate
was air-dried and was overlaid with 1 µL of matrix solution. After air-drying, the target
plate was placed in the MALDI-TOF mass spectrometer for analysis.
The samples of the four isolate colonies grown on solid R2A media were then
prepared, one single colony (5-10 mg) of each bacteria isolate was transferred into
separate Eppendorf tubes using a sterile pipette tip. Then, 300 microliters (µL) of
deionized water was added into each tube and then was mixed well by vortexing. After
that the tubes were centrifuged for 3 minutes at 13,000 rpm. Next, 900 µL €uof EtOH
were added to the remaining liquid. After centrifugation at 14,000 rpm for 2 minutes the
supernatant was decanted and centrifuged again. Then, the residual EtOH was removed
by carefully pipetting it off without disturbing the pellet.
46
Following this, the pellet was allowed to dry at room temperature for three
minutes. Twenty-five µL of 70% formic acid was added to the pellet and was mixed well
by vortexing. After that, 25 µL of ACN was added, and the tube was mixed carefully and
centrifuged for 2 minutes at 14,000 rpm. Then, 1 µL of the supernatant was transferred
onto a MALDI target plate (Bruker Daltonics, Breman Germany), the plate was air-dried
and was overlaid with 1 µL of matrix solution. After air- drying, the target plate was
placed inside the MALDI-TOF mass spectrometer for analysis
2.5.4.3 MALDI spotting protocol The protocols described below for the preparation of bacterial samples prior to
MALDI analysis were provided by Bruker Daltonics (Bremen, Germany).
2.5.4.4 Direct transfer method
The matrix, alpha-cyano-4-hydroxycinnamic acid (HCCA), was prepared by
dissolving 2.5 mg in 250 µL standard solvent that was composed of 50% acetonitrile
(ACN), 47.5% H2O, and 2.5% trifluoroacetic acid (TFA). The dissolved matrix was
vortexed at room temperature for 1 minute and sonicated for 5 minutes to ensure
complete dissolution. A single colony (5–10 mg) of bacteria was directly spotted as a thin
film onto a stainless steel MALDI target plate (Bruker Daltonics). The smeared bacterial
sample was then overlaid with 1 µL of 70% (v/v) formic acid and allowed to dry at room
temperature before pipetting 1 µL of HCCA solution on top of it. The sample was dried
at room temperature and analyzed immediately on the MALDI instrument.
Formic acid extraction method
A single colony (5-10 mg) was placed into an Eppendorf tube containing 300 µL
of deionized water. The sample was vortexed for 2 minutes before adding 900 µL of
ethanol. The sample was mixed again and centrifuged at 13,000 rpm for 2 minutes. The
resulting pellet was recovered by decanting most of the ethanol, and then dried at room
temperature for 3 minutes. Depending on the size of the pellet, 50-80 µL of 70% formic
acid was added to dissolve the pellet. The same volume of acetonitrile was added and the
47
sample was centrifuged at maximum speed until all insoluble material was collected in a
single pellet on the bottom of the vial. The resulting supernatant (1 µL) was spotted on
the target plate and allowed to dry at room temperature before spotting 1 µL of the
HCCA solution.
2.5.4.5 Data acquisition and analysis
Mass spectra were obtained using a bench-top Microflex MALDI-TOF MS from
Bruker Daltonics® (Bremen, Germany) equipped with a pulsed nitrogen laser at 355 nm
wavelength. Spectra were recorded from 2 kDa to 20 kDa (positive mode) using
FlexControl 3.3 software (ion source 1: 20 kV; ion source 2: 18.25 kV; lens voltage: 7
kV; laser frequency: 60 Hz; pulsed ion extraction (PIE) delay: 10 ns). A mass gate of 500
Da was set for all experiments. A bacteria test standard was used to calibrate the
instrument. Individual mass spectrum from each spot was acquired by averaging 240
laser shots. The data acquisition was set to automate and the “random walk” movement
was activated at 10 shots per raster during the sequence. Peak lists, intensities, and peak
areas were calculated using the peak-picking centroid algorithm in FlexAnalysis 3.3
software. Mass spectra were exported to Biotyper 3.1 for evaluation by comparing the
bacterial protein fingerprints to an existing database. The same Bruker bacterial test
standard which is composed of Escherichia coli DH5 alpha peptide was used as a
reference to maintain the validity of the results.
2.6 Extraction and Purification of the Secondary Metabolite
The aim of this study is to partially identify the secondary metabolites present in
the isolates that showed activity against tested microorganisms. In collaboration, Dr. Arjun
Banskota of NRC in Halifax has greatly contributed to this section.
48
The isolates, RA001, RA003, RA004, and PM58B-RA were grown in 2 L of R2A
broth, separately, at both temperature 12 ˚C and 25 ˚C as previously mentioned. Next, the
time course of fermentation in each isolate was determined and the day that showed the
highest result of the antimicrobial activity of the isolates was chosen for harvesting time.
For instance, on day 10th for RA001, on day 5th for RA003 and PM58B-RA, and on day
9th for RA004, and then these culture broths were centrifuged at 4000 rpm for 10 minutes.
After discarding the supernatant, the pellets in each of the centrifuge tube were
resuspended in the rest of the isolates culture (20 mL). All pellets were sent to National
Research Council at Halifax, NS for further purification of secondary metabolites.
2.6.1 Extraction and Purification of Secondary Metabolites
RA004: The culture broth (2.0 L) was evaporated under reduced pressure to 250
mL and extracted with EtOAC (250 mL x 2). The combined EtOAc fraction further dried
under reduced pressure yielding 31.0 mg EtOAc extract. The EtOAc extract was
dissolved in MeOH filtered through a 13 mm nylon membrane filter with 0.20 µm pore
size (VWR, USA) and subjected for HPLC purification. Semi-preparative HPLC was
performed on an Agilent 1200 series HPLC using an Nova Pack C18 column (5µm, 7.8 ×
300 mm) with a H2O/Acetonitrile linear gradient (1:9 to 0:1 between 0 to 20 minutes).
Nine fractions were collected (Fraction 1 to Fraction 9) eluted at 2.0, 2.3, 3.0, 3.8, 4.9,
5.8, 7.4, 7.8 and 9.7 minutes, respectively. The flow chart 1 is shown in Appendix B. The
proton NMR spectra of all the above fractions were recorded on Bruker 700 MHz
spectrometer, indicating none of the fraction has pure secondary metabolites. Thus,
LC/MS and NMR used for purification of all isolates RA001, RA003, RA004, and
PM58B-RA instead of HPLC purification.
PM58B: The mycelia received from TRU were lyophilized yielding 460 mg dry
mycelia, which were extracted with MeOH (25.0 mL x 2). The combined MeOH extract
were dried under reduced pressure yielding MeOH extract (50.0 mg). The MeOH extract
was further fractionated by solid phase extraction using Discovery DIC-18 cartridge
eluting with H2O/MeOH/EtOAc gradient into four fractions [fraction 1 (27.9 mg, H2O 10
mL), fraction 2 (13.0 mg, H2O/MeOH, 1:1, 10 mL), fraction 3 (2.3 mg, MeOH, 10 mL)
and fraction 4 (2.0 mg, EtOAC, 10 mL)]. Further LC/MS and NMR study revealed that
49
these fractions contain multiple components and subjected for further anti-bacterial
activity test. The flow chart 2 is shown in Appendix B.
RA003: The mycelia received from TRU were lyophilized yielding 470 mg dry
mycelia, which were extracted with MeOH (25.0 mL x 2). The combined MeOH extract
were dried under reduced pressure yielding MeOH extract (20.0 mg). The MeOH extract
was further fractionated by solid phase extraction using Discovery DIC-18 cartridge
eluting with H2O/MeOH/EtOAc gradient into three fractions [fraction 1 (10.4 mg, H2O
10 mL), fraction 2 (5.3 mg, H2O/MeOH, 1:1, 10 mL), fraction 3 and (3.9 mg, MeOH, 10
mL). Further LC/MS and NMR study revealed that these fractions contain multiple
components and subjected for further anti-bacterial activity test. The flow chart 3 is
shown in Appendix B.
RA004: The mycelia received from TRU were lyophilized yielding 450 mg dry
mycelia, which were extracted with MeOH (25.0 mL x 2). The combined MeOH extract
were dried under reduced pressure yielding MeOH extract (90.0 mg). The MeOH extract
was further fractionated by solid phase extraction using Discovery DIC-18 cartridge
eluting with H2O/MeOH/EtOAc gradient into four fractions [fraction 1 (71.3 mg, H2O 10
mL), fraction 2 (4.3 mg, H2O/MeOH, 1:1, 10 mL), fraction 3 (8.8 mg, MeOH, 10 mL)
and fraction 4 (3.2 mg, EtOAc 10 ml). Further LC/MS and NMR study revealed that
these fractions contain multiple components and subjected for further anti-bacterial
activity test. The flow chart 4 is shown in Appendix B.
RA001: The mycelia received from TRU were lyophilized yielding 260 mg dry
mycelia, which were extracted with MeOH (25.0 mL x 2). The combined MeOH extract
were dried under reduced pressure yielding MeOH extract (120 mg). The MeOH extract
was further fractionated by solid phase extraction using Discovery DIC-18 cartridge
eluting with H2O/MeOH/EtOAc gradient into three fractions [fraction 1 (90.4 mg, H2O
10 mL), fraction 2 (4.1 mg, H2O/MeOH, 1:1, 10 mL), and fraction 3 (16.5 mg, MeOH, 10
mL). Further LC/MS and NMR study revealed that these fractions contain multiple
components and subjected to further anti-bacterial activity test. The flow chart 5 is shown
in Appendix B.
50
Next, RA003 isolate grew again in the TRU lab for isolation. Pellets sent to
National Research Council at Halifax, NS for further isolation of secondary metabolites.
The mycelia of RA003 received from TRU were lyophilized yielding 580 mg dry
mycelia, which were extracted with MeOH (25.0 mL x 2). The combined MeOH extract
were dried under reduced pressure yielding MeOH extract (160 mg).
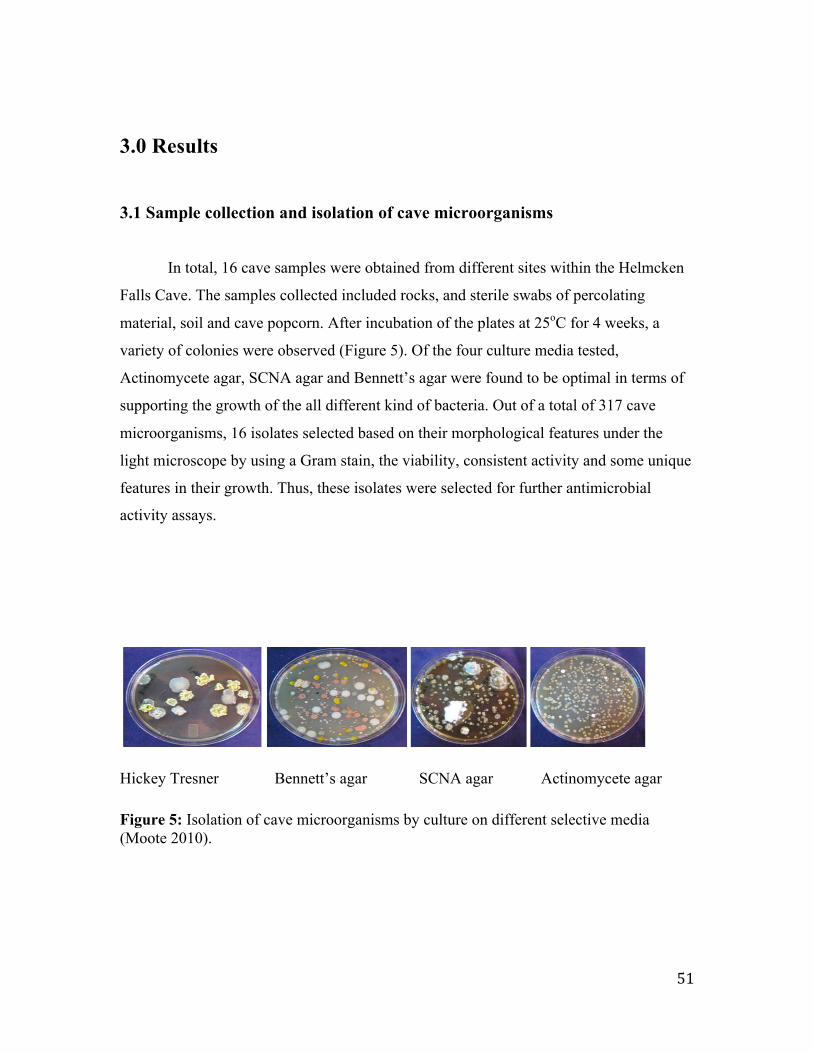
51
3.0 Results
3.1 Sample collection and isolation of cave microorganisms
In total, 16 cave samples were obtained from different sites within the Helmcken
Falls Cave. The samples collected included rocks, and sterile swabs of percolating
material, soil and cave popcorn. After incubation of the plates at 25oC for 4 weeks, a
variety of colonies were observed (Figure 5). Of the four culture media tested,
Actinomycete agar, SCNA agar and Bennett’s agar were found to be optimal in terms of
supporting the growth of the all different kind of bacteria. Out of a total of 317 cave
microorganisms, 16 isolates selected based on their morphological features under the
light microscope by using a Gram stain, the viability, consistent activity and some unique
features in their growth. Thus, these isolates were selected for further antimicrobial
activity assays.
Hickey Tresner Bennett’s agar SCNA agar Actinomycete agar
Figure 5: Isolation of cave microorganisms by culture on different selective media (Moote 2010).
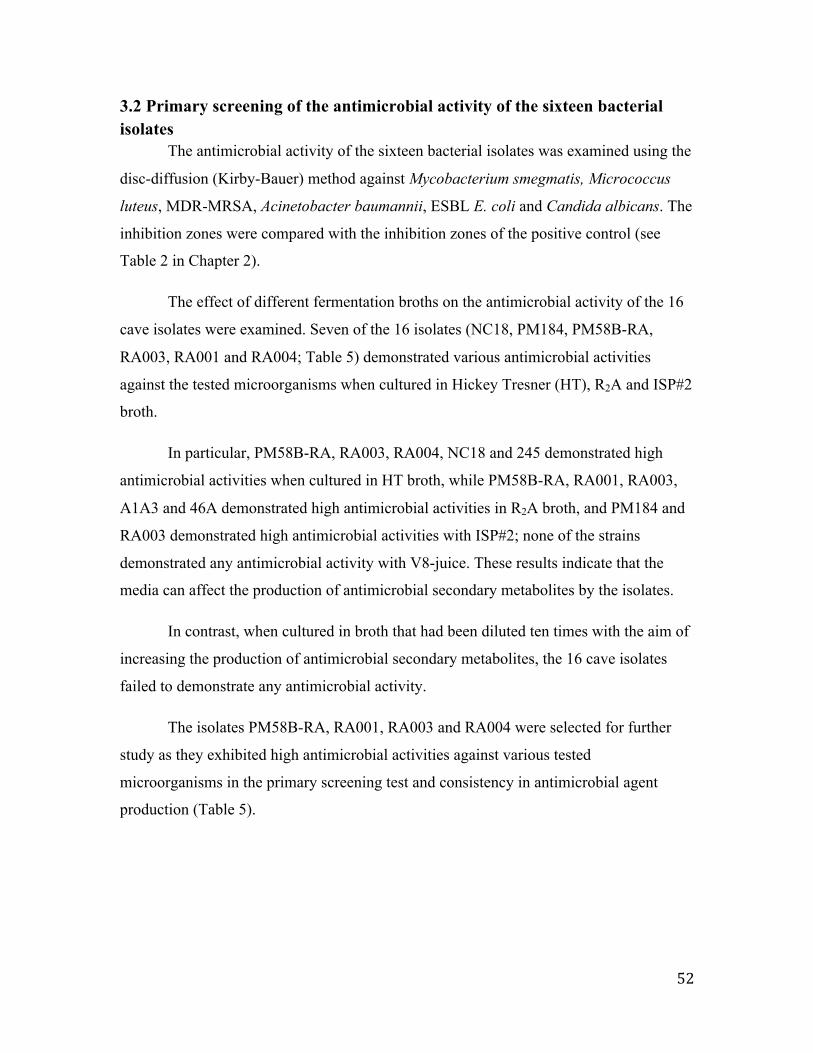
52
3.2 Primary screening of the antimicrobial activity of the sixteen bacterial isolates
The antimicrobial activity of the sixteen bacterial isolates was examined using the
disc-diffusion (Kirby-Bauer) method against Mycobacterium smegmatis, Micrococcus
luteus, MDR-MRSA, Acinetobacter baumannii, ESBL E. coli and Candida albicans. The
inhibition zones were compared with the inhibition zones of the positive control (see
Table 2 in Chapter 2).
The effect of different fermentation broths on the antimicrobial activity of the 16
cave isolates were examined. Seven of the 16 isolates (NC18, PM184, PM58B-RA,
RA003, RA001 and RA004; Table 5) demonstrated various antimicrobial activities
against the tested microorganisms when cultured in Hickey Tresner (HT), R2A and ISP#2
broth.
In particular, PM58B-RA, RA003, RA004, NC18 and 245 demonstrated high
antimicrobial activities when cultured in HT broth, while PM58B-RA, RA001, RA003,
A1A3 and 46A demonstrated high antimicrobial activities in R2A broth, and PM184 and
RA003 demonstrated high antimicrobial activities with ISP#2; none of the strains
demonstrated any antimicrobial activity with V8-juice. These results indicate that the
media can affect the production of antimicrobial secondary metabolites by the isolates.
In contrast, when cultured in broth that had been diluted ten times with the aim of
increasing the production of antimicrobial secondary metabolites, the 16 cave isolates
failed to demonstrate any antimicrobial activity.
The isolates PM58B-RA, RA001, RA003 and RA004 were selected for further
study as they exhibited high antimicrobial activities against various tested
microorganisms in the primary screening test and consistency in antimicrobial agent
production (Table 5).
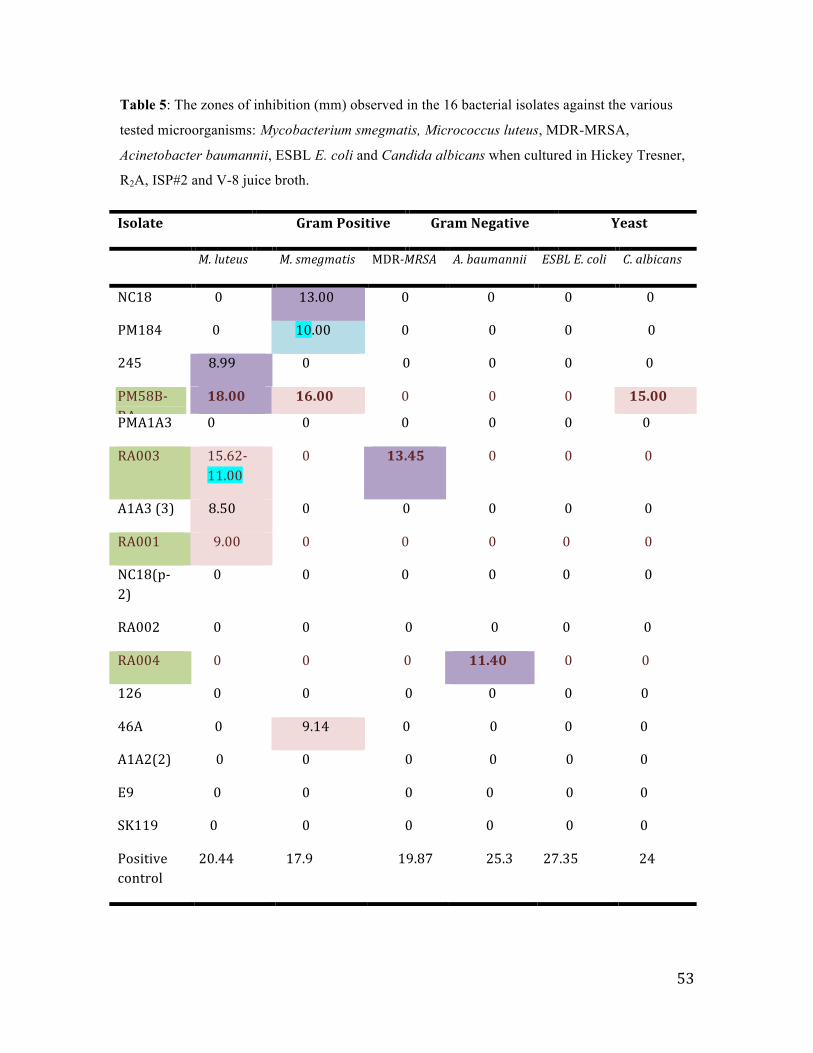
53
Table 5: The zones of inhibition (mm) observed in the 16 bacterial isolates against the various
tested microorganisms: Mycobacterium smegmatis, Micrococcus luteus, MDR-MRSA,
Acinetobacter baumannii, ESBL E. coli and Candida albicans when cultured in Hickey Tresner,
R2A, ISP#2 and V-8 juice broth.
Isolate Gram Positive Gram Negative Yeast
M. luteus M. smegmatis MDR-MRSA A. baumannii ESBL E. coli C. albicans
NC18 0 13.00 0 0 0 0
PM184 0 10.00 0 0 0 0
245 8.99 0 0 0 0 0
PM58B-‐RA
18.00
16.00
0
0
0 15.00
PMA1A3 0 0 0 0 0 0
RA003 15.62-‐11.00
0 13.45 0 0 0
A1A3 (3) 8.50 0 0 0 0 0
RA001 9.00 0 0 0 0 0
NC18(p-‐2)
0 0 0 0 0 0
RA002 0 0 0 0 0 0
RA004 0 0 0 11.40 0 0
126 0 0 0 0 0 0
46A 0 9.14 0 0 0 0
A1A2(2) 0 0 0 0 0 0
E9 0 0 0 0 0 0
SK119 0 0 0 0 0 0
Positive control
20.44 17.9 19.87 25.3 27.35 24
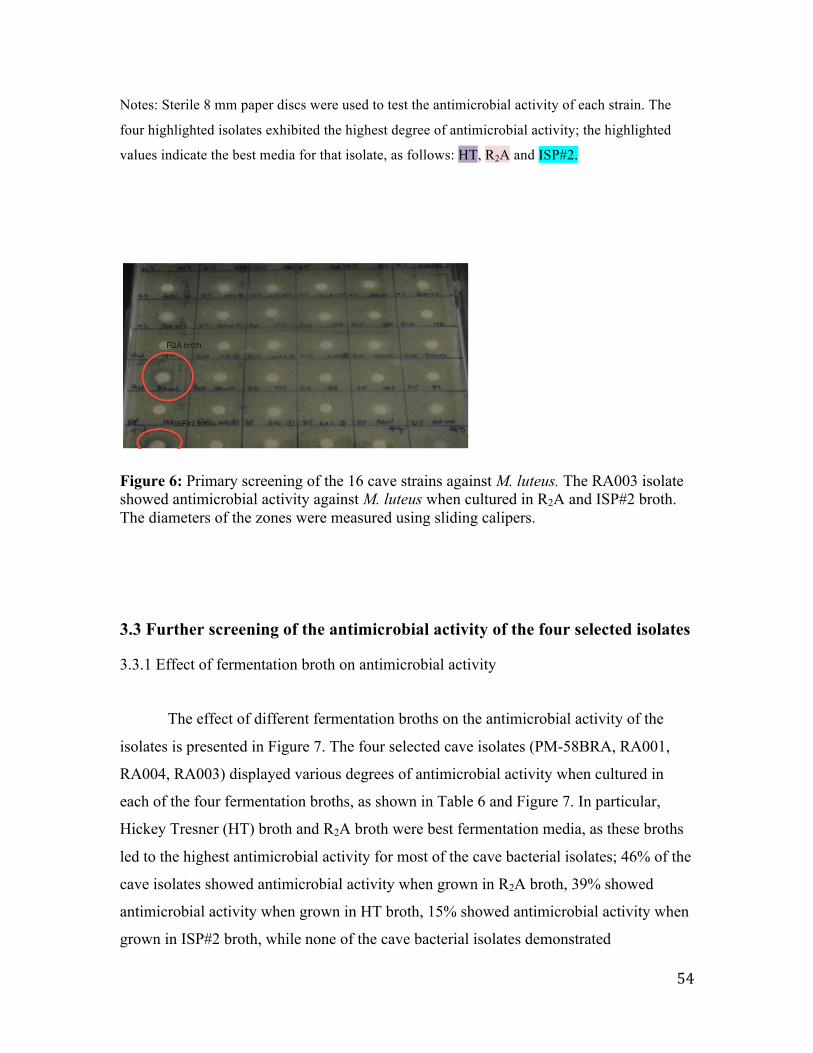
54
Notes: Sterile 8 mm paper discs were used to test the antimicrobial activity of each strain. The
four highlighted isolates exhibited the highest degree of antimicrobial activity; the highlighted
values indicate the best media for that isolate, as follows: HT, R2A and ISP#2.
Figure 6: Primary screening of the 16 cave strains against M. luteus. The RA003 isolate showed antimicrobial activity against M. luteus when cultured in R2A and ISP#2 broth. The diameters of the zones were measured using sliding calipers.
3.3 Further screening of the antimicrobial activity of the four selected isolates
3.3.1 Effect of fermentation broth on antimicrobial activity
The effect of different fermentation broths on the antimicrobial activity of the
isolates is presented in Figure 7. The four selected cave isolates (PM-58BRA, RA001,
RA004, RA003) displayed various degrees of antimicrobial activity when cultured in
each of the four fermentation broths, as shown in Table 6 and Figure 7. In particular,
Hickey Tresner (HT) broth and R2A broth were best fermentation media, as these broths
led to the highest antimicrobial activity for most of the cave bacterial isolates; 46% of the
cave isolates showed antimicrobial activity when grown in R2A broth, 39% showed
antimicrobial activity when grown in HT broth, 15% showed antimicrobial activity when
grown in ISP#2 broth, while none of the cave bacterial isolates demonstrated
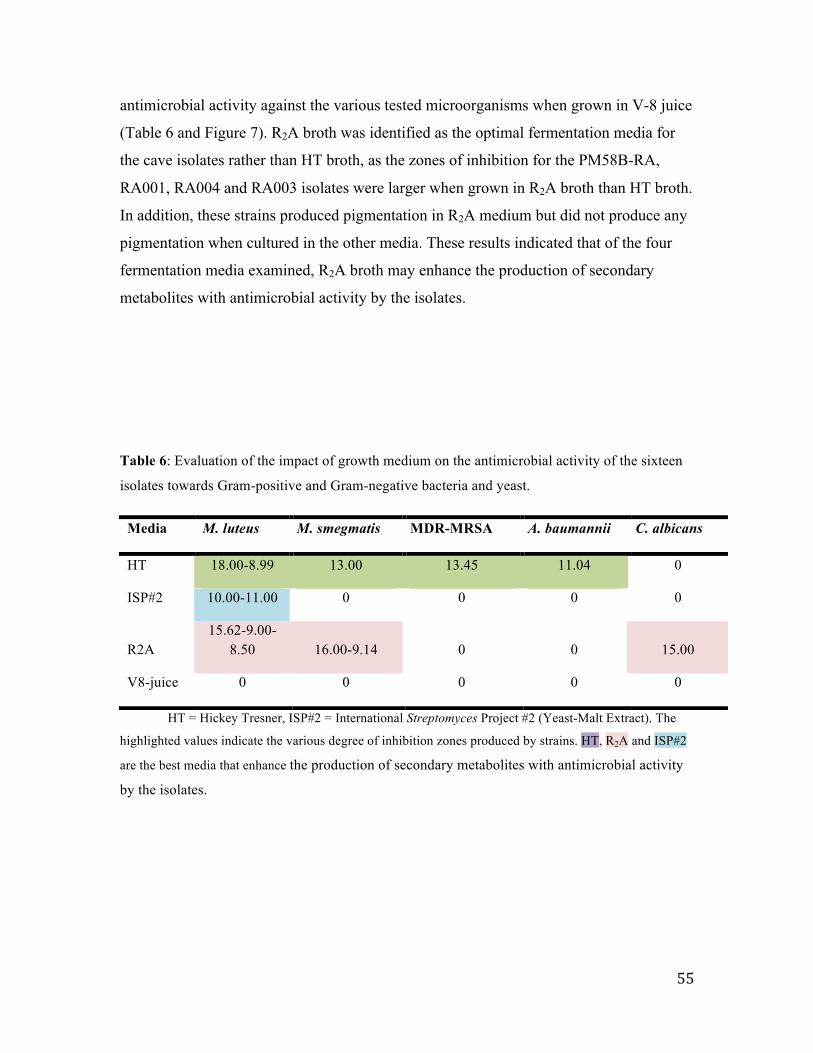
55
antimicrobial activity against the various tested microorganisms when grown in V-8 juice
(Table 6 and Figure 7). R2A broth was identified as the optimal fermentation media for
the cave isolates rather than HT broth, as the zones of inhibition for the PM58B-RA,
RA001, RA004 and RA003 isolates were larger when grown in R2A broth than HT broth.
In addition, these strains produced pigmentation in R2A medium but did not produce any
pigmentation when cultured in the other media. These results indicated that of the four
fermentation media examined, R2A broth may enhance the production of secondary
metabolites with antimicrobial activity by the isolates.
Table 6: Evaluation of the impact of growth medium on the antimicrobial activity of the sixteen
isolates towards Gram-positive and Gram-negative bacteria and yeast.
Media M. luteus M. smegmatis MDR-MRSA A. baumannii C. albicans
HT 18.00-8.99 13.00 13.45 11.04 0
ISP#2 10.00-11.00 0 0 0 0
R2A 15.62-9.00-
8.50 16.00-9.14 0 0 15.00
V8-juice 0 0 0 0 0
HT = Hickey Tresner, ISP#2 = International Streptomyces Project #2 (Yeast-Malt Extract). The
highlighted values indicate the various degree of inhibition zones produced by strains. HT, R2A and ISP#2
are the best media that enhance the production of secondary metabolites with antimicrobial activity
by the isolates.
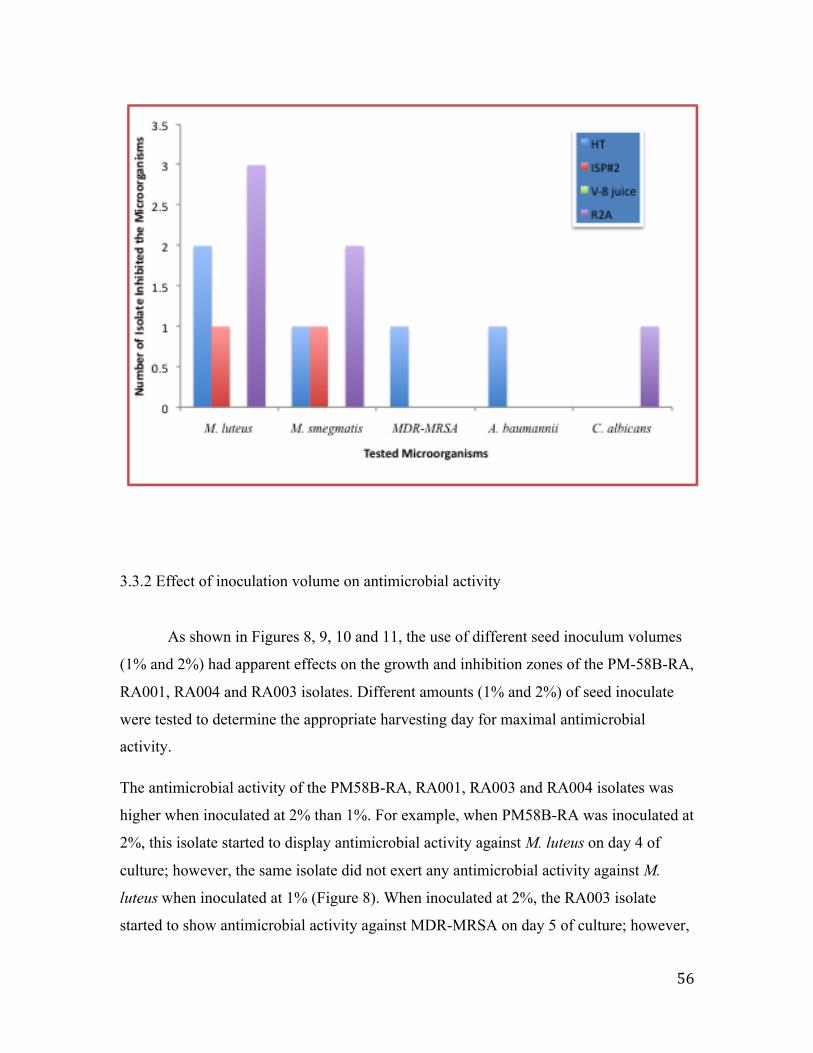
56
3.3.2 Effect of inoculation volume on antimicrobial activity
As shown in Figures 8, 9, 10 and 11, the use of different seed inoculum volumes
(1% and 2%) had apparent effects on the growth and inhibition zones of the PM-58B-RA,
RA001, RA004 and RA003 isolates. Different amounts (1% and 2%) of seed inoculate
were tested to determine the appropriate harvesting day for maximal antimicrobial
activity.
The antimicrobial activity of the PM58B-RA, RA001, RA003 and RA004 isolates was
higher when inoculated at 2% than 1%. For example, when PM58B-RA was inoculated at
2%, this isolate started to display antimicrobial activity against M. luteus on day 4 of
culture; however, the same isolate did not exert any antimicrobial activity against M.
luteus when inoculated at 1% (Figure 8). When inoculated at 2%, the RA003 isolate
started to show antimicrobial activity against MDR-MRSA on day 5 of culture; however,
Figure 7: Identification of the best fermentation broth. Of the 16 isolates tested, six demonstrated antimicrobial activity against Gram-positive bacteria or C. albicans when grown in R2A broth, five demonstrated antimicrobial activity against Gram-positive or Gram negative bacteria when grown in HT broth; two demonstrated antimicrobial activity against only M. luteus when grown in ISP#2 broth, while none of the strains demonstrated antimicrobial activity against any various tested microorganisms when cultured in V-8 juice.
57
this isolate also displayed antimicrobial activity against MDR-MRSA on day 6 when
inoculated at 1% (Figure 11). In general, and as shown in Figures 8, 9, 10 and 11, all four
of the isolates showed faster production of antimicrobial activity and more rapid growth
when inoculated at 2% than 1%. However, the PM58B-RA isolate started to display
antimicrobial activity on day 8 when inoculated at both 1% and 2% (Figure 8).
When the seed inoculum volume was 2%, the maximum inhibition zones were
15.00 mm for PM-58BRA against M. luteus, 9.92 mm for RA001 against M. luteus,
12.35 mm for RA004 against A. baumannii and 19.17 mm for RA003 against M. luteus.
When the seed inoculum volume was 1%, the maximum inhibition zones were 8.87 mm
for PM-58BRA against M. smegmatis and 13.83 mm for RA003 against MDR-MRSA;
RA001 and RA004 did not show any antimicrobial activity at this temperature.
3.3.3 Effect of the length of fermentation on antimicrobial activity
Determination of the optimal fermentation day is also significant for the maximal
production of antimicrobial compounds. Antibiotic production can take place on specific
days during the stationary phase. Therefore, the production of antimicrobial secondary
metabolites may not increase as the number of days of culture increases. In fact,
increasing the number of days of culture may lead to the production of toxins which
inhibit the production of antimicrobial secondary metabolites.
Figures 8, 9, 10 and 11 illustrate the effects of the number of days of fermentation
on the antimicrobial activity of the isolates. The optimal days were day 4 for PM-58BRA,
RA001 and RA004 and day 7 for RA003. The maximum inhibition zone of the PM-
58BRA isolate against M. luteus and M. smegmatis (15.00 mm and 11.5 mm) occurred on
days 4 and 11, respectively (Figure 8). The maximum inhibition zones of the RA001
isolate (9.92 mm) against M. luteus occurred on day 4 (Figure 9). The maximum
inhibition zones of the RA004 isolate (12.85 mm) against A. baumannii occurred on day
9 (Figure 10). The maximum inhibition zones of the RA003 isolate (19.17 mm and
17.19) against M. luteus and MDR-MRSA occurred on day 7 (Figure 11). After these
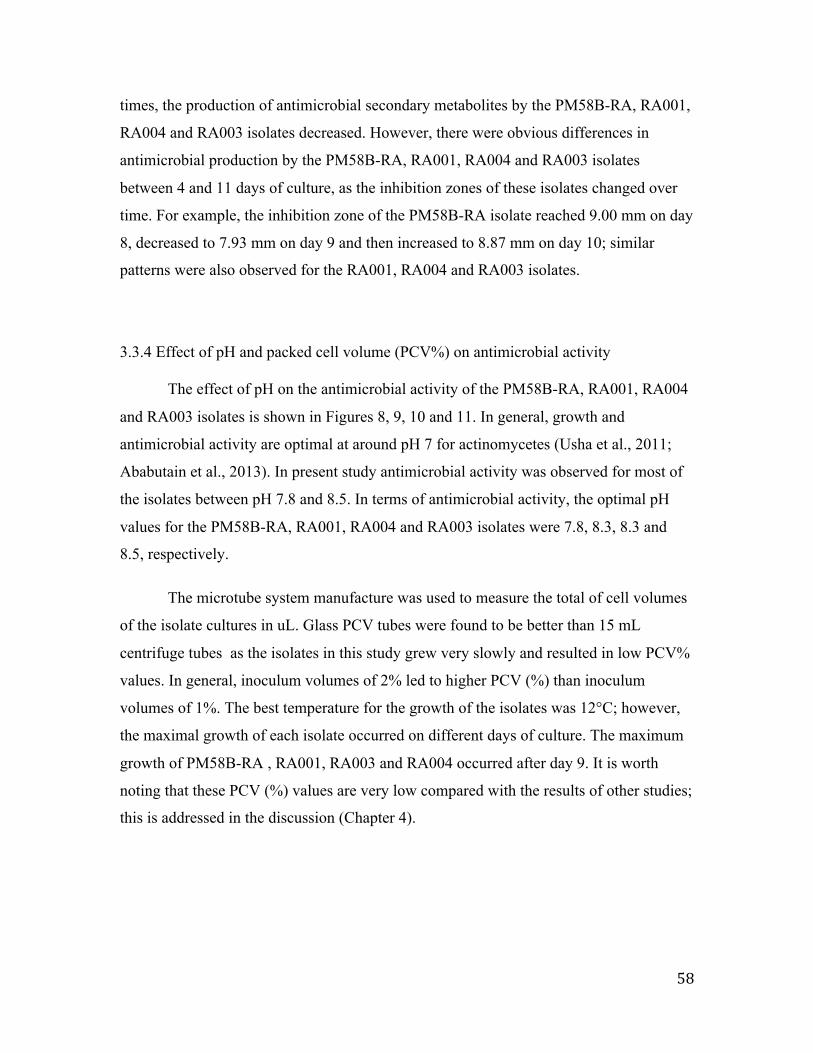
58
times, the production of antimicrobial secondary metabolites by the PM58B-RA, RA001,
RA004 and RA003 isolates decreased. However, there were obvious differences in
antimicrobial production by the PM58B-RA, RA001, RA004 and RA003 isolates
between 4 and 11 days of culture, as the inhibition zones of these isolates changed over
time. For example, the inhibition zone of the PM58B-RA isolate reached 9.00 mm on day
8, decreased to 7.93 mm on day 9 and then increased to 8.87 mm on day 10; similar
patterns were also observed for the RA001, RA004 and RA003 isolates.
3.3.4 Effect of pH and packed cell volume (PCV%) on antimicrobial activity
The effect of pH on the antimicrobial activity of the PM58B-RA, RA001, RA004
and RA003 isolates is shown in Figures 8, 9, 10 and 11. In general, growth and
antimicrobial activity are optimal at around pH 7 for actinomycetes (Usha et al., 2011;
Ababutain et al., 2013). In present study antimicrobial activity was observed for most of
the isolates between pH 7.8 and 8.5. In terms of antimicrobial activity, the optimal pH
values for the PM58B-RA, RA001, RA004 and RA003 isolates were 7.8, 8.3, 8.3 and
8.5, respectively.
The microtube system manufacture was used to measure the total of cell volumes
of the isolate cultures in uL. Glass PCV tubes were found to be better than 15 mL
centrifuge tubes as the isolates in this study grew very slowly and resulted in low PCV%
values. In general, inoculum volumes of 2% led to higher PCV (%) than inoculum
volumes of 1%. The best temperature for the growth of the isolates was 12°C; however,
the maximal growth of each isolate occurred on different days of culture. The maximum
growth of PM58B-RA , RA001, RA003 and RA004 occurred after day 9. It is worth
noting that these PCV (%) values are very low compared with the results of other studies;
this is addressed in the discussion (Chapter 4).
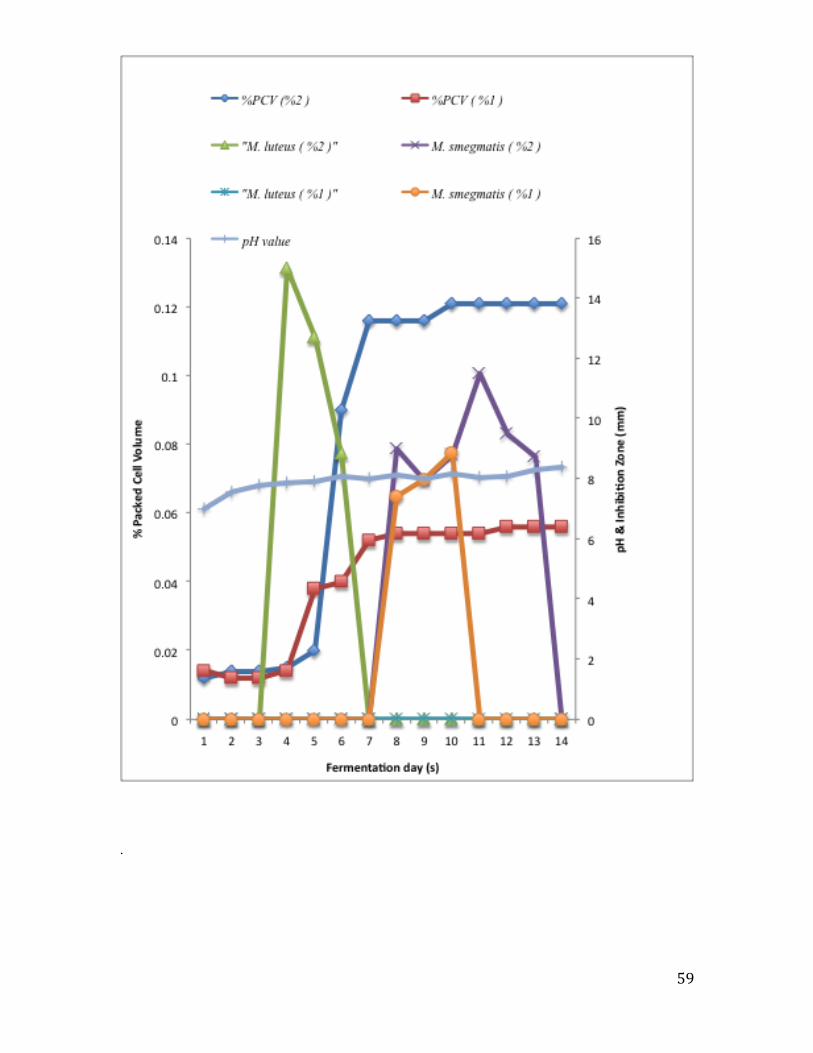
59
.
Figure 8: Effect of the duration of culture on the antimicrobial activity of the PM-58B-RA isolate. The pH and packed cell volume (PCV%) were measured every 24 h, and antimicrobial activity against M. luteus and M. smegmatis was measured using the disc-diffusion (Kirby-Bauer) method.

60
Figure 9: Effect of the duration of culture on the antimicrobial activity of the RA001 isolate. The pH and % packed cell volume were measured every 24 h, and antimicrobial activity against M. luteus was measured using the disc-diffusion (Kirby-Bauer) method
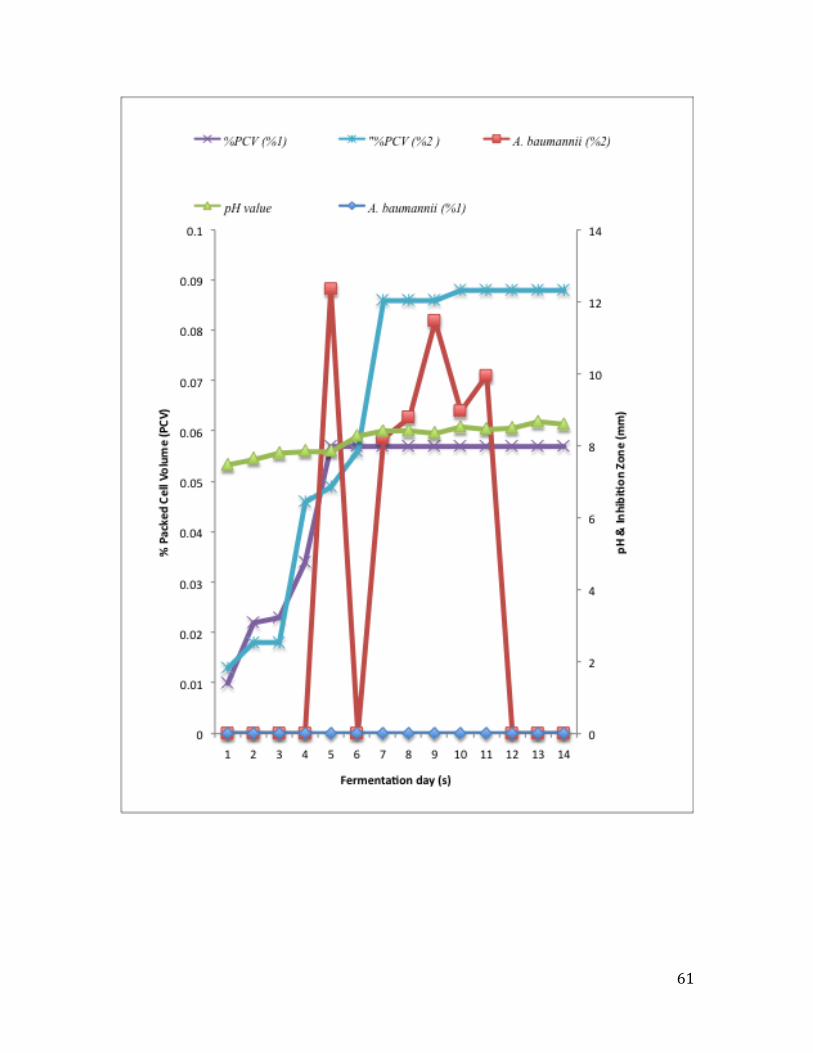
61
Figure 10: Effect of the duration of culture on the antimicrobial activity of the RA004 isolate. The pH and % packed cell volume were measured every 24 h, and antimicrobial activity against A. baumannii was measured using the disc-diffusion (Kirby-Bauer) method.
62
Figure 11: Effect of the duration of culture on the antimicrobial activity of the RA003 isolate. The pH and % packed cell volume were measured every 24 hours and antimicrobial activity against M. luteus, and MDR-MRSA were measured using the disc-diffusion (Kirby-Bauer) method.
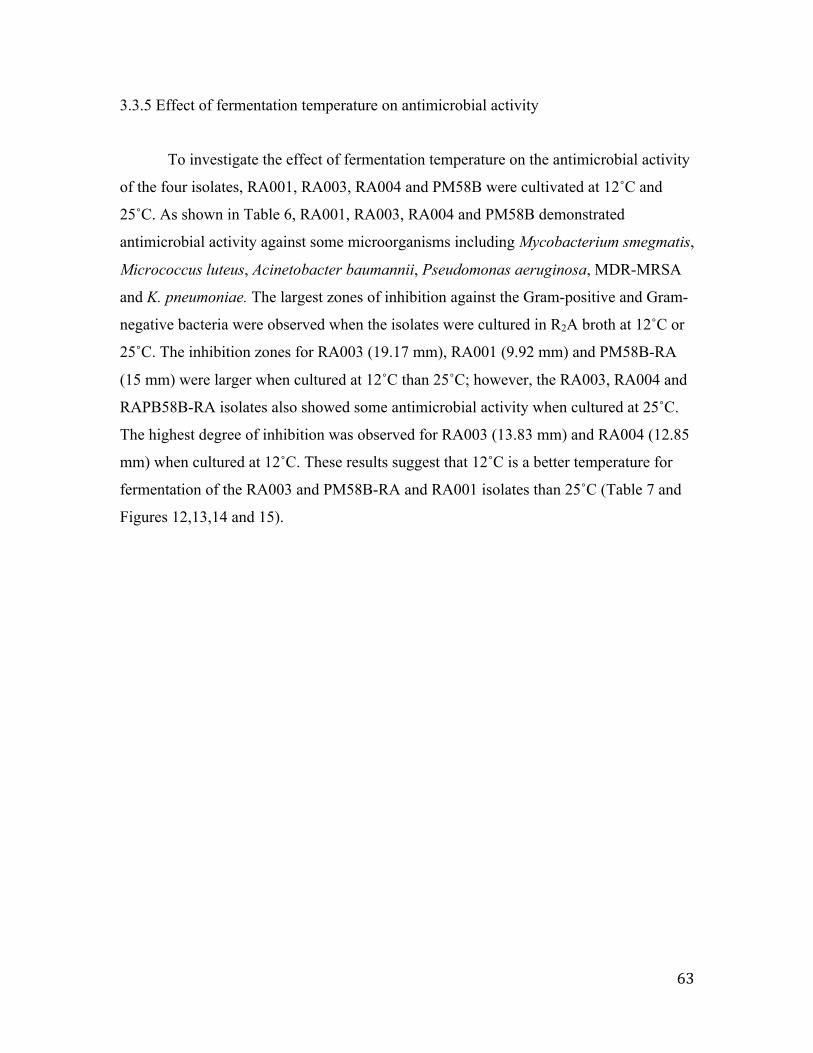
63
3.3.5 Effect of fermentation temperature on antimicrobial activity
To investigate the effect of fermentation temperature on the antimicrobial activity
of the four isolates, RA001, RA003, RA004 and PM58B were cultivated at 12˚C and
25˚C. As shown in Table 6, RA001, RA003, RA004 and PM58B demonstrated
antimicrobial activity against some microorganisms including Mycobacterium smegmatis,
Micrococcus luteus, Acinetobacter baumannii, Pseudomonas aeruginosa, MDR-MRSA
and K. pneumoniae. The largest zones of inhibition against the Gram-positive and Gram-
negative bacteria were observed when the isolates were cultured in R2A broth at 12˚C or
25˚C. The inhibition zones for RA003 (19.17 mm), RA001 (9.92 mm) and PM58B-RA
(15 mm) were larger when cultured at 12˚C than 25˚C; however, the RA003, RA004 and
RAPB58B-RA isolates also showed some antimicrobial activity when cultured at 25˚C.
The highest degree of inhibition was observed for RA003 (13.83 mm) and RA004 (12.85
mm) when cultured at 12˚C. These results suggest that 12˚C is a better temperature for
fermentation of the RA003 and PM58B-RA and RA001 isolates than 25˚C (Table 7 and
Figures 12,13,14 and 15).
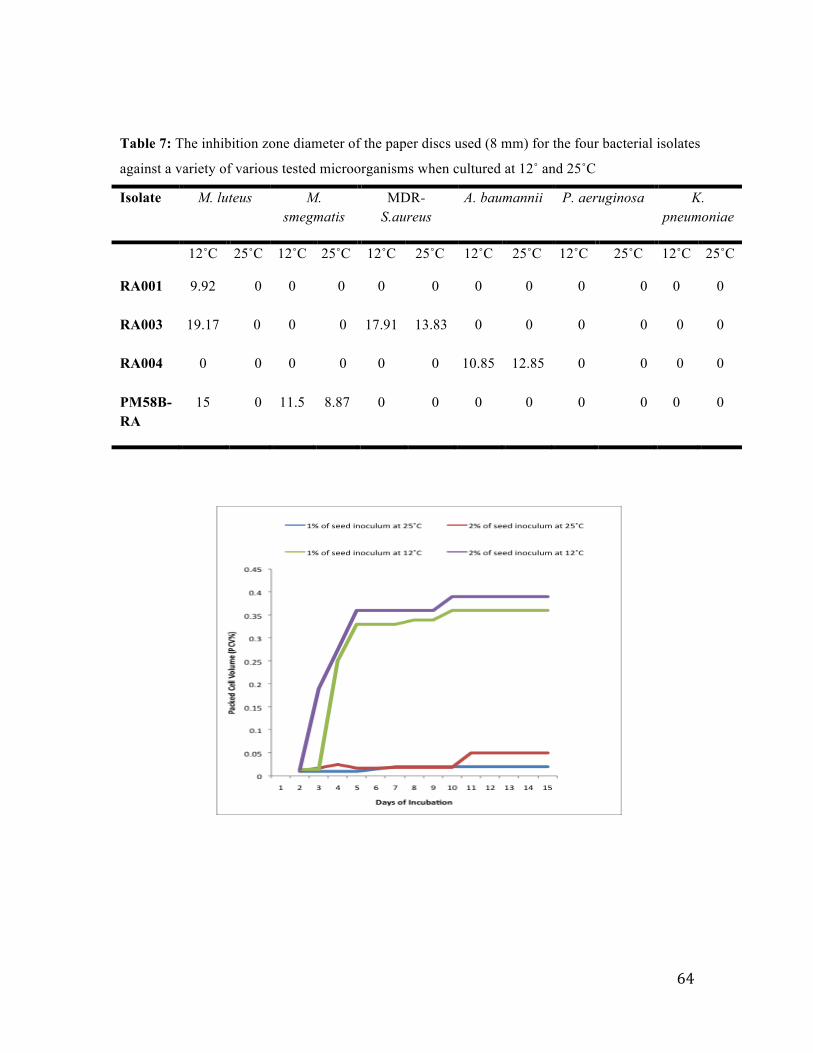
64
Table 7: The inhibition zone diameter of the paper discs used (8 mm) for the four bacterial isolates
against a variety of various tested microorganisms when cultured at 12˚ and 25˚C
Isolate M. luteus M. smegmatis
MDR-S.aureus
A. baumannii P. aeruginosa K. pneumoniae
12˚C 25˚C 12˚C 25˚C 12˚C 25˚C 12˚C 25˚C 12˚C 25˚C 12˚C 25˚C
RA001 9.92 0 0 0 0 0 0 0 0 0 0
0
RA003 19.17 0 0 0 17.91 13.83 0 0 0 0 0
0
RA004 0 0 0 0 0 0 10.85 12.85 0 0 0
0
PM58B-RA
15 0 11.5 8.87 0 0 0 0 0 0 0
0
Figure 12: Effect of temperature on the growth of the RA001 isolate.
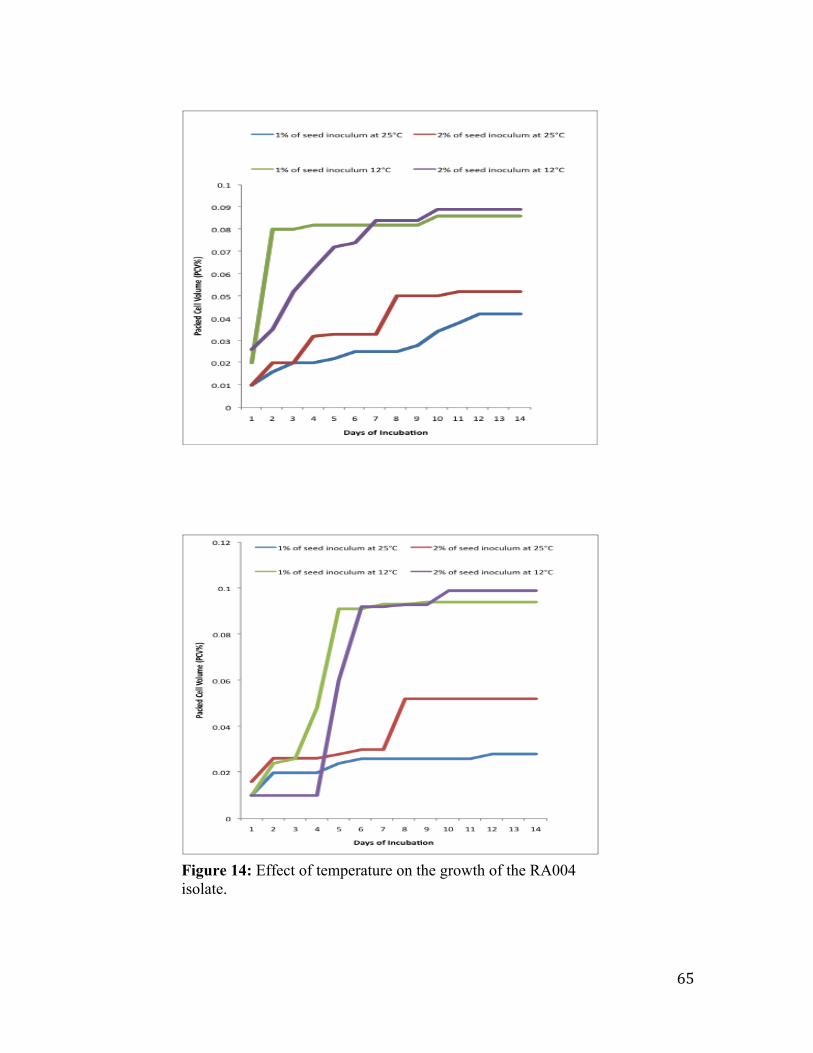
65
Figure 13: Effect of temperature on the growth of the RA003 isolate.
Figure 14: Effect of temperature on the growth of the RA004 isolate.
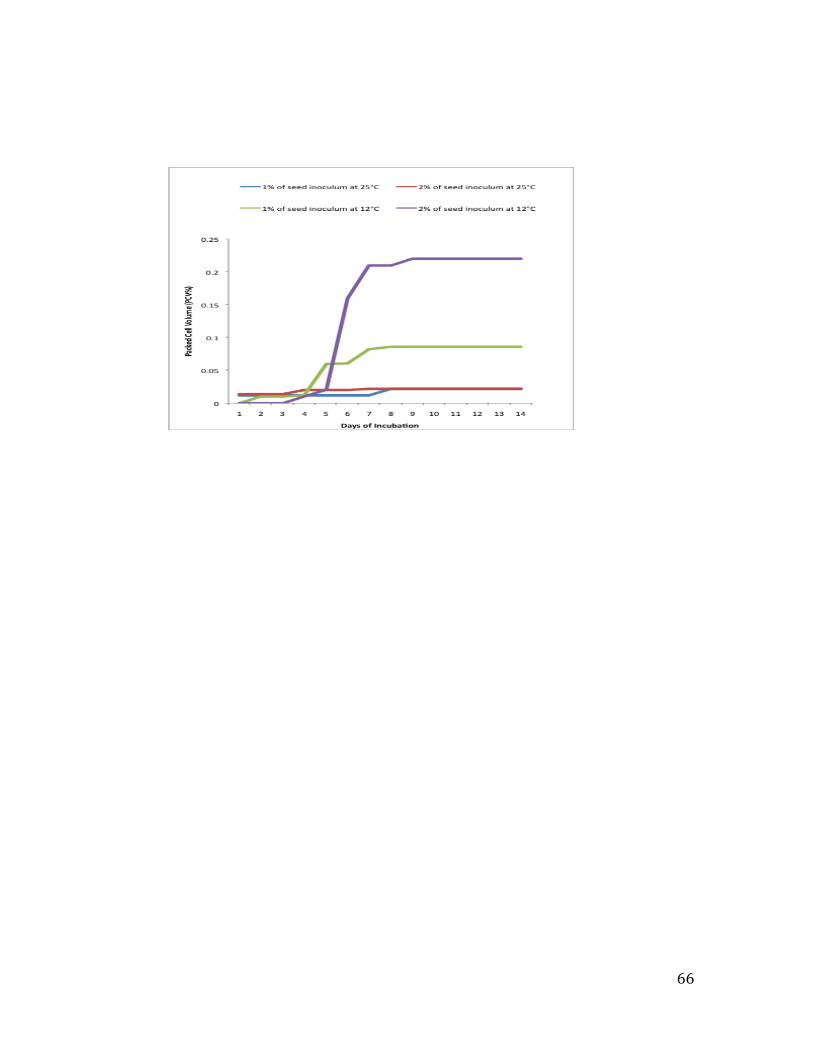
66
Figure 15: Effect of temperature on the growth of the PM58B-RA isolate.
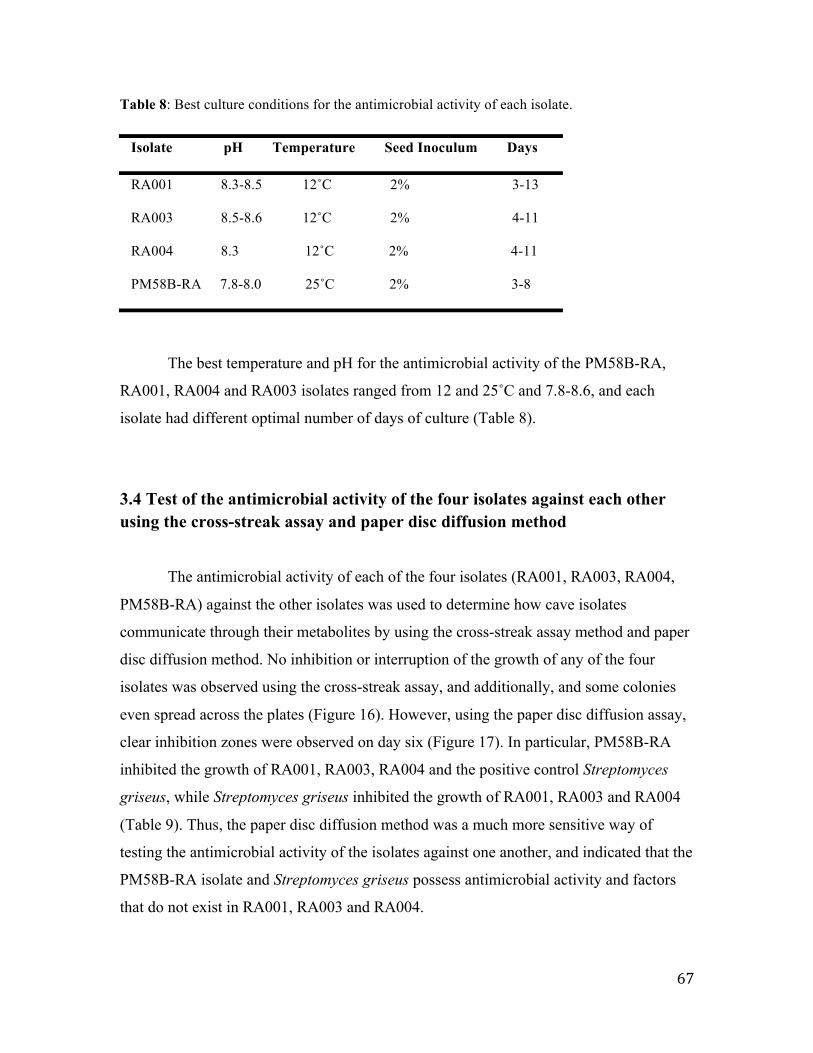
67
Table 8: Best culture conditions for the antimicrobial activity of each isolate.
Isolate pH Temperature Seed Inoculum Days
RA001 8.3-8.5 12˚C 2% 3-13
RA003 8.5-8.6 12˚C 2% 4-11
RA004 8.3 12˚C 2% 4-11
PM58B-RA 7.8-8.0 25˚C 2% 3-8
The best temperature and pH for the antimicrobial activity of the PM58B-RA,
RA001, RA004 and RA003 isolates ranged from 12 and 25˚C and 7.8-8.6, and each
isolate had different optimal number of days of culture (Table 8).
3.4 Test of the antimicrobial activity of the four isolates against each other using the cross-streak assay and paper disc diffusion method
The antimicrobial activity of each of the four isolates (RA001, RA003, RA004,
PM58B-RA) against the other isolates was used to determine how cave isolates
communicate through their metabolites by using the cross-streak assay method and paper
disc diffusion method. No inhibition or interruption of the growth of any of the four
isolates was observed using the cross-streak assay, and additionally, and some colonies
even spread across the plates (Figure 16). However, using the paper disc diffusion assay,
clear inhibition zones were observed on day six (Figure 17). In particular, PM58B-RA
inhibited the growth of RA001, RA003, RA004 and the positive control Streptomyces
griseus, while Streptomyces griseus inhibited the growth of RA001, RA003 and RA004
(Table 9). Thus, the paper disc diffusion method was a much more sensitive way of
testing the antimicrobial activity of the isolates against one another, and indicated that the
PM58B-RA isolate and Streptomyces griseus possess antimicrobial activity and factors
that do not exist in RA001, RA003 and RA004.
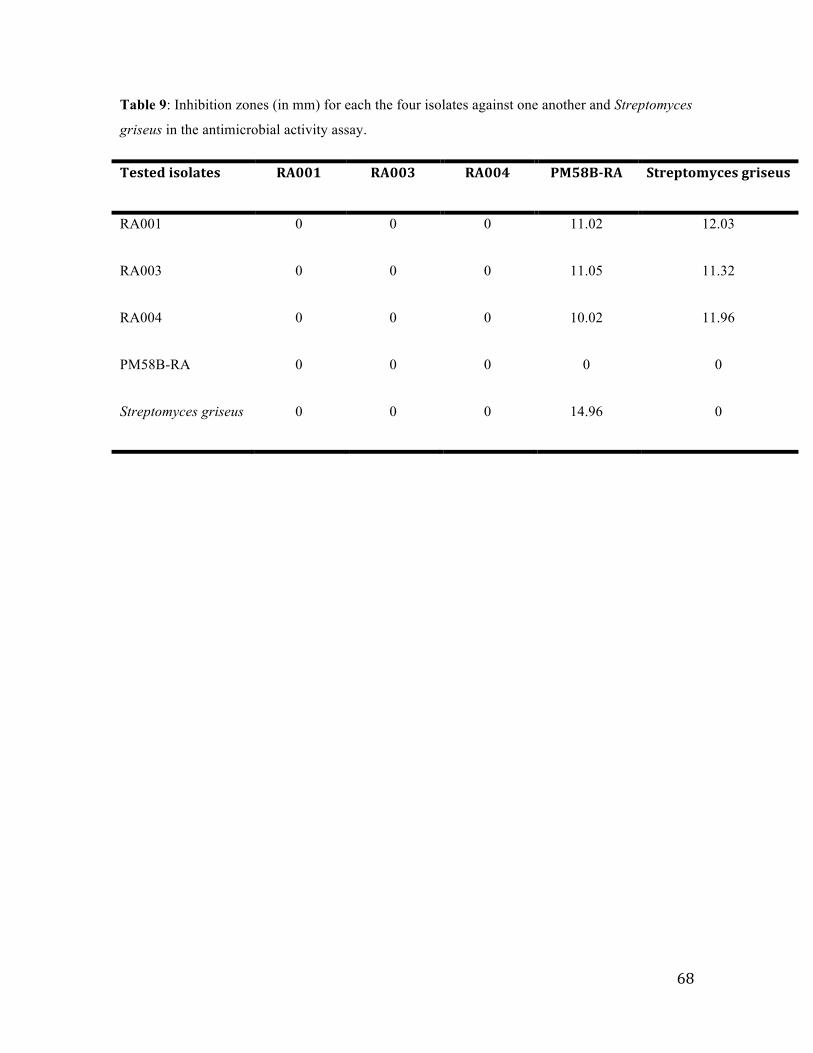
68
Table 9: Inhibition zones (in mm) for each the four isolates against one another and Streptomyces
griseus in the antimicrobial activity assay.
Tested isolates RA001 RA003 RA004 PM58B-RA Streptomyces griseus
RA001 0 0 0 11.02 12.03
RA003 0 0 0 11.05 11.32
RA004 0 0 0 10.02 11.96
PM58B-RA 0 0 0 0 0
Streptomyces griseus 0 0 0 14.96 0
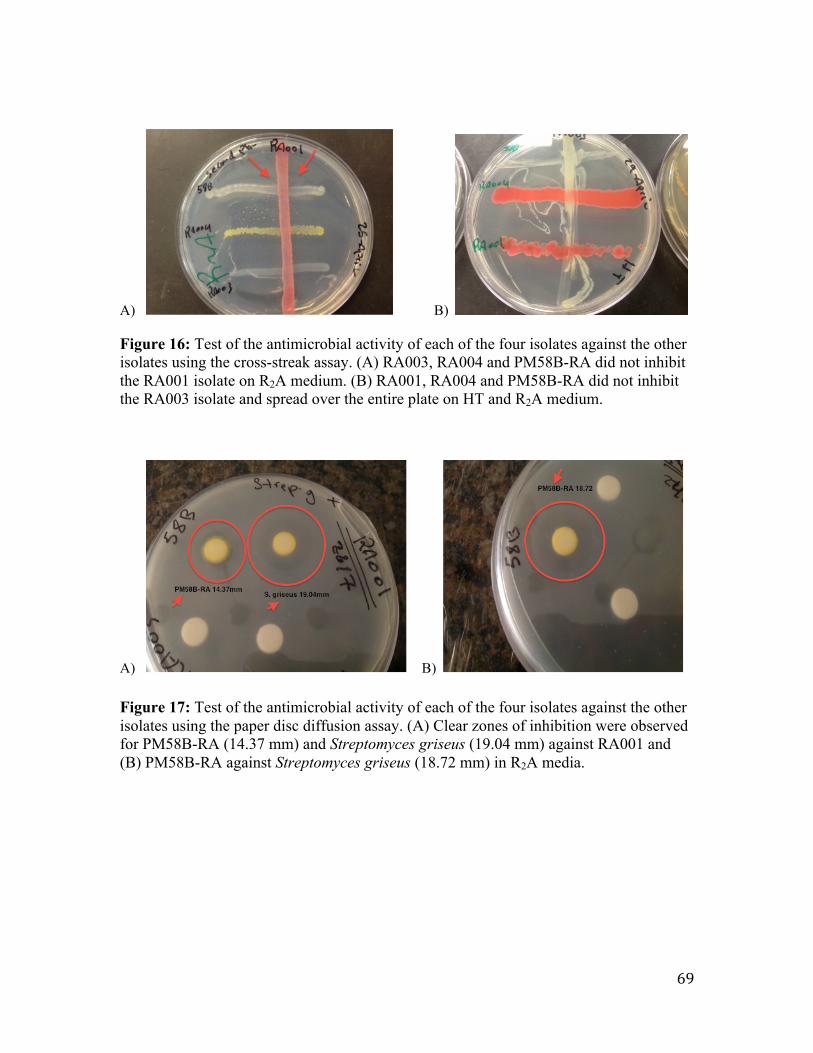
69
A) B)
Figure 16: Test of the antimicrobial activity of each of the four isolates against the other isolates using the cross-streak assay. (A) RA003, RA004 and PM58B-RA did not inhibit the RA001 isolate on R2A medium. (B) RA001, RA004 and PM58B-RA did not inhibit the RA003 isolate and spread over the entire plate on HT and R2A medium.
A) B)
Figure 17: Test of the antimicrobial activity of each of the four isolates against the other isolates using the paper disc diffusion assay. (A) Clear zones of inhibition were observed for PM58B-RA (14.37 mm) and Streptomyces griseus (19.04 mm) against RA001 and (B) PM58B-RA against Streptomyces griseus (18.72 mm) in R2A media.
70
3.4 Identification of the four isolates with antimicrobial activity
3.4.1 Morphological observations and chemotaxonomic study
Primary classification and identification of the four isolates was based on their
microscopic/ macroscopic morphological and chemotaxonomic characteristics. The four
cave isolates were identified as Gram-positive bacteria on basis of their morphological
characteristics under the light microscope, such as Gram staining. However, each of the
four isolates also possessed morphological characteristics that supported their
identification as non-actinomycete bacteria (Table 10). For example, RA001 and RA004
were rod-shaped and RA003 and PM58B-RA were cocci. Under the light microscope,
PM58B-RA appeared filamentous; however, RA001, RA003 and RA004 appeared non-
filamentous. Furthermore, the colonies of all four isolates shared some similar features.
RA001 and RA004 had similar circular colonies but different pigmentations, and RA003
had circular colonies and differed from PM58B-RA in both colony shape and
pigmentation (Figure 18). PM58B-RA had filamentous colonies. Cell wall analysis was
performed using thin layer chromatography. Notably, LL-diaminopimelic acid, a vital
component of peptidoglycan in S. griseus, was not detected in the whole cell hydrolsates
or sonicated cells samples from the RA001, RA003, RA004 or PM58B-RA isolates. All
four isolates results in the plate observed as streaking and the silica gel plate surface were
pricking, this experiment repeated two times with the same results (Figures 19, 20, 21
and 22).
PM58B-‐RA RA001 RA004 RA003
Figure 18: Morphology of the colonies of the PM58B-RA, RA001, RA004 and RA003 isolates in R2A medium at 25˚C after about 5 days (All images are 50x magnifications).
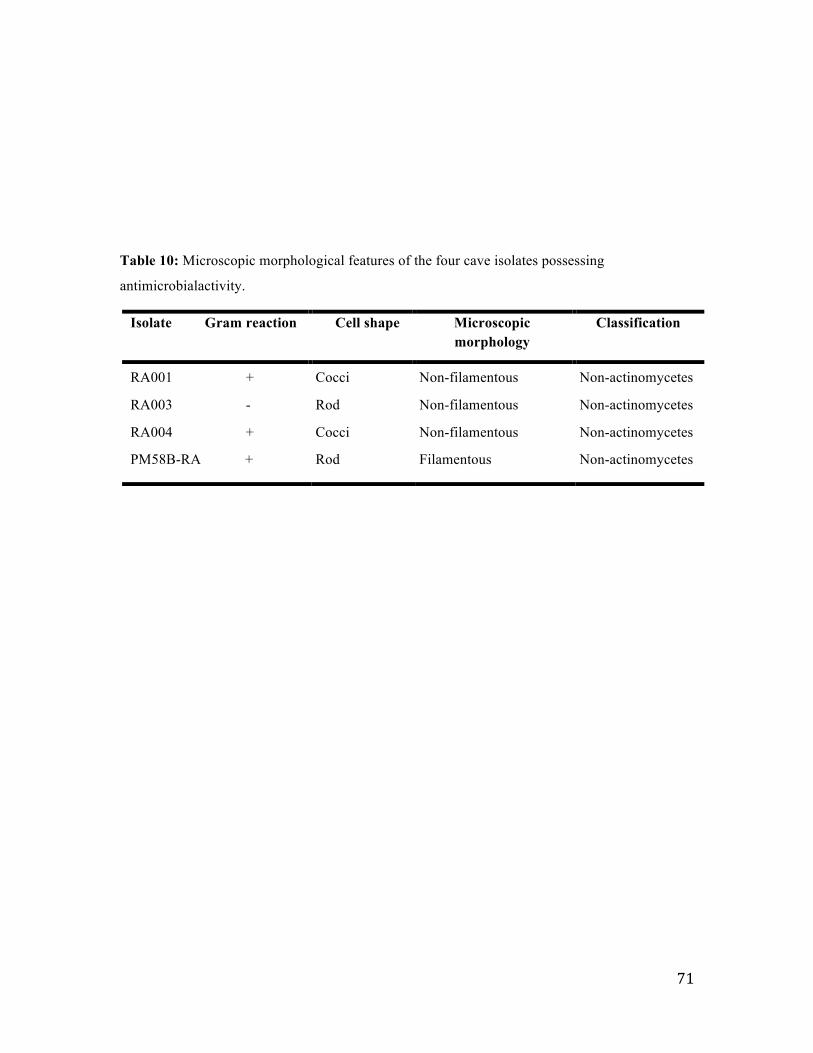
71
Table 10: Microscopic morphological features of the four cave isolates possessing
antimicrobialactivity.
Isolate Gram reaction Cell shape Microscopic morphology
Classification
RA001 +
RA003 -
RA004 +
PM58B-RA +
Cocci
Rod
Cocci
Rod
Non-filamentous
Non-filamentous
Non-filamentous
Filamentous
Non-actinomycetes
Non-actinomycetes
Non-actinomycetes
Non-actinomycetes
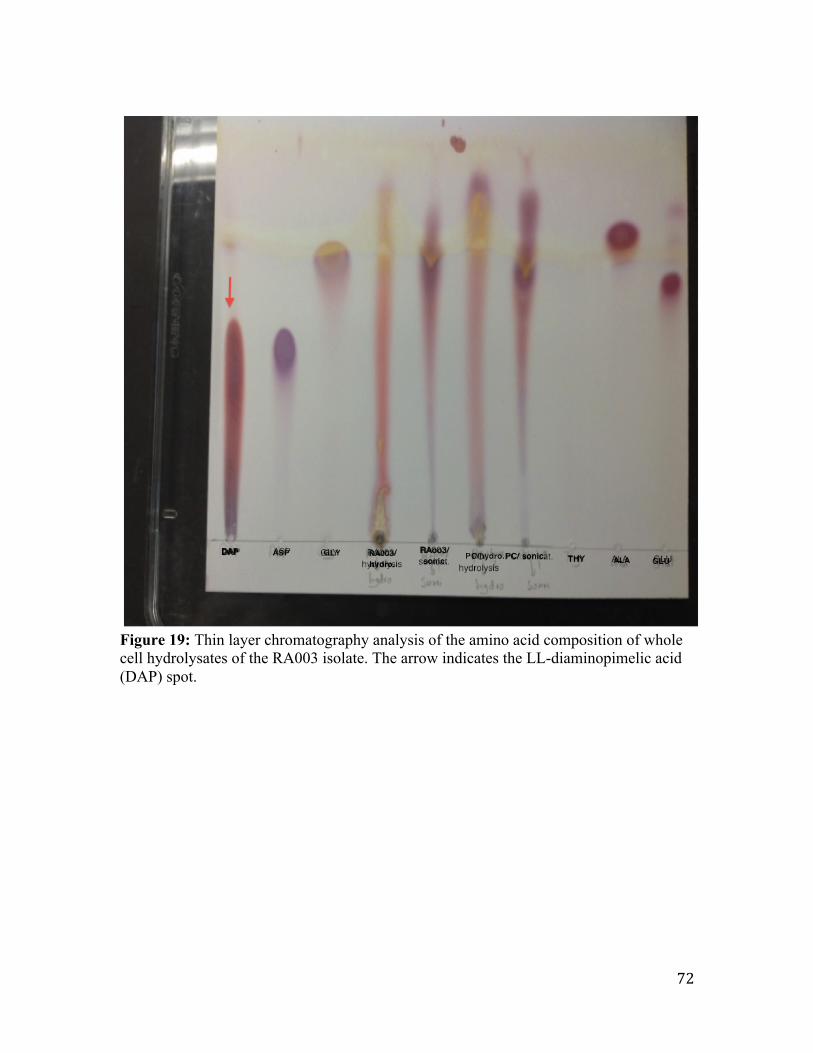
72
Figure 19: Thin layer chromatography analysis of the amino acid composition of whole cell hydrolysates of the RA003 isolate. The arrow indicates the LL-diaminopimelic acid (DAP) spot.
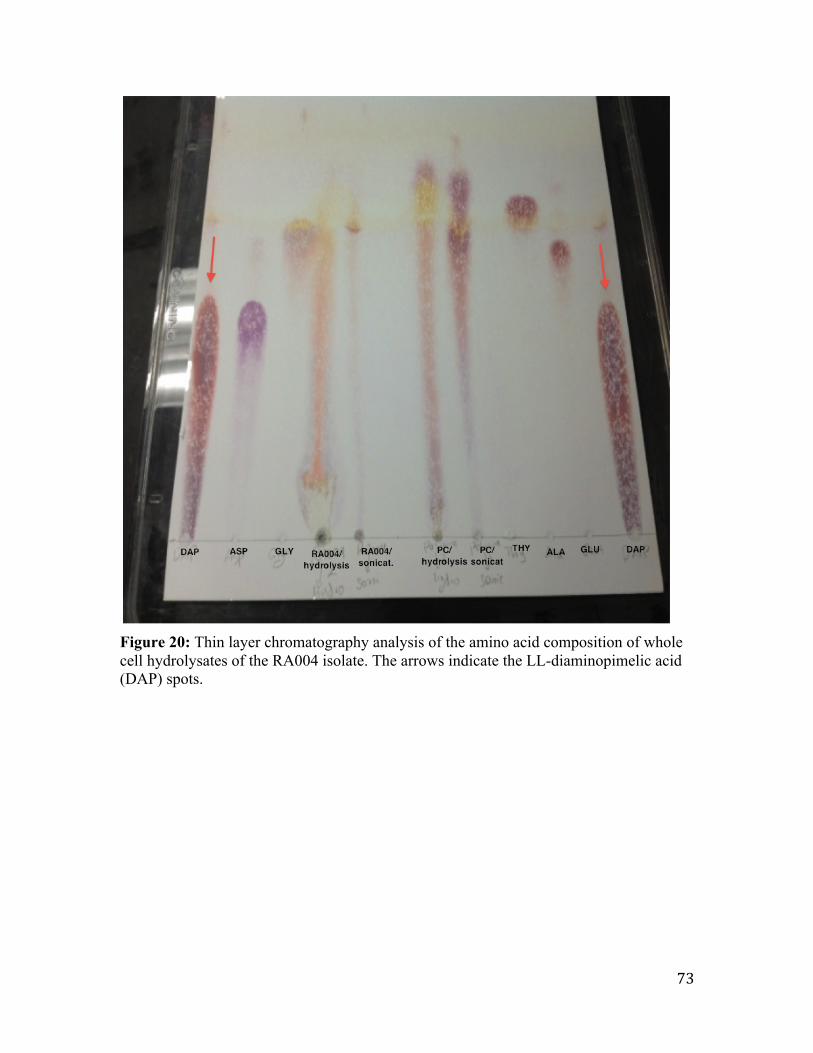
73
Figure 20: Thin layer chromatography analysis of the amino acid composition of whole cell hydrolysates of the RA004 isolate. The arrows indicate the LL-diaminopimelic acid (DAP) spots.
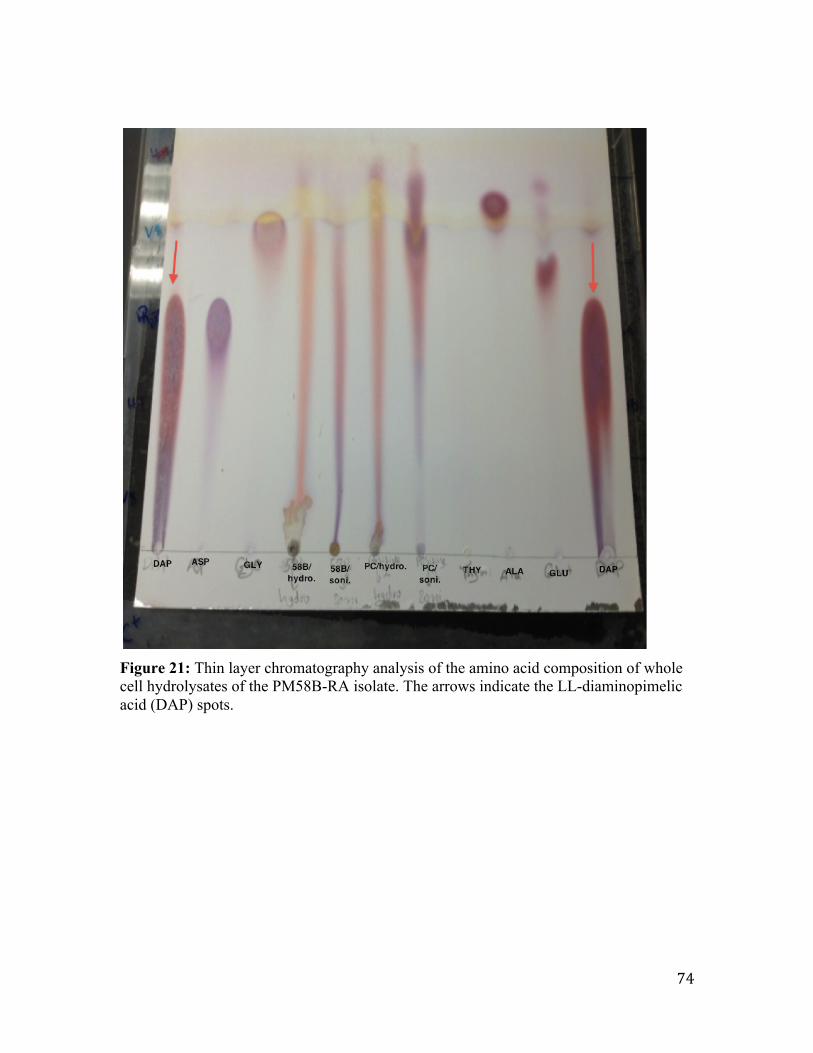
74
Figure 21: Thin layer chromatography analysis of the amino acid composition of whole cell hydrolysates of the PM58B-RA isolate. The arrows indicate the LL-diaminopimelic acid (DAP) spots.
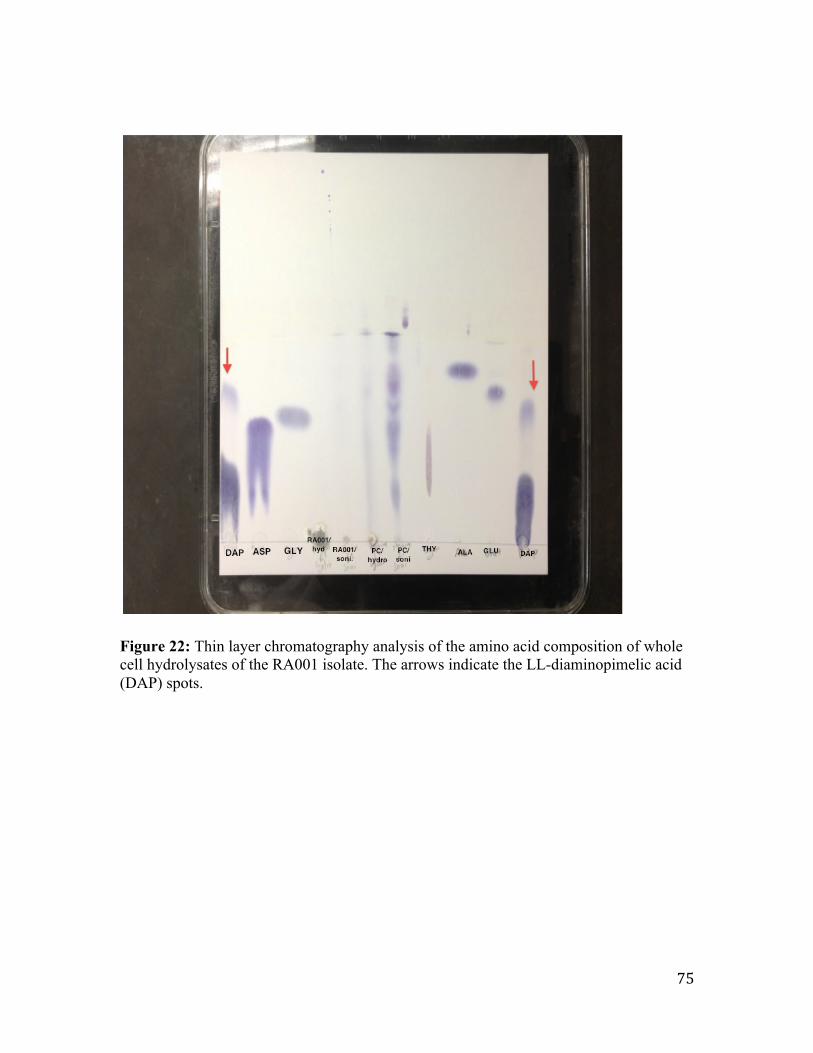
75
Figure 22: Thin layer chromatography analysis of the amino acid composition of whole cell hydrolysates of the RA001 isolate. The arrows indicate the LL-diaminopimelic acid (DAP) spots.
76
3.4.2 Production of pigments by the isolates
Pigments can be found in various natural sources including fruits, vegetables,
seed roots and microbes. Pigments extracted from microbes are called “biocolors”
because of their biological source, and many have been proven to be safe for human use
(Goswami et al., 2010). It was particularly noteworthy that PM58B-RA and RA003
produced a white pigment, while RA001 and RA004 produced a pink pigment after about
5 days of culture at 25˚C in R2A medium. However, PM58B-RA and RA003 isolates
produced white pigments at 12 and 25˚C; the pink pigment was only observed after 14
days of fermentation days.
3.4.3 Molecular identification of the four antimicrobial cave isolates by 16S rRNA gene sequencing
The taxonomy of the four antimicrobial-producing isolates was determined by
16S rRNA gene sequencing. The results revealed that all four isolates are non-
streptomycete bacteria. Specifically, the RA003 isolate belongs to the
Sphingomonadaceae family, RA001 and RA004 belong to the Arthrobacteria agilis
species, and PM58B-RA belongs to the species Bacillus licheniformis. All four isolates
shared 99% similarity to their most closely-related ribosomal RNA sequences in the
Genbank database (Table 11; see sequences in the Appendix C).
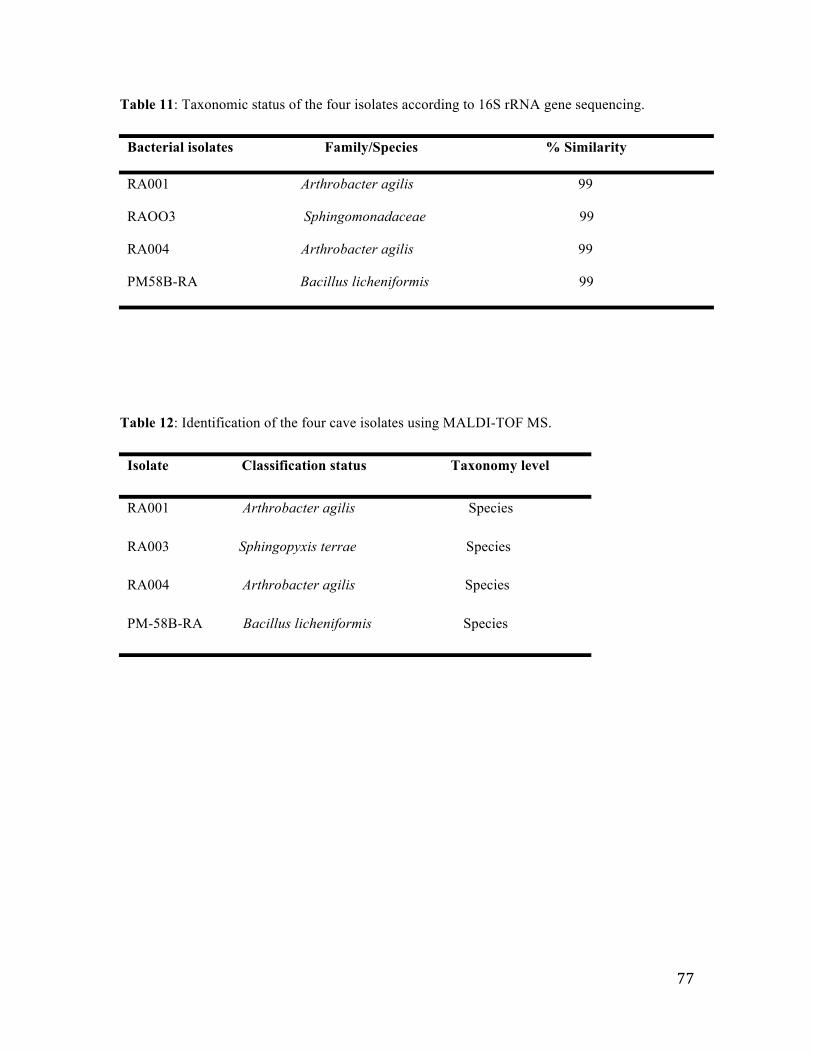
77
Table 11: Taxonomic status of the four isolates according to 16S rRNA gene sequencing.
Bacterial isolates Family/Species % Similarity
RA001 Arthrobacter agilis 99
RAOO3 Sphingomonadaceae 99
RA004 Arthrobacter agilis 99
PM58B-RA Bacillus licheniformis 99
Table 12: Identification of the four cave isolates using MALDI-TOF MS.
Isolate Classification status Taxonomy level
RA001 Arthrobacter agilis Species
RA003 Sphingopyxis terrae Species
RA004 Arthrobacter agilis Species
PM-58B-RA Bacillus licheniformis Species
78
3.4.4 Identification of the four antimicrobial cave isolates by MALDI-TOF MS
MALDI-TOF mass spectrometry was used to further confirm the identity of the
RA001, RA003, RA004 and PM58B-RA isolates. Two methods were used to prepare the
isolates for analysis: formic acid extraction and the direct spotting method, and the
spectra of the isolates were compared to MALDI-TOF mass spectrometry protein or
peptide profiles in the Biotyper 2.0 database.
None of the isolates could be identified using the direct spotting method, and
culture on R2A agar media combined with formic acid extraction led to higher
identification scores for the isolates than culture in R2A broth combined with formic acid
extraction (see Figures 21, 22, 23 and 24). There were differences in result
interpretations, for example, the direct spotting method showed inconsistent results which
may due to contamination while the results with formic acid extraction was more
sensitive which showed consistent results.
The mass spectra of the four cave isolates were compared to the MALDI-TOF
mass spectra database ((see Figures 21, 22, 23 and 24).). The RA003 isolate obtained the
highest identification score, indicating that RA003 can most likely be confirmed as
Sphingopyxis terrae DSM 12444T HAM (Appendix D 1-1, 1-2). For the PM58B-RA,
RA001 and RA004 isolates, MALDI-TOF MS helped to confirm their identity in
combination with the 16S rRNA gene sequencing analysis; RA001 and RA004 was
confirmed to belong to the species Arthrobacteria agilis and PM58B-RA was confirmed
to belong to the species Bacillus licheniformis. However, a low identification score was
obtained for RA003 using MALDI-TOF MS (data not shown).
The identification of the RA001, RA003, RA004 and PM58B-RA isolates is
summarized in Table 11. MALDI-TOF MS was found to be a complementary technique
for identification of the isolates in conjunction with 16S rRNA sequence analysis. Using
this combination of techniques, the RA003 isolate was identified to the species level and
PM58B-RA, RA001 and RA004 were identified to the genus level. Thus, MALDI-TOF
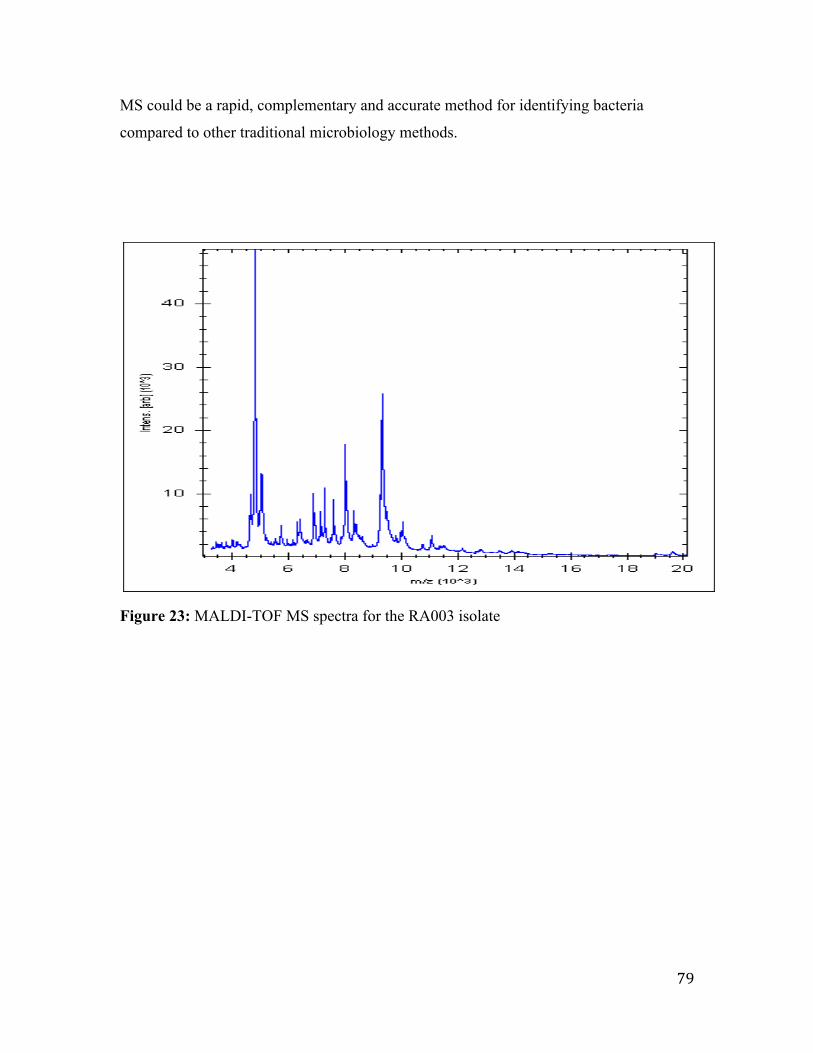
79
MS could be a rapid, complementary and accurate method for identifying bacteria
compared to other traditional microbiology methods.
Figure 23: MALDI-TOF MS spectra for the RA003 isolate
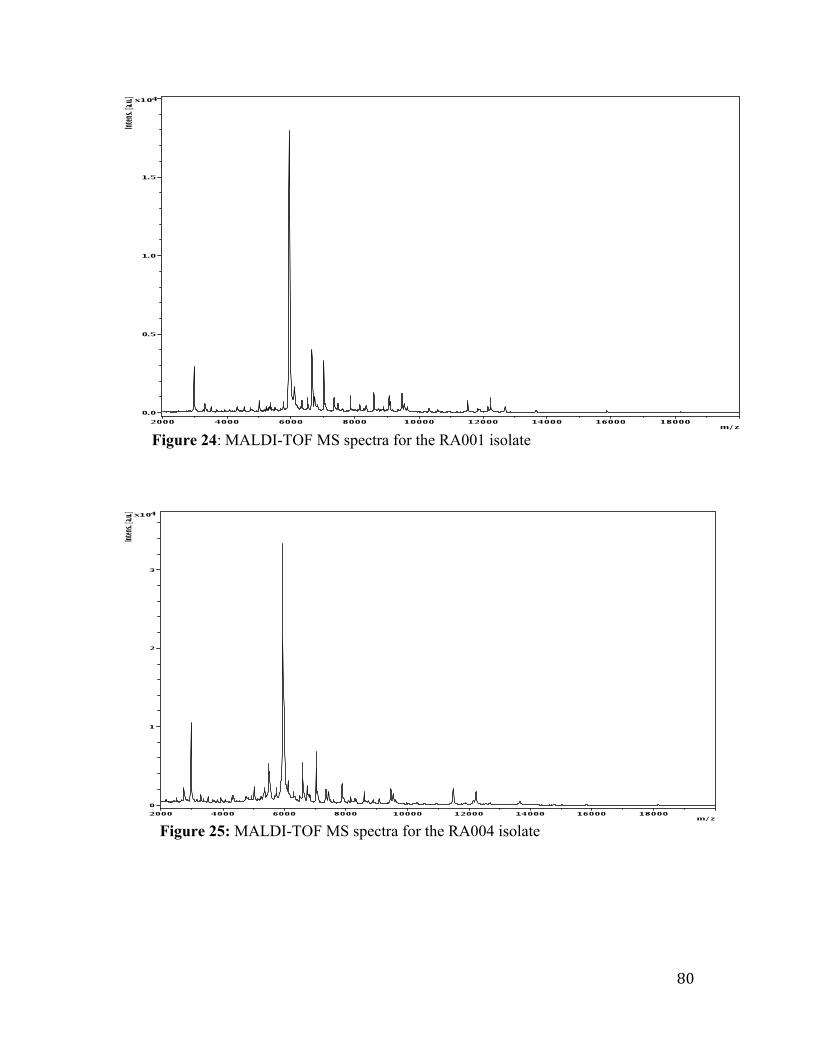
80
Figure 24: MALDI-TOF MS spectra for the RA001 isolate
Figure 25: MALDI-TOF MS spectra for the RA004 isolate
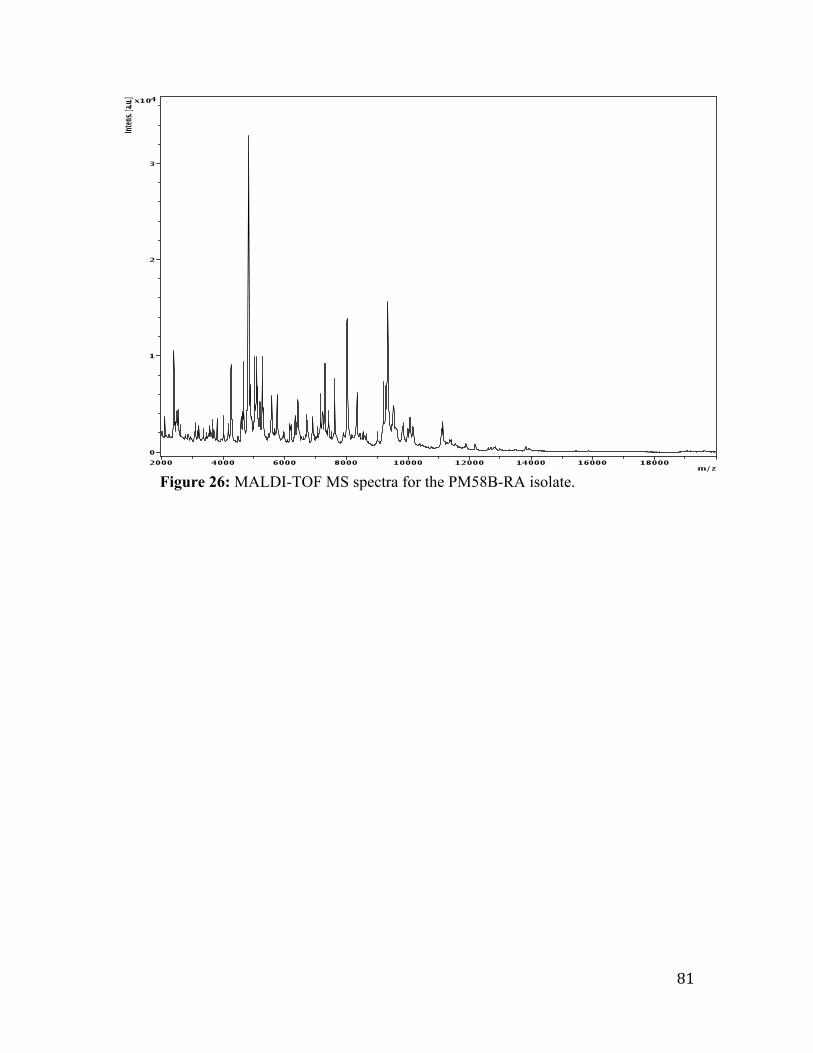
81
Figure 26: MALDI-TOF MS spectra for the PM58B-RA isolate.
82
3.5 Extraction and purification of the bioactive antimicrobial compounds produced by the four isolates
Dry mycelia from RA001 (260 mg), RA003 (470 mg), RA004 (450 mg) and
PM58B-RA (460 mg) were extracted twice with MeOH (25.0 mL x 2), and the combined
MeOH extracts for each isolate were dried under reduced pressure yielding MeOH
extracts (PM58B-RA, 50.0 mg; RA003, 20.0 mg; RA004, 90.0 mg; RA001, 120 mg).
The MeOH extracts were further fractionated by solid phase extraction using Discovery
DIC-18 cartilages and elution with a H2O/MeOH/EtOAc gradient into several fractions
(see Appendix B). The fractions from each isolate were subjected to antimicrobial
activity assays against tested microorganisms which they previously demonstrated
antimicrobial activity: M. smegmatis and M. luteus for PM58B-RA, M. luteus for RA001,
A. baumannii for RA004, and MDR-MRSA and M. luteus for RA003.
The 1H NMR spectra of all of the fractions from the RA001, RA003, RA004 and
PM58B-RA isolates were recorded; none of the fractions were found to be pure.
Unfortunately, none of the fractions demonstrated antimicrobial activity against any of
the tested microorganisms tested, except for fraction 2 from isolate RA003 (RA003E0102).
This active fraction inhibited the growth of MDR-MRSA (by 12.38 mm) and was
subjected to further analysis to identify the active compound (Figure 23).
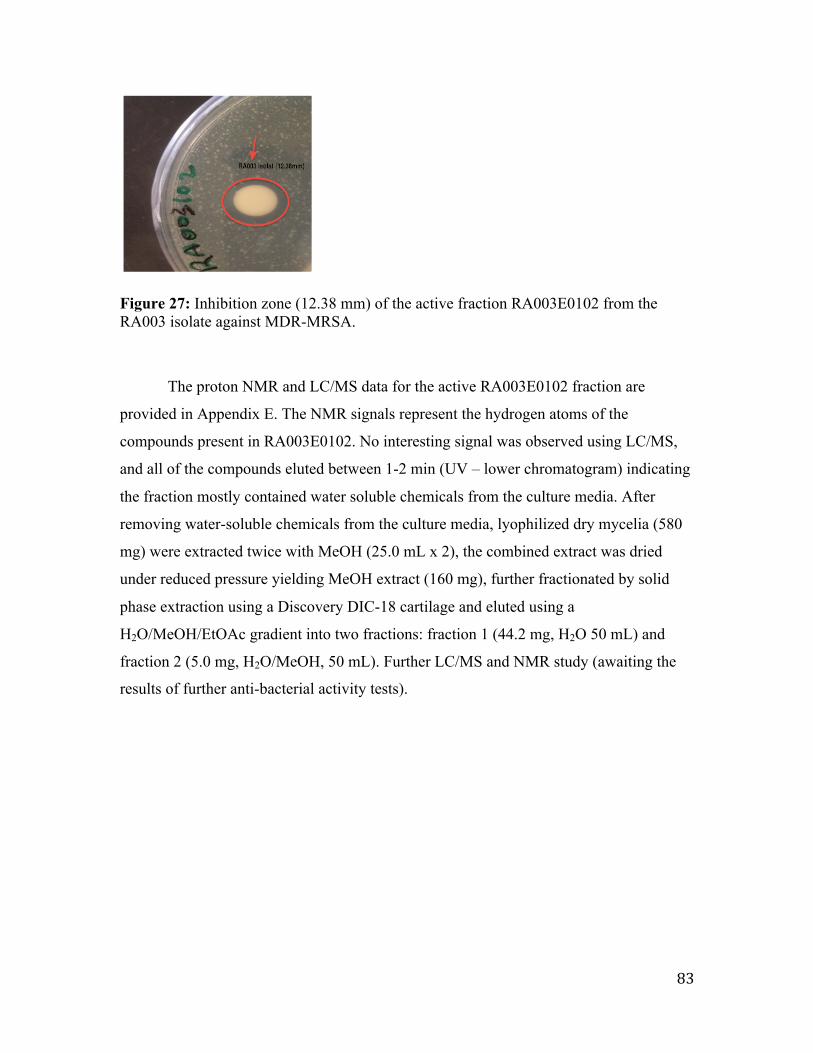
83
Figure 27: Inhibition zone (12.38 mm) of the active fraction RA003E0102 from the RA003 isolate against MDR-MRSA.
The proton NMR and LC/MS data for the active RA003E0102 fraction are
provided in Appendix E. The NMR signals represent the hydrogen atoms of the
compounds present in RA003E0102. No interesting signal was observed using LC/MS,
and all of the compounds eluted between 1-2 min (UV – lower chromatogram) indicating
the fraction mostly contained water soluble chemicals from the culture media. After
removing water-soluble chemicals from the culture media, lyophilized dry mycelia (580
mg) were extracted twice with MeOH (25.0 mL x 2), the combined extract was dried
under reduced pressure yielding MeOH extract (160 mg), further fractionated by solid
phase extraction using a Discovery DIC-18 cartilage and eluted using a
H2O/MeOH/EtOAc gradient into two fractions: fraction 1 (44.2 mg, H2O 50 mL) and
fraction 2 (5.0 mg, H2O/MeOH, 50 mL). Further LC/MS and NMR study (awaiting the
results of further anti-bacterial activity tests).
84
4.0 Discussion
4.1 Sample collection and initial selection
The objective of this study was to isolate cave bacteria from a volcanic cave in
Wells Gray Provincial Park, BC, and to determine if they produce metabolites with
antimicrobial activity against various microorganisms including multi-drug resistant
pathogens. The present study demonstrated that cave bacteria are promising sources of
antimicrobial compounds. This finding is supported by Kay et al. (2013), Cheeptham et
al., (2013) who previously showed that cave bacteria isolated from the Helmcken Falls
cave, BC, possessed significant antimicrobial activity against Gram positive and negative
bacteria. Of the total of 317 microorganisms isolated, 16 bacterial isolates were
identified based on their growth features and selected for further antimicrobial activity
assays on the basis of their viability and antimicrobial activity in initial screening tests.
4.2 Antimicrobial activity of the 16 bacterial isolates in different media
Sixteen isolates were cultured separately in four different fermentation broths
(Hickey Tresner, R2A, ISP#2, V-8 juice), and the antimicrobial activity of the isolates
was examined using the disc-diffusion (Kirby-Bauer) method. These 16 isolates were
also grown in the same fermentation broth that had been diluted ten-fold in order to
replicate the environmental conditions of the cave. Caves are considered to be an
oligotrophic environment with low amounts of nutrients available, in which the
organisms such as cave bacteria grow slowly (Gabriel and Northup, 2013).
Therefore, diluted media have been shown to be appropriate for bacteria that are
adapted to an oligotrophic environment (Vartoukian et al., 2010). When incubated in the
diluted broths, none of 16 isolates demonstrated the ability to inhibit or kill any of the
seven microorganisms (Mycobacterium smegmatis, Micrococcus luteus, MDR-MRSA,
Acinetobacter baumannii, ESBL E. coli, Candida albicans), even though some of the
85
isolates demonstrated antimicrobial activity when cultured in the undiluted fermentation
broths. This result may be explained by the fact that the production of antimicrobial
compounds can be influenced by the concentrations of the carbon, nitrogen and
phosphorus available (Yegneswaran et al., 1988; El-Refai et al., 2011).
The four media contain different concentrations of nutrients; however, ten-fold
dilution may have decreased the concentration of the nutrients to a level lower than that
required for the production of antimicrobial secondary metabolites. The nutrients in the
media enable microbes to gain energy, build cellular structures and grow. In general,
variations in the nutrient concentrations of the culture media, including carbon, nitrogen,
ammonia and phosphate, can prevent or enhance the production of antibiotics by
microorganisms (EL-Refai et al., 2011).
The presence of the optimum carbon and nitrogen sources are also important for
their antimicrobial activity (Northup at el., 2011). The glucose concentration of the
culture media also affects antibiotic production (Himabindu and Jetty, 2006; Awais et al.,
2007; Muhammad et al., 2009; Usta and Demirkan, 2013). Hasan et al. (2009) reported
that maximum zones of inhibition (32 mm and 24 mm) were produced by B. pumilus
against M. luteus and S. aureus when cultured in media containing 3% glucose. Awais et
al. (2007) and Muhammad et al. (2009) found that B. pumilus produced the maximum
zone of inhibition (26 mm) against M. luteus in 5% glucose, and B. subtilis produced a
maximum zone of inhibition (19 mm) in 1% or 5% glucose. Awais et al. (2007)
demonstrated that the antimicrobial activity of B. pumilus against M. luteus increased
with the glucose concentration, with 2% glucose the optimal concentration. Haavik
(1974) reported that high concentrations of carbon decreased or inhibited the enzymatic
synthesis of a polypeptide antibiotic by Bacillus licheniformis. The results of Haavik
(1974) support our findings, as the maximum inhibition zones were obtained when the
isolates were cultured in R2A broth, which contains 0.05% glucose and 0.05% wt/vol
soluble starch. R2A broth was also best for the growth of the PM58B-RA, RA001,
RA004 and RA003 isolates. R2A broth contains lower concentrations of carbon than
other broths such as HT, ISP#2 and V-8 juice. However, these isolates did not show any
antibiotic activity when grown in ten-fold diluted R2A broth, possibly due to the very low
86
concentration of carbon and nitrogen sources in this media. Therefore, bacteria can not
gain energy, build their cell structure or grow in diluted media. Another possibility is that
these 16 isolates may need more than 14 days incubation in diluted media to adapt to
diluted media.
In this study, the lowest rates of antimicrobial activity were observed in ISP#2
and V-8 juice. On the contrary, Cheeptham et al. (2013) cultured cave actinomycetes in
ISP#2, V-8 juice and HT broths (within 1% variation for each chemical), and found
ISP#2 and V-8 juice were the best broths for the production of secondary metabolites by
actinomycetes. However, HT led to half the antimicrobial activity of ISP#2 and V-8
juice. Kay et al. (2012) found that strain E9, which was also isolated from the Helmcken
Falls cave, showed significant antimicrobial activity against P. larvae when grown in V-8
juice. Badji et al. (2006) found that ISP#2 was the best media for the antifungal and
antibacterial activity of actinomycetes isolated from soil. ISP#2 and V-8 juice contain
higher concentrations of glucose and nitrogen compared to R2A and HT. For example,
ISP#2 contains glucose (0.4% wt/vol) and yeast extract (0.7% wt/vol) as a nitrogen
source. V-8 juice contains D-glucose (1.4% wt/vol) and D-fructose (1.4% wt/vol), but
contains a lower concentration (0.07%) of nitrogen from organic and inorganic sources
(Cheeptham et al., 2013); V-8 juice also contains yeast extract (0.01%) as a source of
nitrogen. However, Haavik (1974) supported the use of low concentrations of carbon as
high concentrations of carbon decreased or inhibited the enzymatic synthesis of a
polypeptide antibiotic. However, in the present study, some of the 16 isolates were
identified as non–actinomycetes, in contrast to the studies of Cheeptham et al. (2013) and
Kay et al. (2012) in which all isolates were identified as actinomycetes. Cheeptham et al.
(2013) reported that actinomycetes produce secondary metabolites under less than ideal
conditions.
HT media contains dextrin (1% wt/vol) as a carbon source and led to higher
antibiotic production than ISP#2 and V-8 juice in this study. Awais et al. (2007) and
Muhammad et al. (2009) found that B. subtilis produced a maximum zone of inhibition
(19 mm) in 1% glucose. In the present study, a maximum zone of inhibition (18 mm)
against M. luteus was found with HT broth, which contains a lower concentration of
glucose than ISP#2 and V-8 juice. Ten-fold dilution decreased the concentrations of
87
carbon and nitrogen in ISP#2 and V-8 juice and inhibited the antimicrobial activity of the
16 isolates.
Another possible explanation for our results could be that ISP2# and V-8 juice are
too rich for the cave isolates. Northup et al. (2011) reported that cave microorganisms
often survive in very low nutrient concentrations and may not be able to live in rich
media. This supports our results that ISP2# and V-8 juice broths may not sufficiently
replicate the actual environment for growth of most of the 16 isolates, except for the
RA003 and PM184 isolate which demonstrated antimicrobial activity in ISP#2 broth.
Seven of these isolates (NC18, PM184, PM58B-RA, PMA1A3, RA003, RA001
and RA004; Table 2), inhibited or killed some of the selected microorganisms
(Mycobacterium smegmatis, Micrococcus luteus, MDR-MRSA, Acinetobacter
baumannii, and Candida albicans) when they grew in non-diluted broth. However, they
did not show growth and antimicrobial activity in diluted version of the different broths
used in the primary screening. Vartoukian et al. (2010) and Giraffa and Neviani (2001)
reported that when viable cells are exposed to stresses such as low pH, low temperature
and limited nutrients, the cells may shift to a state in which they remain viable but non-
cultivable (VBNC) (Vartoukian et al., 2010). In addition, the low nutrient conditions in
our study could cause a stress on the cave isolates, replicating the process known as
selective pressure (Gabriel & Northup, 2013). A poor medium that contains limited
nutrients may stimulate the cells to become resistant instead of undergoing slow growth
(Cheeptham, 2013). In addition, VBNC isolates have specific growth requirements, such
as specific nutrients, pH conditions, incubation temperatures or oxygen levels (Cladera et
al., 2004; Vartoukian et al., 2010). This may explain the fact that the seven isolates
showed antimicrobial activity in R2A and HT broth, but may have shifted to VBNC when
cultured in diluted or non-diluted ISP#2 and V-8 juice.
88
4.3 Selection of best media for further antimicrobial activity assays
Different media have been examined for culture of the cave and soil community
(Rule, 2013; Cheeptham, 2013; Ababutain et al., 2013). However, it is well recognized
that only a small proportion of bacteria can be cultured in vitro (Davis, 2005; Vartoukian,
2010). Molecular ecological techniques have revealed the presence of a wide variety of
novel microbes in cave and soil communities, demonstrating our inability to culture and
study soil bacteria. This problem limits our understanding of the variety of species in soil
communities (Dayal et al., 2013; Hugenholtz et al., 1998). Therefore, in this study, we
attempted to improve the fermentation process for cave microorganisms by using non-
traditional media.
Many studies have demonstrated the effects of different media on fermentation
and antibiotic production by microbes (Dayal et al., 2013; Al-Judaibi, 2011). In the
current study, the composition of the fermentation broth was found to enhance
antimicrobial production. This was confirmed by the fact that PM58B-RA, RA001,
RA004, RA003, NC18, 46A, A1A3 and 245 produced the maximum inhibition zones
when grown in R2A (6/16 isolates demonstrated antimicrobial activity), compared to
Hickey Tresner (5/16) and ISP#2 (2/16). However, the other nine isolates (Table 1) did
not demonstrate antimicrobial activity when grown in V-8 juice.
RA003 inhibited M. luteus (15.62 mm) when cultured in R2A broth, and inhibited
MDR-MRSA (13.45 mm) when cultured in HT broth. PM-58B-RA inhibited M. luteus
(18 mm) when cultured in HT broth, and inhibited M. smegmatis (16 mm) when cultured
in R2A broth. It is clear that the R2A and HT broths enabled these isolates to produce
antimicrobial compounds; however, these media have different nutrient compositions.
HT and R2A broths were prepared according to standard methods (within 1% for
each chemical; Appendix A). HT broth contains beef and yeast extract (0.1% wt/vol) as a
nitrogen source, CaCl2 (0.002% wt/vol) as a mineral source and dextrin (1% wt/vol) as a
carbohydrate source. Dextrin contains mixture of substances including glucose, lactose,
sucrose and cornstarch, which are all sources of carbon. However, R2A broth contains
yeast extract (0.05% wt/vol) and proteose peptone (0.05% wt/vol) as nitrogen sources,
89
Casamino Acids (0.05% wt/vol) as a source of amino acids, and glucose (0.05% wt/vol)
and soluble starch (0.05% wt/vol) as carbon sources. R2A broth also contains minerals
such as K2HPO4 (0.3% wt/vol) and MgSO4.7H2O (0.005% wt/vol), and sodium pyruvate
(0.3% wt/vol), which is a source of energy for dividing cells. R2A broth contains most of
the essential nutrients such as carbon, nitrogen and salts, while HT broth lacks some of
these minerals. Starch was previously found to be the most suitable sole carbon source
for optimum growth and antibiotic production, with peptone and NaNO3 the most
suitable sole nitrogen source for antibiotic production and optimum growth, respectively
(Ababutain et al., 2003). The maximum antibiotic production by Streptomyces sp. was
obtained in a medium that included soluble starch, peptone, K2HPO4, MgSO4.7H2O, KCl
and trace FeSO4.5H2O (Ababutain et al., 2003).
PM58B-RA (Bacillus licheniformis) and RA003 (Sphingopyxis terrae) preferred
R2A broth for the production of antimicrobial activity, while RA001 (Arthrobacter agilis)
and RA004 (Arthrobacter agilis) preferred R2A broth for pigment production. In
addition, PM58B-RA, RA001, RA004 and RA003 started growing after 5 days on R2A
plates while they only began to grow after 7 days on HT. R2A medium contains low
concentrations of carbon and nitrogen and higher levels of nutrients than HT, V-8 juice
and ISP#2. Cheeptham et al. (2013) identified a Helmcken Falls cave isolate that grew in
HT medium as Streptomyces microflavus. In addition, many studies have indicated the
advantages of R2A medium, especially for promoting the growth of bacteria and pigment
production (Reasoner and Geldreich, 1984). R2A medium contains a variety of minerals
such as K2HPO4 (0.3% wt/vol) and MgSO4.7H2O (0.005%) which are essential for
bacterial growth and antimicrobial activity (Ueda et al., 1997; Atta, 1999; Aman, 2001).
Ripa et al. (2009) and Mangamuri et al. (2014) stated that K2HPO4 and MgSO4.7H2O
enhanced antimicrobial production by Streptomyces sp. compared to HT medium, which
does not contain these minerals. Therefore, R2A medium was the best medium for the
antimicrobial activity and production of pigments by the isolates compared to HT, ISP#2
and V-8 juice. In the end, the PM58B-RA and RA003 isolates were selected for further
study due to their high antimicrobial activity, while RA001 and RA004 were selected as
they produced pink pigmentation in R2A medium in addition to their high and consistent
antimicrobial activity.
90
4.3.1 Production of pigments by the isolates
Reasoner and Geldreich (1984) reported that a long incubation time (up to 14
days) increased bacterial yield as well as pigment production on R2A medium. The
results of our study support the observations of RA001 and RA004 produced pink
pigmentation after 5 days of incubation, especially on agar plates rather than broth.
However, R2A medium was only suitable for the production of pigmentation by RA001
and RA004 at 25°C.
Young et al. (1985) reported that no parallelism existed between pigment
production and the production of antibiotics. However, a number of studies have reported
the effects of bacterial pigmentation on antimicrobial activity (Gauteier and Flatau, 1976;
Nakamura et al., 2003). Nakamura et al. (2003) studied the antibacterial activity of a
violet pigment produced by the psychrotrpic bacterium RT102 strain, and found that high
concentrations of the violet pigment led to growth inhibition or caused cell death of a
number of pathogens. In addition, pigmentation in microorganisms has recently been
suggested to be an indicator of the production of active compounds. For example,
Streptomyces are known produce different pigments such as red, blue and violet. These
colours are associated with compounds with antimicrobial, antiviral, antitumor,
antiprotozoal, antioxidant, anticancer and other activities (Ferreira et al., 2004; Matz et
al., 2004; Deorukhkar et al., 2007; Kim et al., 2010). Further experiments are necessary
to investigate the relationship between these cave bacterial pigmentation and the
production of bioactive compounds.
4.4 Study of fermentation conditions for the four selected isolates
The optimal fermentation conditions for various caves bacterial isolates have been
examined in a number of previous studies (Lueschow et al., 2013; Bhullar, 2011).
Different physiochemical conditions such as the growth media, seed inoculum volume,
91
pH, temperature and fermentation time were studied with the aim of enhancing the
antimicrobial activity of the cave isolates.
4.4.1 Temperature
Three of the four isolates selected for further analysis in this study (RA001,
RA004, RA003) produced maximum antimicrobial activity when incubated at 12°C and
are therefore adapted to the cold. Many other studies have provided similar results. Laiz
et al. (2003) studied different caves in Spain at different temperatures (5, 13, 20, 28 and
40°C), and reported that most cave microorganisms could grow at temperatures between
13-40°C; however, a low temperature (13°C) was optimal for the growth of a higher
diversity of species. Khizhnyak et al. (2011) isolated bacteria from water in a cave where
the air temperature varied from 0 to 5°C, and found that the bacteria could grow at a low
temperature (7°C) but not at a higher temperature (35°C); the bacteria altered their
morphology and subsequently died at the higher temperature.
However, PM58B-RA produced maximum antimicrobial activity at 25°C. This
result is in agreement with Rule and Cheeptham (2013), who reported that 100
actinomycete strains, which were collected from a volcanic cave, showed the highest
metabolite production when fermented at 25°C.
The actual temperature range in the Helmcken Falls cave is 7.5-12.2°C
(Cheeptham, 2012). The differences in the optimum temperatures for antimicrobial
activity may be due to variations in the precise habitats of the microorganisms in the
cave. This may be explained by that fact that the temperature also affected the growth of
the microorganisms. For example, RA001, RA004 and RA003 grew faster at lower
temperatures (Figure 12, 13, 14 and 15), leading to maximal antimicrobial activity (Table
7).
92
4.4.2 pH
Many studies have reported that various pH values are optimal for antimicrobial
production and growth by bacteria from a different habitat. Ababutain et al. (2013) found
that Streptomyces sp. demonstrated maximal production of antimicrobial agent in media
with an initial pH of 6.0. Three actinomycete isolates had a broader spectrum of
antibacterial activity and showed production of potential antibiotics under mildly alkaline
conditions at pH 7.2 (Arifuzzaman et al., 2010). Crawford et al. (1993) reported that the
highest growth of actinomycete strains occurred between pH 6.5-8; some strains could
not grow at pH 6.0, and pH 5.5 inhibited the growth of a large number of strains. On the
contrary, Höltzel et al. (1998) reported that pH 5.5 was optimal for the production of
antimicrobial compounds.
Previously, it was shown that the region of the cave from where the samples were
collected has a pH ranging from 6.42-8.38 (Cheeptham, 2013). Alkaline pH values
ranging from 7.8 to 8.6 were found to effectively promote the antimicrobial activity and
growth just for all the four isolates in the current study. In general, the pH changes during
the fermentation process. Variations in the antimicrobial activity of each isolate were
observed between pH 7.8 and 8.5, with pH values of 7.8, 8.3, 8.3 and 8.5 best for
PM58B-RA, RA001, RA004 and RA003, respectively. Our results indicate that, not
surprisingly, the bacteria have maximal antibiotic producing activity at the same pH as
their natural conditions.
4.4.3 Fermentation period
In the current study, the maximum production of antimicrobial agents and isolate
growth occurred between 3 to 11 days of a 14 day incubation period on R2A broth.
Figures 11, 12, 13, and 14 illustrate the effect of fermentation days on the antimicrobial
activity of the isolates. The maximum inhibition zones for the PM58B-RA isolate (15
mm and 11.5 mm) against M. luteus and M. smegmatis, respectively, were observed on
days 4 and 11, (Figure 11).
93
The maximum inhibition zone for the RA001 isolate (9.92 mm) against M. luteus
was observed on day 4 (Figure 12). The maximum inhibition zone for the RA004 isolate
(12.85 mm) against A. baumannii occurred on day 9. The maximum inhibition zone for
the RA003 isolate (19.17 and 17.19 mm) against M. luteus and MDR-MRSA was
observed on day 7. After these times, the antimicrobial activity of the four isolates
decreased. However, there were obvious variations in the antimicrobial activity of the
PM58B-RA, RA001, RA004 and RA003 isolates between days 4 and 11, as the inhibition
zones of these isolates varied over time. For example, the inhibition zone of the PM58B-
RA isolate against M. luteus was 9 mm on day 8, decreased to 7.93 mm on day 9 and then
increased to 8.87 mm on day 10; similar trends were also observed for RA001, RA004
and RA003.
The antimicrobial activity of the PM58B-RA, RA001, RA004 and RA003 isolates
was examined over a 14 day fermentation period. Reasoner and Geldreich (1985)
observed that a longer incubation time (up to 14 days) led to higher bacterial counts and
pigment production for slow-growing bacteria, especially in R2A media. However, 7-12
days were reported to be best in other studies.
For example, Kay et al. (2013) found that actinomycete strains isolated from the
Helmcken Falls cave displayed the maximal production of antimicrobial agents on day 4
of a 7-day incubation. On the contrary, Ripa et al. (2009) found that Streptomyces sp.
began producing bioactive metabolites after 7 days of incubation in Czapek-Dox
(alkaline) broth; however, maximal production occurred after 10 days and slowly
decreased thereafter. El-Refai et al. (2011) found that maximal growth and antibiotic
production by Nocardioides luteus were observed up to 12 days of incubation in five
different media: starch casein medium, arginine glycerol salts medium, starch nitrate
medium, M3 medium and ISP medium. Rule and Cheeptham (2013) reported that 100
actinomycete strains, which were collected from the Helmcken Falls cave, showed
highest metabolite production when incubated in Hickey Tresner (HT) at 25°C for 7 to 10
days.
Cave microorganisms are usually slow-growing (Vartouukian et al., 2010), so
they may require more time to grow in vitro. This supports the low PCV (%) values
94
obtained in this study for all four isolates compared to other studies. For example, Kay et
al. (2012) found that strain E9, isolated from the Helmcken Falls cave, showed high PCV
(%) values ranging from 0.5 to 2.5%. In this study, the maximal PCV (%) values for
PM58B-RA, RA001, RA004 and RA003 were 0.12, 0.22, 0.08 and 0.07%, respectively.
Even though these isolates showed low PCV (%), they demonstrated effective
antimicrobial activity, especially, the RA003 isolate against MDR-MRSA.
This indicates that the ability to produce antibiotics is not fixed for microbes;
some isolates were capable of producing antimicrobial agents after only a short duration
of culture (8 days for RA004) whereas others kept producing antimicrobial agents up to
11 days of culture (RA003). As shown in Figures 8, 9, 10 and 11, alternating patterns of
antibiotic activity were observed over time for the PM58B-RA, RA001, RA004 and
RA003 isolates, which indicates that antibiotic production may increase or decrease with
time without stabilizing. This may be due to alterations in the metabolic activity of the
bacteria during growth in the stationary phase (Bibb, 2005).
4.4.4 Inoculation volume
Previous studies reported that smaller inoculum sizes resulted in higher viable cell
counts (Casida, 1969; James and Sutherland, 1940). In our study, the 2% seed inoculum
volumes led to higher rates of growth and antimicrobial activities than 1% seed inoculum
volumes for all four isolates (Figures 8, 9, 10 and 11). The results of the present study
show that when the volume of inoculum increased, the production of secondary
metabolites and bacteria growth increased. This result is supported by Carraturo et al.
(2014), who observed a positive linear correlation between the volume of inoculum and
the size of the inhibition zone when studying the effect of serial dilations of phenolic
compounds derived from the fleshy seed coat of Ginkgo biloba in different volumes of
inoculum against different bacteria.
The results of present study are in agreement with Grag and Neelakantan (1981) and
Hassan et al. (2001), which demonstrated that the size of the inoculum was an important
95
factor in bacterial fermentation processes. Use of 2% inoculum may decrease the time in
the lag phase, during which time the bacterial cells need to adapt to the growing
environment. Therefore, increasing the inoculum size will allow the cells to enter the
exponential phase or stationary phase more rapidly. Further experiments could be
performed using a variety of inoculum volumes, such as 0.5%, 2% and 5%, to investigate
this suggestion. In our study, it appeared that the active compounds from the cave
bacteria were produced at the earlier stages of fermentation when using 2% inoculum;
this may be due to the rapid growth associated with a reduced lag phase. In contrast to
this study, antibacterial production was directly proportional to inoculum size for
Streptomyces griseus (Nader, 2009), and increase in cell number lead to higher
production of antibacterial compounds by Streptomyces clavuligerus and Aspergillus
nigar (Demain and Jermini, 1989; Berovic and Loger, 1993).
4.5 Classification and identification of the cave isolates
Classification and identification of the four isolates were based on their
morphology, 16S rRNA gene sequencing and MALDI-TOF MS. A chemotaxonomic
method was also employed to identify the amino acids of the four isolates; however,
RA001, RA003, RA004 and PM58B-RA were difficult to classify using thin layer
chromatography. LL-diaminopimelic acid, a vital part of S. griseus peptidoglycan, can be
used to determine the similarities to other bacteria; however, none of the isolates
exhibited separated spots of the whole cell hydrolsates or sonicated cell samples (Figures
17, 18, 19 and 20). As a result, the morphological and chemotaxonomic analysis
demonstrated that the four isolates were not actinomycetes; they could be typical bacteria
or new species. RA001, RA004 and PM58B-RA isolate are gram positive bacteria and
have a thick peptidoglycan layer whereas RA003 is a gram negative bacteria. TLC may
be an important method for determining the cell wall structure of these isolates but this
method was not accurate and was time consuming; however, TLC may be used
successfully in combination with other analytical methods such as electrophoresis or ion-
exchange chromatography (Grushka and Grinberg, 2009).
96
The resolution of the isolate spots may be affected by humidity and temperature
in the lab as this technique is an open procedure (Fair and Komos, 2008). The silica gel
plate may be affected by the high humidity in the lab which could lead to pricking of the
surface of the gel, even though the silica was covered with a clean plastic plate to avoid
the effects of high humidity (Fair and Komos, 2008). For example, this technique should
be performed at less than 60% relative humidity; however, the atmosphere of Kamloops
reaches 66% relative humidity. The RA003, RA004 and PM58B-RA spots also streaked
and did not separate into single spots, possibly due to the use of highly concentrated
samples. On the contrary, the RA001 spot was not visible, possibly due to the low
concentration of the sample for this isolate. In future experiments, dilution of the isolate
solutions may help the substances to move and separate, and solve this problem (Fair and
Komos, 2008). Classification using TLC is based on some chemical properties of
bacterial cell walls; in this case, we used a limited TLC protocol that will reveal cell wall
components specific to steptomycete and actinomycete bacteria. This may be a reason
why this specific TLC is not a good technique for classifying isolated cave
microorganisms other than actinomycetes.
In previous studies, genus Arthrobacter agilis and Bacillus licheniformis were
found in the Cave of Bats in Zuheros, Spain, where the average temperature ranges
between 8 to 14°C (Leo et al., 2012). Kampfer et al. (2002) found Sphingopyxis terrae in
a wastewater treatment plant. Cheeptham et al. (2013) suggest that the communities of
microorganisms in each cave are unique; however, researchers have attempted to find
common features shared by the bacterial communities of many caves. Northup et al.
(2011) suggested that caves could be a rich source of microbial phyla such as
ctinobacteria, acidobacteria, and proteobacteria. Microorganisms from the same phyla are
frequently discovered in different caves. Cheeptham et al. (2013) and Northup et al.
(2011) suggested that a combination of culture-dependent and molecular based
approaches should be employed to better understand the bacterial community of caves. It
is clear that the presence of certain types of microbes is not limited in to certain types of
cave, and it is possible that the isolates in this study could also be found in other caves
throughout the world.
97
MALDI-TOF MS confirmed the identification of isolates obtained using 16S
rRNA gene sequencing, demonstrating that that MALDI-TOF MS is a useful
complementary technique for bacterial identification. For example, RA003 was identified
at the genus level by 16S rRNA gene sequencing; however, RA003 was identified to the
species level with MALDI-TOF MS.
In this study, MALDI-TOF MS proved to be a rapid technique for identification
of the four isolates. The preparation of samples from the four isolates for MALDI-TOF
MS using direct transfer and by formic acid method was generally complete within one
hour. In contrast, 16S rRNA gene sequencing sample preparation usually takes several
hours to one day. The 16S rRNA gene sequencing in this study was performed by the
Biotyper 2.0 database in Seoul, Korea and it took more than two weeks to obtain the
results. However one major drawback of MALDI-TOF MS is that the certainty level in
the identification is lower than that of 16S rRNA sequencing. Another drawback is the
lack of reference spectra for environmental isolates in the database; therefore, 16S rRNA
was found to be more reliable for the identification of bacterial species.
In conclusion, use of a combination of molecular and software techniques to
identify bacteria may lead to more reliable results. This study indicates that MALDI-TOF
MS may be a useful tool for bacterial identification, especially for bacteria isolated from
cave habitats. In addition, MALDI-TOF MS is a rapid method for identifying
microorganisms grown on agar media (but not necessarily liquid media).
4.6 Assay of the antimicrobial activity of the isolates against each other
To survive in such environments, bacteria may produce antimicrobial compounds
that inhibit the growth of other microorganisms, which enables them to survive and thrive
in such a extreme habitat in a cooperative manner. The antimicrobial activity of the four
isolates against the other three isolates was tested using the paper disc diffusion assay and
cross-streak assay.
98
The aim of this study was to determine how cave isolates communicate through
their metabolites and to preliminarily screen bacterial cave isolates to see if they
produced known or novel compounds. Different methods can be employed to detect
antimicrobial activity, such as diffusion methods through solid or semi-solid media
(Lertcanawanichakul and Sawangnop, 2008). The cross-streak assay technique is a
simple and rapid method for screening and searching for new antimicrobial compounds
(Pereira and Kamat, 2011).
Montano and Henderson, (2013) reported that the cross-streak assay method was
used to examine the antimicrobial activity of cave isolates against various tested
microorganisms. The cave isolates were streaked in single vertical lines onto HT agar and
R2A agar plates and incubated at 25˚C for 48 h, in order to obtain a thin line of growth.
Subsequently, another layer of R2A and HT medium was added over the first layer of the
medium on the original R2A and HT plates, and the media were solidified. Then, each
cave isolate was horizontally inoculated onto its vertical streak, the plates were incubated
at 25˚C for 48 h and the zones of inhibition were evaluated. In this study, several
problems occurred with the cross plate assay. Firstly, the bacteria grew in swirl
formations on the second layer of agar, making it difficult to obtain a conclusive result.
Changing the incubation time may help to overcome this issue, as cave bacteria are
generally slow growing and the cross-streak assay requires a short incubation time
(personal communication with Elizabeth Montano). Secondly, it was found that the
thickness of second layer was crucial for accurately assaying antibacterial activity by agar
diffusion. Studies have demonstrated that it is difficult to obtain quantitative data using
the cross streak assay, as it produces fuzzy and unclear inhibition zones (Pereira and
Kamat, 2011). Pereira and Kamat (2011) used a ‘modified cross streak method’ to
quantitatively evaluate the effect of actinobacterial isolates against a number of
pathogens. In the present study, the paper disc diffusion assay was more sensitive for
assaying the antimicrobial activity of the isolates against each other than the cross-streak
assay. In the paper disc diffusion assay, the PM58B-RA isolate inhibited the RA001,
RA003 and RA004 isolates (Table 9).
99
Table 9 shows the inhibition zones for each of the four isolates against one
another and also against Streptomyces griseus, which was used as our positive control
standard (this isolate was purchased from the ATCC). PM58B-RA killed RA001, RA003
RA004 and Streptomyces griseus, suggesting that RA001, RA003 and RA004 had not
been exposed to PM58B-RA and Streptomyces griseus before, so RA001, RA003 and
RA004 may not possess any possible protection mechanisms against the active
compounds that PM58B-RA produces. However, RA001, RA003 and RA004 did not
inhibit the growth of PM58B-RA and Streptomyces griseus, suggesting these isolates
may have been exposed to each other in the cave habitat and developed some protection
mechanisms that prevent them from being rid of by these strains. These possible
protection mechanisms must have been developed overtime and may lead to possessing
of antibiotic resistant genes in those bacteria. This observation is in agreement with
Forsberg and colleagues (2012) who described natural environments as reservoirs of
antibiotic-resistant genes in which the genes can be transferred between soil bacteria and
clinical pathogens. However, in the cave, where the microorganisms used for the
screening in this study are not present, the antibiotic-resistant genes may only be
transferred between the soil bacteria present in the cave, enabling them to become
resistant to each other.
100
References Ababutain, I., Aziz, Z., and AL-Meshhen, N. 2013. Optimization of environmental and nutritional conditions to improve growth and antibiotic productions by Streptomyces Sp. Isolated from Saudi Arabia Soil. Int. Res. J. Microbiol. 4 (8):179–87
Al-Judaibi, A. 2011. Effect of some fermentation parameters on ethanol production from beet molasses by Saccharomyces Cerevisiae CAIM13. American Journal of Agricultural and Biological Sciences 6 (2):301–306.
Aman, GZ. 2001. Studies on some actinomycete isolates from certain desert soil samples. Al-Azhar University.
Amann, RI, Ludwig, W, Schleifer, KH. 1995. Phylogenetic identification and in situ detection of individual microbial cells without cultivation. Microbiol. Rev. 59 (1):143–69.
Arifuzzaman, M, Hhatun, MR, Rahman, H. 2010. Isolation and screening of actinomycetes from sundarbans soil for antibacterial activity. Afr. J. Biotechnol. 9 (29):4615–19.
Awais, M, Shah, A A, Hameed, A, Hasan, F. 2007. Isolation, identification and optimization of bacitracin produced by Bacillus sp. Pak. J. Bot. 39 (4):1303–1312
Badji B, Zitouni A, Mathieu F, Lebrihi A, Sabaou N. 2006. Antimicrobial compounds produced by Actinomadura sp. AC104 isolated from an Algerian Saharan soil. Can. J. Microbiol. 52 (4):373–382.
Bajpai R K, Reuss M. 1981. Evaluation of feeding strategies in carbon-regulated secondary metabolite production through mathematical modeling. Biotechnol. Bioeng. 23 (4):717–738.
Baker V R, Strom R G, Gulick V C, Kargel J S, Komatsu G, Kale V S. 1991. Ancient oceans, ice sheets and the hydrological cycle on Mars. Nature 352, 589–594.
Baldo, B A. 1999. Penicillins and cephalosporins as allergens-structural aspects of recognition and cross-reactions. Clin. Exp. Allergy 29 (4):744–749.
Baquero F, Martínez J, Cantón R. 2008. Antibiotics and antibiotic resistance in water environments. Curr. Opin. Biotechnol. 19(3):260–265.
Barlow M, Hall B G. 2002. Phylogenetic analysis shows that the OXA b-lactamase genes have been on plasmids for millions of years. J. Mol. Evol. 55 (4): 314–321.
Barto H, Jurado V. 2007. What’s up down there? Microbial diversity in caves.
Bauer R, Dicks L M T. 2005. Mode of action of lipid II-targeting lantibiotics. Int. J. Food Microbiol. 101 (2): 201–216.
Beaty DW, Clifford SM, Borg LE, Catling DC, Craddock, RA, Des Marais DJ, Farmer, JD, Frey HV, Haberle, RM, McKay CP, et al. 2005. Key science questions from the second conference on early Mars: geologic, hydrologic, and climatic evolution and the implications for life. Astrobiology 5 (6): 663–689.
101
Bennett PM. 2008. Plasmid encoded antibiotic resistance: acquisition and transfer of antibiotic resistance genes in bacteria. Br. J. Pharmacol. 153 (Suppl 1): S347–S357.
Bergogne-Berezin E, Towner KJ. 1996. Acinetobacter spp. as nosocomial pathogens: microbiological, clinical, and epidemiological features. Clin. Microbiol. Rev. 9 (2): 148–165.
Berovic M, Loger -derenin M. 1993. Solid state fermentation of pectinolitic enzyames by aspergillus nigar. J. Chem. Tech Biotchnol 58, 209–211.
Bhullar K. 2011. Investigation of antibiotic resistance in isolated Lechuguila caves strains. M.Sc. thesis. Department of biochemistry, McMasters University.
Bibb MJ. 2005. Regulation of secondary metabolism in streptomycetes. Curr. Opin. Microbiol. 8 (2): 208–215.
Van den Bogaard AE, Stobberingh EE. 2000. Epidemiology of resistance to antibiotics: Links between animals and humans. Int. J. Antimicrob. Agents 14(4): 327–335.
Bollela VR, Sato DN, Fonseca B. a. L. 1999. McFarland nephelometer as a simple method to estimate the sensitivity of the polymerase chain reaction using Mycobacterium tuberculosis as a research tool. Braz. J. Med. Biol. Res. 32 (9):1073–1076.
Bonomo RA, Szabo D. 2006. Mechanisms of multidrug resistance in acinetobacter species and Pseudomonas aeruginosa. Clin. Infect. Dis. 43 (9): S49–S56.
Boston PJ, Spilde MN, Northup DE, Melim LA, Soroka DS, Kleina LG, Lavoie KH, Hose LD, Mallory LM, Dahm CN, et al. 2001. Cave biosignature suites: microbes, minerals, and Mars. Astrobiology 1 (1): 25–55.
Botts MR, Giles SS, Gates MA, Kozel TR, Hull CM. 2009. Isolation and characterization of Cryptococcus neoformans Spores reveal a critical role for capsule biosynthesis genes in spore biogenesis. Eukaryot. Cell 8 (4): 595–605.
Brozak S. 2013. The Antibiotic Bubble -- A Quest For Continued Antibiotic Effectiveness [online]. Availble from http://www.forbes.com/sites/stephenbrozak/2013/05/07/the-antibiotic-bubble-a-quest-for-continued-antibiotic-effectiveness/ [accessed 20 December 2013].
Casida, L.E.J. 1969. Methods for the isolation and estimation of activity of soil bacteria. In The Ecology of Soil Bacteria, Liverpool University Press, pp. 97–122.
Chadwick PR, Woodford N, Kaczmarski EB, Gray S, Barrell RA, Oppenheim BA. 1996. Glycopeptide-resistant enterococci isolated from uncooked meat. J. Antimicrob. Chemother. 38 (5): 908–909.
Cheng J, Chen W, Huo-Zhang B, Nimaichand S, Zhou E, Klenk HP, . 2013. Microlunatus cavernae sp. nov., a novel actinobacterium isolated from Alu ancient cave, Yunnan, South-West China. Antonie Van Leeuwenhoek 104 (1): 95–101.
Cisneros JM, Rodríguez-Baño J. 2002. Nosocomial bacteremia due to Acinetobacter baumannii: epidemiology, clinical features and treatment. Clin. Microbiol. Infect. Off. Publ. Eur. Soc. Clin. Microbiol. Infect. Dis. 8 (11): 687–693.
102
Cladera-Olivera F, Caron GR, Brandelli A. 2004. Bacteriocin production by Bacillus licheniformis strain P40 in cheese whey using response surface methodology. Biochem. Eng. J. 21 (1): 53–58.
Clarridge JE. 2004. Impact of 16S rRNA gene sequence analysis for identification of bacteria on clinical microbiology and infectious diseases. Clin. Microbiol. Rev. 1 (1):, 840–862.
Clatworthy AE, Pierson E, Hung DT. 2007. Targeting virulence: a new paradigm for antimicrobial therapy. Nat. Chem. Biol. 3 (9): 541–548.
Conly J. 2002. Antimicrobial resistance in Canada. CMAJ Can. Med. Assoc. J. J. Assoc. Medicale Can. 167 (8): 885–891.
Conly JM, McEwen S, Hutchinson J, Boyd N, Callery S, Bryce E. 2004. Canadian committee on antibiotic resistance report. Can. J. Infect. Dis. Med. Microbiol. 15 (5): 257–260.
Cowan MM. 1999. Plant Products as Antimicrobial Agents. Clin. Microbiol. Rev. 12 (4): 564–582.
Crawford DL, Lynch JM, Whipps JM, Ousley MA. 1993. Isolation and characterization of actinomycete antagonists of a fungal root pathogen. Appl. Environ. Microbiol. 59 (11): 3899–3905.
Cropley JB. 1965. Influence of surface conditions on temperatures in large cave systems. Bull. Natl. Speleol. Soc. 27 (1): 1–10.
Croxatto A, Prod’hom G, Greub G. 2012. Applications of MALDI-TOF mass spectrometry in clinical diagnostic microbiology. FEMS Microbiol. Rev. 36 (2): 380–407.
Crueger W, Crueger A. 1990. Biotechnology: Textbook of Industrial Microbiology Sinauer.
Cushing GE, Titus TN, Wynne JJ, Christensen PR. 2007. Themis observes possible cave skylights on Mars. Geophys. Res. Lett. 34 (17): L17201.
Dantas G, Sommer MOA, Oluwasegun RD, Church GM. 2008. Bacteria subsisting on antibiotics. Science 320(5872), 100–103.
Davies J. 2006. Are antibiotics naturally antibiotics? J. Ind. Microbiol. Biotechnol. 33 (7): 496–499.
Davies J, Davies D. 2010. Origins and evolution of antibiotic resistance. Microbiol. Mol. Biol. Rev. MMBR 74 (3):417–433.
Deak M. 2010. The Methodology Of finding lava tubes with the use of remote detection on mars, on the example of a newly found cave.
Demain AL, Jermini MFG. 1989. Solid state fermentation for cephalosporin production by Streptomyces clavuligerus and cephalosporium acremoninm. Experiential. 45:1061–1065.
Deorukhkar AA, Chander R, Ghosh SB, Sainis KB. 2007. Identification of a red-pigmented bacterium producing a potent anti-tumor< i> N</i>-alkylated prodigiosin as< i> Serratia marcescens</i>. Res. Microbiol. 158 (5): 399–404.

103
Doern GV, Heilmann KP, Huynh HK, Rhomberg PR, Coffman SL, Brueggemann AB. 2001. Antimicrobial resistance among clinical isolates of Streptococcus pneumoniae in the United States during 1999–2000, Including a comparison of resistance rates since 1994–1995. Antimicrob. Agents Chemother. 45 (6): 1721–1729.
Driscoll AJ, Bhat N, Karron RA, O’Brien KL, Murdoch DR. 2012. Disk diffusion bioassays for the detection of antibiotic activity in body fluids: applications for the Pneumonia Etiology Research for Child Health Project. Clin. Infect. Dis. 54 (2):159–164.
Erbay A, İdil A, Gözel MG, Mumcuoğlu İ, Balaban N. 2009. Impact of early appropriate antimicrobial therapy on survival in< i> Acinetobacter baumannii</i> bloodstream infections. Int. J. Antimicrob. Agents 34 (6): 575–579.
Escalante L, Ramos I, Imriskova I, Langley E, Sanchez S. 1999. Glucose repression of anthracycline formation in Streptomyces peucetius var. caesius. Appl. Microbiol. Biotechnol. 5 (4):, 572–578.
Fair JD, Kormos CM. 2008. Flash column chromatograms estimated from thin-layer chromatography data. J. Chromatogr. A 1211 (1-2): 49–54.
Fakruddin M, Mannan KSB. 2013. Methods for analyzing diversity of microbial communities in natural environments. Ceylon J. Sci. Biol. Sci. 42 (1): 19–33.
Falagas ME, Karveli EA. 2007. The changing global epidemiology of Acinetobacter baumannii infections: a development with major public health implications. Clin. Microbiol. Infect. Off. Publ. Eur. Soc. Clin. Microbiol. Infect. Dis. 13(2):117–119.
Ferreira CV, Bos CL, Versteeg HH, Justo GZ, Durán N, Peppelenbosch MP. 2004. Molecular mechanism of violacein-mediated human leukemia cell death. Blood 104(5):1459–1464.
Fleming, S.A. 1945. Sir Alexander Fleming - Banquet Speech [online]. Available from http://www.nobelprize.org/nobel_prizes/medicine/laureates/1945/fleming-speech.html [accessed 15 October 2013].
Forsberg KJ, Reyes A, Wang B, Selleck EM, Sommer MO, Dantas G. 2012. The shared antibiotic resistome of soil bacteria and human pathogens. Science 3 (6098): 1107–1111.
Frick MH, Elo O, Haapa K, Heinonen OP, Heinsalmi P, Helo P, Huttunen JK, Kaitaniemi P, Koskinen P, Manninen V. 1987. Helsinki Heart Study: primary-prevention trial with gemfibrozil in middle-aged men with dyslipidemia. Safety of treatment, changes in risk factors, and incidence of coronary heart disease. N. Engl. J. Med. 317 (20): 1237–1245.
Fritze D. 2004. Taxonomy of the genus bacillus and related genera: the aerobic endospore-forming bacteria. Phytopathology 94 (11):1245–1248.
Gabriel CR, Northup DE. 2013. Microbial ecology: Caves as an extreme habitat. In cave microbiomes: A novel resource for drug discovery, Springer Briefs in Microbiology, A Novel Resource for Drug Discovery. SpringerBriefs in Microbiology, pp. 4614-5205-8.
104
Gangoué-Piéboji J, Eze N, Ngongang Djintchui A, Ngameni B, Tsabang N, Pegnyemb DE, Biyiti L, Ngassam P, Koulla-Shiro S, Galleni M. 2009. The in-vitro antimicrobial activity of some medicinal plants against beta-lactam-resistant bacteria. J. Infect. Dev. Ctries. 3(9):671–680.
Gauthier MJ, Flatau GN. 1976. Antibacterial activity of marine violet-pigmented Alteromonas with special reference to the production of brominated compounds. Can. J. Microbiol. 22 (11):1612–1619.
Gould FK, Brindle R, Chadwick PR, Fraise AP, Hill S, Nathwani D, Ridgway GL, Spry MJ, Warren RE. 2009. Guidelines 2008 for the prophylaxis and treatment of methicillin-resistant Staphylococcus aureus MRSA infections in the United Kingdom. J. Antimicrob. Chemother. 63 (5):849–861.
Groth I, Vettermann R, Schuetze B, Schumann P, Saiz-Jimenez C. 1999. Actinomycetes in Karstic caves of northern Spain Altamira and Tito Bustillo. J. Microbiol. Methods 36 (1-2):115–122.
Grushka, E., and Grinberg, N. 2009. Advances in Chromatography CRC Press, pp. 165–192
Guo M, Zhang YF, Wang Y, Zhao XP. 2013. [Development of a rapid screening method for discovering neuroprotective components from traditional Chinese medicine]. Zhongguo Zhong Yao Za Zhi Zhongguo Zhongyao Zazhi China J. Chin. Mater. Medica 38 (10):1581–1584.
Haavik HI. 1974. Studies on the formation of bacitracin by Bacillus licheniformis: role of catabolite repression and organic acids. J. Gen. Microbiol. 84 (2):321–326.
Hasan F, Khan S, Shah AA, Hameed A. 2009. Production of antibacterial compounds by free and immobilized Bacillus pumilus SAF1. Pak J Bot 4 (3):, 1499–1510.
Hijazin M, Hassan AA, Alber J, Lämmler C, Timke M, Kostrzewa M, Prenger-Berninghoff E, Zschöck M. 2012. Evaluation of matrix-assisted laser desorption ionization-time of flight mass spectrometry MALDI-TOF MS for species identification of bacteria of genera Arcanobacterium and Trueperella. Vet. Microbiol. 157 (1-2):243–245.
Himabindu M, Jetty A. 2006. Optimization of nutritional requirements for gentamicin production by Micromonospora echinospora. Indian J. Exp. Biol. 4 (10):842–848.
Holasova M, Karpiskova R, Karpiskova S, Babak V, Schlegelova J. 2007. Comparison of methods for the determination of antimicrobial resistance in Campylobacter spp. human and the food chain isolates. Vet. Med.-PRAHA- 52 (4):169.
Holmes NE, Johnson PDR, Howden BP. 2012. Relationship between Vancomycin-Resistant Staphylococcus aureus, Vancomycin-Intermediate S. aureus, High Vancomycin MIC, and Outcome in Serious S. aureus Infections. J. Clin. Microbiol. 50 (8):2548–52. doi:10.1128/JCM.00775-12.
Höltzel A, Kempter C, Metzger JW, Jung G, Groth I, Fritz T, Fiedler HP. 1998. Spirofungin, a new antifungal antibiotic from Streptomyces violaceusniger Tu 4113. J. Antibiot. Tokyo 51 (8):699–707.
105
Houghton D. 2002. Antimicrobial resistance in the intensive care unit: understanding the problem. AACN Clin. Issues 13 (3):410–20.
Hugenholtz P, Goebel BM, Pace NR. 1998. Impact of Culture-Independent Studies on the Emerging Phylogenetic View of Bacterial Diversity. J. Bacteriol. 180 (18):4765–74.
Hughes VM, Datta, N. 1983. Conjugative plasmids in bacteria of the “pre-antibiotic” era. Nature 302, 725–726.
Isada CM. 1996. Protease inhibitors: promising new weapons against HIV. Cleve. Clin. J. Med. 63 (4): 204–212.
James N, Sutherland ML. 1940. Effect of numbers of colonies per plate on the estimate of the bacterial population in soil. Can. J. Res. 18 (8):347–56.
Ji HF, Li XJ, Zhang HY. 2009. Natural products and drug discovery. Can thousands of years of ancient medical knowledge lead us to new and powerful drug combinations in the fight against cancer and dementia? EMBO Rep. 10 (3):194–200. doi:10.1038/embor.2009.12.
Johnson, A. Methicillin-resistant Staphylococcus aureus MRSA infection [Online]. Available from http://www.netdoctor.co.uk/diseases/facts/mrsa.htm accessed June 18 2013.
Jordan M. A novel disposable microtube for rapid assessment of biomass in cell cultures [Online]. Available from http://www.tpp.ch/page/downloads/PCV/Jordan_PCV-tube_rapid-assessment-biomass.pdf accessed on July 29th 2013.
Al-Judaibi AA. 2011. Effect of some fermentation parameters on ethanol production from beet molasses by Saccharomyces cerevisiae CAIM13. Am. J. Agric. Biol. Sci. 6 (2):301–306.
Kämpfer P, Witzenberger R, Denner EBM, Busse HJ, Neef A. 2002. Sphingopyxis witflariensis sp. nov., isolated from activated sludge. Int. J. Syst. Evol. Microbiol. 52 (6):2029–34. doi:10.1099/ijs.0.02217-0.
Kannel WB, Castelli WP, Gordon T, McNamara P. 1971. Serum cholesterol, lipoproteins, and the risk of coronary heart disease the framingham study. Ann. Intern. Med. 74 (1):1–12. doi:10.7326/0003-4819-74-1-1.
Katz DS. 2013. The Streak Plate Protocol- [online] MicrobeLibrary. Available from http://www.microbelibrary.org/component/resource/laboratory-test/3160-the-streak-plate-protocol [accessed 23 April 2013]
Kay S, Cheeptham N. 2013. Screening for antimicrobial activities of cave actinomycetes against honeybee pathogen. Chiang Mai J. Sci. 40 (1):26–33.
Khizhnyak SV, Harlamova LT, Voronov AI. 2011. A new cave system in the Genevskaya Cave as a potential source of cold-adapted bacteria. Krasnoyarsk State Agraian University, Russi
Kim JS, Harikrishnan R, Kim MC, Balasundaram C, Heo MS. 2010. Dietary administration of Zooshikella sp. enhance the innate immune response and disease resistance of Paralichthys olivaceus against Sreptococcus iniae. Fish Shellfish Immunol. 29 (1):104–10. doi:10.1016/j.fsi.2010.02.022.
106
Kovácsová S, Javoreková S, Majerčíková K, Medo J. 2013. Screening of antimicrobial activity and genes coding polyketide synthetase and nonribosomal peptide synthetase of actinomycete isolates. J. Microbiol. Biotechnol. Food Sci. 3 (3):255–58.
Kujumgiev A, Tsvetkova I, Serkedjieva Y, Bankova V, Christov R, Popov S. 1999. Antibacterial, antifungal and antiviral activity of propolis of different geographic origin. J. Ethnopharmacol. 64 (3):235–40.
Kumari P, Gilligan PC, Lim S, Tran LD, Winkler S, Philp R, Sampath K. 2013. An essential role for maternal control of Nodal signaling. eLife 2(September). doi:10.7554/eLife.00683. http://www.ncbi.nlm.nih.gov/pmc/articles/PMC3771576/.
Laiz L, Gonzalez JM, Saiz-Jimenez C. 2003. Microbial communities in caves: ecology, physiology, and effects on paleolithic paintings. Art Biol. Conserv. Biodeterior. Works Art Metrop. Mus. Art N. Y. 210–225.
Landman D, Quale JM, Mayorga D, Adedeji A, Vangala K, Ravishankar J, Flores C, Brooks S. 2002. Citywide clonal outbreak of multiresistant Acinetobacter baumannii and Pseudomonas aeruginosa in Brooklyn, NY: the preantibiotic era has returned. Arch. Intern. Med. 162 (13): 1515–20.
Lasch P, Beyer W, Nattermann H, Stämmler M, Siegbrecht E, Grunow R, Naumann D. 2009. Identification of Bacillus anthracis by Using Matrix-Assisted Laser Desorption Ionization-Time of Flight Mass Spectrometry and Artificial Neural Networks. Appl. Environ. Microbiol. 75 (22): 7229–42. doi:10.1128/AEM.00857-09.
Leal-Sánchez MV, Jiménez-Díaz R, Maldonado-Barragán A, Garrido-Fernández A, Ruiz-Barba JL. 2002. Optimization of bacteriocin production by batch fermentation of Lactobacillus plantarum LPCO10. Appl. Environ. Microbiol. 68 (9): 4465–71. doi:10.1128/AEM.68.9.4465-4471.2002.
Lee S.D. 2006. Nocardia jejuensis sp. nov., a novel actinomycete isolated from a natural cave on Jeju Island, Republic of Korea. Int. J. Syst. Evol. Microbiol. 56 (3): 559–62. doi:10.1099/ijs.0.63866-0.
Lee SD, Kim ES, Roe JH, Kim J, Kang SO, Hah YC. 2000. Saccharothrix violacea sp. nov., isolated from a gold mine cave, and Saccharothrix albidocapillata comb. nov. Int. J. Syst. Evol. Microbiol. 50(3) :1315–23.
Leekha S, Terrell CL, Edson RS. 2011. General principles of antimicrobial therapy. Mayo Clin. Proc. 86, 156–167.
Lertcanawanichakul M, Sawangnop S. 2011. A Comparison of two methods used for measuring the antagonistic activity of bacillus species. Walailak J. Sci. Technol. WJST5 (2):161–71. doi:10.2004/vol5iss2pp161-171.
Levy SB. 1997a. Antibiotic resistance: an ecological imbalance http://www.tufts.edu/med/apua/about_issue/ecology_3_1402951595.pdf.
Levy SB. 1997b. Antibiotic resistance: origins, evolution, selection and spread http:// http://www.tufts.edu/med/apua/about_issue/ecology_3_1402951595.pdf.
107
Levy SB. 2002. Factors impacting on the problem of antibiotic resistance. J. Antimicrob. Chemother. 49 (1): 25–30. doi:10.1093/jac/49.1.25.
Livermore DM. 2004. The need for new antibiotics. Clin. Microbiol. Infect. Off. Publ. Eur. Soc. Clin. Microbiol. Infect. Dis. 10 Suppl 4 (November): 1–9. doi:10.1111/j.1465-0691.2004.1004.x.
Lueschow SR, Johnson L, Porras-Alfaro A, Williams TF. 2013. Development of a protocol to optimize the isolation of Geomyces from soil samples. In PHYTOPATHOLOGY, AMER PHYTOPATHOLOGICAL SOC 3340 PILOT KNOB ROAD, ST PAUL, MN 55121 USA, pp. 87–87. http://www.apsnet.org/meetings/Documents/2013_Meeting_Abstracts/aps2013abP64.htm.
Mah MW, Memish ZA, Cunningham G, Bannatyne RM. 2001. Outbreak of acinetobacter baumannii in an intensive care unit associated with tracheostomy. Am. J. Infect. Control 29 (5):284–88.
Mangamuri U, Muvva V, Poda S, Agasar D. 2014. Optimization of process parameters for improved production of bioactive metabolites by Streptomyces tritolerans DAS 165T. Br. Microbiol. Res. J. 4 (4): 428–42.
Margesin R, Schumann P, Spröer C, Gounot AM. 2004. Arthrobacter psychrophenolicus sp. nov., isolated from an alpine ice cave. Int. J. Syst. Evol. Microbiol. 54 (6):2067–72. doi:10.1099/ijs.0.63124-0.
Matsui H, Hanaki H, Inoue M, Akama H, Nakae T, Sunakawa K, Omura S. 2011. Development of an immunochromatographic strip for simple detection of Penicillin-Binding protein 2? Clin. Vaccine Immunol. CVI 18 (2):248–53. doi:10.1128/CVI.00252-10.
Matz C, Deines P, Boenigk J, Arndt H, Eberl L, Kjelleberg S, Jürgens K. 2004. Impact of violacein-producing bacteria on survival and feeding of bacterivorous nanoflagellates. Appl. Environ. Microbiol. 70 (3): 1593–99.
Moote P. 2009. Isolation, Diversity, and Antimicrobial Activity of Actinomycetes from BC Caves. A report submitted to Dr. Cheeptham. TRU, Kamloops, BC, Canada.
Montefour K, Frieden J, Hurst S, Helmich C, Headley D, Martin M, Boyle DA. 2008. Acinetobacter baumannii: an emerging multidrug-resistant pathogen in critical care. Crit. Care Nurse 28 (1): 15–25; quiz 26.
Muhammad S, Ahmad S, Hameed A. 2009. Antbiotic production by thermophilic Bacillus specie SAT-4. Pak. J. Pharm. Sci. 22 (3):339–345
Naas T, Bogaerts P, Bauraing C, Degheldre Y, Glupczynski Y, Nordmann P. 2006. Emergence of PER and VEB extended-spectrum β-lactamases in Acinetobacter baumannii in Belgium. J. Antimicrob. Chemother. 58 (1): 178–82. doi:10.1093/jac/dkl178.
Nader M. 2004. Production of antibacterial agent from Streptomyces griseus by using Semi Solid Fermentation. Fac Med Bagdad 51 (1). http://www.iasj.net/iasj?func=fulltext&aId=796.
Naiemi NA, Duim B, Savelkoul PHM, Spanjaard L, Jonge E de, Bart A, Vandenbroucke-Grauls CM, Jong MD. 2005. Widespread transfer of resistance genes between bacterial species in an
108
intensive care unit: implications for hospital epidemiology. J. Clin. Microbiol. 43 (9):4862–64. doi:10.1128/JCM.43.9.4862-4864.2005.
Nakamura Y, Asada C, Sawada T. 2003. Production of antibacterial violet pigment by psychrotropic bacterium RT102 strain. Biotechnol. Bioprocess Eng. 8 (1):37–40. doi:10.1007/BF02932896.
Nanjwade B, Chandrashekhara S, Goudanavar P, Shamarez A, Manvi F. 2010. Production of antibiotics from soil-isolated actinomycetes and evaluation of their antimicrobial activities. Trop. J. Pharm. Res. 9 (4). http://www.ajol.info/index.php/tjpr/article/view/58933.
Northup DE, Melim LA, Spilde MN, Hathaway JJM, Garcia MG, Moya M, Stone FD, Boston PJ, Dapkevicius M.L.N.E, Riquelme C. 2011. Lava cave microbial communities within mats and secondary mineral deposits: implications for life detection on other planets. Astrobiology 11 (7):601–18. doi:10.1089/ast.2010.0562.
Olson RP, Harrell LJ, Kaye KS. 2009. Antibiotic resistance in urinary isolates of Escherichia coli from college women with urinary tract infections. Antimicrob. Agents Chemother. 53 (3): 1285–86. doi:10.1128/AAC.01188-08.
Omura S. 2002. Macrolide antibiotics: chemistry, biology, and practice Academic press http://books.google.ca/books?hl=en&lr=&id=hfDWdWNGkaQC&oi=fnd&pg=PP2&dq=Antibiotics:+Chemistry,+Biology+and+Practice.+2nd+&ots=kGxmQnv15P&sig=i3J55_qFlfUGPx4Vua4NDqLz-QM.
Omura S, Ikeda H, Malpartida F, Kieser HM, Hopwood DA. 1986. Production of new hybrid antibiotics, mederrhodins A and B, by a genetically engineered strain. Antimicrob. Agents Chemother. 29 (1): 13–19.
Pallett A, Hand K. 2010. Complicated urinary tract infections: practical solutions for the treatment of multiresistant Gram-negative bacteria. J. Antimicrob. Chemother. 65 (suppl 3): iii25–iii33. doi:10.1093/jac/dkq298.
Panagiotopoulou PM, Tsimidou M. 2002. Solid phase extraction: Applications to the chromatographic analysis of vegetable oils and fats. Grasas Aceites 53 (1). doi:10.3989/gya.2002.v53.i1.292. http://grasasyaceites.revistas.csic.es/index.php/grasasyaceites/article/viewArticle/292.
Pankratov TA, Serkebaeva YM, Kulichevskaya IS, Liesack W, Dedysh SN. 2008. Substrate-induced growth and isolation of Acidobacteria from acidic Sphagnum peat. ISME J. 2 (5): 551–60. doi:10.1038/ismej.2008.7.
Pattnaik P, Kaushik Jk, Grover S, Batish Vk. 2001. Purification and characterization of a bacteriocin-like compound Lichenin produced anaerobically by Bacillus licheniformis isolated from water buffalo. J. Appl. Microbiol. 91 (4): 636–45. doi:10.1046/j.1365-2672.2001.01429.x.
Pray L. 2008. Antibiotic resistance, mutation rates and MRSA. Nat. Educ. 1 (1): 30.
Rajamohan G, Srinivasan VB, Gebreyes WA. 2009. Biocide-tolerant multidrug-resistant Acinetobacter baumannii clinical strains are associated with higher biofilm formation. J. Hosp. Infect. 73 (3): 287–89. doi:10.1016/j.jhin.2009.07.015.
109
Reasoner D.J, Geldreich EE. 1985. A new medium for the enumeration and subculture of bacteria from potable water. Appl. Environ. Microbiol. 49 (1): 1–7.
Reich M, Bosshard PP, Stark M, Beyser K, Borgmann S. 2013. Species identification of bacteria and fungi from solid and liquid culture media by MALDI-TOF mass spectrometry. J Bacteriol Parasitol http://www.omicsonline.org/2155-9597/2155-9597-S5-002.php.
Reller LB, Weinstein M, Jorgensen JH, Ferraro MJ. 2009. Antimicrobial susceptibility testing: A review of general principles and contemporary practices. Clin. Infect. Dis. 49 (11): 1749–55. doi:10.1086/647952.
Van Rij ET, Wesselink M, Chin-A-Woeng TF, Bloemberg GV, Lugtenberg BJ. 2004. Influence of environmental conditions on the production of phenazine-1-carboxamide by Pseudomonas chlororaphis PCL1391. Mol. Plant. Microbe Interact. 17 (5), 557–566.
Ripa FA, Nikkon F, Zaman S, Khondka, P. 2009. Optimal conditions for antimicrobial metabolites production from a new Streptomyces sp. RUPA-08PR isolated from bangladeshi soil. Mycobiology 37 (3): 211–14. doi:10.4489/MYCO.2009.37.3.211.
Rule D, Cheeptham N. 2013. The effects of UV light on the antimicrobial activities of cave actinomycetes. Int. J. Speleol. 42 (2). doi:<p>http://dx.doi.org/10.5038/1827-806X.42.2.7</p>. http://scholarcommons.usf.edu/ijs/vol42/iss2/7.
Russo TA, Johnson JR. 2003. Medical and economic impact of extraintestinal infections due to Escherichia coli: focus on an increasingly important endemic problem. Microbes Infect. Inst. Pasteur 5 (5): 449–56.
Sacchi CT, Whitney AM, Mayer LW, Morey R, Steigerwalt A, Boras A, Weyant RS, Popovic T. 2002. Sequencing of 16S rRNA gene: A rapid tool for identification of Bacillus anthracis. Emerg. Infect. Dis. 8 (10): 1117–23. doi:10.3201/eid0810.020391.
Seng P, Rolain JM, Fournier PE, La Scola B, Drancourt M, Raoult D. 2010. MALDI-TOF-mass spectrometry applications in clinical microbiology. Future Microbiol. 5 (11): 1733–54. doi:10.2217/fmb.10.127.
Shoemaker NB, Vlamakis H, Hayes K, Salyers AA. 2001. Evidence for extensive resistance gene transfer among Bacteroides spp. and other genera in the human colon. Appl. Environ. Microbiol. 67 (2): 561–68. doi:10.1128/AEM.67.2.561-568.2001.
Siegel JD, Rhinehart E, Jackson M, Chiarello L. 2007. Management of multidrug-resistant organisms in health care settings, 2006. Am. J. Infect. Control 35, S165–S193.
Smith DL, Harris AD, Johnson JA, Silbergeld EK, Morris JG. 2002. Animal antibiotic use has an early but important impact on the emergence of antibiotic resistance in human commensal bacteria. Proc. Natl. Acad. Sci. 99 (9): 6434–39. doi:10.1073/pnas.082188899.
Snider JR, Goin C, Miller RV, Boston PJ, Northup, D.E. 2009. Ultraviolet radiation sensitivity in cave bacteria: evidence of adaptation to the subsurface? Int. J. Speleol. 38 (1).
110
Song, Q., Huang, Y., and Yang, H. 2012. Optimization of Fermentation Condi tions for Antibiotic Production by Actinomycetes YJ1 Strain against Sclerotinia sclerotiorum. J. Agric. Sci. 4 (7).
Song Y, Liu C, Bolanos M, Lee J, McTeague M, Finegold SM. 2005. Evaluation of 16S rRNA Sequencing and Reevaluation of a Short Biochemical Scheme for Identification of Clinically Significant Bacteroides Species. J. Clin. Microbiol. 43 (4):1531–37. doi:10.1128/JCM.43.4.1531-1537.2005.
Spector WS, Porter JN, Mello GCD. 2012. Handbook Of Toxicology, V2: Antibiotics Literary Licensing, LLC.
Spellberg B. New Antibiotic Development: Barriers and Opportunities in 2012 Alliance for the Prudent Use of Antibiotics. Accessed December 1. http://www.tufts.edu/med/apua/news/news-newsletter-vol-30-no-1-2.shtml..
Staneck JL, Roberts GD. 1974. Simplified Approach to Identification of Aerobic Actinomycetes by Thin-Layer Chromatography. Appl. Microbiol. 28 (2): 226–31.
Stettler M, Jaccard N, Hacker D, Jesus MD, Wurm FM, Jordan M. 2006. New disposable tubes for rapid and precise biomass assessment for suspension cultures of mammalian cells. Biotechnol. Bioeng. 95 (6): 1228–33.
Strohl WR. 1997. Biotechnology of Antibiotics Vol. 82 by W. R. Strohl 1997, Hardcover, Revised Taylor & Francis Group http://www.ebay.com/ctg/Biotechnology-Antibiotics-Vol-82-W-R-Strohl-1997-Hardcover-Revised-/700738.
Tadesse DA, Zhao S, Tong E, Ayers S, Singh A, Bartholomew MJ, McDermott PF. 2012. Antimicrobial Drug Resistance in Escherichia coli from Humans and Food Animals, United States, 1950–2002. Emerg. Infect. Dis. 18 (5): 741–49. doi:10.3201/eid1805.111153.
Talbot GH, Bradley J, Edwards JE, Gilbert D, Scheld M, Bartlett JG. 2006. Bad bugs need drugs: an update on the development pipeline from the Antimicrobial Availability Task Force of the Infectious Diseases Society of America. Clin. Infect. Dis. 42 (5): 657–68.
Tenover FC. 2006. Mechanisms of Antimicrobial Resistance in Bacteria. Am. J. Med. 119 (6): S3–S10. doi:10.1016/j.amjmed.2006.03.011.
Turton JF, Kaufmann ME, Gill MJ, Pike R, Scott PT, Fishbain J, Craft D, Deye G, Riddell S, Lindler LE, et al. 2006. Comparison of Acinetobacter baumannii Isolates from the United Kingdom and the United States That Were Associated with Repatriated Casualties of the Iraq Conflict. J. Clin. Microbiol. 44 (7): 2630–34. doi:10.1128/JCM.00547-06.
Ueda K, Tomaru Y, Endoh K, Beppu T. 1997. Stimulatory effect of copper on antibiotic production and morphological differentiation in Streptomyces tanashiensis. J. Antibiot. Tokyo 50 (8): 693–95.
Usha Kiranmayi M, Sudhakar P, Sreenivasulu K, Vijayalakshmi M. 2011. Optimization of Culturing Conditions for Improved Production of Bioactive Metabolites by Pseudonocardia sp. VUK-10. Mycobiology 39 (3): 174–81. doi:10.5941/MYCO.2011.39.3.174.
111
Usta A, Demi�rkan E. 2013. The effect of growth parameters on the antibiotic activity and sporulation in Bacillus spp. isolated from soil. J. Microbiol. Biotechnol. Food Sci. 2 (5): 2310–13.
Valgaerts L. 2007. Combining Variational and Feature-based Methods for Motion Estimation. Technische Universit �at M �unchen.
Vartoukian SR, Palmer RM, Wade WG. 2010. Strategies for culture of “unculturable” bacteria. FEMS Microbiol. Lett. 309 (1): 1–7. doi:10.1111/j.1574-6968.2010.02000.x.
Vijayakumar R, Panneerselvam K, Muthukumar C, Thajuddin N, Panneerselvam A, Saravanamuthu R. 2012. Optimization of Antimicrobial Production by a Marine Actinomycete Streptomyces afghaniensis VPTS3-1 Isolated from Palk Strait, East Coast of India. Indian J. Microbiol. 52 (2): 230–39. doi:10.1007/s12088-011-0138-x.
Vincent JG, Vincent HW, Morton J. 1944. Filter Paper Disc Modification of the Oxford Cup Penicillin Determination. Exp. Biol. Med. 55 (3): 162–64. doi:10.3181/00379727-55-14502.
Walter MR. 1983. Archean stromatolites: Evidence of the earth’s earliest benthos. In Earth’s Earliest Biosphere: Its Origin Are Evolution, Princeton, N.J.: Princeton Univ Press, pp. 187–213.
White M. 2013. Living in a Bacterial World: Antibiotic-Resistant Bacteria Everywhere Pacific Standard [online]. Available from http://www.psmag.com/science/living-bacterial-world-66260/ [acceseed 15 October 2012]
WHO 2012. World Health Organization. The world health report | Strategies for global antimicrobial resistance surveillance.
Wise, K. 2013. Spread Plate. http://www.microbelibrary.org/index.php?option=com_resource&controller=article&article=3084&Itemid=0&category_id=1.
Wright GD. 2007. The antibiotic resistome: the nexus of chemical and genetic diversity. Nat. Rev. Microbiol. 5 (3): 175–86. doi:10.1038/nrmicro1614.
Yahya A. Isolation and characterization of pigmented bacteria showing antimicrobial activity from Malaysian marine environment [online]. Available from http://www.academia.edu/3486470/Isolation_and_characterization_of_pigmented_bacteria_showing_antimicrobial_activity_from_Malaysian_marine_environment. [Accessed 19 April 2013].
Yasui A, McCready SJ. 1998. Alternative Repair Pathways for UVInduced DNA Damage. Bioessays 20 (4): 291–97.
Yegneswaran PK, Gray MR, Westlake DWS. 1988. Effects of reduced oxygen on growth and antibiotic production inStreptomyces clavuligerus. Biotechnol. Lett. 10 (7): 479–84. doi:10.1007/BF01027060.
Young MD, Kempe LL, Bader FG. 1985. Effects of phosphate, glucose, and ammonium on cell growth and lincomycin production by Streptomyces lincolnensis in chemically defined media. Biotechnol. Bioeng. 27, 327–333.
112
Yu X, Susa M, Knabbe C, Schmid RD, Bachmann TT. 2004. Development and Validation of a Diagnostic DNA Microarray To Detect Quinolone-Resistant Escherichia coli among Clinical Isolates. J. Clin. Microbiol. 42 (9): 4083–91. doi:10.1128/JCM.42.9.4083-4091.2004.
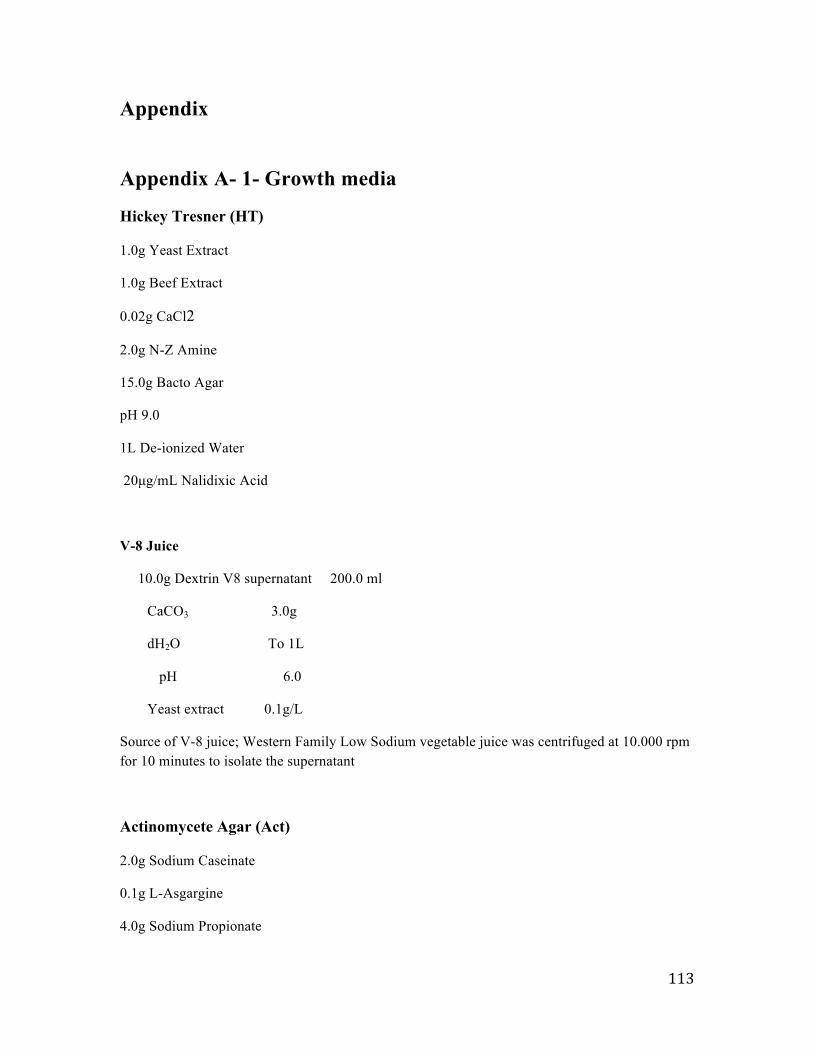
113
Appendix
Appendix A- 1- Growth media
Hickey Tresner (HT)
1.0g Yeast Extract
1.0g Beef Extract
0.02g CaCl2
2.0g N-Z Amine
15.0g Bacto Agar
pH 9.0
1L De-ionized Water
20µg/mL Nalidixic Acid
V-8 Juice
10.0g Dextrin V8 supernatant 200.0 ml
CaCO3 3.0g
dH2O To 1L
pH 6.0
Yeast extract 0.1g/L
Source of V-8 juice; Western Family Low Sodium vegetable juice was centrifuged at 10.000 rpm for 10 minutes to isolate the supernatant
Actinomycete Agar (Act)
2.0g Sodium Caseinate
0.1g L-Asgargine
4.0g Sodium Propionate
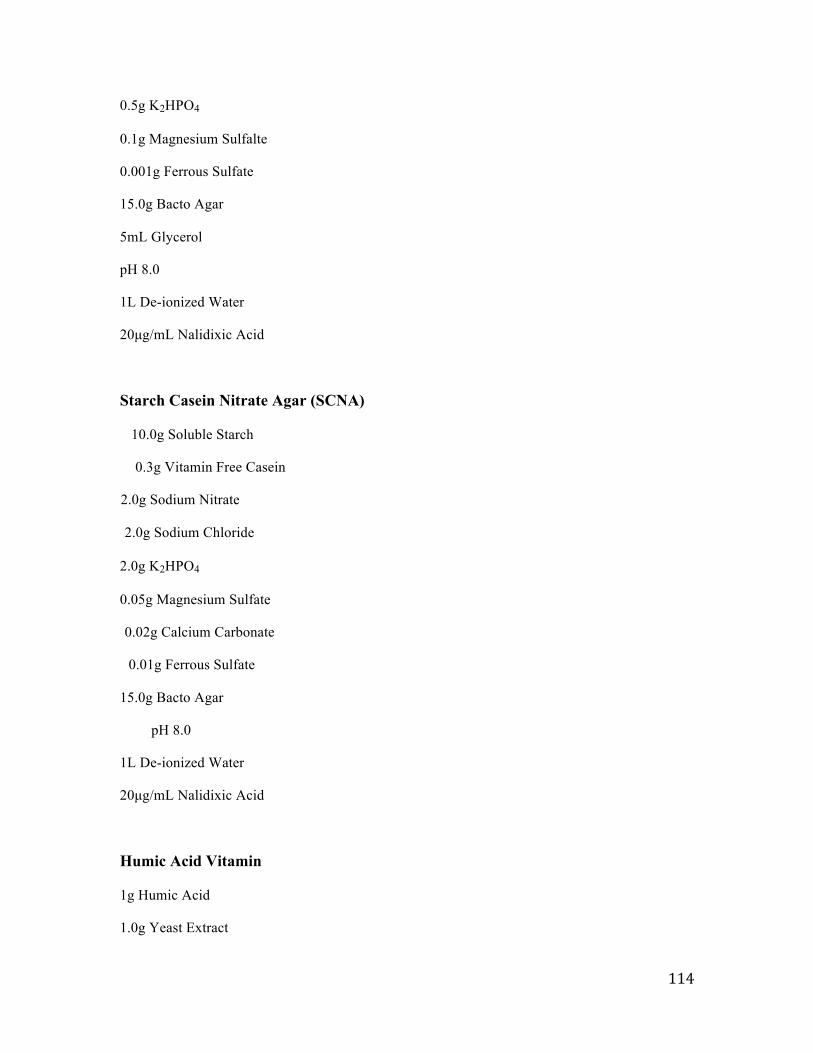
114
0.5g K2HPO4
0.1g Magnesium Sulfalte
0.001g Ferrous Sulfate
15.0g Bacto Agar
5mL Glycerol
pH 8.0
1L De-ionized Water
20µg/mL Nalidixic Acid
Starch Casein Nitrate Agar (SCNA)
10.0g Soluble Starch
0.3g Vitamin Free Casein
2.0g Sodium Nitrate
2.0g Sodium Chloride
2.0g K2HPO4
0.05g Magnesium Sulfate
0.02g Calcium Carbonate
0.01g Ferrous Sulfate
15.0g Bacto Agar
pH 8.0
1L De-ionized Water
20µg/mL Nalidixic Acid
Humic Acid Vitamin
1g Humic Acid
1.0g Yeast Extract
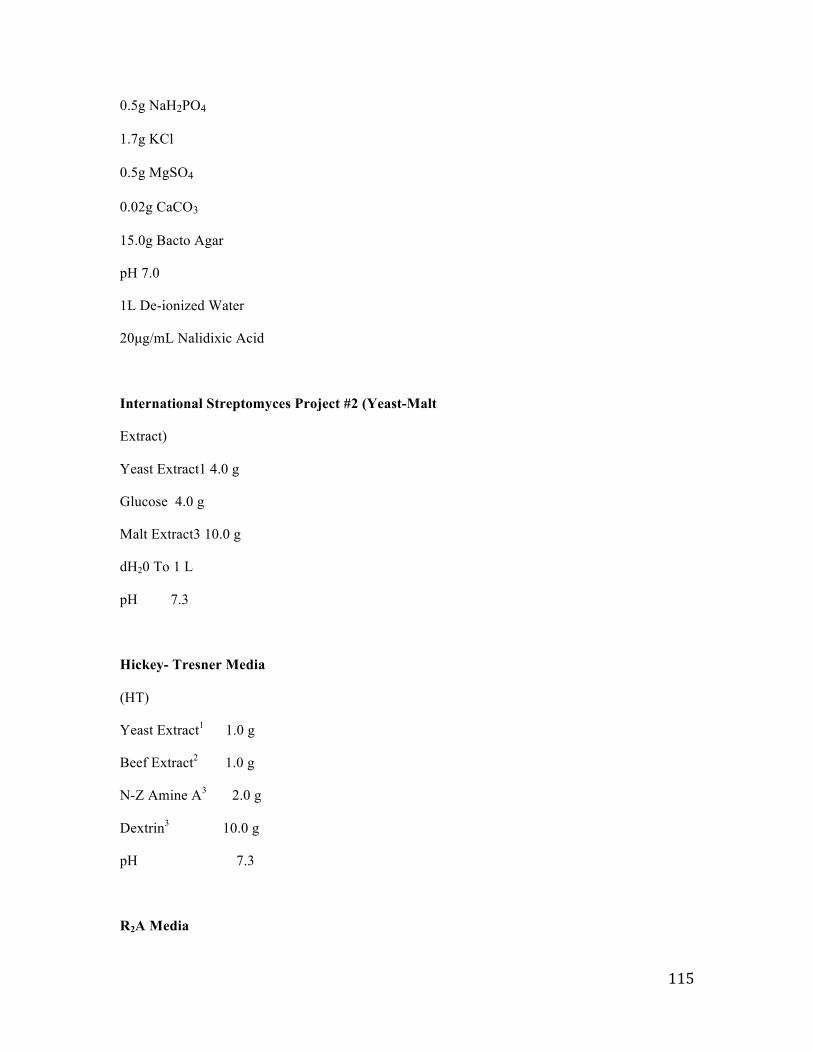
115
0.5g NaH2PO4
1.7g KCl
0.5g MgSO4
0.02g CaCO3
15.0g Bacto Agar
pH 7.0
1L De-ionized Water
20µg/mL Nalidixic Acid
International Streptomyces Project #2 (Yeast-Malt
Extract)
Yeast Extract1 4.0 g
Glucose 4.0 g
Malt Extract3 10.0 g
dH20 To 1 L
pH 7.3
Hickey- Tresner Media
(HT)
Yeast Extract1 1.0 g
Beef Extract2 1.0 g
N-Z Amine A3 2.0 g
Dextrin3 10.0 g
pH 7.3
R2A Media
116
0.5 g of yeast extract,
0.5 g of Difco Proteose Peptone no. 3 (Difco Laboratories),
0.5 g of Casamino Acids (Difco),
0.5 g of glucose,
0.5 g of soluble starch,
0.3 g of K2HPO4,
0.05 g of MgSO4 X 7H2O,
0.3 g of sodium pyruvate,
and 15 g of agar per liter of
laboratory quality water
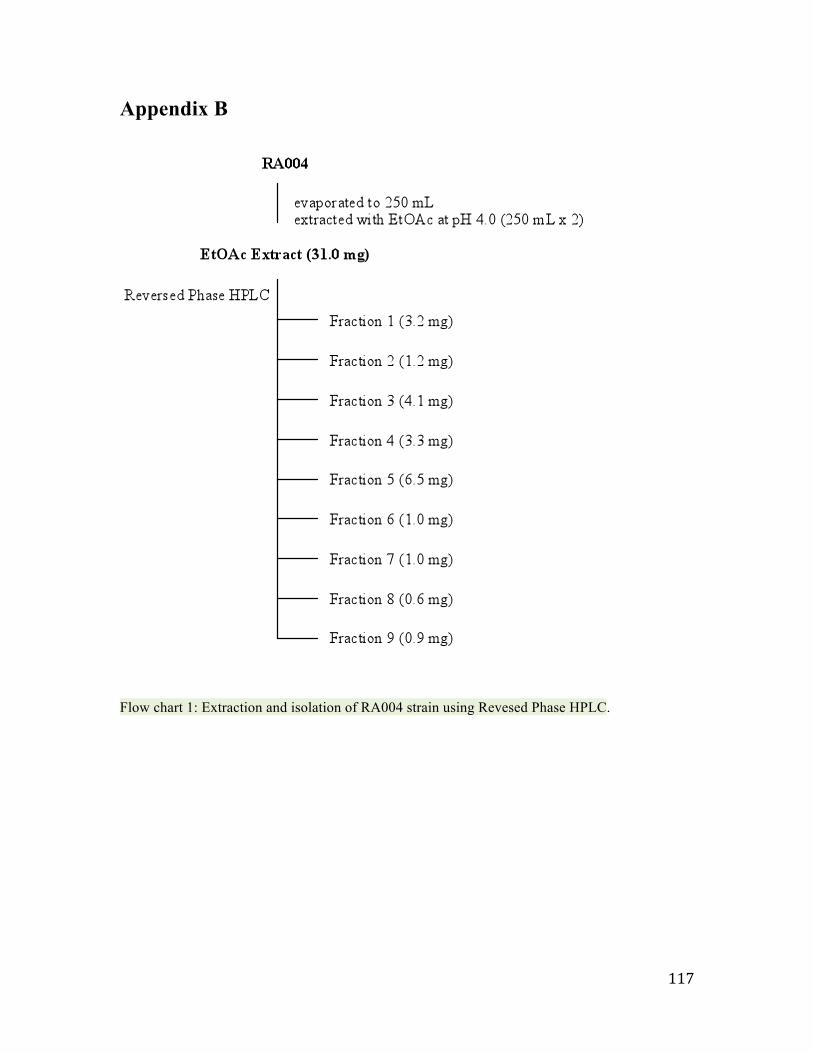
117
Appendix B
Flow chart 1: Extraction and isolation of RA004 strain using Revesed Phase HPLC.
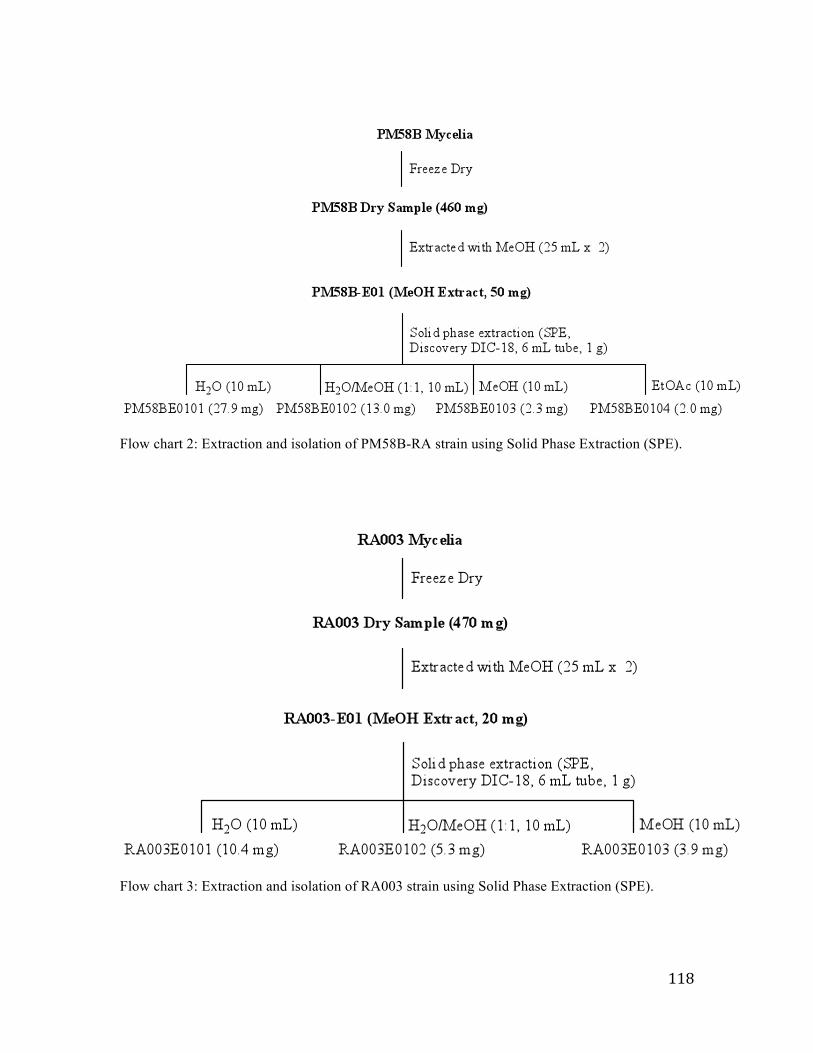
118
Flow chart 2: Extraction and isolation of PM58B-RA strain using Solid Phase Extraction (SPE).
Flow chart 3: Extraction and isolation of RA003 strain using Solid Phase Extraction (SPE).
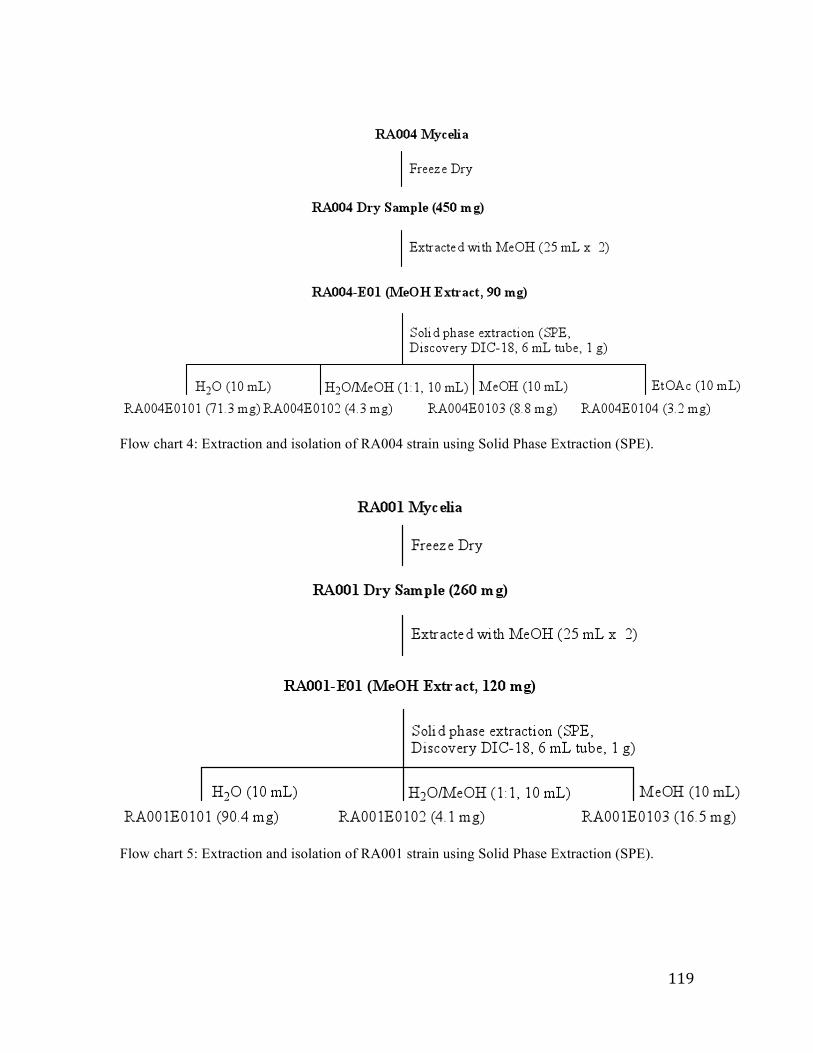
119
Flow chart 4: Extraction and isolation of RA004 strain using Solid Phase Extraction (SPE).
Flow chart 5: Extraction and isolation of RA001 strain using Solid Phase Extraction (SPE).
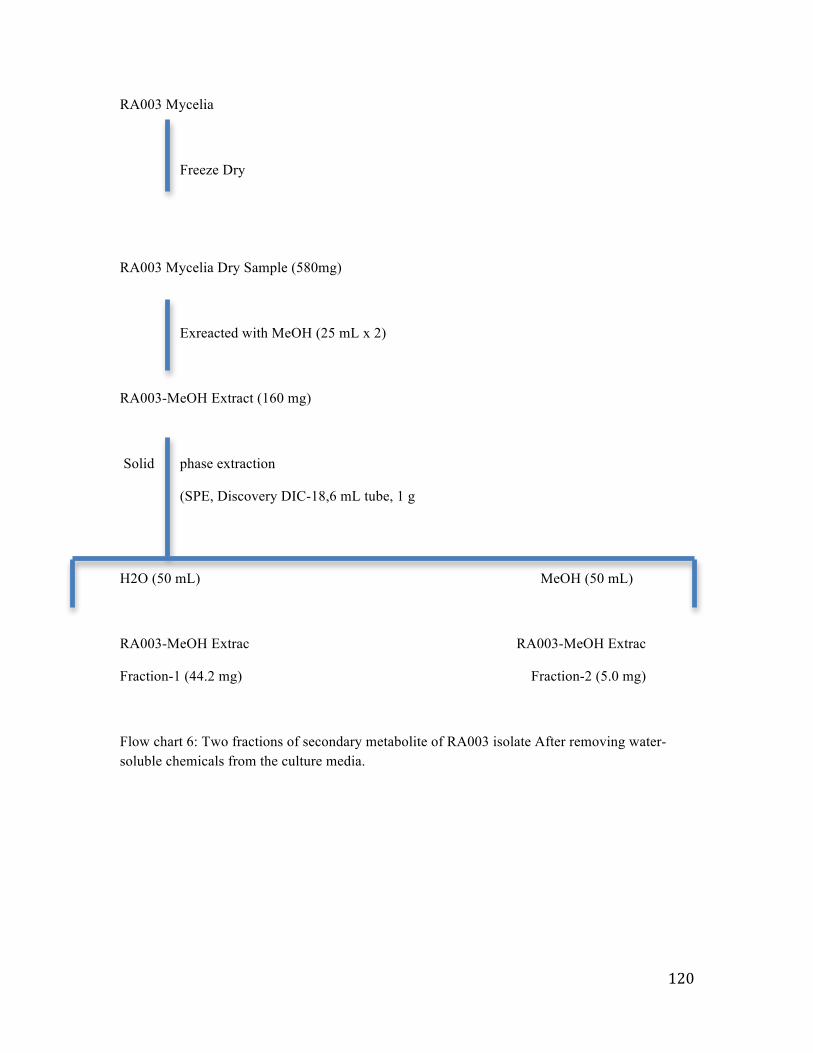
120
RA003 Mycelia
Freeze Dry
RA003 Mycelia Dry Sample (580mg)
Exreacted with MeOH (25 mL x 2)
RA003-MeOH Extract (160 mg)
Solid phase extraction
(SPE, Discovery DIC-18,6 mL tube, 1 g
H2O (50 mL) MeOH (50 mL)
RA003-MeOH Extrac RA003-MeOH Extrac
Fraction-1 (44.2 mg) Fraction-2 (5.0 mg)
Flow chart 6: Two fractions of secondary metabolite of RA003 isolate After removing water-soluble chemicals from the culture media.
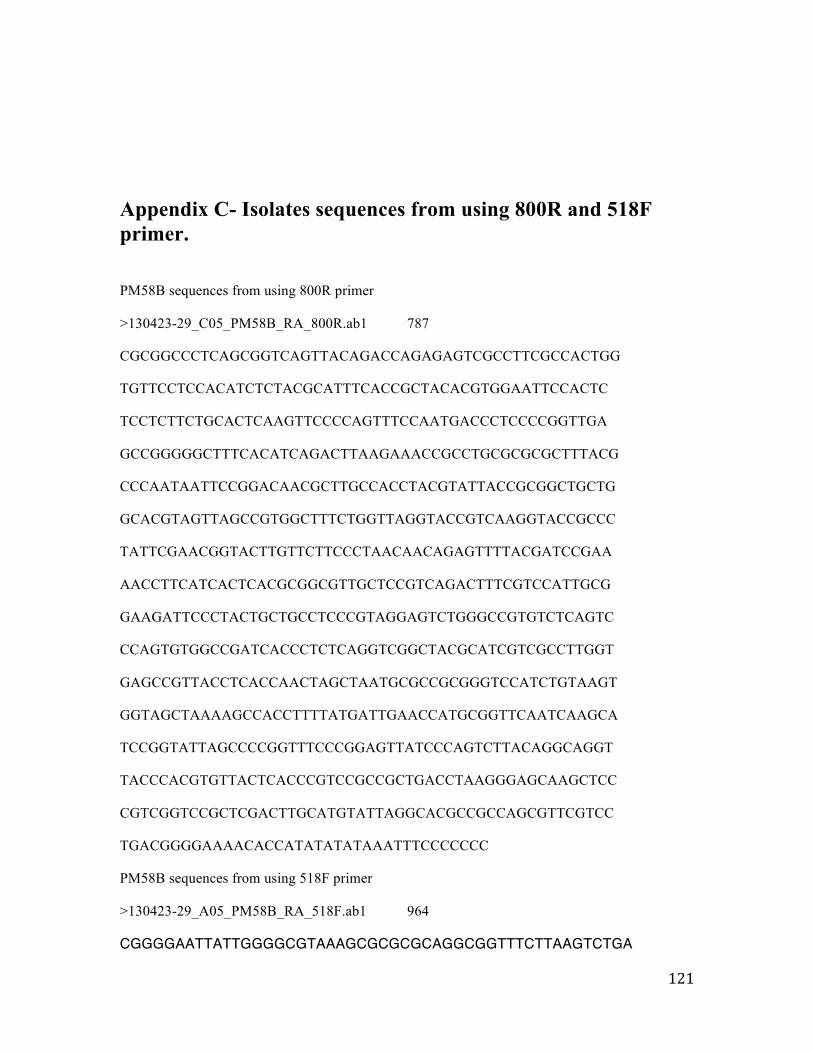
121
Appendix C- Isolates sequences from using 800R and 518F primer.
PM58B sequences from using 800R primer
>130423-29_C05_PM58B_RA_800R.ab1 787
CGCGGCCCTCAGCGGTCAGTTACAGACCAGAGAGTCGCCTTCGCCACTGG
TGTTCCTCCACATCTCTACGCATTTCACCGCTACACGTGGAATTCCACTC
TCCTCTTCTGCACTCAAGTTCCCCAGTTTCCAATGACCCTCCCCGGTTGA
GCCGGGGGCTTTCACATCAGACTTAAGAAACCGCCTGCGCGCGCTTTACG
CCCAATAATTCCGGACAACGCTTGCCACCTACGTATTACCGCGGCTGCTG
GCACGTAGTTAGCCGTGGCTTTCTGGTTAGGTACCGTCAAGGTACCGCCC
TATTCGAACGGTACTTGTTCTTCCCTAACAACAGAGTTTTACGATCCGAA
AACCTTCATCACTCACGCGGCGTTGCTCCGTCAGACTTTCGTCCATTGCG
GAAGATTCCCTACTGCTGCCTCCCGTAGGAGTCTGGGCCGTGTCTCAGTC
CCAGTGTGGCCGATCACCCTCTCAGGTCGGCTACGCATCGTCGCCTTGGT
GAGCCGTTACCTCACCAACTAGCTAATGCGCCGCGGGTCCATCTGTAAGT
GGTAGCTAAAAGCCACCTTTTATGATTGAACCATGCGGTTCAATCAAGCA
TCCGGTATTAGCCCCGGTTTCCCGGAGTTATCCCAGTCTTACAGGCAGGT
TACCCACGTGTTACTCACCCGTCCGCCGCTGACCTAAGGGAGCAAGCTCC
CGTCGGTCCGCTCGACTTGCATGTATTAGGCACGCCGCCAGCGTTCGTCC
TGACGGGGAAAACACCATATATATAAATTTCCCCCCC
PM58B sequences from using 518F primer
>130423-29_A05_PM58B_RA_518F.ab1 964
CGGGGAATTATTGGGGCGTAAAGCGCGCGCAGGCGGTTTCTTAAGTCTGA
122
TGTGAAAGCCCCCGGCTCAACCGGGGAGGGTCATTGGAAACTGGGGAACT
TGAGTGCAGAAGAGGAGAGTGGAATTCCACGTGTAGCGGTGAAATGCGTA
GAGATGTGGAGGAACACCAGTGGCGAAGGCGACTCTCTGGTCTGTAACTG
ACGCTGAGGCGCGAAAGCGTGGGGAGCGAACAGGATTAGATACCCTGGTA
GTCCACGCCGTAAACGATGAGTGCTAAGTGTTAGAGGGTTTCCGCCCTTT
AGTGCTGCAGCAAACGCATTAAGCACTCCGCCTGGGGAGTACGGTCGCAA
GACTGAAACTCAAAGGAATTGACGGGGGCCCGCACAAGCGGTGGAGCATG
TGGTTTAATTCGAAGCAACGCGAAGAACCTTACCAGGTCTTGACATCCTC
TGACAACCCTAGAGATAGGGCTTCCCCTTCGGGGGCAGAGTGACAGGTGG
TGCATGGTTGTCGTCAGCTCGTGTCGTGAGATGTTGGGTTAAGTCCCGCA
ACGAGCGCAACCCTTGATCTTAGTTGCCAGCATTCAGTTGGGCACTCTAA
GGTGACTGCCGGTGACAAACCGGAGGAAGGTGGGGATGACGTCAAATCAT
CATGCCCCTTATGACCTGGGCTACACACGTGCTACAATGGGCAGAACAAA
GGGCAGCGAAGCCGCGAGGCTAAGCCAATCCCACAAATCTGTTCTCAGTT
CGGATCGCAGTCTGCAACTCGACTGCGTGAAGCTGGAATCGCTAGTAATC
GCGGATCACATGCCGCGGGTTGAATACGTTCCCGGGCCTTGTACACACCG
CCCGTCACACCACGAAGAGTTTGTAACACCCGAAGTCCGGTGAGGTAACC
TTTTTGGAGCCAGCCGCCGAAGGTGGGACAGATGATTGGGTGATAGAAAA
GGGGGGGGGGGGGA
RA001 sequences from using �800R primer > �130423-29_ �G03_ �RA001_ �800R.ab1 763 GGGCTTTTCGCTTCTCAGCGTCAGTTACAGCCCAGAGACCTGCCTTCGCC ATCGGTGTTCCTCCTGATATCTGCGCATTTCACCGCTACACCAGGAATTC CAGTCTCCCCTACTGCACTCTAGTCTGCCCGTACCCACCGCAGATCCGGA
123
GTTAAGCCCCGGACTTTCACGGCAGACGCGACAAACCGCCTACGAGCTCT TTACGCCCAATAATTCCGGATAACGCTTGCGCCCTACGTATTACCGCGGC TGCTGGCACGTAGTTAGCCGGCGCTTCTTCTGCAGGTACCGTCACCCACC CAAAAGACAGGCTTCTTCCCTACTGAAAGAGGTTTACAACCCGAAGGCCT TCATCCCTCACGCGGCGTCGCTGCATCAGGCTTGCGCCCATTGTGCAATA TTCCCCACTGCTGCCTCCCGTAGGAGTCTGGGCCGTGTCTCAGTCCCAGT GTGGCCGGTCACCCTCTCAGGCCGGCTACCCGTCGTCGCCTTGGTAGGCC ATTACCCCACCAACAAGCTGATAGGCCGCGAGTCCATCCAAAACCACAAA AGCTTTCCACCAACATGGCATGCGCCAGAAGGTCGTATCCAGTATTAGAC CCGGTTTCCCAGGCTTATCCCAGAGTCAAGGGCAGGTTACTCACGTGTTA CTCACCCGTTCGCCACTAATCCCCCCACAAGTGAGGTTCATCGTTCGACT TGCATGTGTTAAGCACGCCGCCAGCGTTCATCCTGCGAAAAAAAAAAAAA AAAAAAAAAANNN RA001 sequences from using �518F primer > �130423-29_ �E03_ �RA001_ �518F.ab1 968 TCCGGGGAATTATTGGGGCGTAAAGAGCTCGTAGGCGGTTTGTCGCGTCT GCCGTGAAAGTCCGGGGCTTAACTCCGGATCTGCGGTGGGTACGGGCAGA CTAGAGTGCAGTAGGGGAGACTGGAATTCCTGGTGTAGCGGTGAAATGCG CAGATATCAGGAGGAACACCGATGGCGAAGGCAGGTCTCTGGGCTGTAAC TGACGCTGAGGAGCGAAAGCATGGGGAGCGAACAGGATTAGATACCCTGG TAGTCCATGCCGTAAACGTTGGGCACTAGGTGTGGGGGACATTCCACGTT
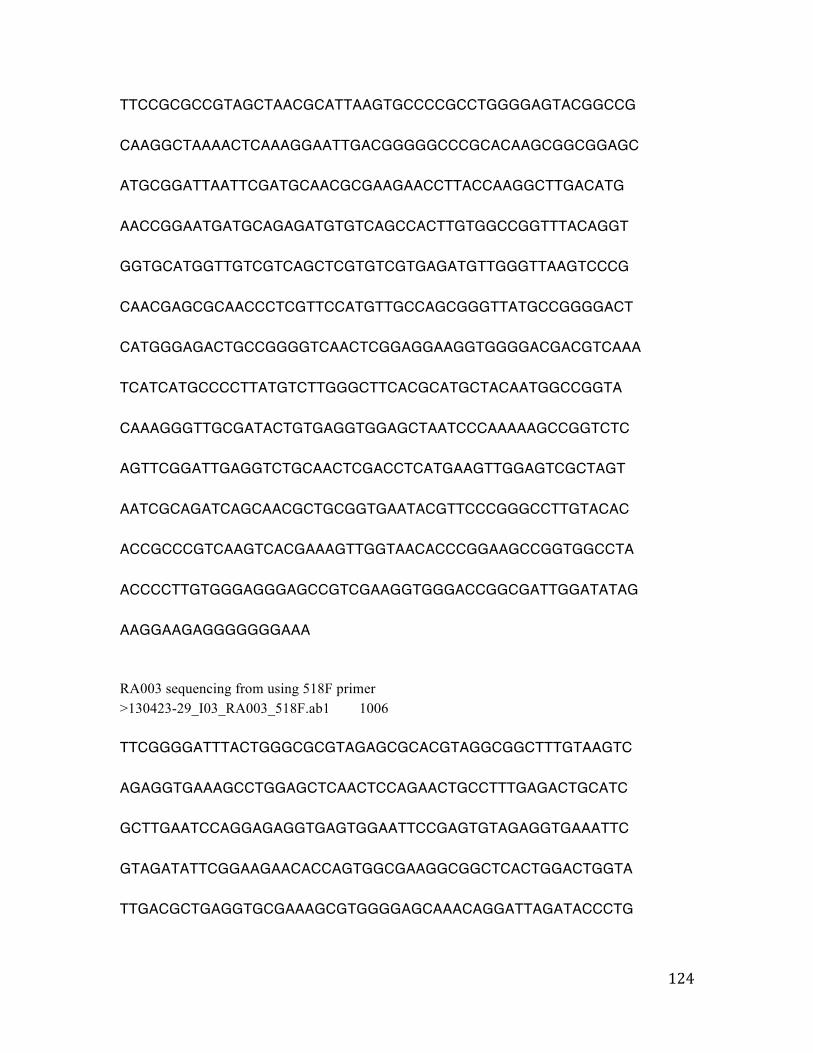
124
TTCCGCGCCGTAGCTAACGCATTAAGTGCCCCGCCTGGGGAGTACGGCCG CAAGGCTAAAACTCAAAGGAATTGACGGGGGCCCGCACAAGCGGCGGAGC ATGCGGATTAATTCGATGCAACGCGAAGAACCTTACCAAGGCTTGACATG AACCGGAATGATGCAGAGATGTGTCAGCCACTTGTGGCCGGTTTACAGGT GGTGCATGGTTGTCGTCAGCTCGTGTCGTGAGATGTTGGGTTAAGTCCCG CAACGAGCGCAACCCTCGTTCCATGTTGCCAGCGGGTTATGCCGGGGACT CATGGGAGACTGCCGGGGTCAACTCGGAGGAAGGTGGGGACGACGTCAAA TCATCATGCCCCTTATGTCTTGGGCTTCACGCATGCTACAATGGCCGGTA CAAAGGGTTGCGATACTGTGAGGTGGAGCTAATCCCAAAAAGCCGGTCTC AGTTCGGATTGAGGTCTGCAACTCGACCTCATGAAGTTGGAGTCGCTAGT AATCGCAGATCAGCAACGCTGCGGTGAATACGTTCCCGGGCCTTGTACAC ACCGCCCGTCAAGTCACGAAAGTTGGTAACACCCGGAAGCCGGTGGCCTA ACCCCTTGTGGGAGGGAGCCGTCGAAGGTGGGACCGGCGATTGGATATAG AAGGAAGAGGGGGGGAAA RA003 sequencing from using 518F primer > �130423-29_ �I03_ �RA003_ �518F.ab1 1006 TTCGGGGATTTACTGGGCGCGTAGAGCGCACGTAGGCGGCTTTGTAAGTC AGAGGTGAAAGCCTGGAGCTCAACTCCAGAACTGCCTTTGAGACTGCATC GCTTGAATCCAGGAGAGGTGAGTGGAATTCCGAGTGTAGAGGTGAAATTC GTAGATATTCGGAAGAACACCAGTGGCGAAGGCGGCTCACTGGACTGGTA TTGACGCTGAGGTGCGAAAGCGTGGGGAGCAAACAGGATTAGATACCCTG
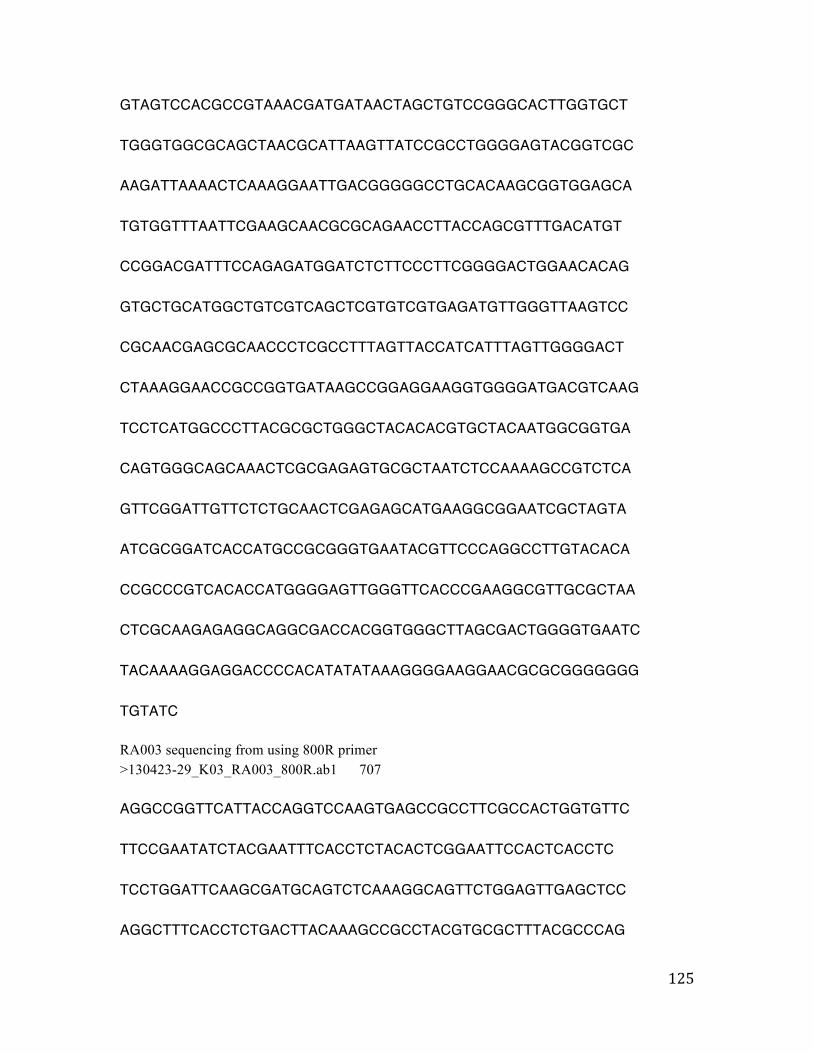
125
GTAGTCCACGCCGTAAACGATGATAACTAGCTGTCCGGGCACTTGGTGCT TGGGTGGCGCAGCTAACGCATTAAGTTATCCGCCTGGGGAGTACGGTCGC AAGATTAAAACTCAAAGGAATTGACGGGGGCCTGCACAAGCGGTGGAGCA TGTGGTTTAATTCGAAGCAACGCGCAGAACCTTACCAGCGTTTGACATGT CCGGACGATTTCCAGAGATGGATCTCTTCCCTTCGGGGACTGGAACACAG GTGCTGCATGGCTGTCGTCAGCTCGTGTCGTGAGATGTTGGGTTAAGTCC CGCAACGAGCGCAACCCTCGCCTTTAGTTACCATCATTTAGTTGGGGACT CTAAAGGAACCGCCGGTGATAAGCCGGAGGAAGGTGGGGATGACGTCAAG TCCTCATGGCCCTTACGCGCTGGGCTACACACGTGCTACAATGGCGGTGA CAGTGGGCAGCAAACTCGCGAGAGTGCGCTAATCTCCAAAAGCCGTCTCA GTTCGGATTGTTCTCTGCAACTCGAGAGCATGAAGGCGGAATCGCTAGTA ATCGCGGATCACCATGCCGCGGGTGAATACGTTCCCAGGCCTTGTACACA CCGCCCGTCACACCATGGGGAGTTGGGTTCACCCGAAGGCGTTGCGCTAA CTCGCAAGAGAGGCAGGCGACCACGGTGGGCTTAGCGACTGGGGTGAATC TACAAAAGGAGGACCCCACATATATAAAGGGGAAGGAACGCGCGGGGGGG TGTATC RA003 sequencing from using 800R primer > �130423-29_ �K03_ �RA003_ �800R.ab1 707 AGGCCGGTTCATTACCAGGTCCAAGTGAGCCGCCTTCGCCACTGGTGTTC TTCCGAATATCTACGAATTTCACCTCTACACTCGGAATTCCACTCACCTC TCCTGGATTCAAGCGATGCAGTCTCAAAGGCAGTTCTGGAGTTGAGCTCC AGGCTTTCACCTCTGACTTACAAAGCCGCCTACGTGCGCTTTACGCCCAG
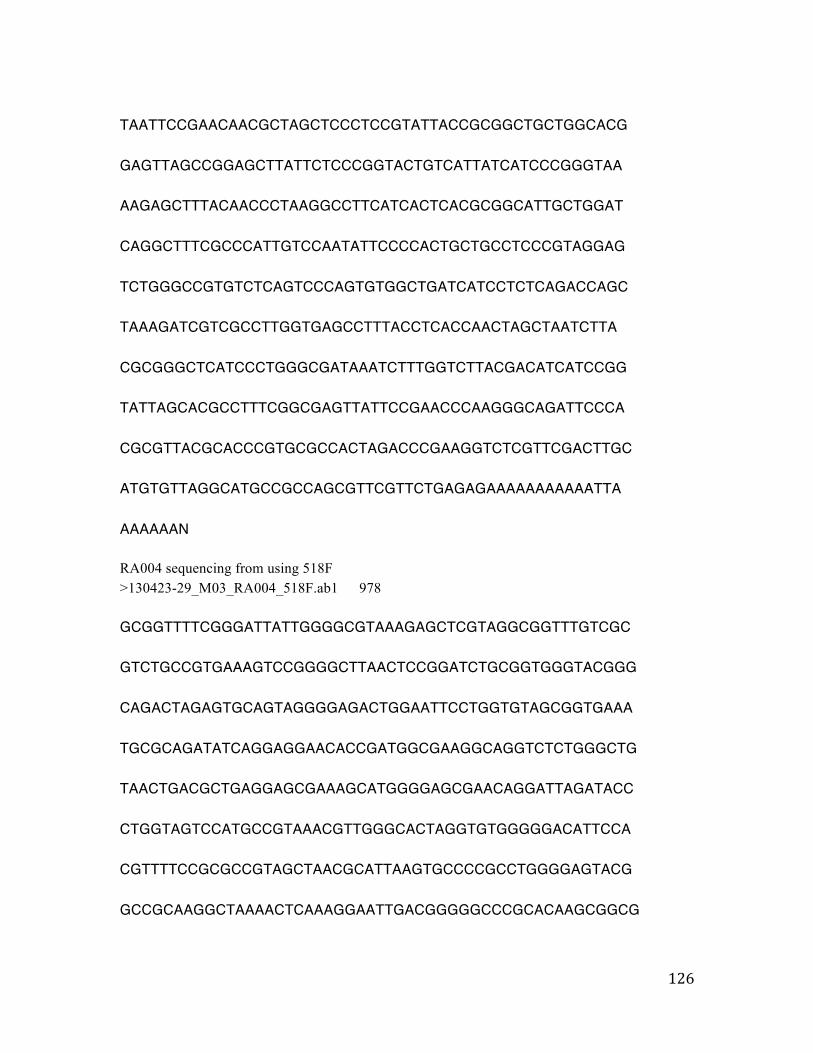
126
TAATTCCGAACAACGCTAGCTCCCTCCGTATTACCGCGGCTGCTGGCACG GAGTTAGCCGGAGCTTATTCTCCCGGTACTGTCATTATCATCCCGGGTAA AAGAGCTTTACAACCCTAAGGCCTTCATCACTCACGCGGCATTGCTGGAT CAGGCTTTCGCCCATTGTCCAATATTCCCCACTGCTGCCTCCCGTAGGAG TCTGGGCCGTGTCTCAGTCCCAGTGTGGCTGATCATCCTCTCAGACCAGC TAAAGATCGTCGCCTTGGTGAGCCTTTACCTCACCAACTAGCTAATCTTA CGCGGGCTCATCCCTGGGCGATAAATCTTTGGTCTTACGACATCATCCGG TATTAGCACGCCTTTCGGCGAGTTATTCCGAACCCAAGGGCAGATTCCCA CGCGTTACGCACCCGTGCGCCACTAGACCCGAAGGTCTCGTTCGACTTGC ATGTGTTAGGCATGCCGCCAGCGTTCGTTCTGAGAGAAAAAAAAAAATTA AAAAAAN RA004 sequencing from using 518F > �130423-29_ �M03_ �RA004_ �518F.ab1 978 GCGGTTTTCGGGATTATTGGGGCGTAAAGAGCTCGTAGGCGGTTTGTCGC GTCTGCCGTGAAAGTCCGGGGCTTAACTCCGGATCTGCGGTGGGTACGGG CAGACTAGAGTGCAGTAGGGGAGACTGGAATTCCTGGTGTAGCGGTGAAA TGCGCAGATATCAGGAGGAACACCGATGGCGAAGGCAGGTCTCTGGGCTG TAACTGACGCTGAGGAGCGAAAGCATGGGGAGCGAACAGGATTAGATACC CTGGTAGTCCATGCCGTAAACGTTGGGCACTAGGTGTGGGGGACATTCCA CGTTTTCCGCGCCGTAGCTAACGCATTAAGTGCCCCGCCTGGGGAGTACG GCCGCAAGGCTAAAACTCAAAGGAATTGACGGGGGCCCGCACAAGCGGCG
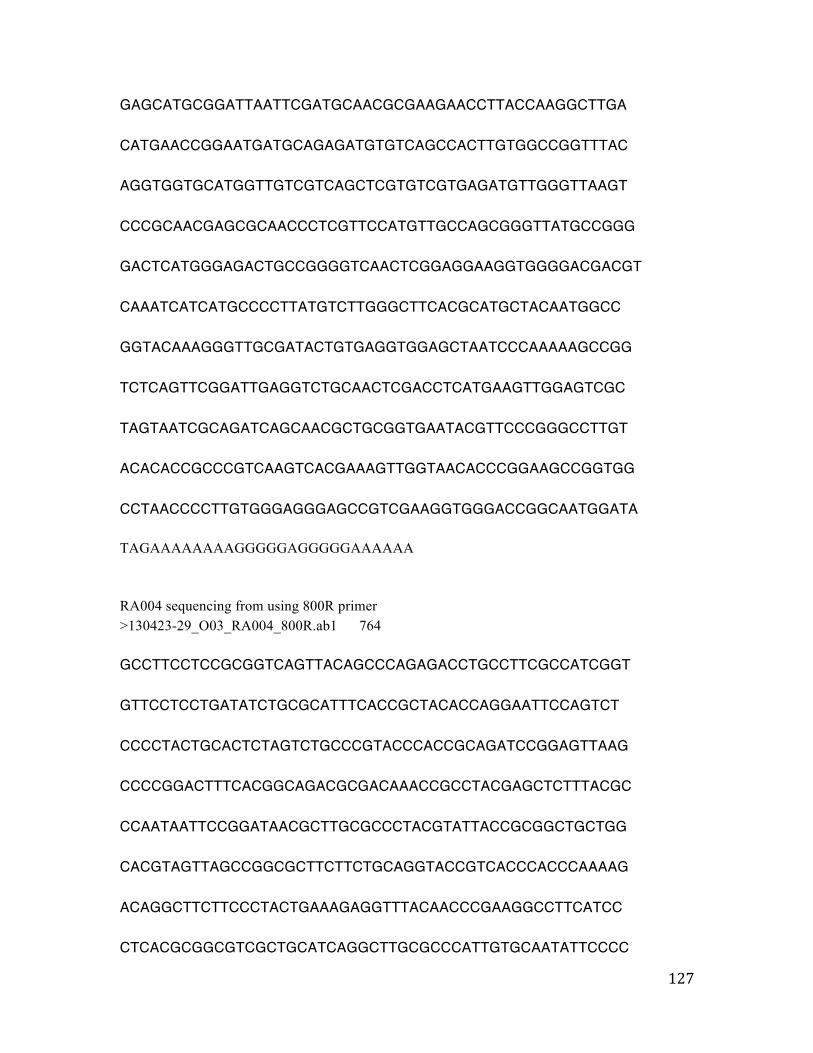
127
GAGCATGCGGATTAATTCGATGCAACGCGAAGAACCTTACCAAGGCTTGA CATGAACCGGAATGATGCAGAGATGTGTCAGCCACTTGTGGCCGGTTTAC AGGTGGTGCATGGTTGTCGTCAGCTCGTGTCGTGAGATGTTGGGTTAAGT CCCGCAACGAGCGCAACCCTCGTTCCATGTTGCCAGCGGGTTATGCCGGG GACTCATGGGAGACTGCCGGGGTCAACTCGGAGGAAGGTGGGGACGACGT CAAATCATCATGCCCCTTATGTCTTGGGCTTCACGCATGCTACAATGGCC GGTACAAAGGGTTGCGATACTGTGAGGTGGAGCTAATCCCAAAAAGCCGG TCTCAGTTCGGATTGAGGTCTGCAACTCGACCTCATGAAGTTGGAGTCGC TAGTAATCGCAGATCAGCAACGCTGCGGTGAATACGTTCCCGGGCCTTGT ACACACCGCCCGTCAAGTCACGAAAGTTGGTAACACCCGGAAGCCGGTGG CCTAACCCCTTGTGGGAGGGAGCCGTCGAAGGTGGGACCGGCAATGGATA TAGAAAAAAAAGGGGGAGGGGGAAAAAA RA004 sequencing from using 800R primer > �130423-29_ �O03_ �RA004_ �800R.ab1 764 GCCTTCCTCCGCGGTCAGTTACAGCCCAGAGACCTGCCTTCGCCATCGGT GTTCCTCCTGATATCTGCGCATTTCACCGCTACACCAGGAATTCCAGTCT CCCCTACTGCACTCTAGTCTGCCCGTACCCACCGCAGATCCGGAGTTAAG CCCCGGACTTTCACGGCAGACGCGACAAACCGCCTACGAGCTCTTTACGC CCAATAATTCCGGATAACGCTTGCGCCCTACGTATTACCGCGGCTGCTGG CACGTAGTTAGCCGGCGCTTCTTCTGCAGGTACCGTCACCCACCCAAAAG ACAGGCTTCTTCCCTACTGAAAGAGGTTTACAACCCGAAGGCCTTCATCC CTCACGCGGCGTCGCTGCATCAGGCTTGCGCCCATTGTGCAATATTCCCC
128
ACTGCTGCCTCCCGTAGGAGTCTGGGCCGTGTCTCAGTCCCAGTGTGGCC GGTCACCCTCTCAGGCCGGCTACCCGTCGTCGCCTTGGTAGGCCATTACC CCACCAACAAGCTGATAGGCCGCGAGTCCATCCAAAACCACAAAAGCTTT CCACCAACATGGCATGCGCCAGAAGGTCGTATCCAGTATTAGACCCGGTT TCCCAGGCTTATCCCAGAGTCAAGGGCAGGTTACTCACGTGTTACTCACC CGTTCGCCACTAATCCCCCCACAAGTGAGGTTCATCGTTCGACTTGCATG TGTTAAGCACGCCGCCAGCGTTCATCCTGAGCCTGACCCAAAAATTCAAA AAAGACCGCAACCC
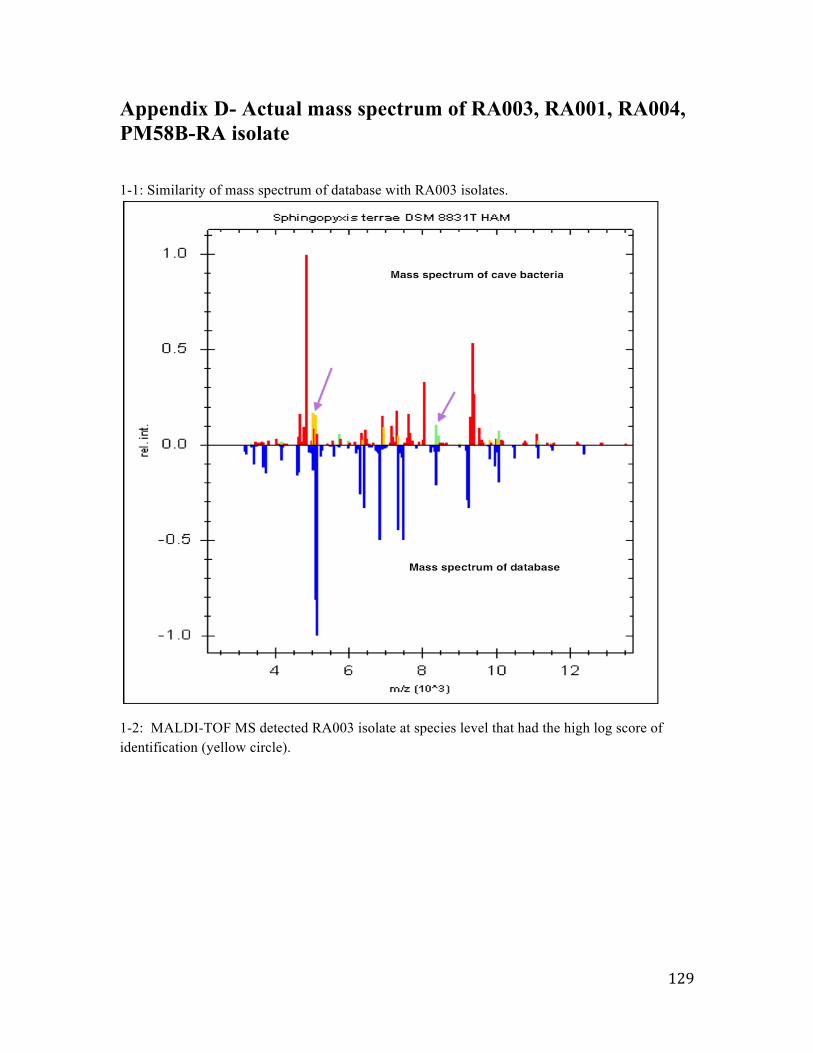
129
Appendix D- Actual mass spectrum of RA003, RA001, RA004, PM58B-RA isolate
1-1: Similarity of mass spectrum of database with RA003 isolates.
1-2: MALDI-TOF MS detected RA003 isolate at species level that had the high log score of identification (yellow circle).
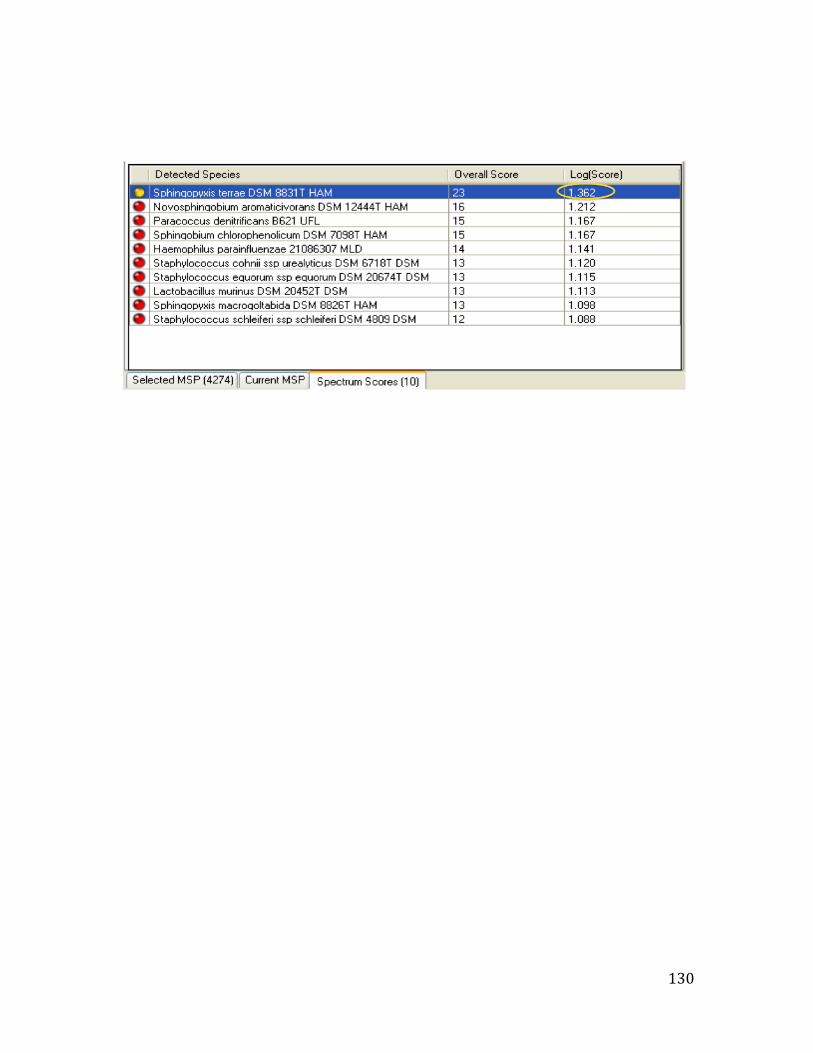
130
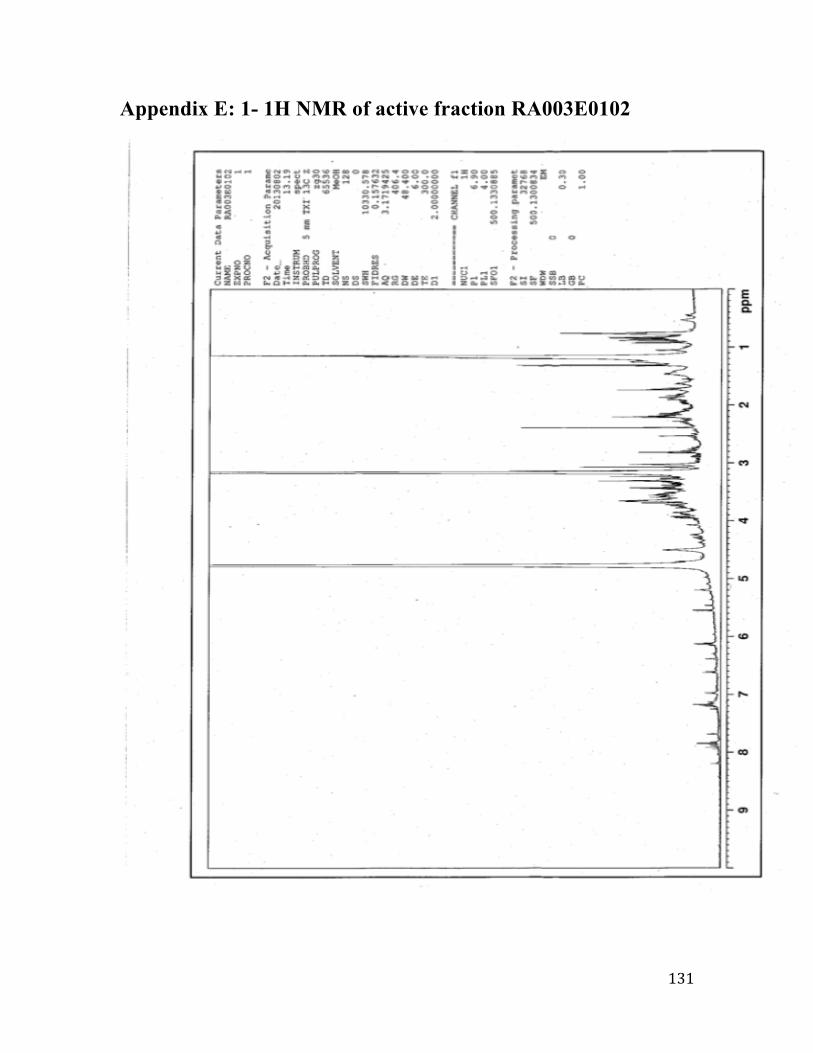
131
Appendix E: 1- 1H NMR of active fraction RA003E0102
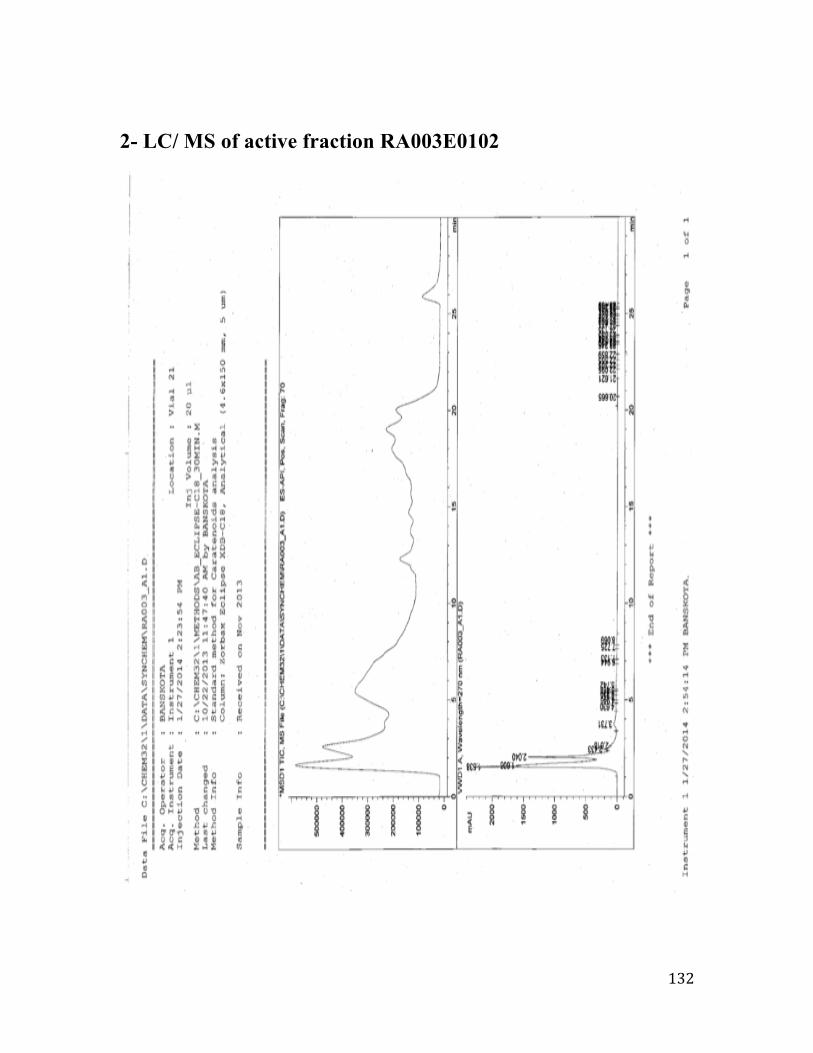
132
2- LC/ MS of active fraction RA003E0102

133
Appendix C- (continued) isolates’ sequencing results.
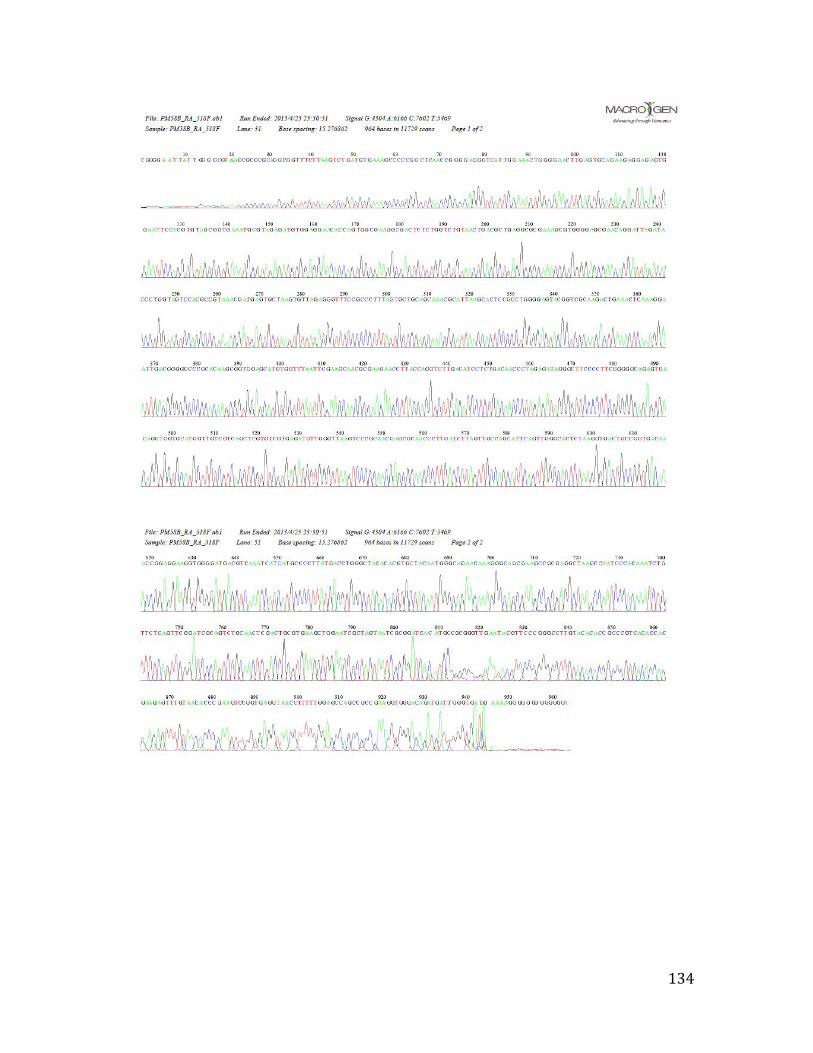
134
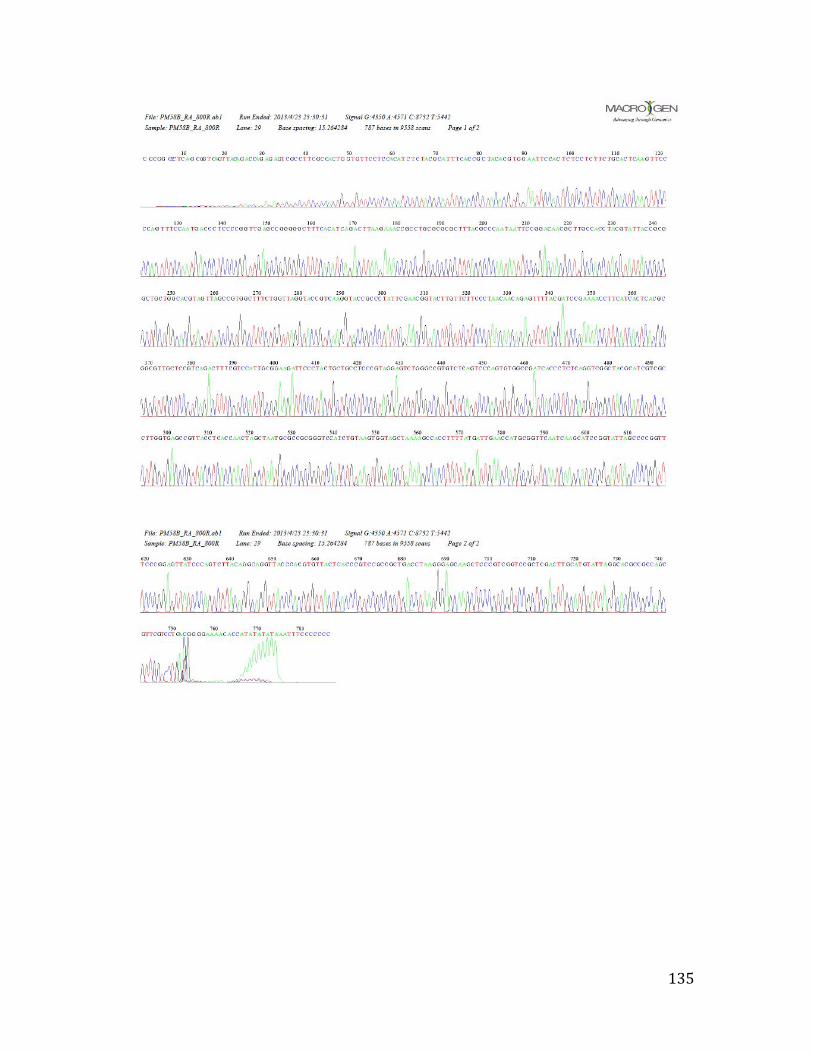
135
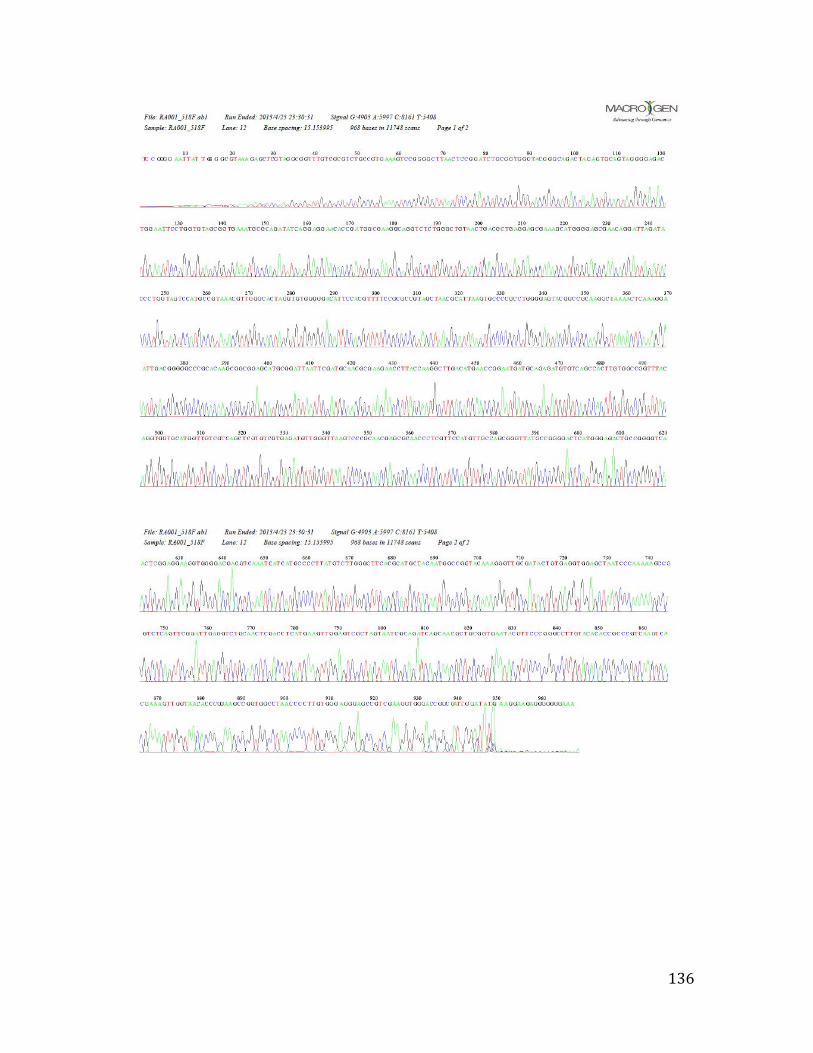
136
137
138
139
140
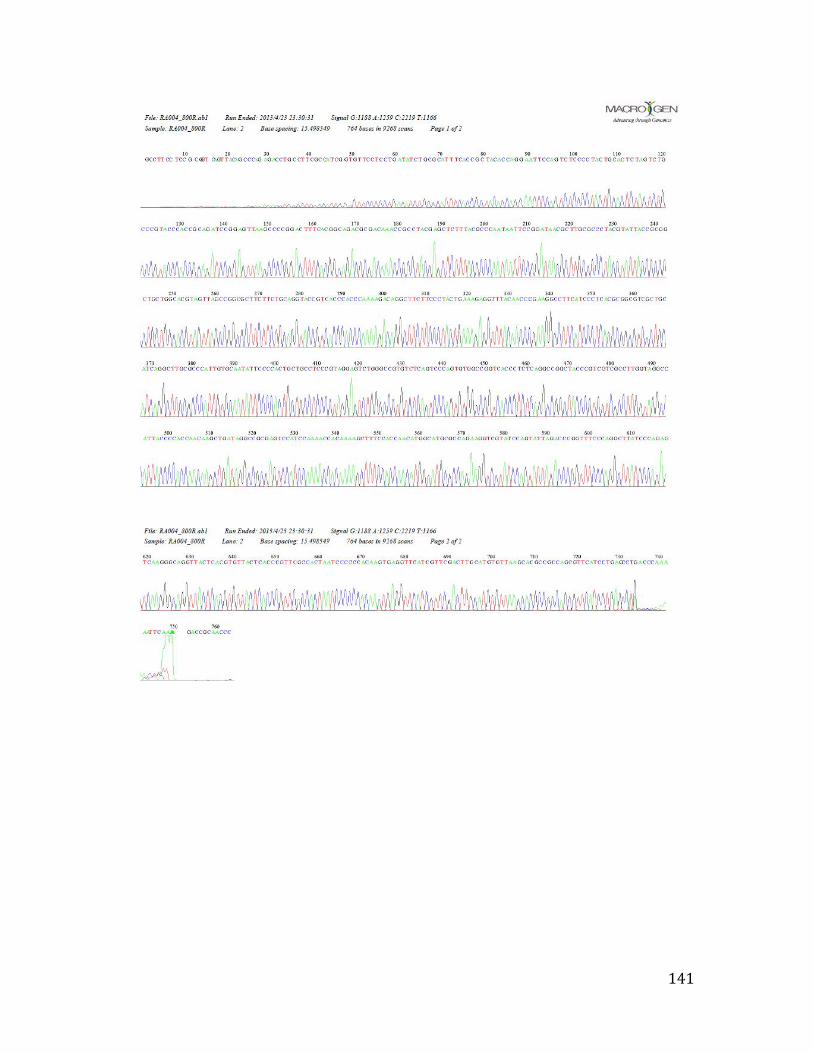
141