Embed Size (px)
Citation preview
Potential of Low Energy Housing Retrofit: INSIGHTS FROM BUILDING STOCK ANALYSIS
Authors W. Hilderson, E. Mlecnik, J. Cré (Passiefhuis-Platform vzw)
D/XXXX/XXXX/XX (to complete by Belspo) Published in 200X by the Belgian Science Policy Rue de la Science 8 Wetenschapsstraat 8 B-1000 Brussels Belgium Tel: +32 (0)2 238 34 11 – Fax: +32 (0)2 230 59 12 http://www.belspo.be Contact person: Anna Calderone Secretariat: +32 (0)2 238 34 80 Neither the Belgian Science Policy nor any person acting on behalf of the Belgian Science Policy is responsible for the use which might be made of the following information. The authors are responsible for the content. No part of this publication may be reproduced, stored in a retrieval system, or transmitted in any form or by any means, electronic, mechanical, photocopying, recording, or otherwise, without indicating the reference : Hilderson, W., Mlecnik, E., Cré, J., Potential of Low Energy Housing Retrofit, Final Report Low Energy Housing Retrofit (LEHR), Belgian Science Policy (Programme to stimulate knowledge transfer in areas of strategic importance – TAP2), Brussels, 2010, xx p.
2
This research was carried out in the framework of LEHR ‐ Low Energy Housing Retrofit, a project grouping three research teams (PHP/PMP, Architecture et Climat – UCL, WTCB), on account of the Belgian Federal Science Policy, executing the “Programme to stimulate knowledge transfer in areas of strategic importance”.
3

4
T A B L E O F C O N T E N T
1. Introduction ............................................................................................................................8 1.1. Goal ..........................................................................................................................8 1.2. Research question....................................................................................................8 1.3. Research methodology.............................................................................................8
2. General characteristics of the belgian building stock ............................................................9 2.1. Lessons from building stock analysis studies...........................................................9 2.2. Number of existing dwellings: geographical dispersion and evolution ...................10 2.3. Building type and evolution.....................................................................................11 2.4. Building age and transformation of the building stock............................................15
3. Motivation for renovation .....................................................................................................19 3.1. Floor space per dwelling and evolution ..................................................................19 3.2. Quality of residences ..............................................................................................21 3.3. Comfort of residences ............................................................................................22 3.4. Choice of location: quality of life, proximity to services ..........................................25
4. Energy characteristics of the building stock ........................................................................28 4.1. Residential energy use and evolution ....................................................................28 4.2. Heating of dwellings and evolution.........................................................................30 4.3. Thermal insulation properties of buildings..............................................................33 4.4. Other construction related trends ...........................................................................33
5. Potential of the existing housing stock to reduce energy ....................................................34 5.1. General considerations...........................................................................................34 5.2. A case study for the Brussels Region.....................................................................36 5.3. Proposed building typologies for further research..................................................37
6. Market segmentation for low energy housing retrofit ..........................................................42 6.1. Ownership of dwellings and evolution ....................................................................42 6.2. Deciding factors ......................................................................................................46
7. Summary and conclusions ..................................................................................................47 7.1. Policy deciding parameters ....................................................................................47 7.2. Different building types require different types of retrofit........................................47 7.3. A target group oriented approach is required.........................................................48 7.4. Energy policy should reinforce and broaden best practice energy efficient renovation ............................................................................................................................48
8. References ..........................................................................................................................49
5
PROJECT LEHR: LOW ENERGY HOUSING RETROFIT Up to 35% of the total energy consumption can be attributed to built-up areas, most of which are situated in the residential sector. Consequently the renovation of existing buildings contributes a vast potential for energy economy. Example projects indicate that consumption can be reduced up tot five times while improving living conditions simultaneously. The LEHR project was a cooperation between three research teams:
• Passiefhuis Platform vzw (PHP), Plat-forme Passive asbl • Architecture et Climate, UCL • BBRI
The coordination of this project was done by PHP. The purpose of this project was to:
• identify highly successful renovations by means of a network of national and international experts
• systematically collect core information on the design, realization and performance of such renovations
• compile a manual for owners and architects • elaborate technical safety documents aimed at construction professionals • publish the obtained perceptions in one volume
The project started with an analysis of the existing building stock in order to identify those building segments which may have the largest multiplier effect for energy economy. To this extent a number of example projects were analyzed. Important in this matter is the energetic performance and the owners motivation to proceed to the renovation. Based on both these experiences and the most up-to-date research developments, new innovative concepts and components were developed. Insights resulting from International co-operation (Participation in IEA SHC Task 37 and observation of the European project E-RETROFIT-KIT) were translated to national users, using a deliberate strategy to extend the market penetration of complex renovations. As a result of this project several directives were formed by the different partners:
• The UCL introduced the very low-energy renovation to the owners in form of a general publication
• The BBRI generated a technical manual to persuade the construction industry of the feasibility of very low-energy renovation
• PHP produced several publications and project files which inform planners and developers on the experiences with the example projects.
This research was carried out by order of the Belgian Science Policy, in implementation of the “ Programme to stimulate knowledge transfer in areas of strategic importance”
6

7
P O T E N T I A L O F L O W E N E R G Y H O U S I N G R E T R O F I T : I N S I G H T S F R O M B U I L D I N G S T O C K A N A L Y S I S
1 . I N T R O D U C T I O N
1 . 1 . G O A L
This chapter explores the significance and the relevance of the existing building stock in Belgium concerning energy consumption. This information is crucial for developing strategies for low energy housing retrofit. To implement an efficient energy saving policy for retrofit, it is important to define and evaluate different dwelling types with a high energy saving potential. They depend on many variables such as building form, building age, ownership, geography etc. These variables have a great impact on technical issues, decision processes and government policy. This information should clarify the validity of the intended goal of the LEHR project to use these dwelling types to study retrofit scenarios that support ambitious and long term goals and marketing aimed at decision makers and politicians.
1 . 2 . R E S E A R C H Q U E S T I O N
The main question of this chapter is: For what type of buildings should low energy housing retrofit demonstration projects be initiated and stimulated? To examine this question we examine several secondary questions:
- What can we learn from available data considering the raw need for renovation? - What can we learn from available data on energy characteristics of the existing building
stock? - What target groups can be defined, based on evaluation of building typology and ownership
structures?
1 . 3 . R E S E A R C H M E T H O D O L O G Y
In the following chapter we will have a closer look at the available statistics for the residential sector, specifically concerning the general characteristics of the building stock. In chapter 3, Motivation for renovation, we will discuss factors that provide a need for renovation of the existing housing stock, based on quality and comfort indicators. A focus on the energy characteristics of the existing building stock will be held in chapter 4. In the fifth chapter, we discuss the potential of the existing housing stock to reduce energy use, based on the available data. Building typologies with the greatest potential for reduction of energy use and/or greenhouse gas emissions by renovation are defined. After this discussion, we define different target groups for reducing the energy saving potential in the existing housing stock. Therefore we look at available statistical data considering ownership. This allows us to formulate market segments.
8
2 . G E N E R A L C H A R A C T E R I S T I C S O F T H E B E L G I A N B U I L D I N G S T O C K
2 . 1 . L E S S O N S F R O M B U I L D I N G S T O C K A N A L Y S I S S T U D I E S
The research field of basic building stock analysis is still developing in Europe. In the past, the building stock as a whole has not been analysed in a systematic way and knowledge of the building stock varies widely between professionals and between countries. [KOHL02] The ERABUILD-report concluded that - except for the International Energy Agency and Eurostat - data, definitions and methods used in national statistics for the residential sector differ in each country, which is not favourable for accurate comparisons between countries. [ERAB08] In Europe, housing surveys have been the traditional approach to gathering knowledge about the building stock [WILH82], [ODEL88]. Their origin is the planning and assessment of state interventions in (social) housing. Traditional research approaches have typically concentrated on specific parts of the stock, with limited objectives and little attempt to generalize findings [KOHL02] The need to predict refurbishment demand, driven by energy questions, led to public and private studies in most European countries about the probable evolution of the building stock refurbishment and the impact on building products and services. [IEA95] Energy-based models generally divide the building stock into age-groups represented by typical buildings which are rated for specific annual energy consumption per m2. The surface of each age-use group is then multiplied by the specific annual energy consumption to predict the overall consumption. However, energy related typologies and building descriptions are of limited use for broader building stock knowledge development. See further: [KOHL02]. Implementation of sustainable development requires integration of economic, ecological, social and cultural value spheres as a central requirement. The further sections provide insight in the data that are currently available considering the Belgian building stock. These date mainly originate from traditional housing surveys: energy questions are often still not integrated, therefore the energy related data are often limited. In this chapter, a review and examination of statistical data is provided from the federal government (Belgium) and the Belgian regions (Flanders, Wallonia, Brussels capital region). The most important data in this study come from: o Socio economical enquiry 2001, or SEE2001, a statistical sample of 2% of Belgian population
and partially based on data of the whole population: [VANE07] o Flemish survey on dwellings 2005, a survey on 5216 families: [HEYL07] o A survey on residential energy consumption in Belgium with a representative sample of 1000
families in 2004: [BART05] o External study of housing quality by AROHM, 1995 with a representative sample of 8500
dwellings: [LROY06] o Surveys in 1961 (sample of 70000 dwellings), 1978 (300000 dwellings): [LROY06] and others The sources can be considered as an important limitation since there is a lack of reliable data in function of building typology and degree of renovation. Nevertheless, we provided insights into the proposed questions, based on available data. The last two questions are tackled by analysis of the previous data and also use findings from other research: insights from international collaboration (participation in IEA SHC Task 37 and observing European project E-RETROFIT-KIT) have been examined and integrated with national findings (study for the Brussels Capital Region and for the Walloon Region, social economic enquiries) and in order to define building typologies and target groups for diffusion of low energy housing retrofit.
9
2 . 2 . N U M B E R O F E X I S T I N G D W E L L I N G S : G E O G R A P H I C A L D I S P E R S I O N A N D E V O L U T I O N
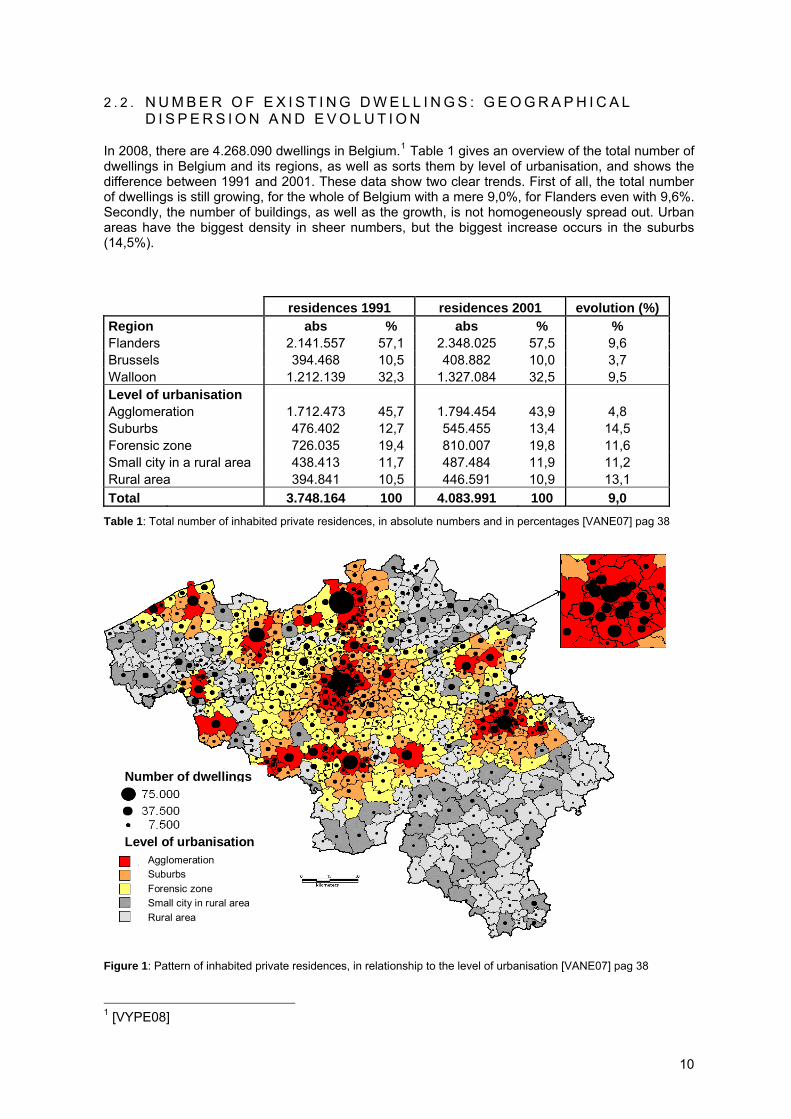
In 2008, there are 4.268.090 dwellings in Belgium.1 Table 1 gives an overview of the total number of dwellings in Belgium and its regions, as well as sorts them by level of urbanisation, and shows the difference between 1991 and 2001. These data show two clear trends. First of all, the total number of dwellings is still growing, for the whole of Belgium with a mere 9,0%, for Flanders even with 9,6%. Secondly, the number of buildings, as well as the growth, is not homogeneously spread out. Urban areas have the biggest density in sheer numbers, but the biggest increase occurs in the suburbs (14,5%). residences 1991 residences 2001 evolution (%) Region abs % abs % % Flanders 2.141.557 57,1 2.348.025 57,5 9,6 Brussels 394.468 10,5 408.882 10,0 3,7 Walloon 1.212.139 32,3 1.327.084 32,5 9,5 Level of urbanisation Agglomeration 1.712.473 45,7 1.794.454 43,9 4,8 Suburbs 476.402 12,7 545.455 13,4 14,5 Forensic zone 726.035 19,4 810.007 19,8 11,6 Small city in a rural area 438.413 11,7 487.484 11,9 11,2 Rural area 394.841 10,5 446.591 10,9 13,1 Total 3.748.164 100 4.083.991 100 9,0
Table 1: Total number of inhabited private residences, in absolute numbers and in percentages [VANE07] pag 38
Number of dwellings
Level of urbanisation Agglomeration Suburbs Forensic zone Small city in rural area Rural area
Figure 1: Pattern of inhabited private residences, in relationship to the level of urbanisation [VANE07] pag 38 1 [VYPE08]
10
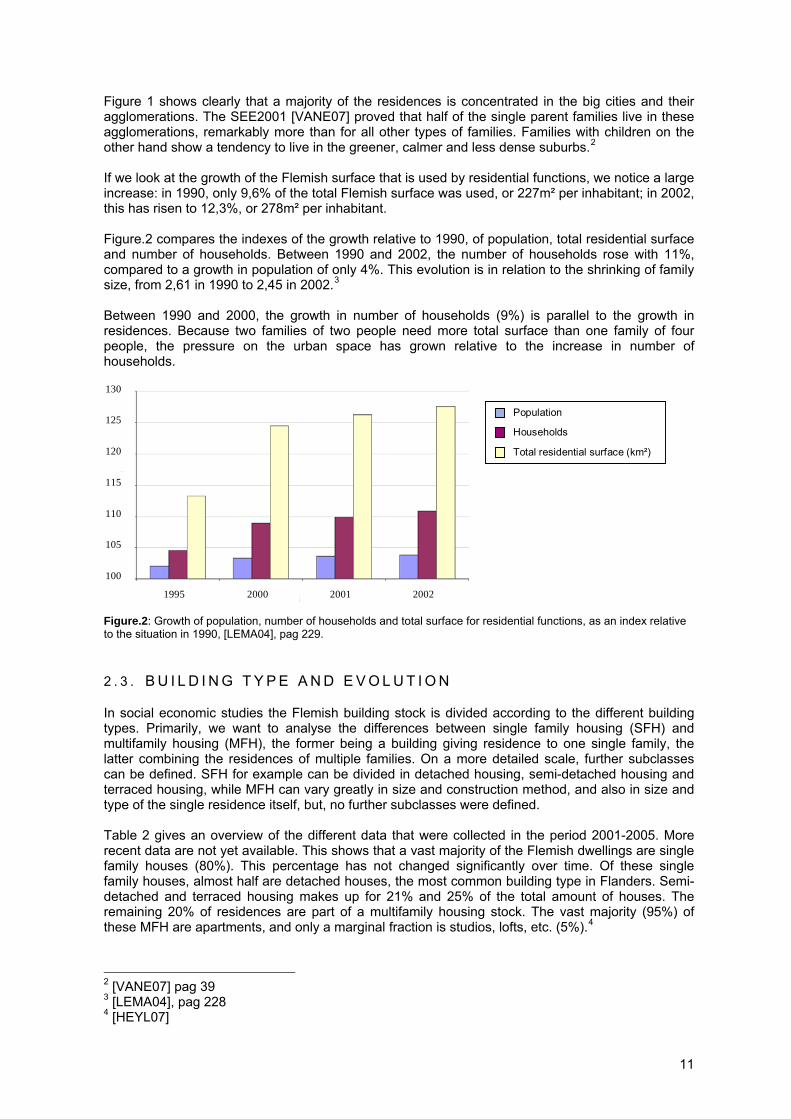
Figure 1 shows clearly that a majority of the residences is concentrated in the big cities and their agglomerations. The SEE2001 [VANE07] proved that half of the single parent families live in these agglomerations, remarkably more than for all other types of families. Families with children on the other hand show a tendency to live in the greener, calmer and less dense suburbs.2
If we look at the growth of the Flemish surface that is used by residential functions, we notice a large increase: in 1990, only 9,6% of the total Flemish surface was used, or 227m² per inhabitant; in 2002, this has risen to 12,3%, or 278m² per inhabitant. Figure.2 compares the indexes of the growth relative to 1990, of population, total residential surface and number of households. Between 1990 and 2002, the number of households rose with 11%, compared to a growth in population of only 4%. This evolution is in relation to the shrinking of family size, from 2,61 in 1990 to 2,45 in 2002.3
Between 1990 and 2000, the growth in number of households (9%) is parallel to the growth in residences. Because two families of two people need more total surface than one family of four people, the pressure on the urban space has grown relative to the increase in number of households. 130
125
120
115
110
105
100
2000 2002 2001 1995
Population
Households
Total residential surface (km²)
Figure.2: Growth of population, number of households and total surface for residential functions, as an index relative to the situation in 1990, [LEMA04], pag 229.
2 . 3 . B U I L D I N G T Y P E A N D E V O L U T I O N
In social economic studies the Flemish building stock is divided according to the different building types. Primarily, we want to analyse the differences between single family housing (SFH) and multifamily housing (MFH), the former being a building giving residence to one single family, the latter combining the residences of multiple families. On a more detailed scale, further subclasses can be defined. SFH for example can be divided in detached housing, semi-detached housing and terraced housing, while MFH can vary greatly in size and construction method, and also in size and type of the single residence itself, but, no further subclasses were defined. Table 2 gives an overview of the different data that were collected in the period 2001-2005. More recent data are not yet available. This shows that a vast majority of the Flemish dwellings are single family houses (80%). This percentage has not changed significantly over time. Of these single family houses, almost half are detached houses, the most common building type in Flanders. Semi-detached and terraced housing makes up for 21% and 25% of the total amount of houses. The remaining 20% of residences are part of a multifamily housing stock. The vast majority (95%) of these MFH are apartments, and only a marginal fraction is studios, lofts, etc. (5%).4
2 [VANE07] pag 39 3 [LEMA04], pag 228 4 [HEYL07]
11
2005 2001 1995/19985
SFH 79,9% 79,5% 84,4% - Detached 33,6% 36,3% 38,3% - Semi-detached 20,7% 20,5% 22,5% - Terraced housing 25,6% 22,7% 23,6% MFH 19,9% 20,0% 15,1% other 0,2% 0,5% 5,0%
Table 2: Overview of data regarding building type distribution in Flanders [APS07A] These average values show some significant geographical variations, as illustrated in table 3. This table shows the dense building in the agglomerations of big and regional cities. As could be expected, apartment buildings are concentrated in these urban areas, while semi-detached and detached housing is less common than average. In Ghent for example 64% of the inhabitants live in a SFH, compared to an average over Flanders of 80%. In Antwerp this drops even further to 39%.6
Detached Semi-
detached Terraced Apart-ments Total
1991 15,5% 11,9% 28,4% 44,2% 100,0% 2001 13,7% 12,7% 28,1% 45,5% 100,0%
Agglomeration of big and regional cities evolution -1,9% +0,8% -0,3% +1,3%
1991 51,9% 20,1% 16,0% 12,0% 100,0% 2001 50,8% 20,1% 14,9% 14,2% 100,0%
Suburbs
evolution -1,1% 0,0% -1,1% +2,2% 1991 41,2% 21,6% 25,1% 12,0% 100,0% 2001 41,2% 22,0% 21,8% 15,0% 100,0%
Commuter zone
evolution -0,1% +0,4% -3,3% +2,9% 1991 39,1% 18,2% 27,1% 15,5% 100,0% 2001 39,4% 18,5% 23,2% 18,9% 100,0%
Small cities in rural areas
evolution +0,2% +0,3% -4,0% +3,4% 1991 55,8% 19,1% 15,8% 9,2% 100,0% 2001 55,1% 19,7% 13,9% 11,3% 100,0%
Rural areas
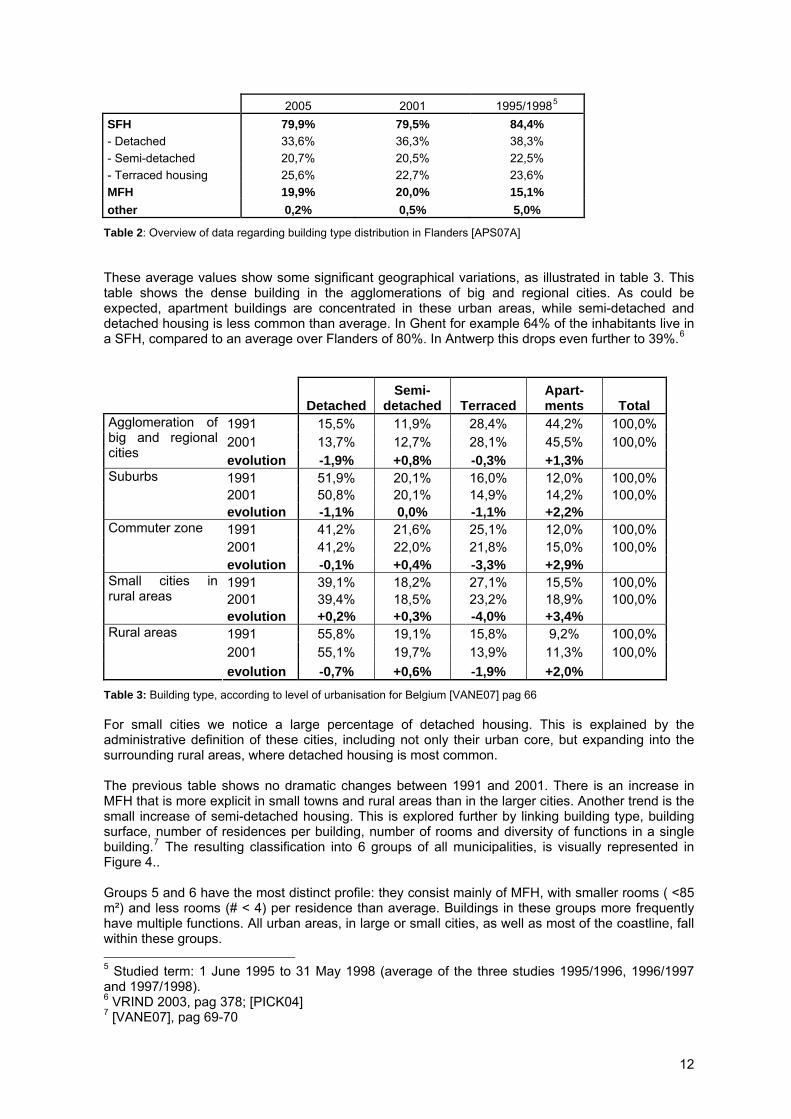
evolution -0,7% +0,6% -1,9% +2,0% Table 3: Building type, according to level of urbanisation for Belgium [VANE07] pag 66 For small cities we notice a large percentage of detached housing. This is explained by the administrative definition of these cities, including not only their urban core, but expanding into the surrounding rural areas, where detached housing is most common. The previous table shows no dramatic changes between 1991 and 2001. There is an increase in MFH that is more explicit in small towns and rural areas than in the larger cities. Another trend is the small increase of semi-detached housing. This is explored further by linking building type, building surface, number of residences per building, number of rooms and diversity of functions in a single building.7 The resulting classification into 6 groups of all municipalities, is visually represented in Figure 4.. Groups 5 and 6 have the most distinct profile: they consist mainly of MFH, with smaller rooms ( <85 m²) and less rooms (# < 4) per residence than average. Buildings in these groups more frequently have multiple functions. All urban areas, in large or small cities, as well as most of the coastline, fall within these groups. 5 Studied term: 1 June 1995 to 31 May 1998 (average of the three studies 1995/1996, 1996/1997 and 1997/1998). 6 VRIND 2003, pag 378; [PICK04] 7 [VANE07], pag 69-70
12
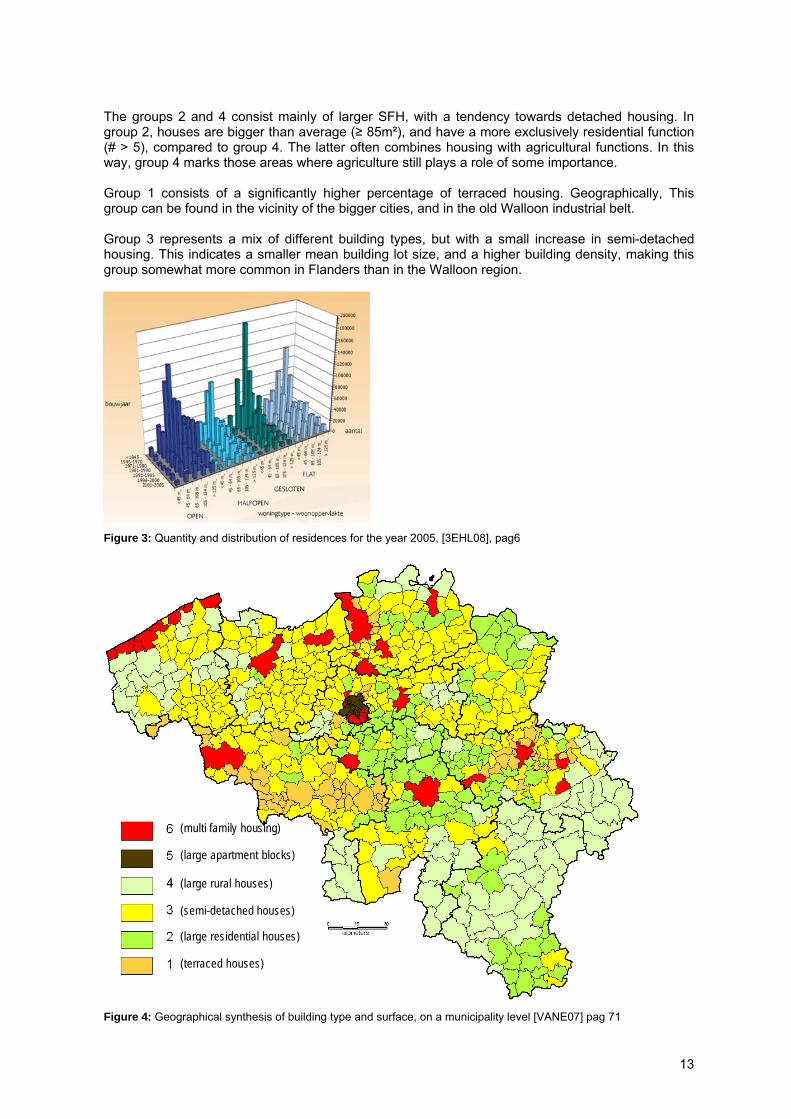
The groups 2 and 4 consist mainly of larger SFH, with a tendency towards detached housing. In group 2, houses are bigger than average (≥ 85m²), and have a more exclusively residential function (# > 5), compared to group 4. The latter often combines housing with agricultural functions. In this way, group 4 marks those areas where agriculture still plays a role of some importance. Group 1 consists of a significantly higher percentage of terraced housing. Geographically, This group can be found in the vicinity of the bigger cities, and in the old Walloon industrial belt. Group 3 represents a mix of different building types, but with a small increase in semi-detached housing. This indicates a smaller mean building lot size, and a higher building density, making this group somewhat more common in Flanders than in the Walloon region.
Figure 3: Quantity and distribution of residences for the year 2005, [3EHL08], pag6
(multi family housing)
(large apartment blocks)
(large rural houses)
(semi-detached houses)
(large residential houses)
(terraced houses)
Figure 4: Geographical synthesis of building type and surface, on a municipality level [VANE07] pag 71
13
The coastline takes a special position. Due to the pressure on real estate by the tourist market, MFH are overrepresented. On a provincial level, Antwerp takes a special position in Flanders. Here the large suburban zone around the city of Antwerp results in a significantly more than average percentage of MFH for the whole of the province.8
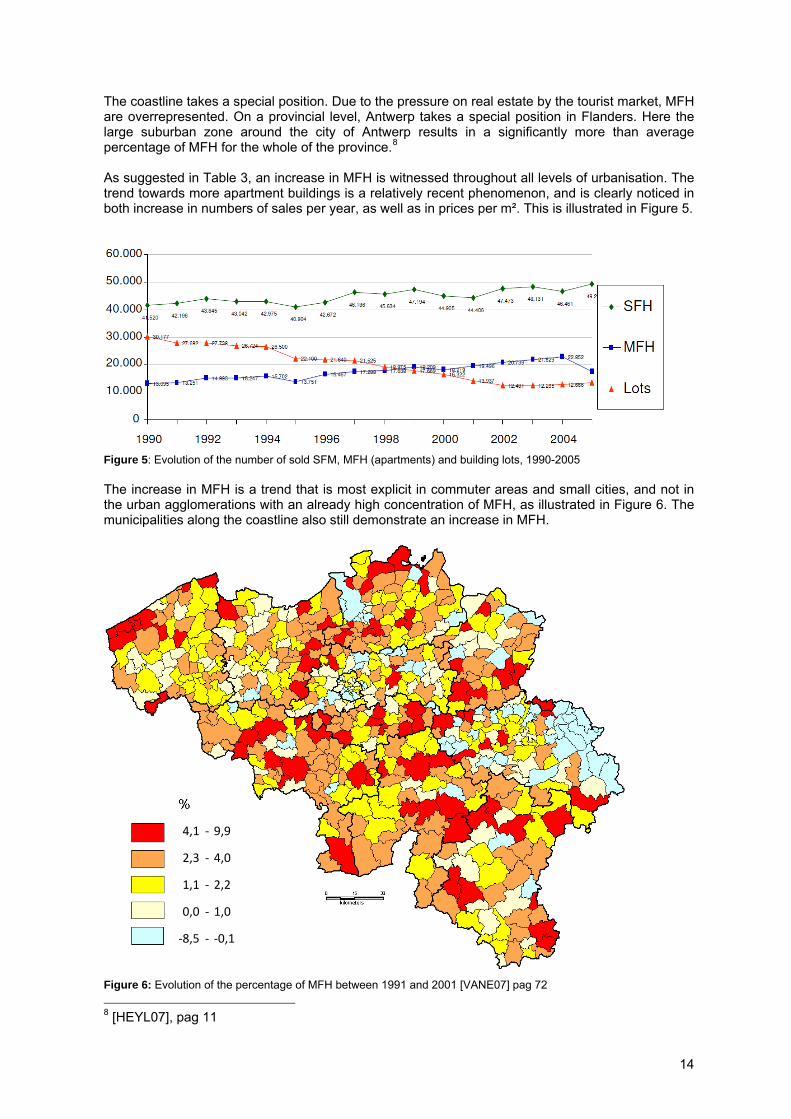
As suggested in Table 3, an increase in MFH is witnessed throughout all levels of urbanisation. The trend towards more apartment buildings is a relatively recent phenomenon, and is clearly noticed in both increase in numbers of sales per year, as well as in prices per m². This is illustrated in Figure 5.
Figure 5: Evolution of the number of sold SFM, MFH (apartments) and building lots, 1990-2005 The increase in MFH is a trend that is most explicit in commuter areas and small cities, and not in the urban agglomerations with an already high concentration of MFH, as illustrated in Figure 6. The municipalities along the coastline also still demonstrate an increase in MFH.
‐
‐
‐
‐
‐
9,9
4,0
2,2
1,0
‐0,1
4,1
2,3
1,1
0,0
‐8,5
Figure 6: Evolution of the percentage of MFH between 1991 and 2001 [VANE07] pag 72 8 [HEYL07], pag 11
14
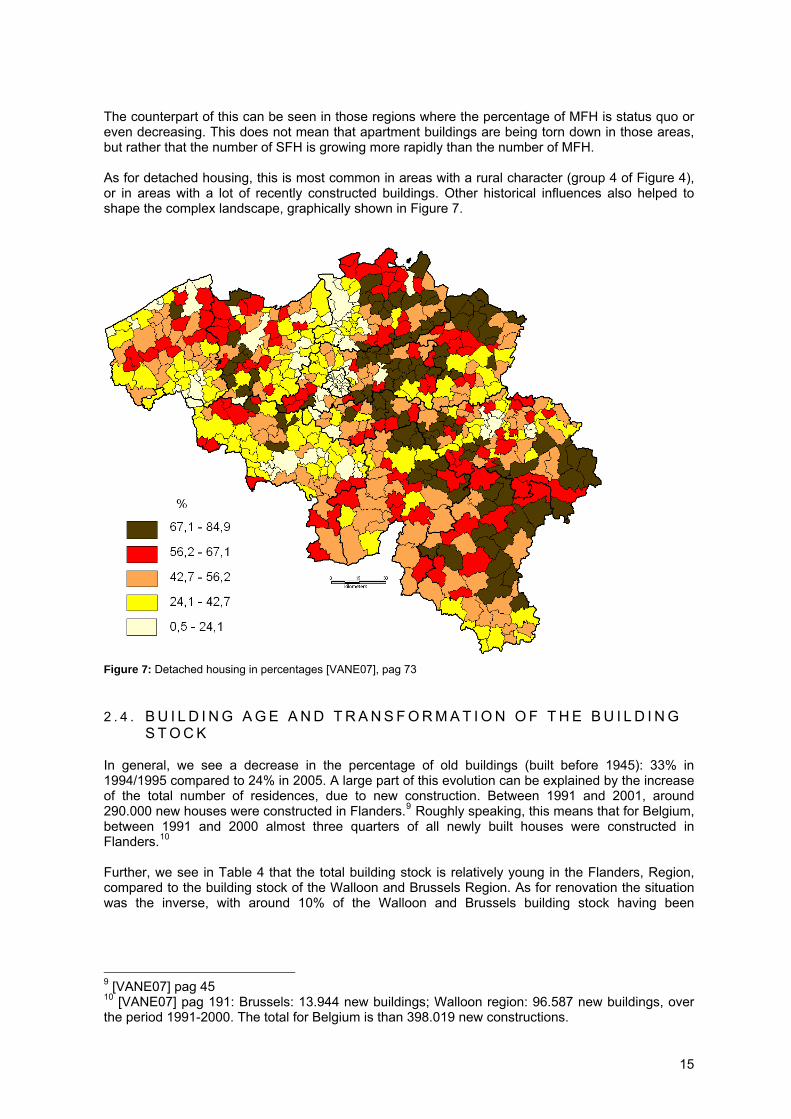
The counterpart of this can be seen in those regions where the percentage of MFH is status quo or even decreasing. This does not mean that apartment buildings are being torn down in those areas, but rather that the number of SFH is growing more rapidly than the number of MFH. As for detached housing, this is most common in areas with a rural character (group 4 of Figure 4), or in areas with a lot of recently constructed buildings. Other historical influences also helped to shape the complex landscape, graphically shown in Figure 7.
Figure 7: Detached housing in percentages [VANE07], pag 73
2 . 4 . B U I L D I N G A G E A N D T R A N S F O R M A T I O N O F T H E B U I L D I N G S T O C K
In general, we see a decrease in the percentage of old buildings (built before 1945): 33% in 1994/1995 compared to 24% in 2005. A large part of this evolution can be explained by the increase of the total number of residences, due to new construction. Between 1991 and 2001, around 290.000 new houses were constructed in Flanders.9 Roughly speaking, this means that for Belgium, between 1991 and 2000 almost three quarters of all newly built houses were constructed in Flanders.10
Further, we see in Table 4 that the total building stock is relatively young in the Flanders, Region, compared to the building stock of the Walloon and Brussels Region. As for renovation the situation was the inverse, with around 10% of the Walloon and Brussels building stock having been
9 [VANE07] pag 45 10 [VANE07] pag 191: Brussels: 13.944 new buildings; Walloon region: 96.587 new buildings, over the period 1991-2000. The total for Belgium is than 398.019 new constructions.
15
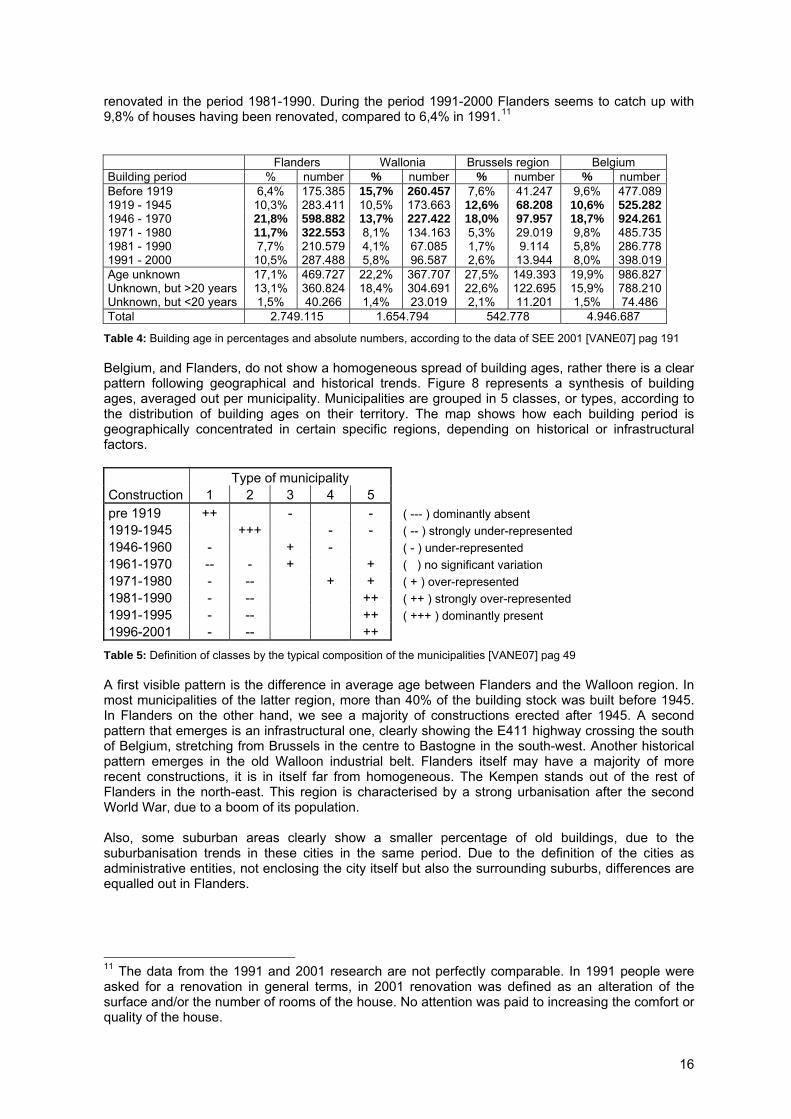
renovated in the period 1981-1990. During the period 1991-2000 Flanders seems to catch up with 9,8% of houses having been renovated, compared to 6,4% in 1991.11
Flanders Wallonia Brussels region Belgium Building period % number % number % number % numberBefore 1919 6,4% 175.385 15,7% 260.457 7,6% 41.247 9,6% 477.0891919 - 1945 10,3% 283.411 10,5% 173.663 12,6% 68.208 10,6% 525.2821946 - 1970 21,8% 598.882 13,7% 227.422 18,0% 97.957 18,7% 924.2611971 - 1980 11,7% 322.553 8,1% 134.163 5,3% 29.019 9,8% 485.7351981 - 1990 7,7% 210.579 4,1% 67.085 1,7% 9.114 5,8% 286.7781991 - 2000 10,5% 287.488 5,8% 96.587 2,6% 13.944 8,0% 398.019Age unknown 17,1% 469.727 22,2% 367.707 27,5% 149.393 19,9% 986.827Unknown, but >20 years 13,1% 360.824 18,4% 304.691 22,6% 122.695 15,9% 788.210Unknown, but <20 years 1,5% 40.266 1,4% 23.019 2,1% 11.201 1,5% 74.486 Total 2.749.115 1.654.794 542.778 4.946.687
Table 4: Building age in percentages and absolute numbers, according to the data of SEE 2001 [VANE07] pag 191 Belgium, and Flanders, do not show a homogeneous spread of building ages, rather there is a clear pattern following geographical and historical trends. Figure 8 represents a synthesis of building ages, averaged out per municipality. Municipalities are grouped in 5 classes, or types, according to the distribution of building ages on their territory. The map shows how each building period is geographically concentrated in certain specific regions, depending on historical or infrastructural factors. Type of municipality Construction 1 2 3 4 5 pre 1919 ++ - - ( --- ) dominantly absent 1919-1945 +++ - - ( -- ) strongly under-represented 1946-1960 - + - ( - ) under-represented 1961-1970 -- - + + ( ) no significant variation 1971-1980 - -- + + ( + ) over-represented 1981-1990 - -- ++ ( ++ ) strongly over-represented 1991-1995 - -- ++ ( +++ ) dominantly present 1996-2001 - -- ++
Table 5: Definition of classes by the typical composition of the municipalities [VANE07] pag 49 A first visible pattern is the difference in average age between Flanders and the Walloon region. In most municipalities of the latter region, more than 40% of the building stock was built before 1945. In Flanders on the other hand, we see a majority of constructions erected after 1945. A second pattern that emerges is an infrastructural one, clearly showing the E411 highway crossing the south of Belgium, stretching from Brussels in the centre to Bastogne in the south-west. Another historical pattern emerges in the old Walloon industrial belt. Flanders itself may have a majority of more recent constructions, it is in itself far from homogeneous. The Kempen stands out of the rest of Flanders in the north-east. This region is characterised by a strong urbanisation after the second World War, due to a boom of its population. Also, some suburban areas clearly show a smaller percentage of old buildings, due to the suburbanisation trends in these cities in the same period. Due to the definition of the cities as administrative entities, not enclosing the city itself but also the surrounding suburbs, differences are equalled out in Flanders.
11 The data from the 1991 and 2001 research are not perfectly comparable. In 1991 people were asked for a renovation in general terms, in 2001 renovation was defined as an alteration of the surface and/or the number of rooms of the house. No attention was paid to increasing the comfort or quality of the house.
16
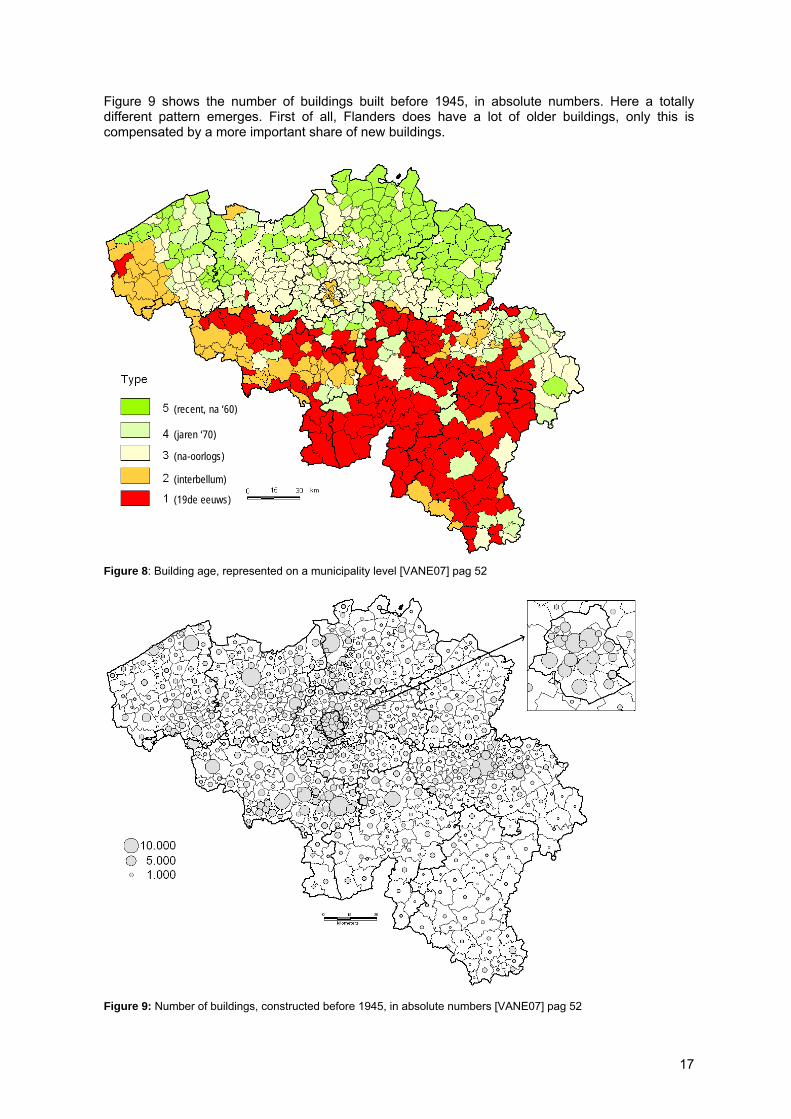
Figure 9 shows the number of buildings built before 1945, in absolute numbers. Here a totally different pattern emerges. First of all, Flanders does have a lot of older buildings, only this is compensated by a more important share of new buildings.
(recent, na ‘60)
(jaren ‘70)
(na-oorlogs)
(interbellum)
(19de eeuws)
Figure 8: Building age, represented on a municipality level [VANE07] pag 52
Figure 9: Number of buildings, constructed before 1945, in absolute numbers [VANE07] pag 52
17
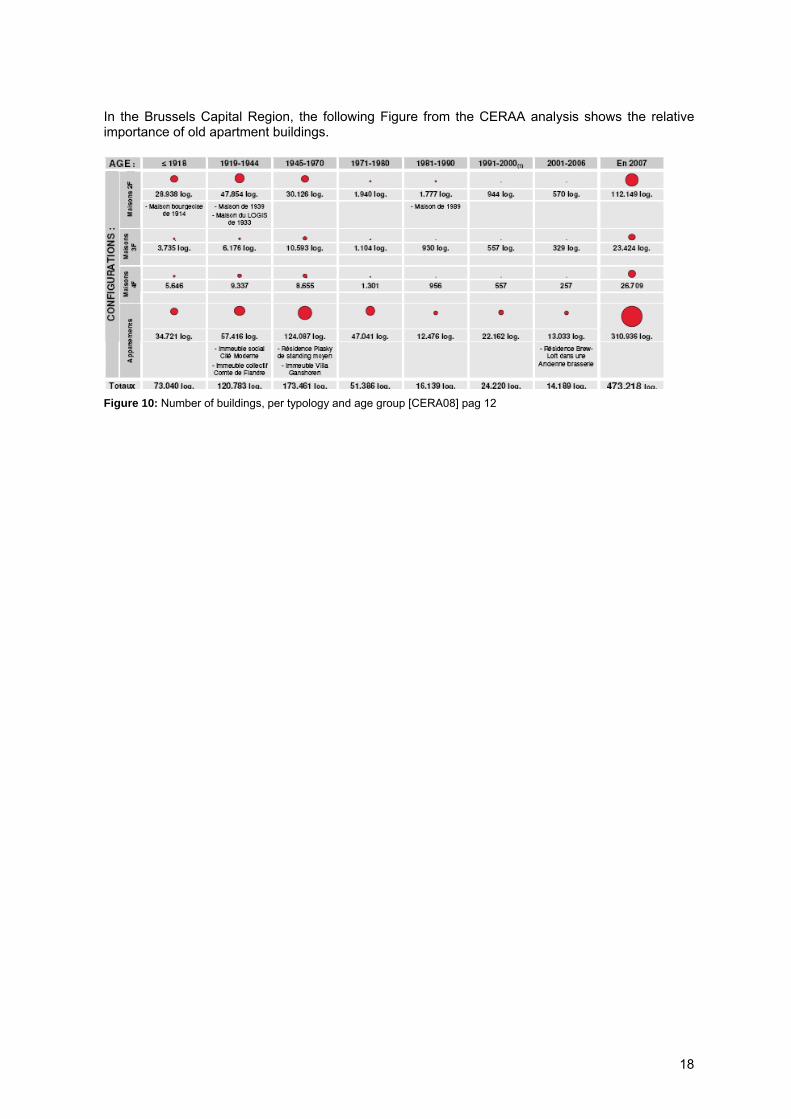
In the Brussels Capital Region, the following Figure from the CERAA analysis shows the relative importance of old apartment buildings.
Figure 10: Number of buildings, per typology and age group [CERA08] pag 12
18
3 . M O T I V A T I O N F O R R E N O V A T I O N When we look at experiences from the demonstration projects (see addenda to the research report), people renovate, or purchase a new house for renovation, for several possible reasons:
- To extend or decrease the living area - To have other spatial functions - To get rid of building damage - To improve the quality of the building - To improve the quality of the amenities - To have better access for/to work/ services - To reduce living expenses - To increase the chances for rent or sale - To invest and increase the value of the property - To improve thermal, visual, acoustical comfort and/or air quality - To have a better social neighbourhood - ..
On many of these aspects statistical data are missing. However, we can discuss available data on floor space, building quality, comfort and perception of the building context from data from social economical enquiries and surveys. Quality (see §3.2) is defined by the condition of the building, while comfort (see §3.3) is defined by the available facilities of the building.
3 . 1 . F L O O R S P A C E P E R D W E L L I N G A N D E V O L U T I O N
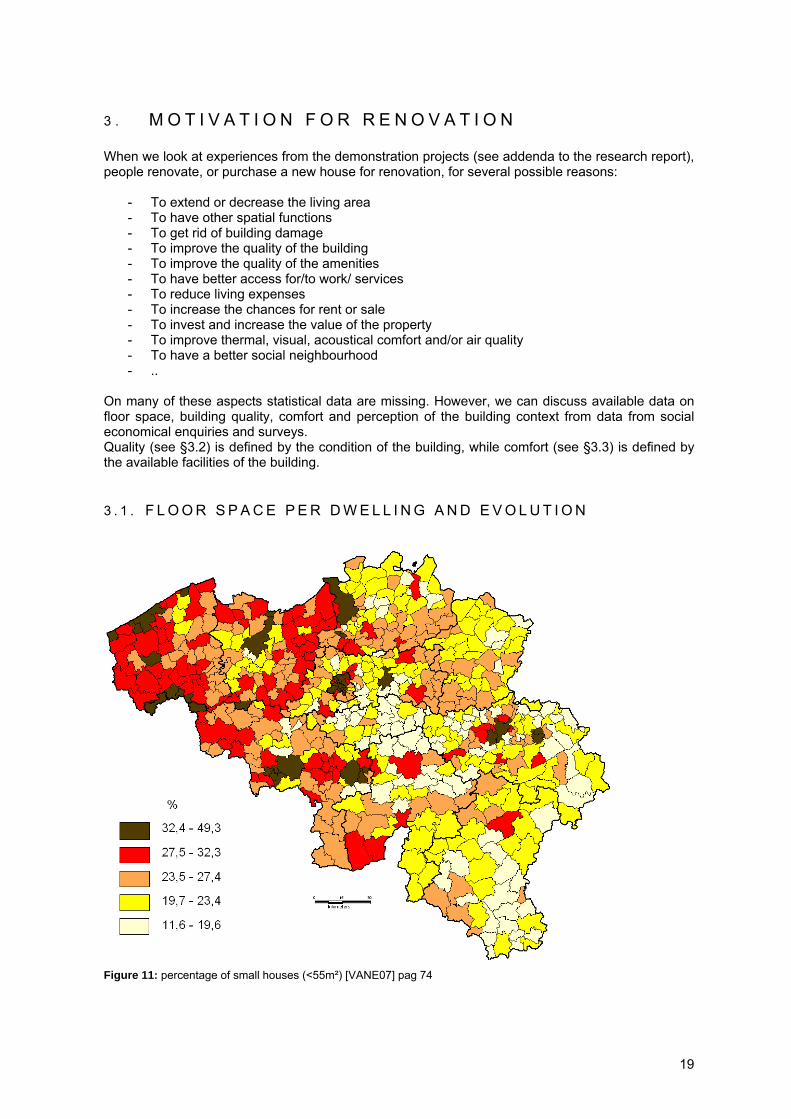
Figure 11: percentage of small houses (<55m²) [VANE07] pag 74
19
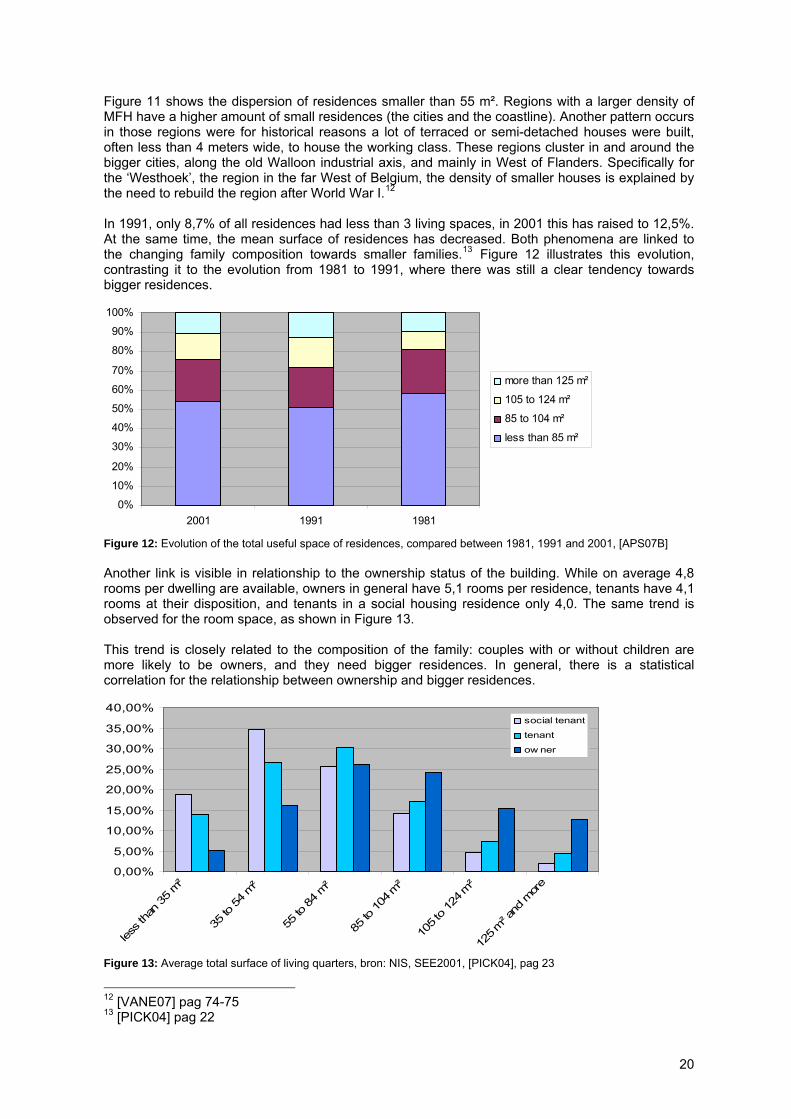
Figure 11 shows the dispersion of residences smaller than 55 m². Regions with a larger density of MFH have a higher amount of small residences (the cities and the coastline). Another pattern occurs in those regions were for historical reasons a lot of terraced or semi-detached houses were built, often less than 4 meters wide, to house the working class. These regions cluster in and around the bigger cities, along the old Walloon industrial axis, and mainly in West of Flanders. Specifically for the ‘Westhoek’, the region in the far West of Belgium, the density of smaller houses is explained by the need to rebuild the region after World War I.12
In 1991, only 8,7% of all residences had less than 3 living spaces, in 2001 this has raised to 12,5%. At the same time, the mean surface of residences has decreased. Both phenomena are linked to the changing family composition towards smaller families.13 Figure 12 illustrates this evolution, contrasting it to the evolution from 1981 to 1991, where there was still a clear tendency towards bigger residences.
0%
10%
20%
30%
40%
50%
60%
70%
80%
90%
100%
2001 1991 1981
more than 125 m²
105 to 124 m²
85 to 104 m²
less than 85 m²
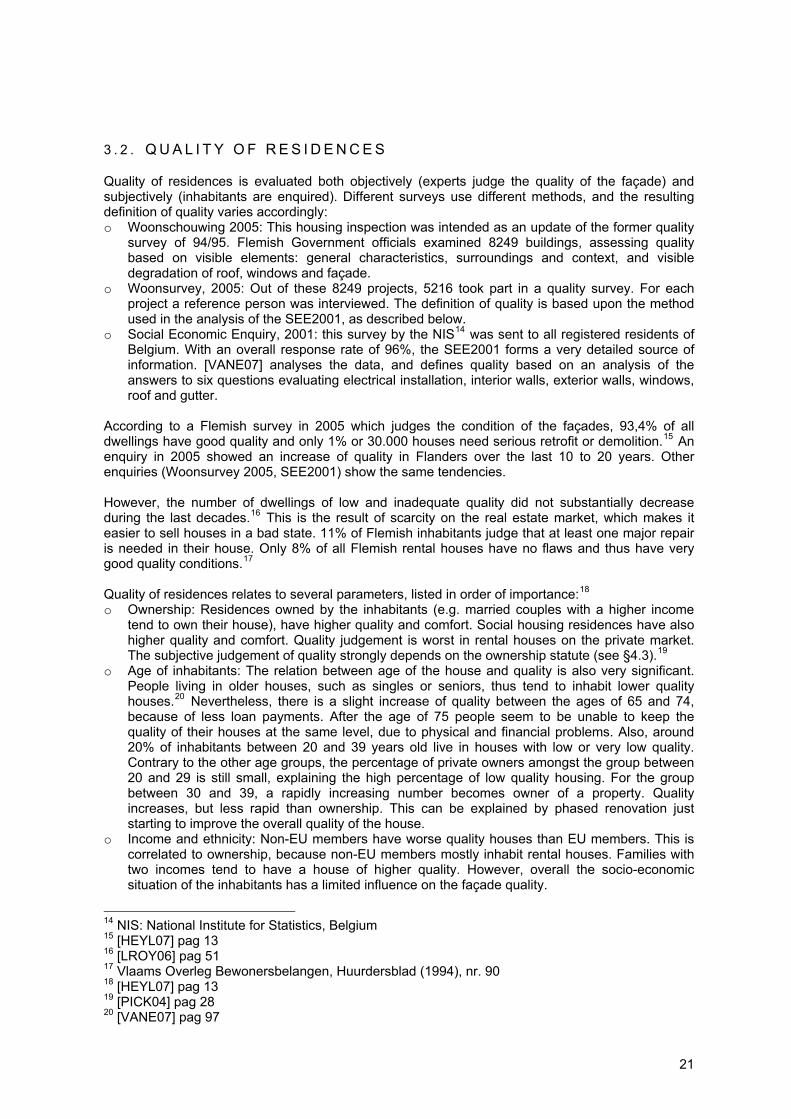
Figure 12: Evolution of the total useful space of residences, compared between 1981, 1991 and 2001, [APS07B] Another link is visible in relationship to the ownership status of the building. While on average 4,8 rooms per dwelling are available, owners in general have 5,1 rooms per residence, tenants have 4,1 rooms at their disposition, and tenants in a social housing residence only 4,0. The same trend is observed for the room space, as shown in Figure 13. This trend is closely related to the composition of the family: couples with or without children are more likely to be owners, and they need bigger residences. In general, there is a statistical correlation for the relationship between ownership and bigger residences.
0,00%
5,00%
10,00%
15,00%
20,00%
25,00%
30,00%
35,00%
40,00%
less t
han 35
m²
35 to
54 m²
55 to
84 m²
85 to
104
m²
105 t
o 12
4 m²
125 m
² and
more
social tenant
tenant
ow ner
Figure 13: Average total surface of living quarters, bron: NIS, SEE2001, [PICK04], pag 23
12 [VANE07] pag 74-75 13 [PICK04] pag 22
20
3 . 2 . Q U A L I T Y O F R E S I D E N C E S
Quality of residences is evaluated both objectively (experts judge the quality of the façade) and subjectively (inhabitants are enquired). Different surveys use different methods, and the resulting definition of quality varies accordingly: o Woonschouwing 2005: This housing inspection was intended as an update of the former quality
survey of 94/95. Flemish Government officials examined 8249 buildings, assessing quality based on visible elements: general characteristics, surroundings and context, and visible degradation of roof, windows and façade.
o Woonsurvey, 2005: Out of these 8249 projects, 5216 took part in a quality survey. For each project a reference person was interviewed. The definition of quality is based upon the method used in the analysis of the SEE2001, as described below.
o Social Economic Enquiry, 2001: this survey by the NIS14 was sent to all registered residents of Belgium. With an overall response rate of 96%, the SEE2001 forms a very detailed source of information. [VANE07] analyses the data, and defines quality based on an analysis of the answers to six questions evaluating electrical installation, interior walls, exterior walls, windows, roof and gutter.
According to a Flemish survey in 2005 which judges the condition of the façades, 93,4% of all dwellings have good quality and only 1% or 30.000 houses need serious retrofit or demolition.15 An enquiry in 2005 showed an increase of quality in Flanders over the last 10 to 20 years. Other enquiries (Woonsurvey 2005, SEE2001) show the same tendencies. However, the number of dwellings of low and inadequate quality did not substantially decrease during the last decades.16 This is the result of scarcity on the real estate market, which makes it easier to sell houses in a bad state. 11% of Flemish inhabitants judge that at least one major repair is needed in their house. Only 8% of all Flemish rental houses have no flaws and thus have very good quality conditions.17
Quality of residences relates to several parameters, listed in order of importance:18
o Ownership: Residences owned by the inhabitants (e.g. married couples with a higher income tend to own their house), have higher quality and comfort. Social housing residences have also higher quality and comfort. Quality judgement is worst in rental houses on the private market. The subjective judgement of quality strongly depends on the ownership statute (see §4.3).19
o Age of inhabitants: The relation between age of the house and quality is also very significant. People living in older houses, such as singles or seniors, thus tend to inhabit lower quality houses.20 Nevertheless, there is a slight increase of quality between the ages of 65 and 74, because of less loan payments. After the age of 75 people seem to be unable to keep the quality of their houses at the same level, due to physical and financial problems. Also, around 20% of inhabitants between 20 and 39 years old live in houses with low or very low quality. Contrary to the other age groups, the percentage of private owners amongst the group between 20 and 29 is still small, explaining the high percentage of low quality housing. For the group between 30 and 39, a rapidly increasing number becomes owner of a property. Quality increases, but less rapid than ownership. This can be explained by phased renovation just starting to improve the overall quality of the house.
o Income and ethnicity: Non-EU members have worse quality houses than EU members. This is correlated to ownership, because non-EU members mostly inhabit rental houses. Families with two incomes tend to have a house of higher quality. However, overall the socio-economic situation of the inhabitants has a limited influence on the façade quality.
14 NIS: National Institute for Statistics, Belgium 15 [HEYL07] pag 13 16 [LROY06] pag 51 17 Vlaams Overleg Bewonersbelangen, Huurdersblad (1994), nr. 90 18 [HEYL07] pag 13 19 [PICK04] pag 28 20 [VANE07] pag 97
21
o Geography: In east Belgium and in Flanders, quality of buildings is generally higher. There is no relation between urbanity and façade quality. But because of a higher average age of the buildings in cities and in the far west end of Flanders, quality is somewhat lower.
o Building type: There is no significant relation between type (apartment or single family house) and quality. Different studies give different correlations.21
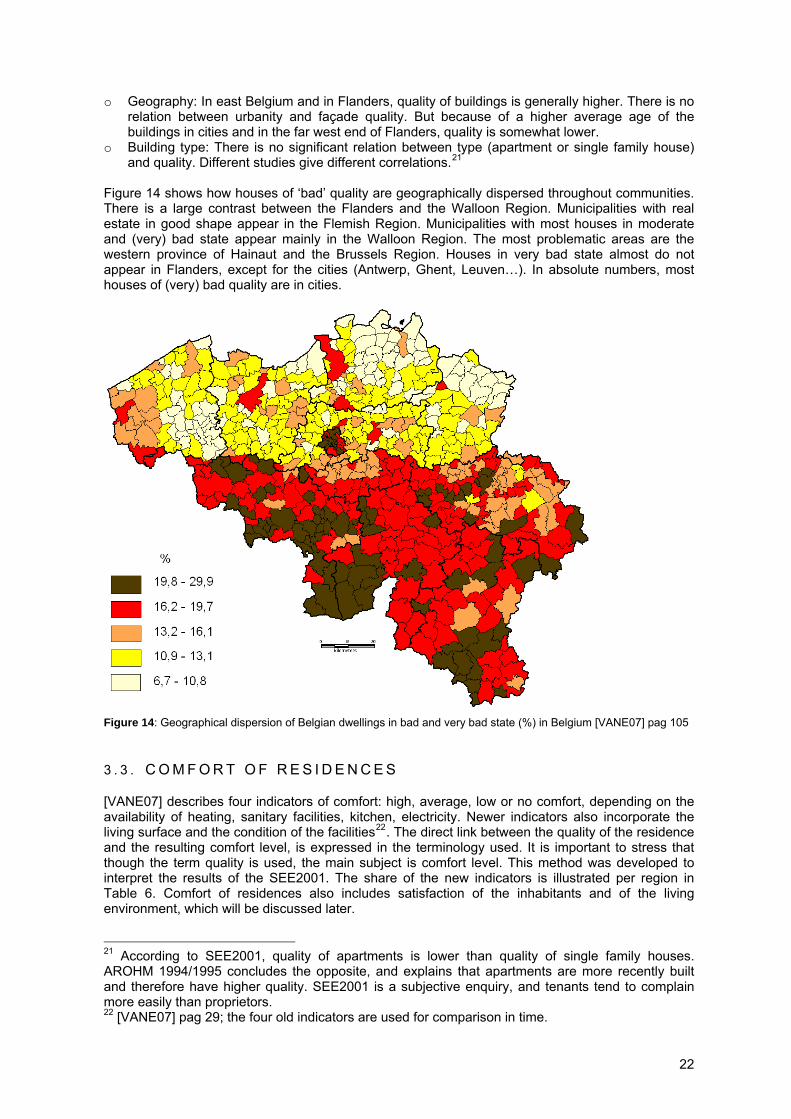
Figure 14 shows how houses of ‘bad’ quality are geographically dispersed throughout communities. There is a large contrast between the Flanders and the Walloon Region. Municipalities with real estate in good shape appear in the Flemish Region. Municipalities with most houses in moderate and (very) bad state appear mainly in the Walloon Region. The most problematic areas are the western province of Hainaut and the Brussels Region. Houses in very bad state almost do not appear in Flanders, except for the cities (Antwerp, Ghent, Leuven…). In absolute numbers, most houses of (very) bad quality are in cities.
Figure 14: Geographical dispersion of Belgian dwellings in bad and very bad state (%) in Belgium [VANE07] pag 105
3 . 3 . C O M F O R T O F R E S I D E N C E S
[VANE07] describes four indicators of comfort: high, average, low or no comfort, depending on the availability of heating, sanitary facilities, kitchen, electricity. Newer indicators also incorporate the living surface and the condition of the facilities22. The direct link between the quality of the residence and the resulting comfort level, is expressed in the terminology used. It is important to stress that though the term quality is used, the main subject is comfort level. This method was developed to interpret the results of the SEE2001. The share of the new indicators is illustrated per region in Table 6. Comfort of residences also includes satisfaction of the inhabitants and of the living environment, which will be discussed later.
21 According to SEE2001, quality of apartments is lower than quality of single family houses. AROHM 1994/1995 concludes the opposite, and explains that apartments are more recently built and therefore have higher quality. SEE2001 is a subjective enquiry, and tenants tend to complain more easily than proprietors. 22 [VANE07] pag 29; the four old indicators are used for comparison in time.
22
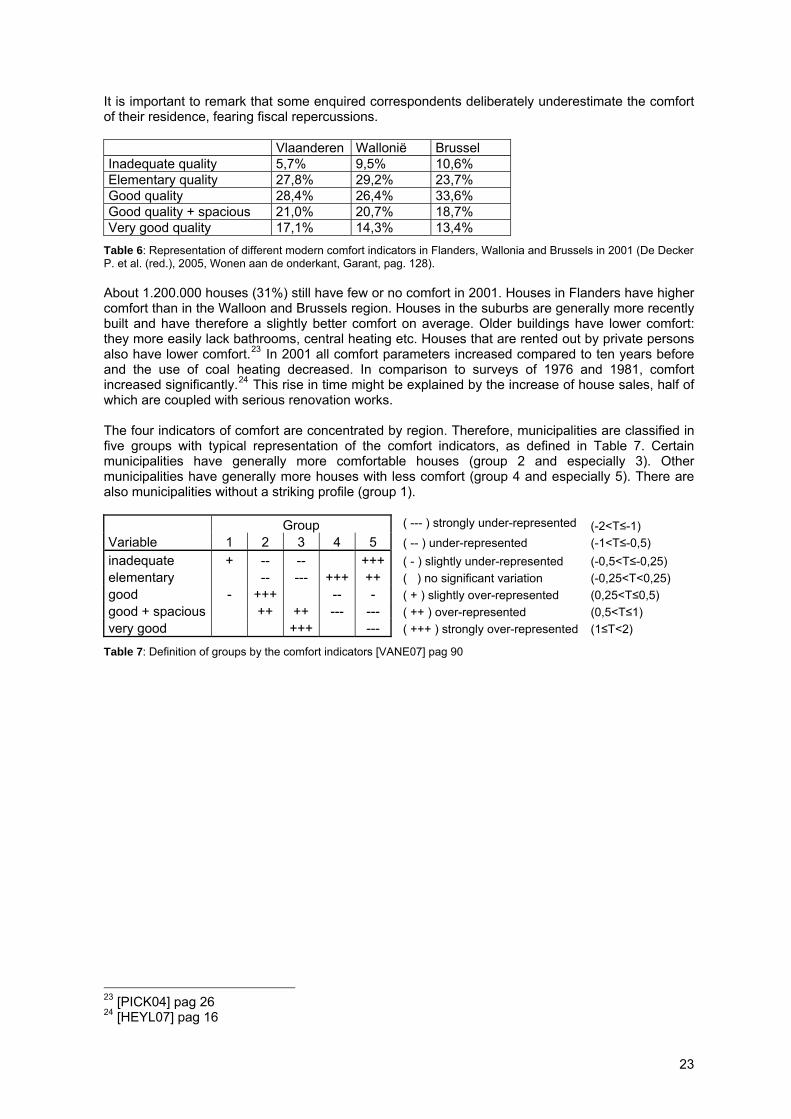
It is important to remark that some enquired correspondents deliberately underestimate the comfort of their residence, fearing fiscal repercussions. Vlaanderen Wallonië Brussel Inadequate quality 5,7% 9,5% 10,6% Elementary quality 27,8% 29,2% 23,7% Good quality 28,4% 26,4% 33,6% Good quality + spacious 21,0% 20,7% 18,7% Very good quality 17,1% 14,3% 13,4%
Table 6: Representation of different modern comfort indicators in Flanders, Wallonia and Brussels in 2001 (De Decker P. et al. (red.), 2005, Wonen aan de onderkant, Garant, pag. 128). About 1.200.000 houses (31%) still have few or no comfort in 2001. Houses in Flanders have higher comfort than in the Walloon and Brussels region. Houses in the suburbs are generally more recently built and have therefore a slightly better comfort on average. Older buildings have lower comfort: they more easily lack bathrooms, central heating etc. Houses that are rented out by private persons also have lower comfort.23 In 2001 all comfort parameters increased compared to ten years before and the use of coal heating decreased. In comparison to surveys of 1976 and 1981, comfort increased significantly.24 This rise in time might be explained by the increase of house sales, half of which are coupled with serious renovation works. The four indicators of comfort are concentrated by region. Therefore, municipalities are classified in five groups with typical representation of the comfort indicators, as defined in Table 7. Certain municipalities have generally more comfortable houses (group 2 and especially 3). Other municipalities have generally more houses with less comfort (group 4 and especially 5). There are also municipalities without a striking profile (group 1). Group ( --- ) strongly under-represented (-2<T≤-1) Variable 1 2 3 4 5 ( -- ) under-represented (-1<T≤-0,5) inadequate + -- -- +++ ( - ) slightly under-represented (-0,5<T≤-0,25) elementary -- --- +++ ++ ( ) no significant variation (-0,25<T<0,25) good - +++ -- - ( + ) slightly over-represented (0,25<T≤0,5) good + spacious ++ ++ --- --- ( ++ ) over-represented (0,5<T≤1) very good +++ --- ( +++ ) strongly over-represented (1≤T<2)
Table 7: Definition of groups by the comfort indicators [VANE07] pag 90
23 [PICK04] pag 26 24 [HEYL07] pag 16
23
(inadequate)
(elementary)
(good to very good)
(good)
(no distinct profile)
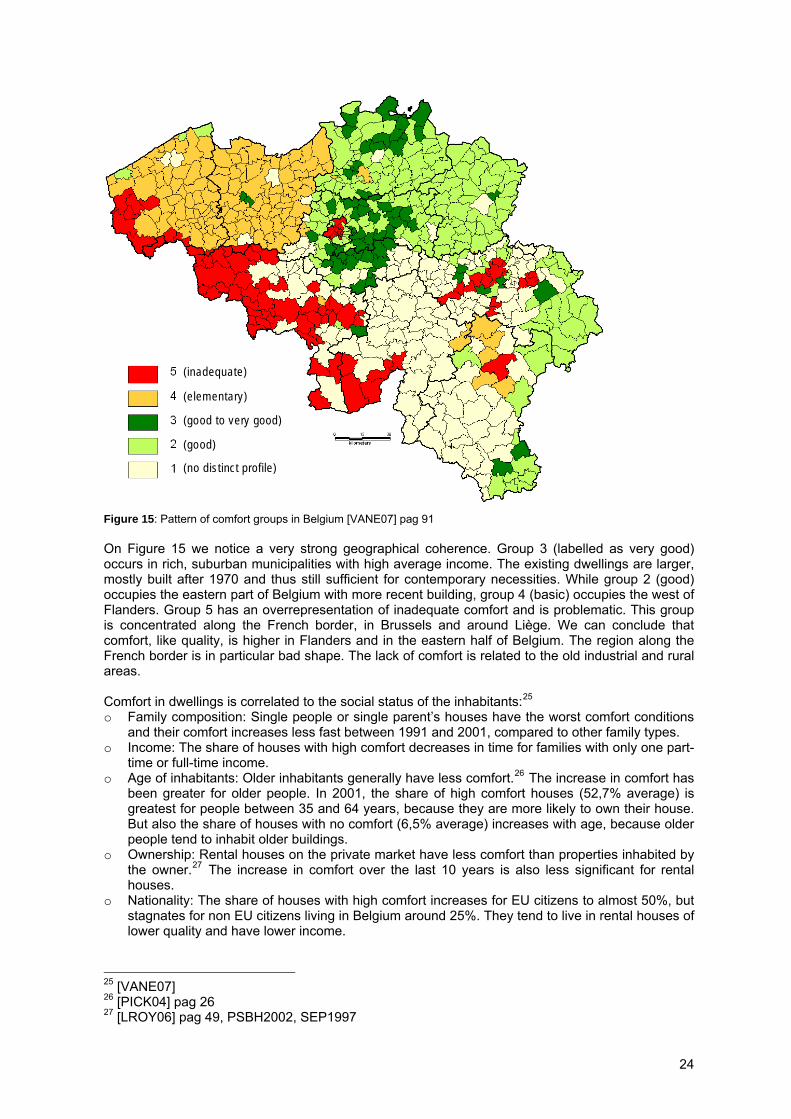
Figure 15: Pattern of comfort groups in Belgium [VANE07] pag 91 On Figure 15 we notice a very strong geographical coherence. Group 3 (labelled as very good) occurs in rich, suburban municipalities with high average income. The existing dwellings are larger, mostly built after 1970 and thus still sufficient for contemporary necessities. While group 2 (good) occupies the eastern part of Belgium with more recent building, group 4 (basic) occupies the west of Flanders. Group 5 has an overrepresentation of inadequate comfort and is problematic. This group is concentrated along the French border, in Brussels and around Liège. We can conclude that comfort, like quality, is higher in Flanders and in the eastern half of Belgium. The region along the French border is in particular bad shape. The lack of comfort is related to the old industrial and rural areas. Comfort in dwellings is correlated to the social status of the inhabitants:25
o Family composition: Single people or single parent’s houses have the worst comfort conditions and their comfort increases less fast between 1991 and 2001, compared to other family types.
o Income: The share of houses with high comfort decreases in time for families with only one part-time or full-time income.
o Age of inhabitants: Older inhabitants generally have less comfort.26 The increase in comfort has been greater for older people. In 2001, the share of high comfort houses (52,7% average) is greatest for people between 35 and 64 years, because they are more likely to own their house. But also the share of houses with no comfort (6,5% average) increases with age, because older people tend to inhabit older buildings.
o Ownership: Rental houses on the private market have less comfort than properties inhabited by the owner.27 The increase in comfort over the last 10 years is also less significant for rental houses.
o Nationality: The share of houses with high comfort increases for EU citizens to almost 50%, but stagnates for non EU citizens living in Belgium around 25%. They tend to live in rental houses of lower quality and have lower income.
25 [VANE07] 26 [PICK04] pag 26 27 [LROY06] pag 49, PSBH2002, SEP1997
24
Due to high ageing of the Belgian population, the mortality is expected to have an influence on the real estate market. It is expected that around 170.000 houses, now owned by single people of more than 75 years, soon will be for sale. But only when real estate prices drop, families with lower income will more easily become proprietors. The older the proprietor, the more houses have insufficient comfort. These houses will have to be retrofitted by the new, younger owners who generally have higher comfort expectations.
3 . 4 . C H O I C E O F L O C A T I O N : Q U A L I T Y O F L I F E , P R O X I M I T Y T O S E R V I C E S
The perception of the building context is evaluated based on three aspects:28
o Experience of the direct environment: neatness, calmness, air quality, greenery and look of the buildings;
o Infrastructure: quality of infrastucture on a small scale, and accessibility on a large scale; o Local facilities: commercial facilities, administrative, health and educational services, culture and
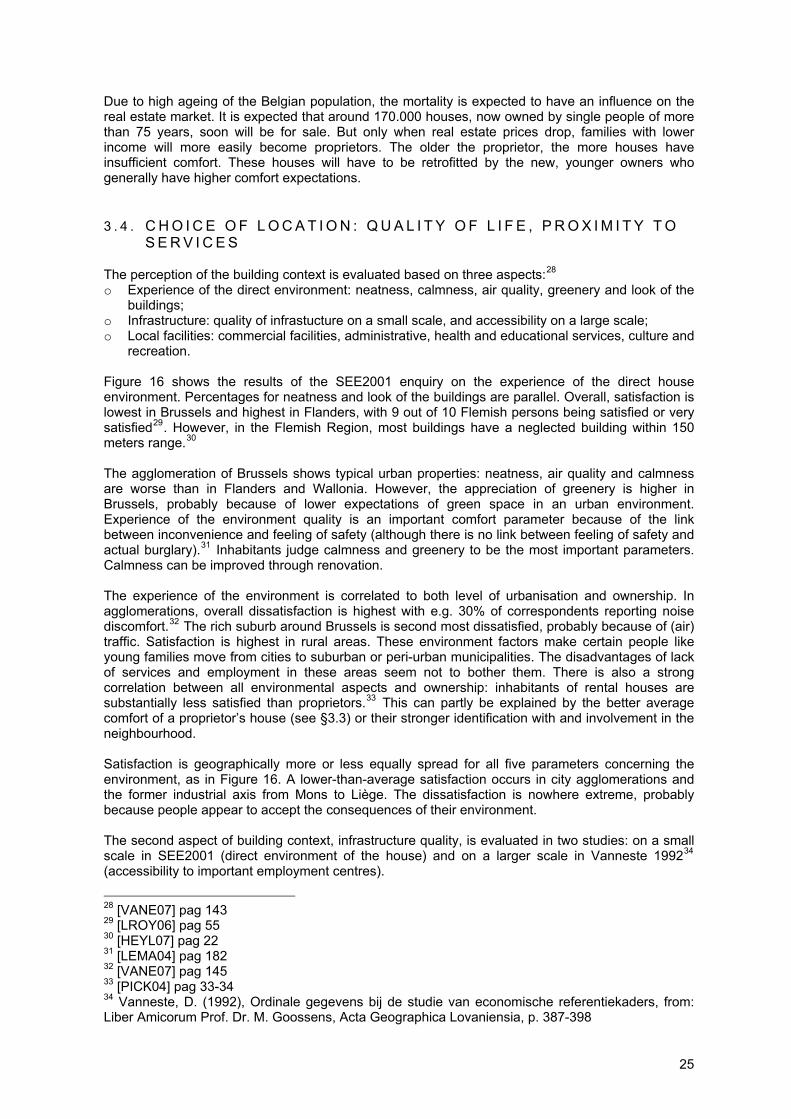
recreation. Figure 16 shows the results of the SEE2001 enquiry on the experience of the direct house environment. Percentages for neatness and look of the buildings are parallel. Overall, satisfaction is lowest in Brussels and highest in Flanders, with 9 out of 10 Flemish persons being satisfied or very satisfied29. However, in the Flemish Region, most buildings have a neglected building within 150 meters range.30
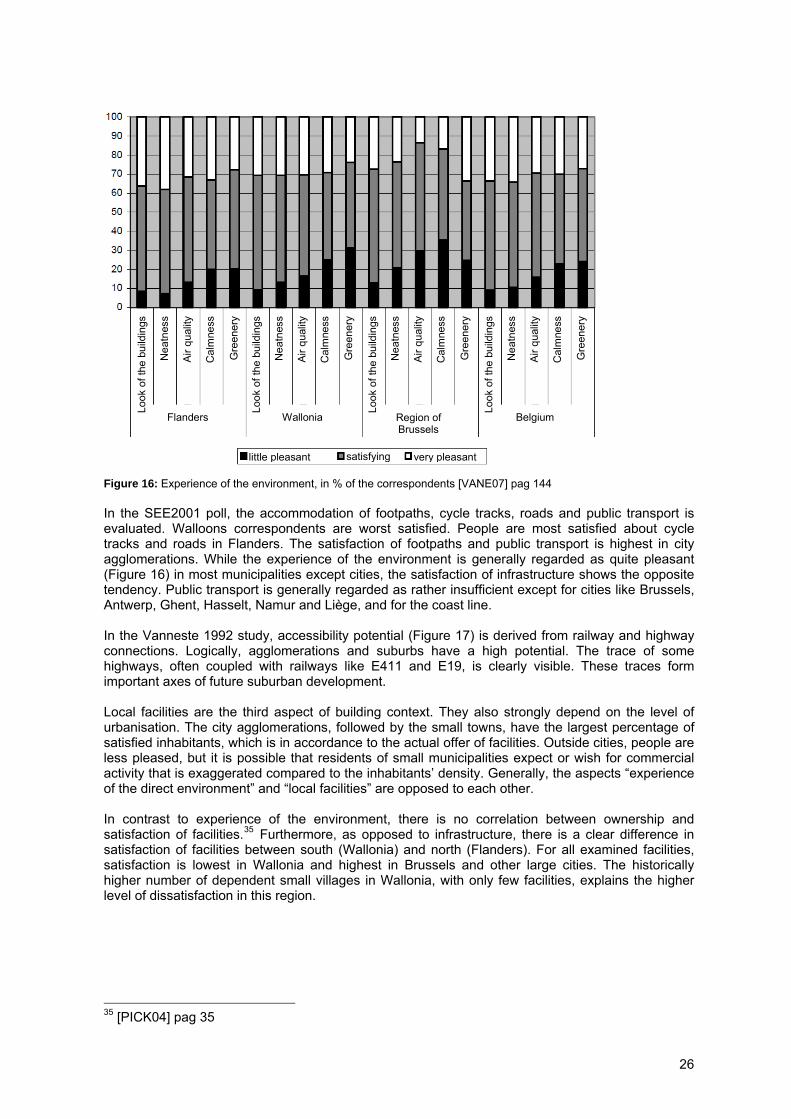
The agglomeration of Brussels shows typical urban properties: neatness, air quality and calmness are worse than in Flanders and Wallonia. However, the appreciation of greenery is higher in Brussels, probably because of lower expectations of green space in an urban environment. Experience of the environment quality is an important comfort parameter because of the link between inconvenience and feeling of safety (although there is no link between feeling of safety and actual burglary).31 Inhabitants judge calmness and greenery to be the most important parameters. Calmness can be improved through renovation. The experience of the environment is correlated to both level of urbanisation and ownership. In agglomerations, overall dissatisfaction is highest with e.g. 30% of correspondents reporting noise discomfort.32 The rich suburb around Brussels is second most dissatisfied, probably because of (air) traffic. Satisfaction is highest in rural areas. These environment factors make certain people like young families move from cities to suburban or peri-urban municipalities. The disadvantages of lack of services and employment in these areas seem not to bother them. There is also a strong correlation between all environmental aspects and ownership: inhabitants of rental houses are substantially less satisfied than proprietors.33 This can partly be explained by the better average comfort of a proprietor’s house (see §3.3) or their stronger identification with and involvement in the neighbourhood. Satisfaction is geographically more or less equally spread for all five parameters concerning the environment, as in Figure 16. A lower-than-average satisfaction occurs in city agglomerations and the former industrial axis from Mons to Liège. The dissatisfaction is nowhere extreme, probably because people appear to accept the consequences of their environment. The second aspect of building context, infrastructure quality, is evaluated in two studies: on a small scale in SEE2001 (direct environment of the house) and on a larger scale in Vanneste 199234 (accessibility to important employment centres).
28 [VANE07] pag 143 29 [LROY06] pag 55 30 [HEYL07] pag 22 31 [LEMA04] pag 182 32 [VANE07] pag 145 33 [PICK04] pag 33-34 34 Vanneste, D. (1992), Ordinale gegevens bij de studie van economische referentiekaders, from: Liber Amicorum Prof. Dr. M. Goossens, Acta Geographica Lovaniensia, p. 387-398
25
Flanders
Look
of t
he b
uild
ings
Nea
tnes
s
Air q
ualit
y
Cal
mne
ss
Gre
ener
y
Wallonia
Look
of t
he b
uild
ings
Nea
tnes
s
Air q
ualit
y
Cal
mne
ss
Gre
ener
y
Region of Brussels
Look
of t
he b
uild
ings
Nea
tnes
s
Air q
ualit
y
Cal
mne
ss
Gre
ener
y
Belgium
Look
of t
he b
uild
ings
Nea
tnes
s
Air q
ualit
y
Cal
mne
ss
Gre
ener
y
little pleasant satisfying very pleasant Figure 16: Experience of the environment, in % of the correspondents [VANE07] pag 144 In the SEE2001 poll, the accommodation of footpaths, cycle tracks, roads and public transport is evaluated. Walloons correspondents are worst satisfied. People are most satisfied about cycle tracks and roads in Flanders. The satisfaction of footpaths and public transport is highest in city agglomerations. While the experience of the environment is generally regarded as quite pleasant (Figure 16) in most municipalities except cities, the satisfaction of infrastructure shows the opposite tendency. Public transport is generally regarded as rather insufficient except for cities like Brussels, Antwerp, Ghent, Hasselt, Namur and Liège, and for the coast line. In the Vanneste 1992 study, accessibility potential (Figure 17) is derived from railway and highway connections. Logically, agglomerations and suburbs have a high potential. The trace of some highways, often coupled with railways like E411 and E19, is clearly visible. These traces form important axes of future suburban development. Local facilities are the third aspect of building context. They also strongly depend on the level of urbanisation. The city agglomerations, followed by the small towns, have the largest percentage of satisfied inhabitants, which is in accordance to the actual offer of facilities. Outside cities, people are less pleased, but it is possible that residents of small municipalities expect or wish for commercial activity that is exaggerated compared to the inhabitants’ density. Generally, the aspects “experience of the direct environment” and “local facilities” are opposed to each other. In contrast to experience of the environment, there is no correlation between ownership and satisfaction of facilities.35 Furthermore, as opposed to infrastructure, there is a clear difference in satisfaction of facilities between south (Wallonia) and north (Flanders). For all examined facilities, satisfaction is lowest in Wallonia and highest in Brussels and other large cities. The historically higher number of dependent small villages in Wallonia, with only few facilities, explains the higher level of dissatisfaction in this region.
35 [PICK04] pag 35
26
Figure 17: Accessibility potential (result of the presence/absence of railway stations and highway accesses) based on the Vanneste 1992 study [VANE07] pag 151 Experience of the presence of facilities in the same geographical area is segmented and coloured: both extreme judgements “very good” and “bad” appear equally. The majority of people are satisfied of health services, schools and social facilities. The majority of people are rather dissatisfied of administrative facilities, independent professions, child day-care centres, culture and recreation.
27

4 . E N E R G Y C H A R A C T E R I S T I C S O F T H E B U I L D I N G S T O C K
4 . 1 . R E S I D E N T I A L E N E R G Y U S E A N D E V O L U T I O N
The ODYSSEE database provides some data about the evolution of energy use in the residential sector in Belgium. The following figures shows increasing trends for energy consumption compared to 1990 levels. [ECON07] Note that the federal energy consumption statistics by individual industrial branch appear to be inconsistent. The ODYSSEE database aggregated the energy consumption statistics of the three Regions, even though these regional statistics may not be completely harmonised. [ECON07]
Figure 18: Evolution of final consumption by sector in Belgium (1990=100), before climate correction, according to [ECON07]
Figure 19: Evolution of final consumption by sector in Belgium (1990=100), before climate correction, according to [ECON07]
28
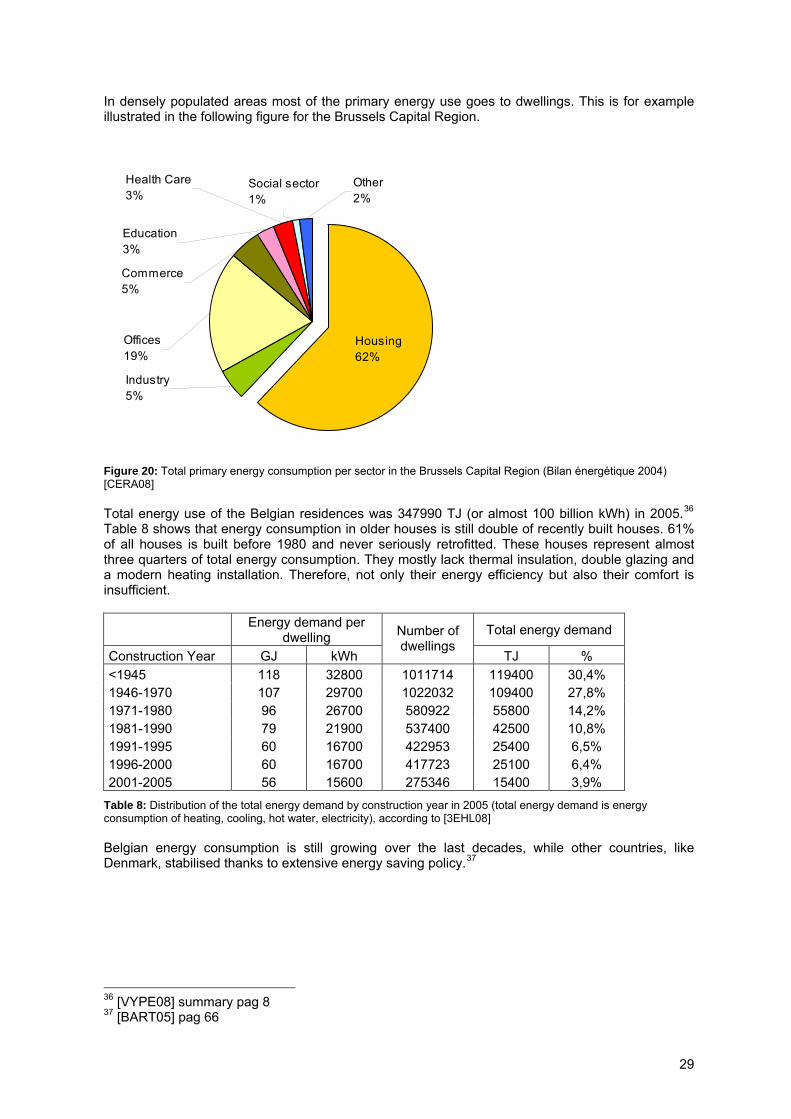
In densely populated areas most of the primary energy use goes to dwellings. This is for example illustrated in the following figure for the Brussels Capital Region.
Housing62%
Industry5%
Offices19%
Commerce5%
Education3%
Health Care3%
Other2%
Social sector1%
Figure 20: Total primary energy consumption per sector in the Brussels Capital Region (Bilan énergétique 2004) [CERA08] Total energy use of the Belgian residences was 347990 TJ (or almost 100 billion kWh) in 2005.36 Table 8 shows that energy consumption in older houses is still double of recently built houses. 61% of all houses is built before 1980 and never seriously retrofitted. These houses represent almost three quarters of total energy consumption. They mostly lack thermal insulation, double glazing and a modern heating installation. Therefore, not only their energy efficiency but also their comfort is insufficient.
Energy demand per
dwelling Total energy demand
Construction Year GJ kWh
Number of dwellings
TJ % <1945 118 32800 1011714 119400 30,4% 1946-1970 107 29700 1022032 109400 27,8% 1971-1980 96 26700 580922 55800 14,2% 1981-1990 79 21900 537400 42500 10,8% 1991-1995 60 16700 422953 25400 6,5% 1996-2000 60 16700 417723 25100 6,4% 2001-2005 56 15600 275346 15400 3,9%
Table 8: Distribution of the total energy demand by construction year in 2005 (total energy demand is energy consumption of heating, cooling, hot water, electricity), according to [3EHL08] Belgian energy consumption is still growing over the last decades, while other countries, like Denmark, stabilised thanks to extensive energy saving policy.37
36 [VYPE08] summary pag 8 37 [BART05] pag 66
29
4 . 2 . H E A T I N G O F D W E L L I N G S A N D E V O L U T I O N
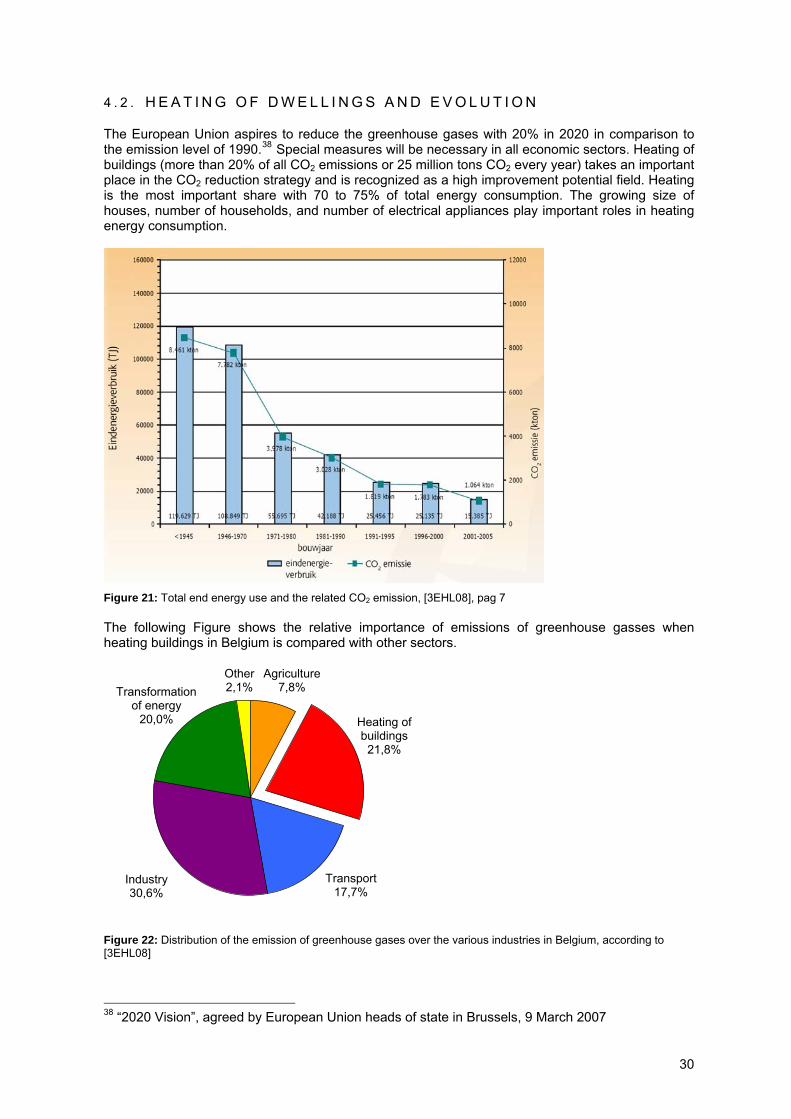
The European Union aspires to reduce the greenhouse gases with 20% in 2020 in comparison to the emission level of 1990.38 Special measures will be necessary in all economic sectors. Heating of buildings (more than 20% of all CO2 emissions or 25 million tons CO2 every year) takes an important place in the CO2 reduction strategy and is recognized as a high improvement potential field. Heating is the most important share with 70 to 75% of total energy consumption. The growing size of houses, number of households, and number of electrical appliances play important roles in heating energy consumption.
Figure 21: Total end energy use and the related CO2 emission, [3EHL08], pag 7 The following Figure shows the relative importance of emissions of greenhouse gasses when heating buildings in Belgium is compared with other sectors.
Agriculture 7,8%
Transport 17,7%
Industry 30,6%
Other 2,1% Transformation
of energy 20,0% Heating of
buildings 21,8%
Figure 22: Distribution of the emission of greenhouse gases over the various industries in Belgium, according to [3EHL08]
38 “2020 Vision”, agreed by European Union heads of state in Brussels, 9 March 2007
30
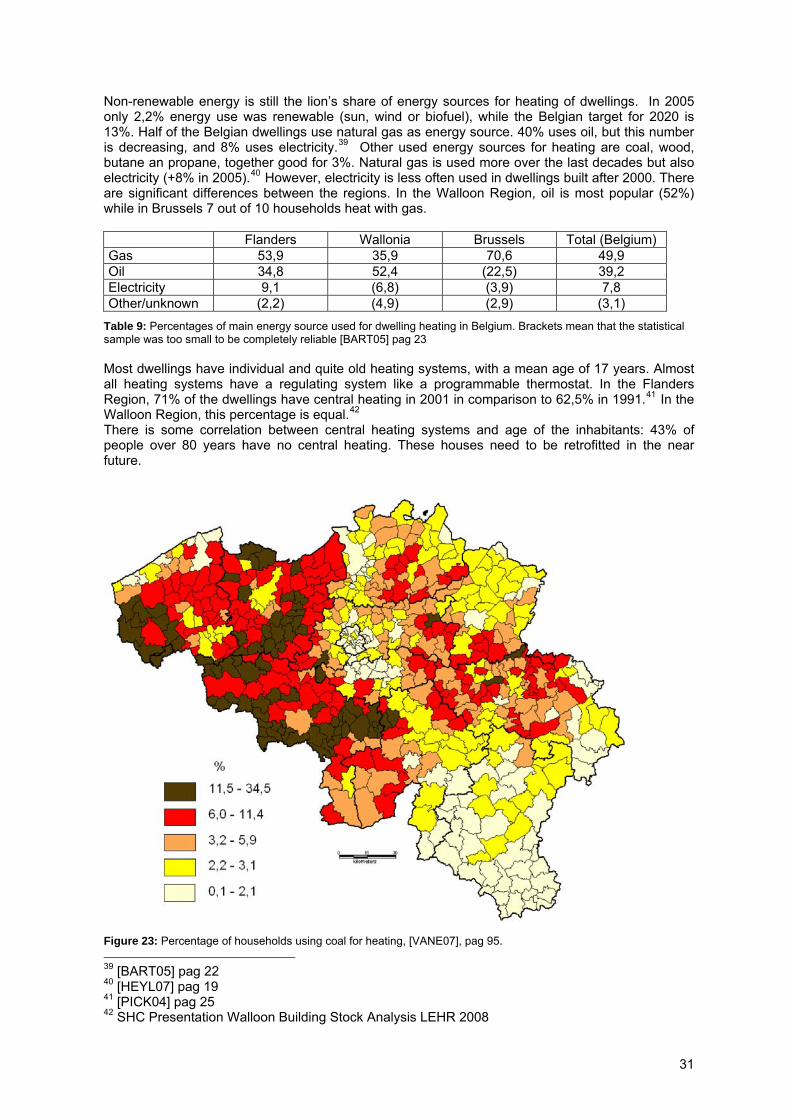
Non-renewable energy is still the lion’s share of energy sources for heating of dwellings. In 2005 only 2,2% energy use was renewable (sun, wind or biofuel), while the Belgian target for 2020 is 13%. Half of the Belgian dwellings use natural gas as energy source. 40% uses oil, but this number is decreasing, and 8% uses electricity.39 Other used energy sources for heating are coal, wood, butane an propane, together good for 3%. Natural gas is used more over the last decades but also electricity (+8% in 2005).40 However, electricity is less often used in dwellings built after 2000. There are significant differences between the regions. In the Walloon Region, oil is most popular (52%) while in Brussels 7 out of 10 households heat with gas. Flanders Wallonia Brussels Total (Belgium) Gas 53,9 35,9 70,6 49,9 Oil 34,8 52,4 (22,5) 39,2 Electricity 9,1 (6,8) (3,9) 7,8 Other/unknown (2,2) (4,9) (2,9) (3,1)
Table 9: Percentages of main energy source used for dwelling heating in Belgium. Brackets mean that the statistical sample was too small to be completely reliable [BART05] pag 23 Most dwellings have individual and quite old heating systems, with a mean age of 17 years. Almost all heating systems have a regulating system like a programmable thermostat. In the Flanders Region, 71% of the dwellings have central heating in 2001 in comparison to 62,5% in 1991.41 In the Walloon Region, this percentage is equal.42 There is some correlation between central heating systems and age of the inhabitants: 43% of people over 80 years have no central heating. These houses need to be retrofitted in the near future.
Figure 23: Percentage of households using coal for heating, [VANE07], pag 95. 39 [BART05] pag 22 40 [HEYL07] pag 19 41 [PICK04] pag 25 42 SHC Presentation Walloon Building Stock Analysis LEHR 2008
31
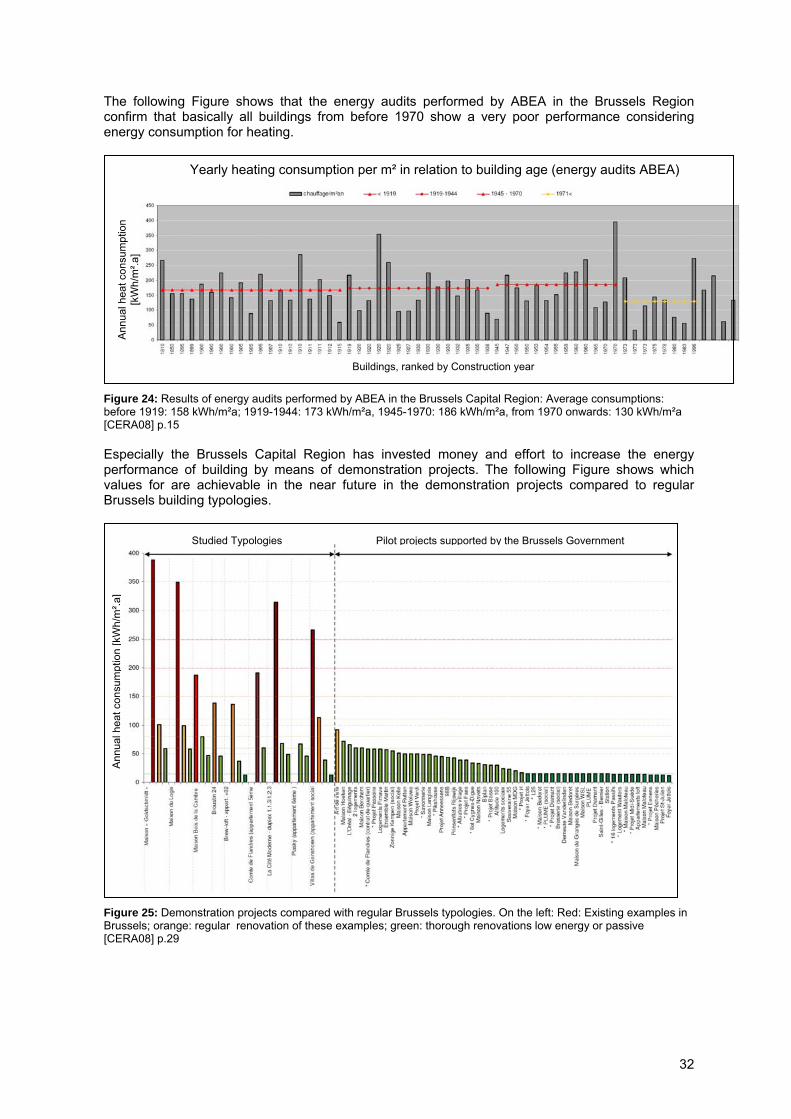
The following Figure shows that the energy audits performed by ABEA in the Brussels Region confirm that basically all buildings from before 1970 show a very poor performance considering energy consumption for heating.
Ann
ual h
eat c
onsu
mpt
ion
[kW
h/m
².a]
Buildings, ranked by Construction year
Yearly heating consumption per m² in relation to building age (energy audits ABEA)
Figure 24: Results of energy audits performed by ABEA in the Brussels Capital Region: Average consumptions: before 1919: 158 kWh/m²a; 1919-1944: 173 kWh/m²a, 1945-1970: 186 kWh/m²a, from 1970 onwards: 130 kWh/m²a [CERA08] p.15 Especially the Brussels Capital Region has invested money and effort to increase the energy performance of building by means of demonstration projects. The following Figure shows which values for are achievable in the near future in the demonstration projects compared to regular Brussels building typologies.
Studied Typologies Pilot projects supported by the Brussels Government
Ann
ual h
eat c
onsu
mpt
ion
[kW
h/m
².a]
Figure 25: Demonstration projects compared with regular Brussels typologies. On the left: Red: Existing examples in Brussels; orange: regular renovation of these examples; green: thorough renovations low energy or passive [CERA08] p.29
32
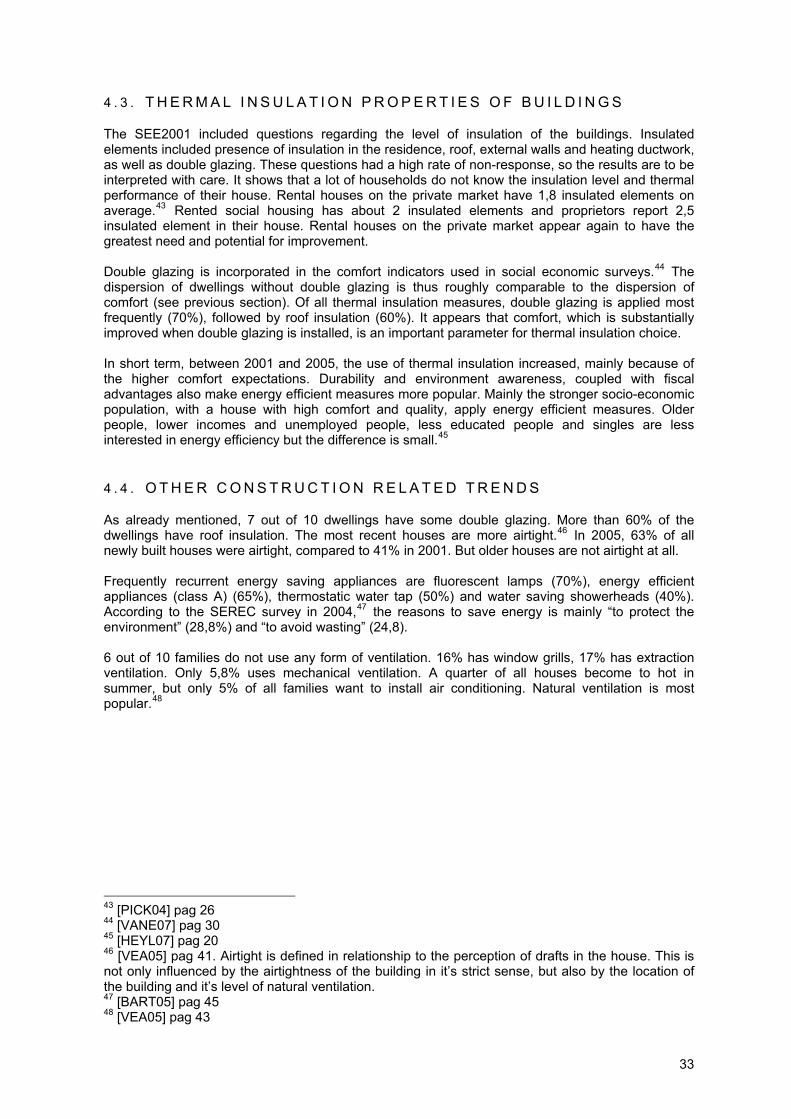
4 . 3 . T H E R M A L I N S U L A T I O N P R O P E R T I E S O F B U I L D I N G S
The SEE2001 included questions regarding the level of insulation of the buildings. Insulated elements included presence of insulation in the residence, roof, external walls and heating ductwork, as well as double glazing. These questions had a high rate of non-response, so the results are to be interpreted with care. It shows that a lot of households do not know the insulation level and thermal performance of their house. Rental houses on the private market have 1,8 insulated elements on average.43 Rented social housing has about 2 insulated elements and proprietors report 2,5 insulated element in their house. Rental houses on the private market appear again to have the greatest need and potential for improvement. Double glazing is incorporated in the comfort indicators used in social economic surveys.44 The dispersion of dwellings without double glazing is thus roughly comparable to the dispersion of comfort (see previous section). Of all thermal insulation measures, double glazing is applied most frequently (70%), followed by roof insulation (60%). It appears that comfort, which is substantially improved when double glazing is installed, is an important parameter for thermal insulation choice. In short term, between 2001 and 2005, the use of thermal insulation increased, mainly because of the higher comfort expectations. Durability and environment awareness, coupled with fiscal advantages also make energy efficient measures more popular. Mainly the stronger socio-economic population, with a house with high comfort and quality, apply energy efficient measures. Older people, lower incomes and unemployed people, less educated people and singles are less interested in energy efficiency but the difference is small.45
4 . 4 . O T H E R C O N S T R U C T I O N R E L A T E D T R E N D S
As already mentioned, 7 out of 10 dwellings have some double glazing. More than 60% of the dwellings have roof insulation. The most recent houses are more airtight.46 In 2005, 63% of all newly built houses were airtight, compared to 41% in 2001. But older houses are not airtight at all. Frequently recurrent energy saving appliances are fluorescent lamps (70%), energy efficient appliances (class A) (65%), thermostatic water tap (50%) and water saving showerheads (40%). According to the SEREC survey in 2004,47 the reasons to save energy is mainly “to protect the environment” (28,8%) and “to avoid wasting” (24,8). 6 out of 10 families do not use any form of ventilation. 16% has window grills, 17% has extraction ventilation. Only 5,8% uses mechanical ventilation. A quarter of all houses become to hot in summer, but only 5% of all families want to install air conditioning. Natural ventilation is most popular.48
43 [PICK04] pag 26 44 [VANE07] pag 30 45 [HEYL07] pag 20 46 [VEA05] pag 41. Airtight is defined in relationship to the perception of drafts in the house. This is not only influenced by the airtightness of the building in it’s strict sense, but also by the location of the building and it’s level of natural ventilation. 47 [BART05] pag 45 48 [VEA05] pag 43
33
5 . P O T E N T I A L O F T H E E X I S T I N G H O U S I N G S T O C K T O R E D U C E E N E R G Y
5 . 1 . G E N E R A L C O N S I D E R A T I O N S
From the European ERABUILD study [ERAB08], it can be seen that on the European level, the owner-occupied sector accounts for 35% to 70% of the residential building stock in the countries of interest in this study. This is also a sector where the penetration of sustainable renovation is low, in spite of the fact that a lot of renovation and modernisation activities are undertaken. Therefore, it seems to be an interesting sector to address. Owner-occupation accounts for 60% to 96% of single family dwellings and 20% to 60% of multi-family dwellings. Barriers to sustainable renovations in the owner-occupied market are the low investment capacity and the lack of knowledge about technical solutions. In owner-occupied multi-family dwellings, an additional barrier is the complex decision-making process related to the co-ownership of building parts. The social rented sector, is strongly structured and easier to address than the private rented sector because the investment capacity and the structure are better. The private rented sector, has to contend with a low investment capacity and a lack of knowledge about technical solutions. In both sub sectors, the main barrier to sustainable renovation seems to be the return on investment; the one who invests is not the one who profits. This calls for specific financial and organisational solutions. [ERAB08] Urban renewal, which is taking place on a large-scale in Germany, Austria and France, could be an opportunity for sustainable renovation, at least if decisions on asset management were related to the technical quality of the buildings, which is mostly not the case. Here, too, specific organisational and financial solutions are needed. [ERAB08] Most renovation activities in the residential sector are maintenance, repair and modernisation activities aimed at increasing the service life of components, increasing comfort or replacing components. The decision-makers in these renovation activities are owner-occupants and mostly small contractors. There is a need for the dissemination of knowledge and decision tools (for instance the “repair or replace” decision tool) to these small sized firms and non-professional actors. The consultancy process is also very unclear because the contractor acts as consultant too, but is not objective. There also seems to be a need here for specific organisations and processes. [ERAB08] The LEHR project provided the opportunity to follow the discussions of the International Energy Agency considering the preparation of advanced research. From the IEA ECBCS Annex 53 proposal, it is clear that on the international level it is recognized that analysis and evaluation methods for the definition of the total energy use of buildings still need further research. [IEA09] One of the most significant barriers for achieving the goal of substantially improving energy efficiency of buildings is the lack of knowledge about the factors determining the energy use. Also policies agreements about energy saving targets (e.g., Energy Performance of Buildings Directive of the EU) as well as agreements about limiting greenhouse gas emissions are based on a knowledge of building energy consumption, in which a complex array of factors, including the user/occupant behaviour, play a significant role. [IEA09] This discrepancy leads to misunderstanding and miscommunication between the parties involved in the topic of energy savings in buildings:
Despite the fact that the building regulations have been strengthened in many countries with respect to energy savings, the real energy consumption is not decreasing at the same rate and on many occasions even is increasing. Buildings and their systems improve, but building usage and activities in buildings can lead to an increasing energy consumption
The implementation of energy saving measures is supported and enforced via standards and regulations. These standards and regulations define human behaviour and activities in buildings for the average situation and conditions and exclude non-building related issues. Instruments based on these standards, such as Energy Performance Rating (EPR) and
34
labelling systems more and more lose the credibility of the public as they do not reflect the real energy consumption of a building.
For investors (property developers, banks, insurance companies, public and private services corporations) in the field of energy, instruments are lacking that enable the assessment of the energy use of buildings and give information about real cost-benefit relationship between investments in energy saving measures and profits.
Building energy consumption is mainly influenced by six factors: (1) climate, (2) building envelop, (3) building services and energy systems, (4) building operation and maintenance, (5) occupants’ activities and behaviour and (6) indoor environmental quality provided. The latter 3 factors, related to human behaviour, can have an influence as great as or greater than the former 3 ones. The user related aspects and behaviour effects can be seen from the large spread in energy use for similar or identical buildings, but a distinction between the building related and the user related energy part cannot established. All six factors need to be investigated together to understand building energy consumption data. Detailed comparative analysis on building energy data, concerning the six factors mentioned above, would provide essential guidance in identifying energy saving potentials and opportunities. A limitation of much current research is that it focuses only on the first three factors (climate, building envelope, building services and energy systems). All of the factors, including building operation, occupants activity and behaviour, and indoor environmental quality, need to be analyzed using a combination of simulation and real measured energy consumption data. As the differences in indoor climate can also cause huge differences in energy consumption, it is important to gather data on the real indoor climate conditions (in addition to energy usage) to understand and interpret measured data on building energy consumption. Besides that, another pivotal problem is that there is lack of a scientific method to account for interactions between the six influence factors and energy use in a clear and thorough way, and to predict the expected energy use as well in the case of all the influence factor are taken into account. [IEA09] There is often a significant discrepancy between the designed and the real total energy use in buildings. The reasons for this discrepancy are generally poorly understood, and often have more to do with the role of human behaviour than the building design. In addition, the inconsistency in the terms related to building energy is also a surprisingly serious problem in our achieving understanding of factors affecting energy use in buildings. For instance, many research projects show information on building energy consumption in Europe for heating for residential and non-residential buildings in terms of kWh/(m2.a), but there is no way of knowing what the term kWh/(m2.a) means. Because it applies to both space heating and cooling and other end uses, we know that it includes both electricity and fossil fuel. For some countries and researchers, the results are likely to refer to final energy, ignoring the energy losses associated with the production of electricity. For other countries, kWh/(m2.a) will include fossil fuels with their efficiency of conversion to electricity. This is an approximation of primary energy units. The first is inappropriate to measure the effect of buildings on energy use. The second is vague and unclear. Hence, this explanation of the energy use data makes the analysis of the factors responsible for energy use impossible. [IEA09] Future research should therefore focus on better understanding and strengthening the knowledge for robust prediction of total energy usage in buildings, thus enabling the assessment of energy-saving measures, policies and techniques.
35
5 . 2 . A C A S E S T U D Y F O R T H E B R U S S E L S R E G I O N
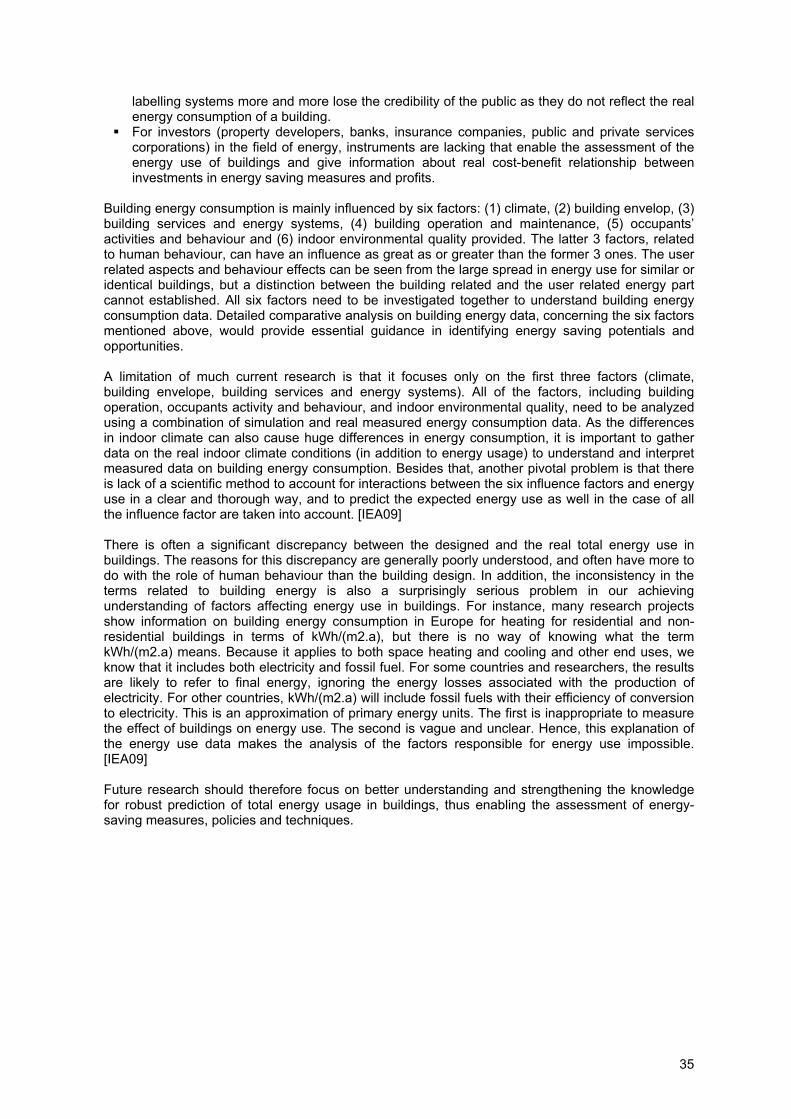
CERAA studied the potential for the existing housing stock in the Brussels Region to reduce energy consumption by means of the application of passive house principles [CERA08] The following Figure shows that an increase in building stock is still to be expected and that the current renovation rate (0,6%) will not be able to reach a very large part of the existing building stock.
Figure 26: Evolution of the surface of residential buildings in the Brussels Capital Region from 1996 to 2007 and projection for 25 years in a business as usual scenario; Green: new constructions and extensions; yellow: demolitions; ochre: heavy renovations with building permit; red: small renovation without building permit; orange: unchanged stock. See [CERA08] p.43 for discussion and details. The following Figure shows that due to this trend it can not be expected that the energy consumption for heating of buildings will reach the 1990 value, even if the passive house standard is introduced for new construction.
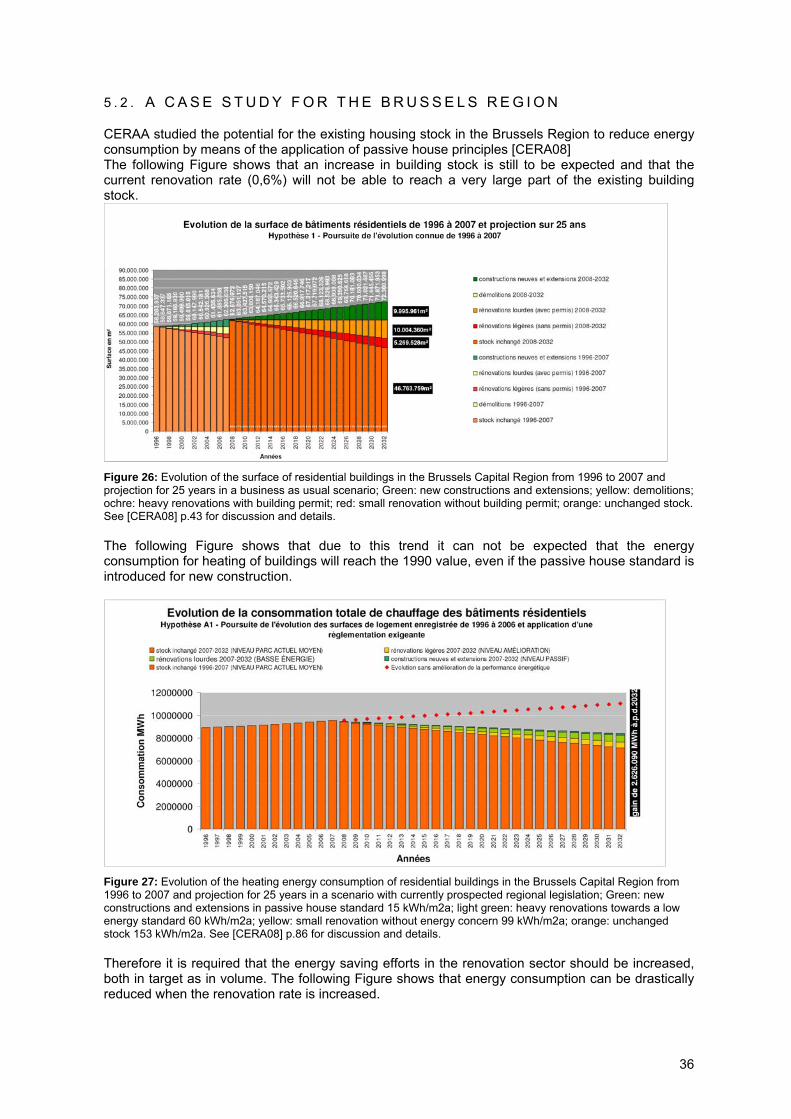
Figure 27: Evolution of the heating energy consumption of residential buildings in the Brussels Capital Region from 1996 to 2007 and projection for 25 years in a scenario with currently prospected regional legislation; Green: new constructions and extensions in passive house standard 15 kWh/m2a; light green: heavy renovations towards a low energy standard 60 kWh/m2a; yellow: small renovation without energy concern 99 kWh/m2a; orange: unchanged stock 153 kWh/m2a. See [CERA08] p.86 for discussion and details. Therefore it is required that the energy saving efforts in the renovation sector should be increased, both in target as in volume. The following Figure shows that energy consumption can be drastically reduced when the renovation rate is increased.
36
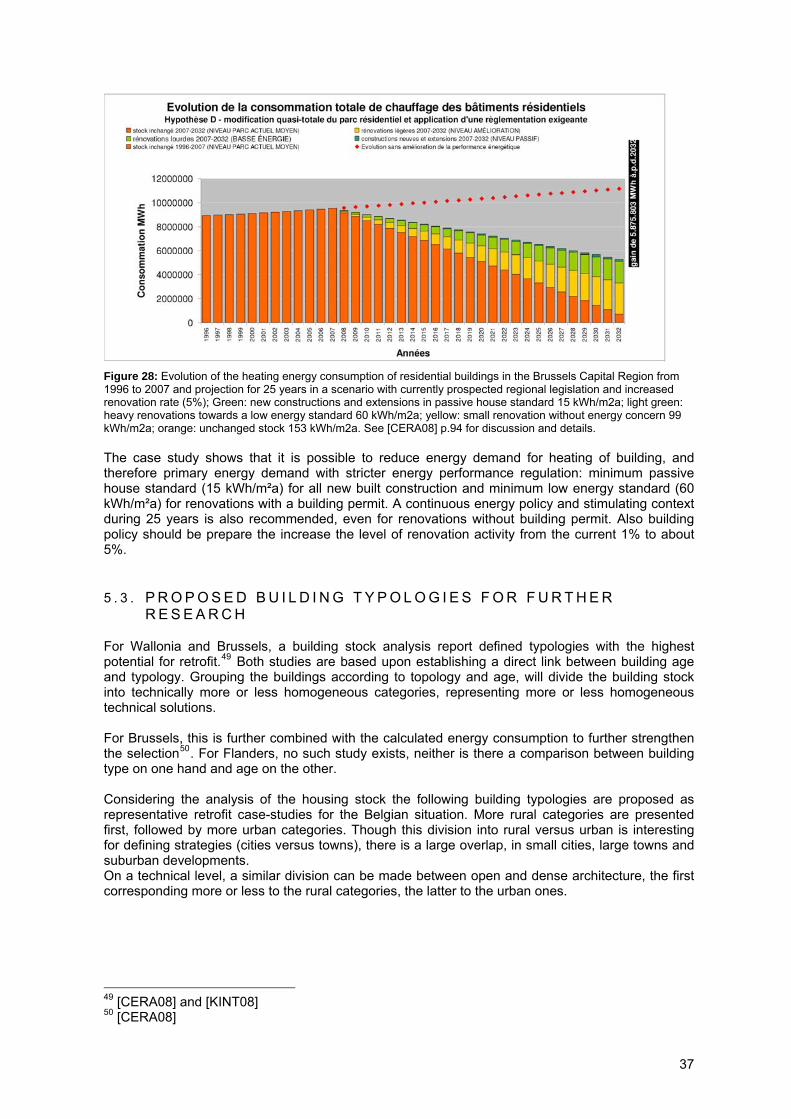
Figure 28: Evolution of the heating energy consumption of residential buildings in the Brussels Capital Region from 1996 to 2007 and projection for 25 years in a scenario with currently prospected regional legislation and increased renovation rate (5%); Green: new constructions and extensions in passive house standard 15 kWh/m2a; light green: heavy renovations towards a low energy standard 60 kWh/m2a; yellow: small renovation without energy concern 99 kWh/m2a; orange: unchanged stock 153 kWh/m2a. See [CERA08] p.94 for discussion and details. The case study shows that it is possible to reduce energy demand for heating of building, and therefore primary energy demand with stricter energy performance regulation: minimum passive house standard (15 kWh/m²a) for all new built construction and minimum low energy standard (60 kWh/m²a) for renovations with a building permit. A continuous energy policy and stimulating context during 25 years is also recommended, even for renovations without building permit. Also building policy should be prepare the increase the level of renovation activity from the current 1% to about 5%.
5 . 3 . P R O P O S E D B U I L D I N G T Y P O L O G I E S F O R F U R T H E R R E S E A R C H
For Wallonia and Brussels, a building stock analysis report defined typologies with the highest potential for retrofit.49 Both studies are based upon establishing a direct link between building age and typology. Grouping the buildings according to topology and age, will divide the building stock into technically more or less homogeneous categories, representing more or less homogeneous technical solutions. For Brussels, this is further combined with the calculated energy consumption to further strengthen the selection50. For Flanders, no such study exists, neither is there a comparison between building type on one hand and age on the other. Considering the analysis of the housing stock the following building typologies are proposed as representative retrofit case-studies for the Belgian situation. More rural categories are presented first, followed by more urban categories. Though this division into rural versus urban is interesting for defining strategies (cities versus towns), there is a large overlap, in small cities, large towns and suburban developments. On a technical level, a similar division can be made between open and dense architecture, the first corresponding more or less to the rural categories, the latter to the urban ones.
49 [CERA08] and [KINT08] 50 [CERA08]
37
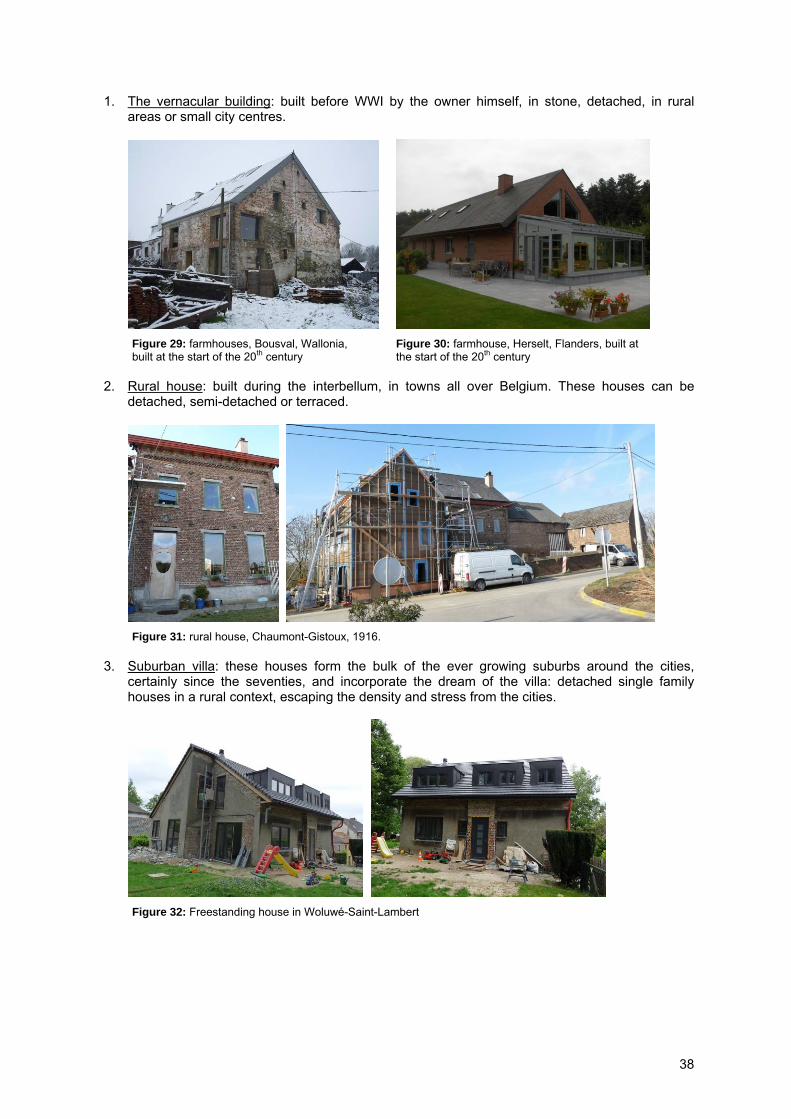
1. The vernacular building: built before WWI by the owner himself, in stone, detached, in rural areas or small city centres.
Figure 29: farmhouses, Bousval, Wallonia, Figure 30: farmhouse, Herselt, Flanders, built at built at the start of the 20th century the start of the 20th century 2. Rural house: built during the interbellum, in towns all over Belgium. These houses can be
detached, semi-detached or terraced.
Figure 31: rural house, Chaumont-Gistoux, 1916. 3. Suburban villa: these houses form the bulk of the ever growing suburbs around the cities,
certainly since the seventies, and incorporate the dream of the villa: detached single family houses in a rural context, escaping the density and stress from the cities.
Figure 32: Freestanding house in Woluwé-Saint-Lambert
38
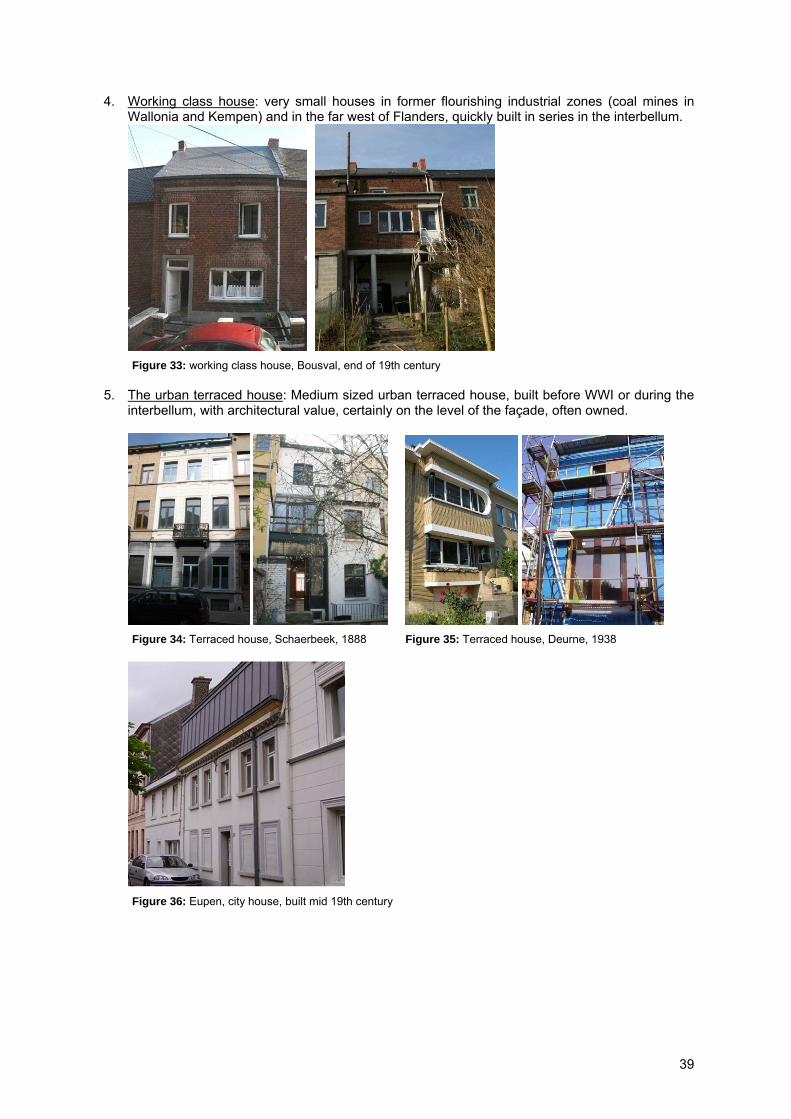
4. Working class house: very small houses in former flourishing industrial zones (coal mines in Wallonia and Kempen) and in the far west of Flanders, quickly built in series in the interbellum.
Figure 33: working class house, Bousval, end of 19th century
5. The urban terraced house: Medium sized urban terraced house, built before WWI or during the
interbellum, with architectural value, certainly on the level of the façade, often owned.
Figure 34: Terraced house, Schaerbeek, 1888 Figure 35: Terraced house, Deurne, 1938
Figure 36: Eupen, city house, built mid 19th century
39
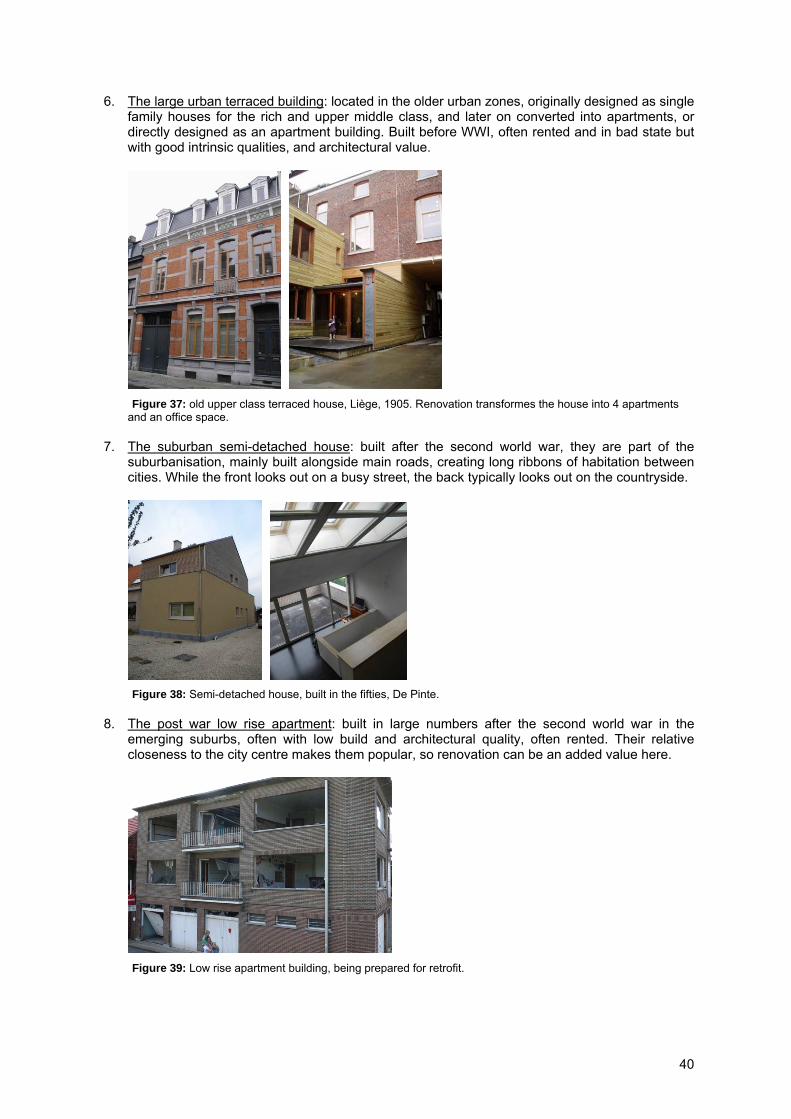
6. The large urban terraced building: located in the older urban zones, originally designed as single family houses for the rich and upper middle class, and later on converted into apartments, or directly designed as an apartment building. Built before WWI, often rented and in bad state but with good intrinsic qualities, and architectural value.
Figure 37: old upper class terraced house, Liège, 1905. Renovation transformes the house into 4 apartments and an office space.
7. The suburban semi-detached house: built after the second world war, they are part of the suburbanisation, mainly built alongside main roads, creating long ribbons of habitation between cities. While the front looks out on a busy street, the back typically looks out on the countryside.
Figure 38: Semi-detached house, built in the fifties, De Pinte. 8. The post war low rise apartment: built in large numbers after the second world war in the
emerging suburbs, often with low build and architectural quality, often rented. Their relative closeness to the city centre makes them popular, so renovation can be an added value here.
Figure 39: Low rise apartment building, being prepared for retrofit.
40
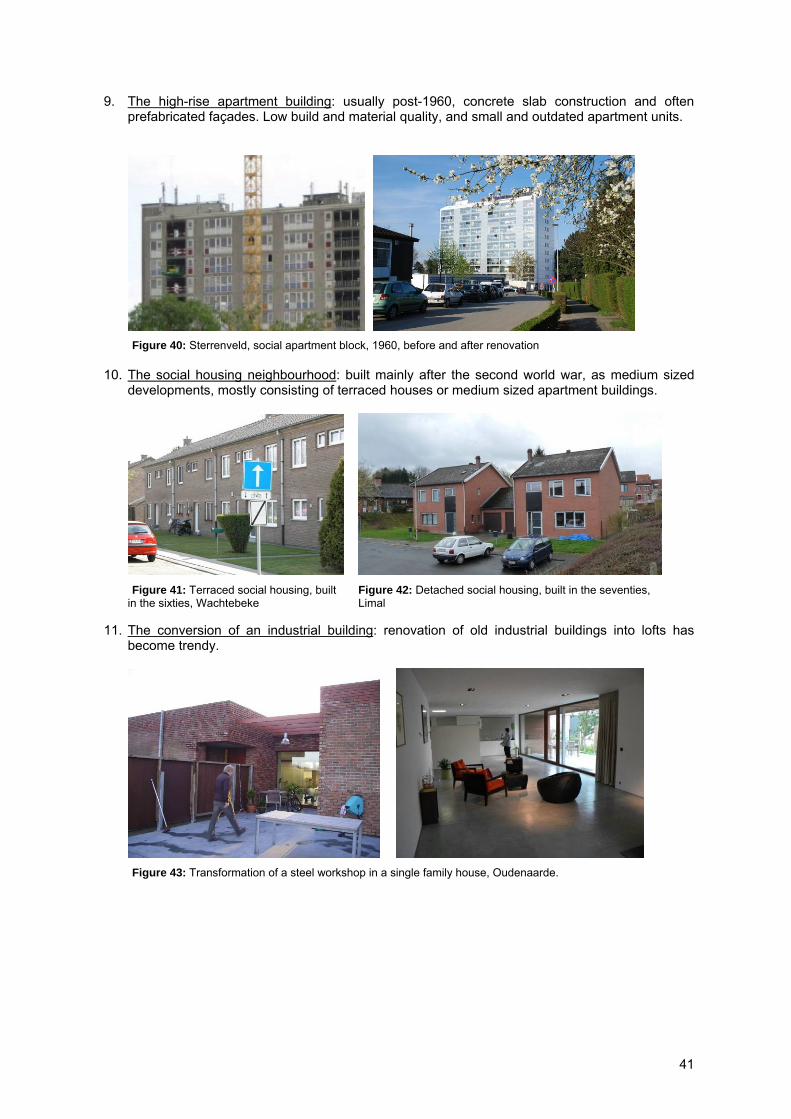
9. The high-rise apartment building: usually post-1960, concrete slab construction and often prefabricated façades. Low build and material quality, and small and outdated apartment units.
Figure 40: Sterrenveld, social apartment block, 1960, before and after renovation 10. The social housing neighbourhood: built mainly after the second world war, as medium sized
developments, mostly consisting of terraced houses or medium sized apartment buildings.
Figure 41: Terraced social housing, built Figure 42: Detached social housing, built in the seventies, in the sixties, Wachtebeke Limal 11. The conversion of an industrial building: renovation of old industrial buildings into lofts has
become trendy.
Figure 43: Transformation of a steel workshop in a single family house, Oudenaarde.
41
6 . M A R K E T S E G M E N T A T I O N F O R L O W E N E R G Y H O U S I N G R E T R O F I T
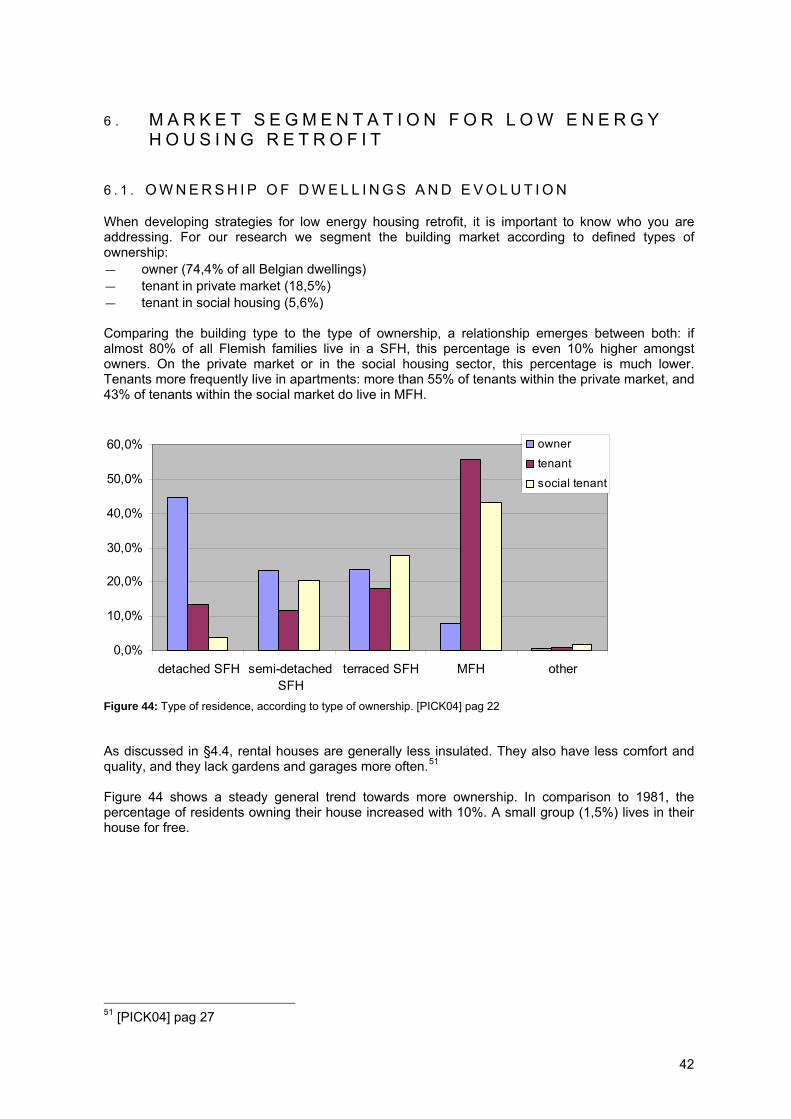
6 . 1 . O W N E R S H I P O F D W E L L I N G S A N D E V O L U T I O N
When developing strategies for low energy housing retrofit, it is important to know who you are addressing. For our research we segment the building market according to defined types of ownership: — owner (74,4% of all Belgian dwellings) — tenant in private market (18,5%) — tenant in social housing (5,6%) Comparing the building type to the type of ownership, a relationship emerges between both: if almost 80% of all Flemish families live in a SFH, this percentage is even 10% higher amongst owners. On the private market or in the social housing sector, this percentage is much lower. Tenants more frequently live in apartments: more than 55% of tenants within the private market, and 43% of tenants within the social market do live in MFH.
0,0%
10,0%
20,0%
30,0%
40,0%
50,0%
60,0%
detached SFH semi-detachedSFH
terraced SFH MFH other
owner
tenant
social tenant
Figure 44: Type of residence, according to type of ownership. [PICK04] pag 22 As discussed in §4.4, rental houses are generally less insulated. They also have less comfort and quality, and they lack gardens and garages more often.51 Figure 44 shows a steady general trend towards more ownership. In comparison to 1981, the percentage of residents owning their house increased with 10%. A small group (1,5%) lives in their house for free.
51 [PICK04] pag 27
42
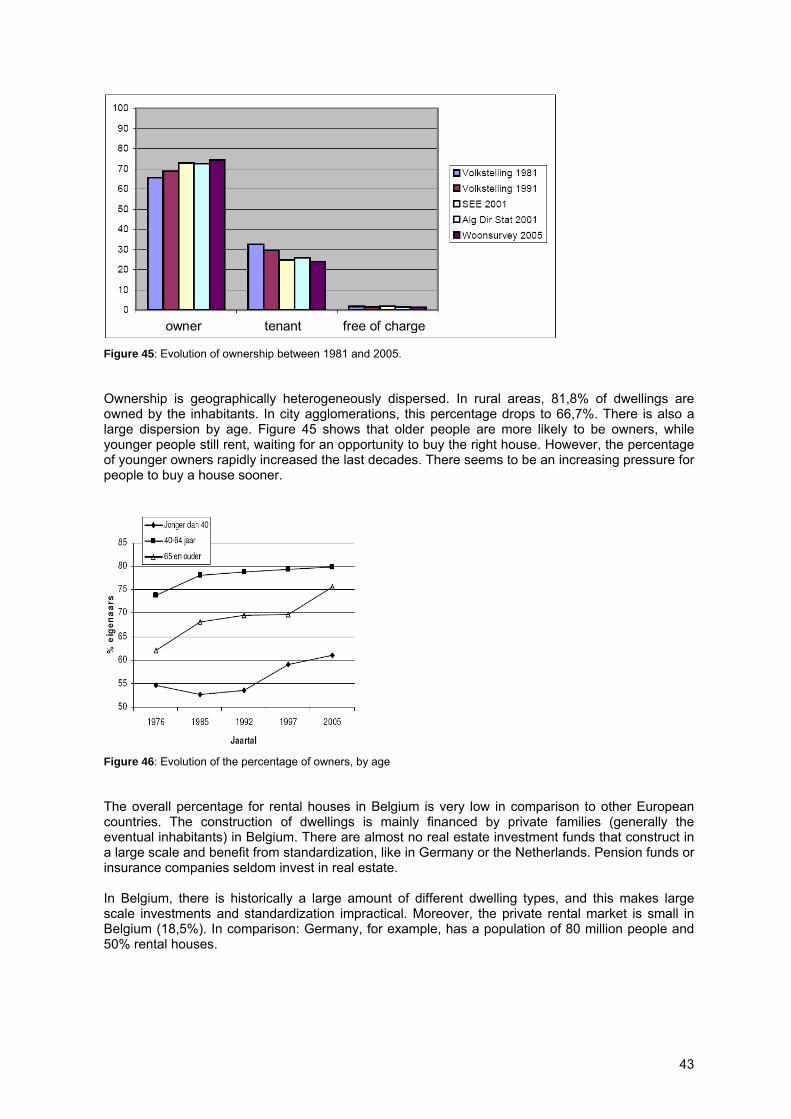
owner tenant free of charge Figure 45: Evolution of ownership between 1981 and 2005. Ownership is geographically heterogeneously dispersed. In rural areas, 81,8% of dwellings are owned by the inhabitants. In city agglomerations, this percentage drops to 66,7%. There is also a large dispersion by age. Figure 45 shows that older people are more likely to be owners, while younger people still rent, waiting for an opportunity to buy the right house. However, the percentage of younger owners rapidly increased the last decades. There seems to be an increasing pressure for people to buy a house sooner.
Figure 46: Evolution of the percentage of owners, by age The overall percentage for rental houses in Belgium is very low in comparison to other European countries. The construction of dwellings is mainly financed by private families (generally the eventual inhabitants) in Belgium. There are almost no real estate investment funds that construct in a large scale and benefit from standardization, like in Germany or the Netherlands. Pension funds or insurance companies seldom invest in real estate. In Belgium, there is historically a large amount of different dwelling types, and this makes large scale investments and standardization impractical. Moreover, the private rental market is small in Belgium (18,5%). In comparison: Germany, for example, has a population of 80 million people and 50% rental houses.
43
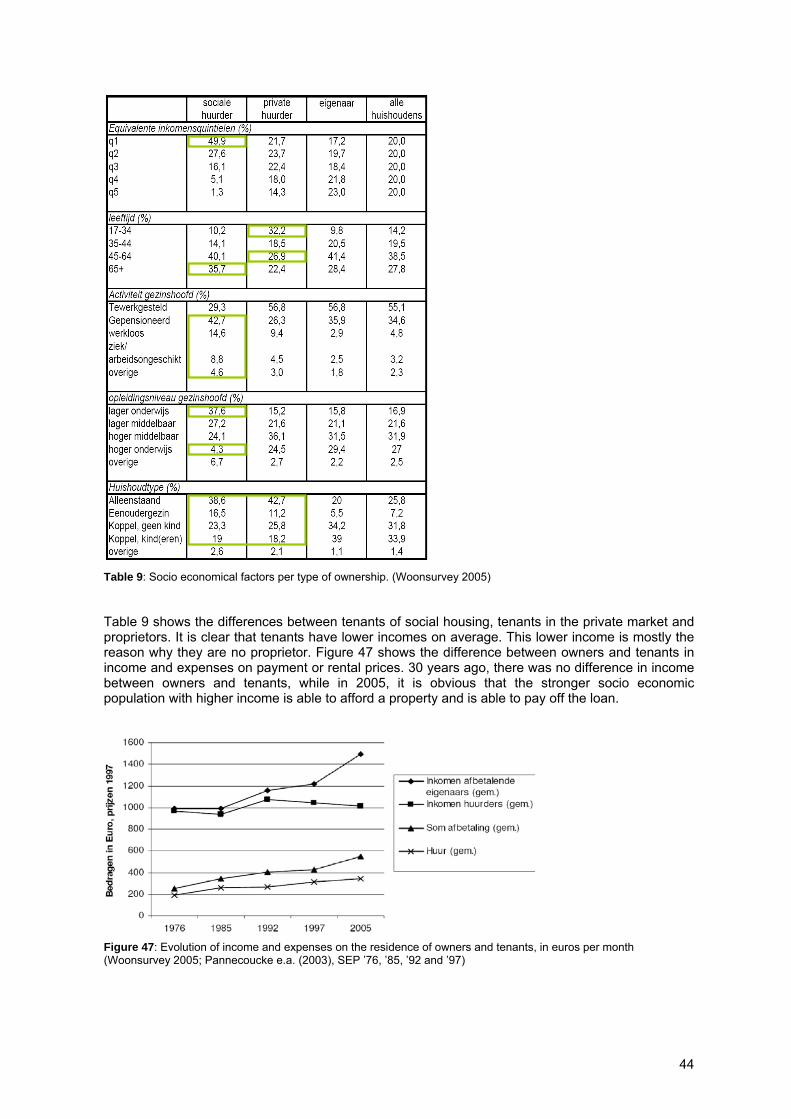
Table 9: Socio economical factors per type of ownership. (Woonsurvey 2005) Table 9 shows the differences between tenants of social housing, tenants in the private market and proprietors. It is clear that tenants have lower incomes on average. This lower income is mostly the reason why they are no proprietor. Figure 47 shows the difference between owners and tenants in income and expenses on payment or rental prices. 30 years ago, there was no difference in income between owners and tenants, while in 2005, it is obvious that the stronger socio economic population with higher income is able to afford a property and is able to pay off the loan.
Figure 47: Evolution of income and expenses on the residence of owners and tenants, in euros per month (Woonsurvey 2005; Pannecoucke e.a. (2003), SEP ’76, ’85, ’92 and ’97)
44
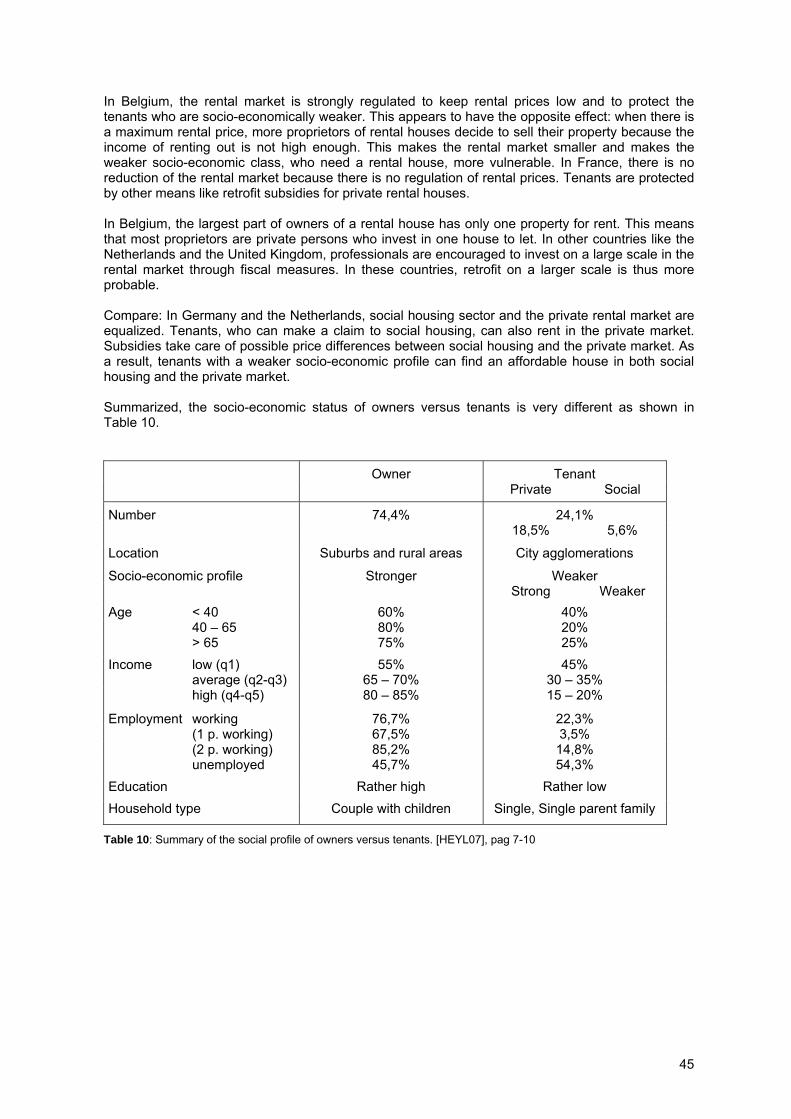
In Belgium, the rental market is strongly regulated to keep rental prices low and to protect the tenants who are socio-economically weaker. This appears to have the opposite effect: when there is a maximum rental price, more proprietors of rental houses decide to sell their property because the income of renting out is not high enough. This makes the rental market smaller and makes the weaker socio-economic class, who need a rental house, more vulnerable. In France, there is no reduction of the rental market because there is no regulation of rental prices. Tenants are protected by other means like retrofit subsidies for private rental houses. In Belgium, the largest part of owners of a rental house has only one property for rent. This means that most proprietors are private persons who invest in one house to let. In other countries like the Netherlands and the United Kingdom, professionals are encouraged to invest on a large scale in the rental market through fiscal measures. In these countries, retrofit on a larger scale is thus more probable. Compare: In Germany and the Netherlands, social housing sector and the private rental market are equalized. Tenants, who can make a claim to social housing, can also rent in the private market. Subsidies take care of possible price differences between social housing and the private market. As a result, tenants with a weaker socio-economic profile can find an affordable house in both social housing and the private market. Summarized, the socio-economic status of owners versus tenants is very different as shown in Table 10.
Owner Tenant Private Social
Number 74,4% 24,1% 18,5% 5,6%
Location Suburbs and rural areas City agglomerations
Socio-economic profile Stronger Weaker Strong Weaker Age < 40 60% 40% 40 – 65 80% 20% > 65 75% 25% Income low (q1) 55% 45% average (q2-q3) 65 – 70% 30 – 35% high (q4-q5) 80 – 85% 15 – 20%
Employment working 76,7% 22,3% (1 p. working) 67,5% 3,5% (2 p. working) 85,2% 14,8% unemployed 45,7% 54,3% Education Rather high Rather low Household type Couple with children Single, Single parent family
Table 10: Summary of the social profile of owners versus tenants. [HEYL07], pag 7-10
45
6 . 2 . D E C I D I N G F A C T O R S
Ownership The vast majority of inhabitants in Belgium are owners: 74,4% in 2005. Furthermore, half of all tenants wish to become owner. Ownership is thus very popular in Belgium, mainly because of the financial advantages. For older people, ownership has a large impact on their welfare. In addition, there are fiscal advantages for proprietors. It is important to notice that the evolution towards more owners and more popularity of ownership is not entirely positive. Only the highest incomes are able to purchase one or more houses, since the payment of a loan to purchase a house is higher than the average rental price. The socio-economic gap between tenants and owners becomes larger (see also Figure). There is also an increasing difference in quality between rental houses and dwellings inhabited by their owners.52
Do most proprietors buy a newly built house or an existing house? The average house costs 165263 euro. The amount differs depending on the type of investment. Acquisitions under 100000 euro are mainly purchases of existing houses with or without renovation (32%) and almost never newly built houses (5,6%). Summary: — purchase of a house: 122736 euro on average — purchase and retrofit: 148612 euro on average — newly built houses: 212163 euro on average Price is related to quality and comfort. The average cost difference between a dwelling of good quality and average quality is 24000 euro. Strangely, there is no price difference between houses of average and good comfort. But there is a large gap of 46000 euro between good and very good comfort. Private rent Of all people who have an income out of rented houses, 60% has only one house to let. Only 15% has more than three houses to let. This means that the Belgian renting market is cut into bits. Most letters are private persons who invest deliberately in real estate, primarily as a supplement for their pension. They are often retired people. Few rental houses are under the authority of professional real estate funds. This means that no large investments are made in residential renting real estate. There are no big insurance companies or pension funds that invest in the renting market, except for two companies operating in Brussels. In Flanders, the tradition of many different dwelling types makes large scale standardized construction projects less effective, so less investments are made. Social rent In Belgium, there are three methods of renting in the social housing sector. — Social housing associations (SHA) own houses and let them at a low price. In 2006, there are
137659 dwellings owned by SHAs. — On municipality level, there are a small number of dwellings let by social welfare (OCMW), the
municipality, or intercommunal organisations. — Social rent offices (SRO) rent apartments in the private sector and sublet them as social
housing with a lower price, thanks to subsidies. In 2005, SROs letted 3032 dwellings. Of all dwellings let as social housing, 54% are single family houses (SFH) and 46% are multi family houses (MFH). Mainly in city agglomerations, most social housing dwelling are high apartment buildings with over 5 floors. These high rise buildings cover 16,5% of all social houses. The quality of these houses is generally very good (see previous chapter). Two thirds of these houses are built after 1971. They mainly have a better score on access and accommodation than properties, since they are often built in city agglomerations. 52 [HEYL07]
46
7 . S U M M A R Y A N D C O N C L U S I O N S
7 . 1 . P O L I C Y D E C I D I N G P A R A M E T E R S
Our analysis shows that energy and building policy decisions considering low energy housing retrofit should relate to the specificity of the municipality, province or region. From the research we conclude that the following research parameters are essential policy motivation parameters considering low energy housing retrofit: — Comfort and quality improvement — Energy efficiency reduction potential — Number of houses in a certain typology The first two parameters depend on building age and socio-economic status of the owner. The third parameter decides whether a certain typology is worth researching in detail. All three parameters are linked with geography and ownership. The underlying motives to increase low energy housing retrofit are [EBR2005]:
- Resources & consumption – energy saving in the building sector requires essentially high energy efficiency;
- Comfort & well-being – low energy housing retrofit can lead to optimal indoor climate, healthy indoor air conditions, overall comfortable surface temperatures and even temperature distribution, better natural lighting, and better acoustical performance of buildings;
- Construction protection – good insulation, reduction of thermal bridges, airtightness and good ventilation prevent condensation and formation of mould: the reason for many construction damages can thus be avoided;
- Construction value – the applied new components are durable; the better energy performance will lead to better future value of the houses
- Rentability – the living space is long-term attractive for tenants through high standards, high living comfort and low energy expenses; energy efficiency guarantees an assurance against increasing energy costs and due to the relatively stable energy expenses of low energy housing retrofits, tenants will be more able to pay rent.
- Urban development – the retrofit of buildings from the 30ies to the 70ies lead to a technical strengthening and a social, cultural and urban revaluation.
- Employment creation – hundreds of thousands of regional employments could be created and maintained through an aimed applied energy policy. Subsidies should be looked at as an economical perpetuum mobile, since the resulting savings effect is higher.
- Climate protection – it is possible to save 90 % CO2 with cost-value ration with a broad effect. Insulation and energy efficiency must be made attractive, because they represent an environmentally and politically extreme thankful activity field.
7 . 2 . D I F F E R E N T B U I L D I N G T Y P E S R E Q U I R E D I F F E R E N T T Y P E S O F R E T R O F I T
There are some clear definitions of which types of dwellings need to be retrofitted, based on the discussed statistical data. These are determined by following factors: — North / South and New / Old contrast: the north of Belgium has more recently built houses than
the south. This has great impact on the quality and comfort of the houses. The geographical and historical dispersion is quite parallel. The area along the French border also belong to the older building stock. An important share of these older houses are detached, built before 1970 (or even 1919), and have a very large energy consumption. Quality and comfort are often insufficient, and retrofit will have a positive impact on both energy efficiency and living comfort.
— City / Suburbs contrast: the vast majority of all dwellings are in cities and suburbs, because of their good accessibility. But the contrast of typology between these two is very large. The
47
suburbs house is detached, recently built, large and has very good comfort. The city house on the other had is an apartment or an old row house which is not energy efficient. The popularity of cities decreases because of the lack of quality (modern services, acoustic insulation,…) in houses in the cities. This is why the retrofit of urban dwellings will have a large impact.
In a very rough way, the most important share of the Belgian building stock can be divided in these two classes: New-North or Old-South on the one hand, and City or Suburbs on the other hand. The Old-South group and the City group have a high retrofit potential; those houses belonging to both of these groups have the highest potential. These are the Walloon houses of the workman’s class in the industrial belt between Liège and Charleroi. It is important to notice that relatively more of the houses with a high retrofit potential are rental houses. Policy should be adapted to this type of ownership by making retrofit more attractive and giving advantages to owners. Due to increasing house prices, smaller houses and rental apartments become more popular. That is also why it is important to focus on these smaller house types. In the previous section building types for further study have been defined.
7 . 3 . A T A R G E T G R O U P O R I E N T E D A P P R O A C H I S R E Q U I R E D
Strategies for the promotion of low energy housing retrofit should be person-oriented, preferably related to ownership structure (owner, private rent or social rent). Building owners can be considered to be the lowest hanging fruit for low energy housing retrofit, because or the large amount of buildings with private owners. However, we notice that this target group remains largely immobile between a first renovation, just after obtaining the house, and old age when other spatial or comfort requirements are wished for. Strategies should be developed to reach this target group at the stage when they intend to renovate, usually because of non-energy related factors. Additionally, secondary low energy housing retrofits should be stimulated, because energy policy objectives can never be reached with the current rate of renovation. Urban areas might have more benefit with examples focusing on quality improvement of row houses or apartment buildings in the (private) rent sector. Stimulating low energy housing retrofit for existing mixed-owner buildings requires the development of innovative participation processes. An urban area approach could highlight the extra difficulties to solve on the urban level. The specificity of the social housing sector requires a separate approach for social housing renovation, focusing on cooperation between low-income target groups and their points of reference, municipalities and social housing associations.
7 . 4 . E N E R G Y P O L I C Y S H O U L D R E I N F O R C E A N D B R O A D E N B E S T P R A C T I C E E N E R G Y E F F I C I E N T R E N O V A T I O N
The scenario analysis for, and demonstration projects in, the Brussels Capital Region show that it is possible to drastically reduce energy demand for heating of building, and therefore primary energy demand in a whole region. However, to obtain reduction in energy consumption compared to 1990 levels, stricter energy performance regulation is required: minimum passive house standard for all new built construction and minimum low energy standard for renovations with a building permit. A continuous energy policy and stimulating context during 25 years is also recommended, even for renovations without building permit. Also the amount of renovation activity should be increased by stimulating action from the current 1% to about 5%.
48
8 . R E F E R E N C E S
[BART05] Bartiaux, F. et al., Socio-technical factors influencing residential energy consumption (Serec), Part 1: Sustainable production and consumption patterns, Scientific support plan for a sustainable development policy (SPSD II), UCL, VITO and Danish Building Research Institute, January 2006.
[CERA08] Centre d’Etude, de Recherche et d’Action en Architecture asbl, L’application de principes de la maison passive en region de Bruxelles-Capitale, Final report realised for the Ministers B. Cerexhe and E. Huytebroeck, IRSIB et Bruxelles-Environnement, Brussels, June 2008.
[ECON07] Econotec, Energy Efficiency Policies and Measures in Belgium 2006 Monitoring of Energy Efficiency in EU 15 and Norway (ODYSSEE-MURE), Brussels, January 2007.
[EBR05] International conference and exhibition ecological building retrofit, Weiz, Austria, October 13-15, 2005, AEE Intec, Gleisdorf, Austria.
[ERAB08] Itard, L, Meijer, F., Vrins, E., Hoiting, H., Building Renovation and Modernisation in Europe: State of the art review (2008) ERABUILD final report, OTB TU Delft, January 2008.
[ERK08] E-retrofit-kit, Tool-kit for ‘Passive House Retrofit’, IEE project, publishable report, 2008, http://www.energieinstitut.at/retrofit.
[HEYL07] Heylen, K. et al., Wonen in Vlaanderen: De resultaten van de Woonsurvey 2005 en de Uitwendige Woningschouwing 2005, Ministerie van de Vlaamse Gemeenschap, Departement RWO – Woonbeleid, 2007.
[IEA95] International Energy Agency, Future Building Forum, 2nd FBF Think Tank Workshop, Paris, 1995.
[IEA09] International Energy Agency, Energy Conservation in Buildings and Community Systems, Annex 53, Total Energy Use in Buildings - Analysis and evaluation methods, Draft of Research Plan (Ver. 7), May 8, 2009; Operating Agent: Prof. H.i Yoshino.
[KOHL02] Kohler, N., Hassler, U., The building stock as a research object, Building Research & Information (2002) 30(4), 226-236.
[LEMA04] Lemaître, J. and De Smedt, P., Algemene omgevingsanalyse Vlaanderen, Ministerie van de Vlaamse gemeenschap, Administratie Planning en statistiek, August 2004.
[LROY06] Le Roy, M., Myncke, R. and Vandekerckhove, B., Ruimte voor woonbeleid: Stand van zaken onderzoek woningaanbod in Vlaanderen, Kenniscentrum voor Duurzaam Woonbeleid and SumResearch, July 2006.
[ODEL88] O’Dell, A., An evaluation of the house condition measurements in the context of the English house condition survey, CIB Conference, Tällberg, 1988.
[PICK04] Pickery, J., Woonkwaliteit en tevredenheid in Vlaanderen, Ministerie van de Vlaamse gemeenschap, Administratie Planning en statistiek, in: Stativaria, July 2004.
[VANE07] Vanneste, D., Thomas, I. and Goossens, L., Sociaal-economische enquête 2001 - Woning en woonomgeving in België, FOD Economie, K.M.O., Middenstand en Energie, Algemene Directie Statistiek en Economische Informatie, 2007.
49

[3EHL08] 3E / Provinciale Hogeschool Limburg, Opties voor reductie van CO2-uitstoot in de woningsector, July 2008.
[WILH82] Wilhemsen, A.M. (1982) (ed.) Methods for surveying and describing the building stock, Proceedings of the CIB W70 1981 Symposium, Swedish Council for Building Research.
[WINT07] Winters, S. et al., Op weg naar een nieuw Vlaams sociaal huurstelsel? – Samenvatting, Ministerie van de Vlaamse Gemeenschap, Departement RWO – Woonbeleid, June 2007.
[VEA05] Significant Marketing Research, Energiegebruik in huishoudens in Vlaanderen, Resultaten enquête 2005, Vlaams Energie Agentschap, December 2005.
[KINT08] Kints, C., La rénovation énergétique et durable des logements Wallons, Architecture & Climat, UCL, September 2008.
50

51

52 52