Embed Size (px)
Citation preview
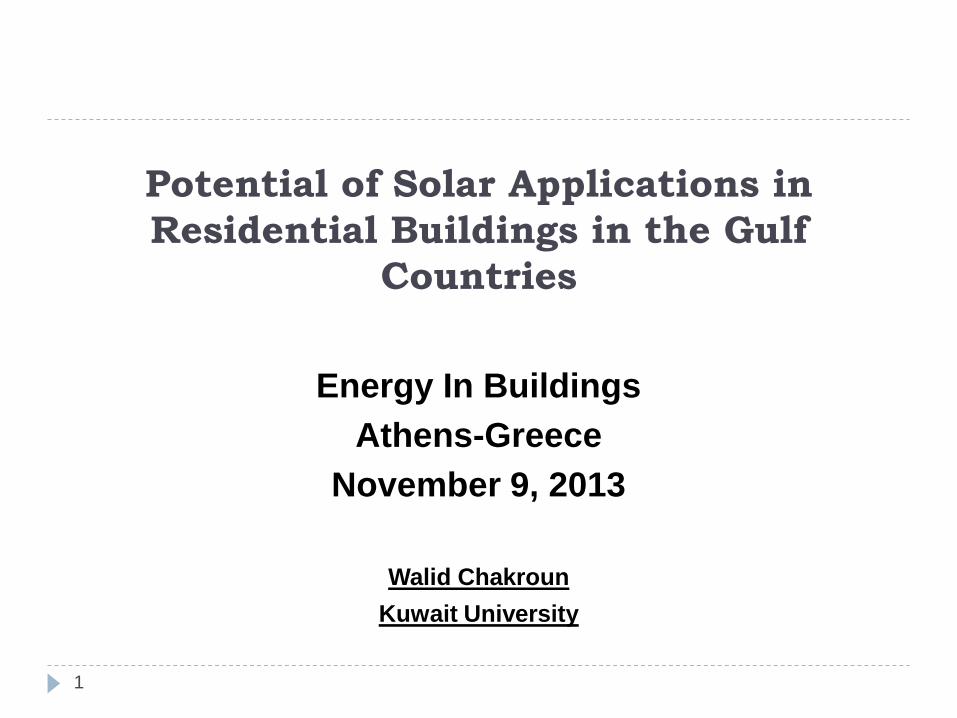
Potential of Solar Applications in
Residential Buildings in the Gulf
Countries
1
Energy In Buildings
Athens-Greece
November 9, 2013
Walid Chakroun
Kuwait University
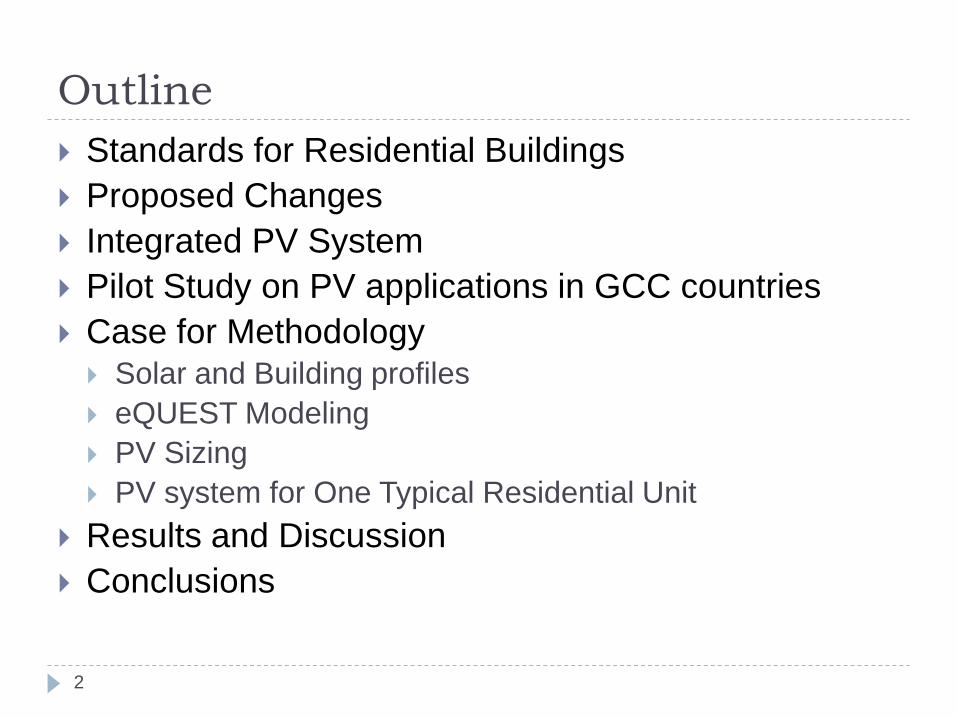
Outline
2
Standards for Residential Buildings
Proposed Changes
Integrated PV System
Pilot Study on PV applications in GCC countries
Case for Methodology Solar and Building profiles
eQUEST Modeling
PV Sizing
PV system for One Typical Residential Unit
Results and Discussion
Conclusions
Why Energy in Buildings?
3
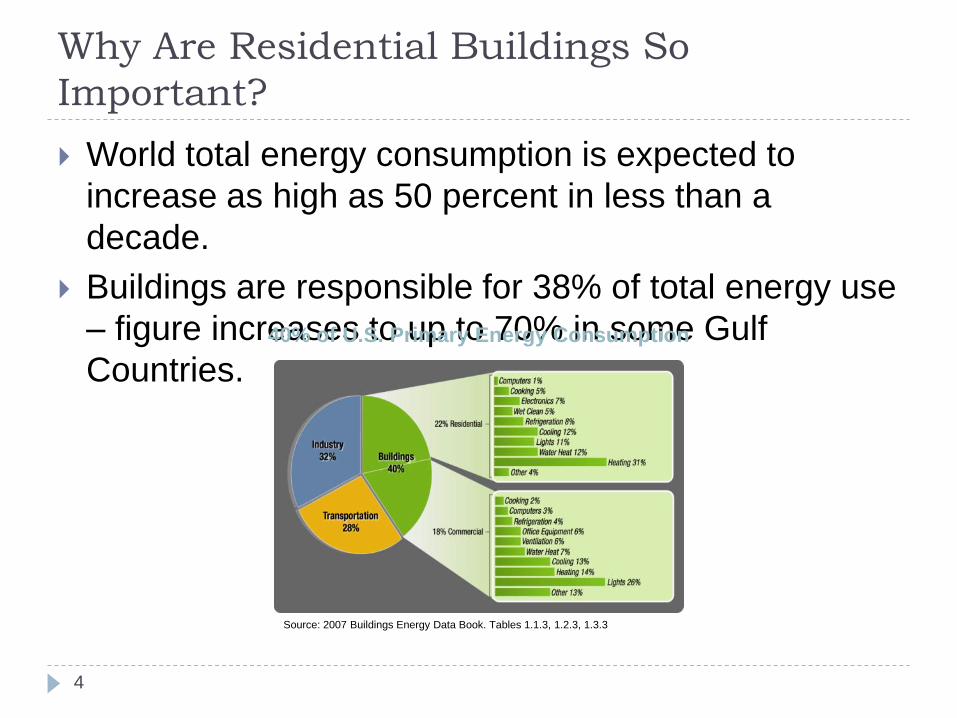
Why Are Residential Buildings So
Important?
4
World total energy consumption is expected to
increase as high as 50 percent in less than a
decade.
Buildings are responsible for 38% of total energy use
– figure increases to up to 70% in some Gulf
Countries.
40% of U.S. Primary Energy Consumption
Source: 2007 Buildings Energy Data Book. Tables 1.1.3, 1.2.3, 1.3.3
Fastest Growing Energy Sector
5
0
5
10
15
20
25
30
35
40
45
1980 1985 1990 1995 2000 2005
Qu
ad
s
Year
Industrial
Transportation
Buildings Total
Source: EIA Annual Energy Review, Tables 2.1b-2.1f., June 2007
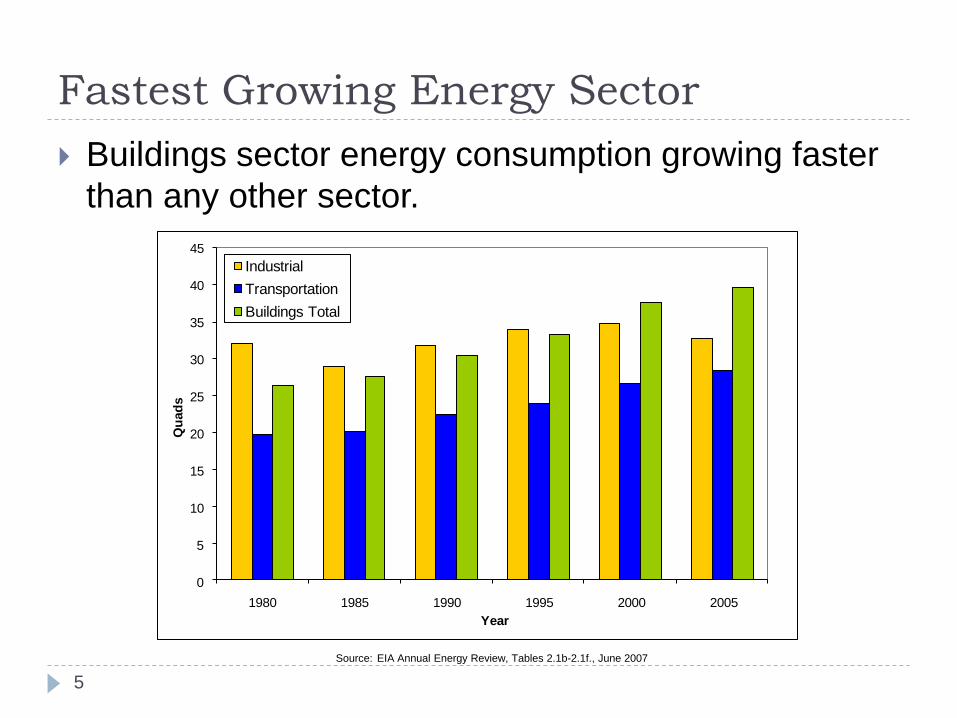
Buildings sector energy consumption growing faster
than any other sector.
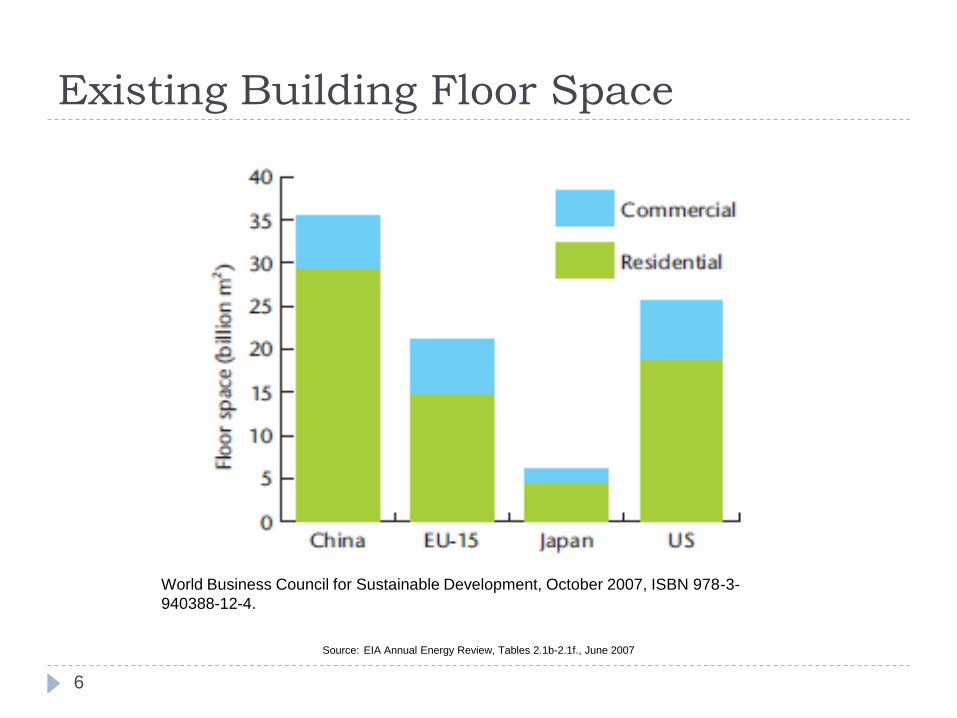
Existing Building Floor Space
6
World Business Council for Sustainable Development, October 2007, ISBN 978-3-
940388-12-4.
Source: EIA Annual Energy Review, Tables 2.1b-2.1f., June 2007
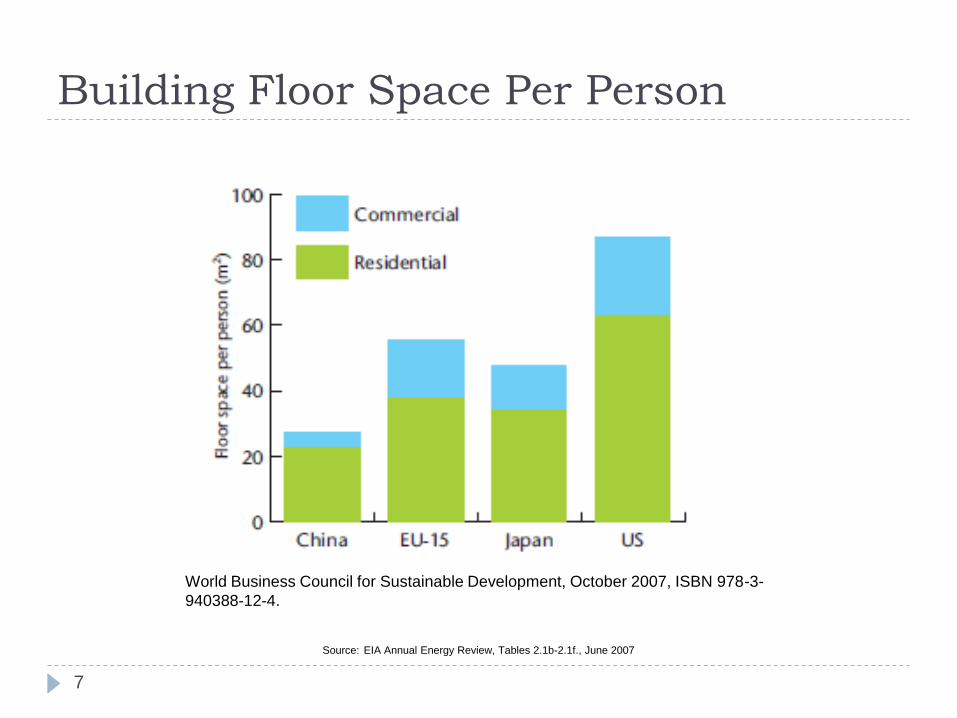
Building Floor Space Per Person
7
Source: EIA Annual Energy Review, Tables 2.1b-2.1f., June 2007
World Business Council for Sustainable Development, October 2007, ISBN 978-3-
940388-12-4.
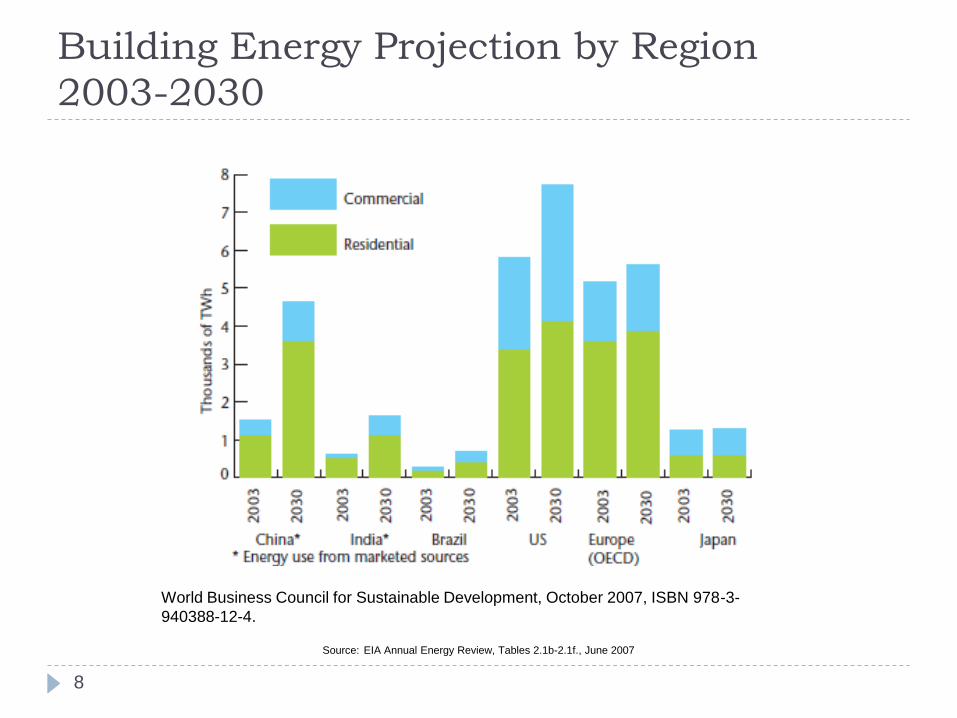
Building Energy Projection by Region
2003-2030
8
World Business Council for Sustainable Development, October 2007, ISBN 978-3-
940388-12-4.
Source: EIA Annual Energy Review, Tables 2.1b-2.1f., June 2007
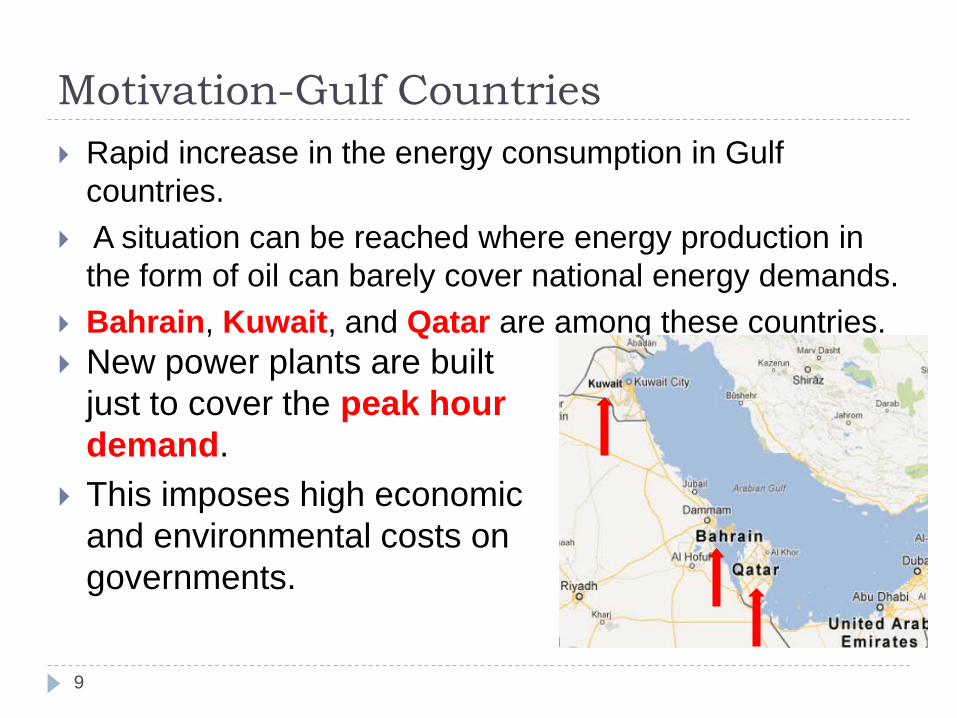
Motivation-Gulf Countries
Rapid increase in the energy consumption in Gulf
countries.
A situation can be reached where energy production in
the form of oil can barely cover national energy demands.
Bahrain, Kuwait, and Qatar are among these countries.
9
New power plants are built
just to cover the peak hour
demand.
This imposes high economic
and environmental costs on
governments.
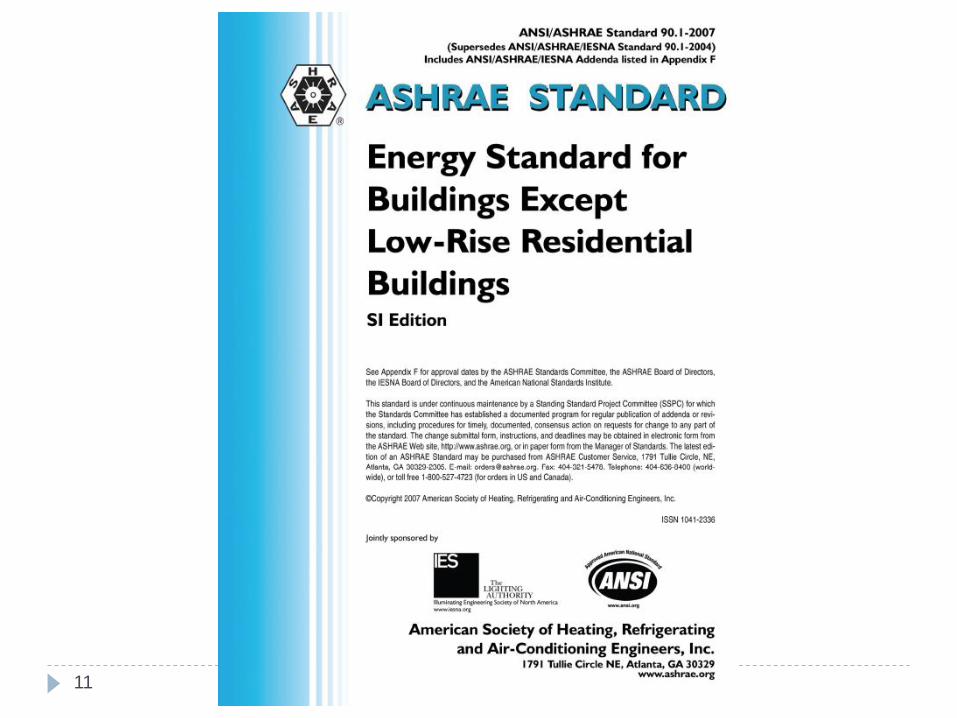
Implementation of Energy Standard
10
11
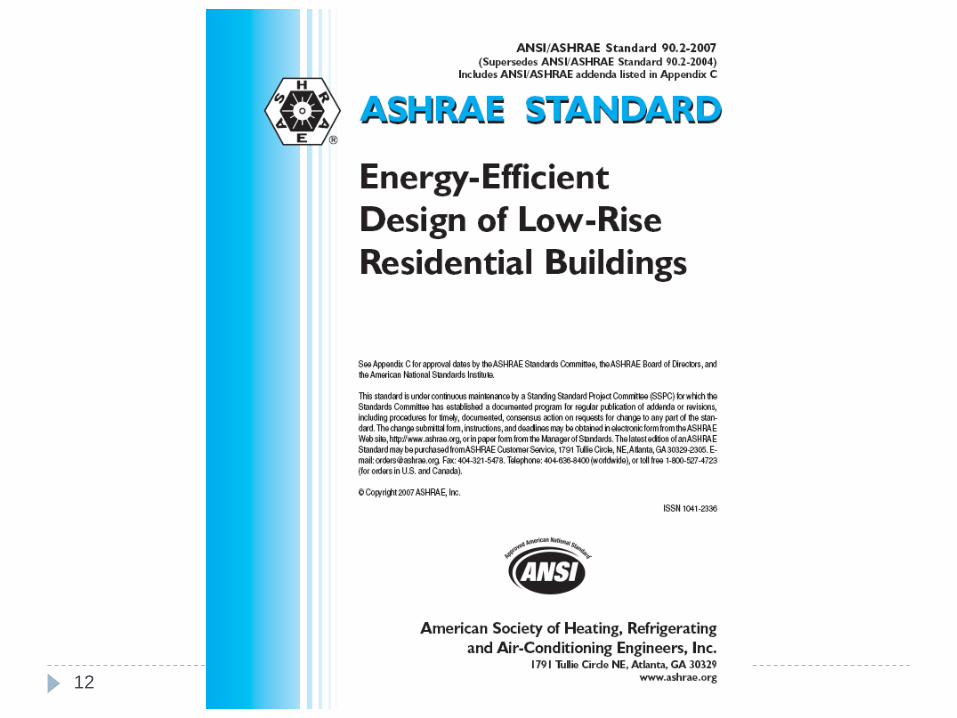
12
13
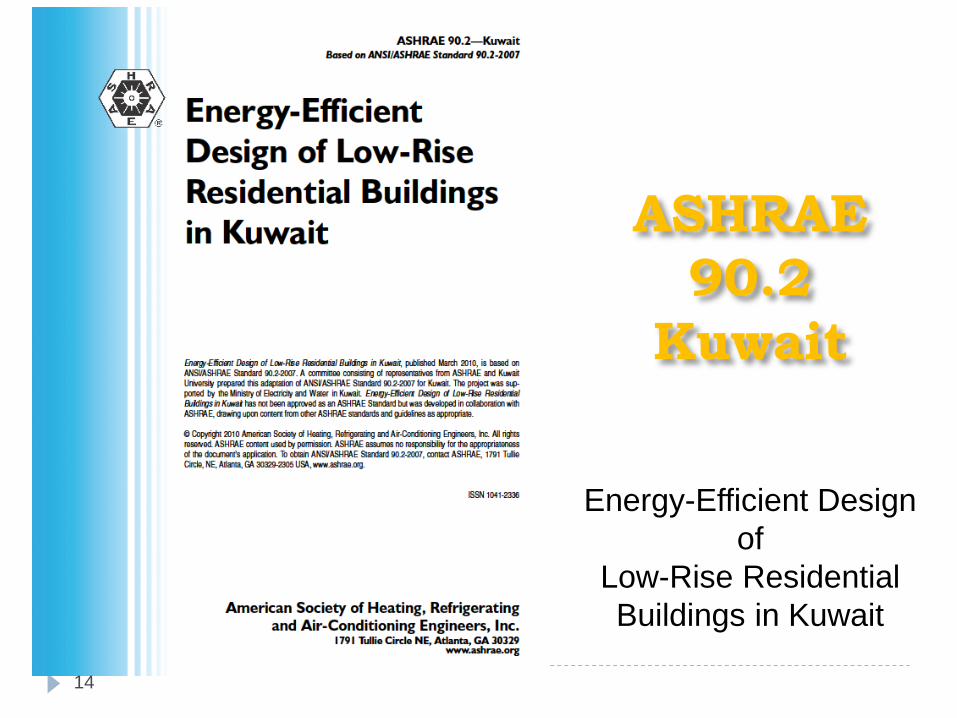
ASHRAE
90.2
Kuwait
Energy-Efficient Design
of
Low-Rise Residential
Buildings in Kuwait
14

15
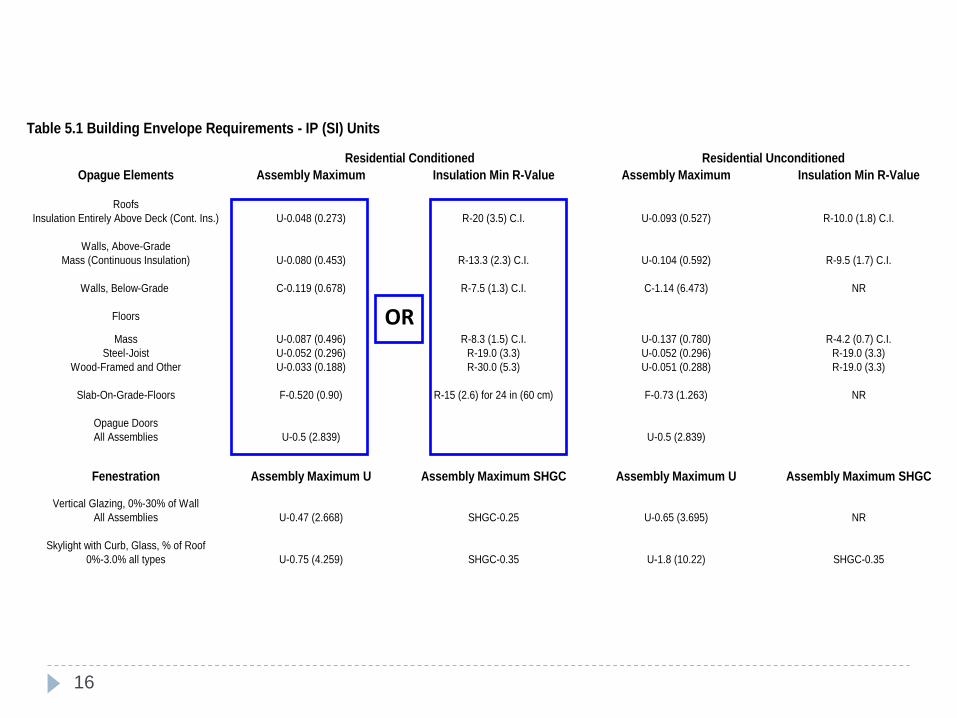
Table 5.1 Building Envelope Requirements - IP (SI) Units
Opague Elements Assembly Maximum Insulation Min R-Value Assembly Maximum Insulation Min R-Value
Roofs
Insulation Entirely Above Deck (Cont. Ins.) U-0.048 (0.273) R-20 (3.5) C.I. U-0.093 (0.527) R-10.0 (1.8) C.I.
Walls, Above-Grade
Mass (Continuous Insulation) U-0.080 (0.453) R-13.3 (2.3) C.I. U-0.104 (0.592) R-9.5 (1.7) C.I.
Walls, Below-Grade C-0.119 (0.678) R-7.5 (1.3) C.I. C-1.14 (6.473) NR
Floors
Mass U-0.087 (0.496) R-8.3 (1.5) C.I. U-0.137 (0.780) R-4.2 (0.7) C.I.
Steel-Joist U-0.052 (0.296) R-19.0 (3.3) U-0.052 (0.296) R-19.0 (3.3)
Wood-Framed and Other U-0.033 (0.188) R-30.0 (5.3) U-0.051 (0.288) R-19.0 (3.3)
Slab-On-Grade-Floors F-0.520 (0.90) R-15 (2.6) for 24 in (60 cm) F-0.73 (1.263) NR
Opague Doors
All Assemblies U-0.5 (2.839) U-0.5 (2.839)
Fenestration Assembly Maximum U Assembly Maximum SHGC Assembly Maximum U Assembly Maximum SHGC
Vertical Glazing, 0%-30% of Wall
All Assemblies U-0.47 (2.668) SHGC-0.25 U-0.65 (3.695) NR
Skylight with Curb, Glass, % of Roof
0%-3.0% all types U-0.75 (4.259) SHGC-0.35 U-1.8 (10.22) SHGC-0.35
Residential Conditioned Residential Unconditioned
Opaque Elements
OR
16
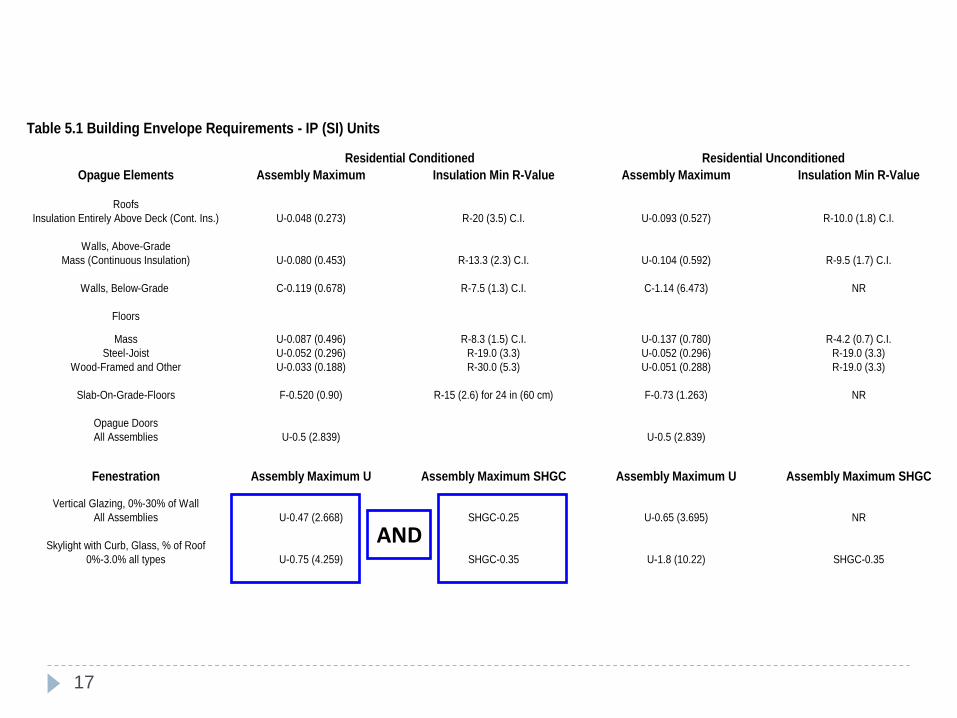
Table 5.1 Building Envelope Requirements - IP (SI) Units
Opague Elements Assembly Maximum Insulation Min R-Value Assembly Maximum Insulation Min R-Value
Roofs
Insulation Entirely Above Deck (Cont. Ins.) U-0.048 (0.273) R-20 (3.5) C.I. U-0.093 (0.527) R-10.0 (1.8) C.I.
Walls, Above-Grade
Mass (Continuous Insulation) U-0.080 (0.453) R-13.3 (2.3) C.I. U-0.104 (0.592) R-9.5 (1.7) C.I.
Walls, Below-Grade C-0.119 (0.678) R-7.5 (1.3) C.I. C-1.14 (6.473) NR
Floors
Mass U-0.087 (0.496) R-8.3 (1.5) C.I. U-0.137 (0.780) R-4.2 (0.7) C.I.
Steel-Joist U-0.052 (0.296) R-19.0 (3.3) U-0.052 (0.296) R-19.0 (3.3)
Wood-Framed and Other U-0.033 (0.188) R-30.0 (5.3) U-0.051 (0.288) R-19.0 (3.3)
Slab-On-Grade-Floors F-0.520 (0.90) R-15 (2.6) for 24 in (60 cm) F-0.73 (1.263) NR
Opague Doors
All Assemblies U-0.5 (2.839) U-0.5 (2.839)
Fenestration Assembly Maximum U Assembly Maximum SHGC Assembly Maximum U Assembly Maximum SHGC
Vertical Glazing, 0%-30% of Wall
All Assemblies U-0.47 (2.668) SHGC-0.25 U-0.65 (3.695) NR
Skylight with Curb, Glass, % of Roof
0%-3.0% all types U-0.75 (4.259) SHGC-0.35 U-1.8 (10.22) SHGC-0.35
Residential Conditioned Residential Unconditioned
Fenestration
AND
17
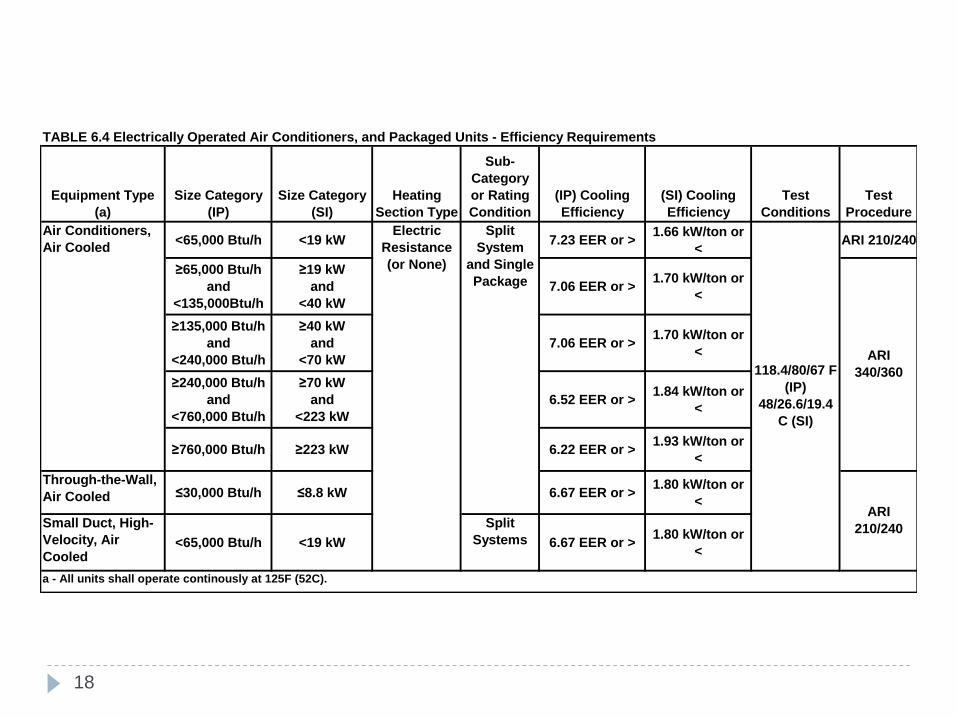
Equipment Type
(a)
Size Category
(IP)
Size Category
(SI)
Heating
Section Type
Sub-
Category
or Rating
Condition
(IP) Cooling
Efficiency
(SI) Cooling
Efficiency
Test
Conditions
Test
Procedure
<65,000 Btu/h <19 kW 7.23 EER or >1.66 kW/ton or
<ARI 210/240
≥65,000 Btu/h
and
<135,000Btu/h
≥19 kW
and
<40 kW
7.06 EER or >1.70 kW/ton or
<
≥135,000 Btu/h
and
<240,000 Btu/h
≥40 kW
and
<70 kW
7.06 EER or >1.70 kW/ton or
<
≥240,000 Btu/h
and
<760,000 Btu/h
≥70 kW
and
<223 kW
6.52 EER or >1.84 kW/ton or
<
≥760,000 Btu/h ≥223 kW 6.22 EER or >1.93 kW/ton or
<
Through-the-Wall,
Air Cooled ≤30,000 Btu/h ≤8.8 kW 6.67 EER or >1.80 kW/ton or
<
Small Duct, High-
Velocity, Air
Cooled<65,000 Btu/h <19 kW
Split
Systems 6.67 EER or >1.80 kW/ton or
<
TABLE 6.4 Electrically Operated Air Conditioners, and Packaged Units - Efficiency Requirements
a - All units shall operate continously at 125F (52C).
ARI
210/240
ARI
340/360
Electric
Resistance
(or None)
Split
System
and Single
Package
Air Conditioners,
Air Cooled
118.4/80/67 F
(IP)
48/26.6/19.4
C (SI)
18
19
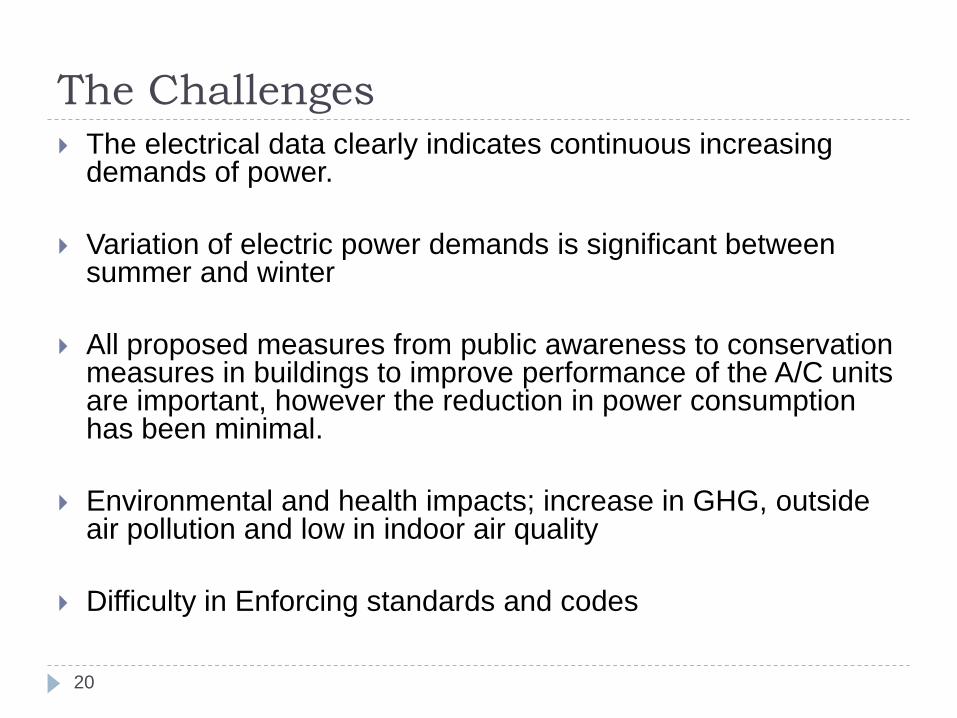
The Challenges
20
The electrical data clearly indicates continuous increasing demands of power.
Variation of electric power demands is significant between summer and winter
All proposed measures from public awareness to conservation measures in buildings to improve performance of the A/C units are important, however the reduction in power consumption has been minimal.
Environmental and health impacts; increase in GHG, outside air pollution and low in indoor air quality
Difficulty in Enforcing standards and codes
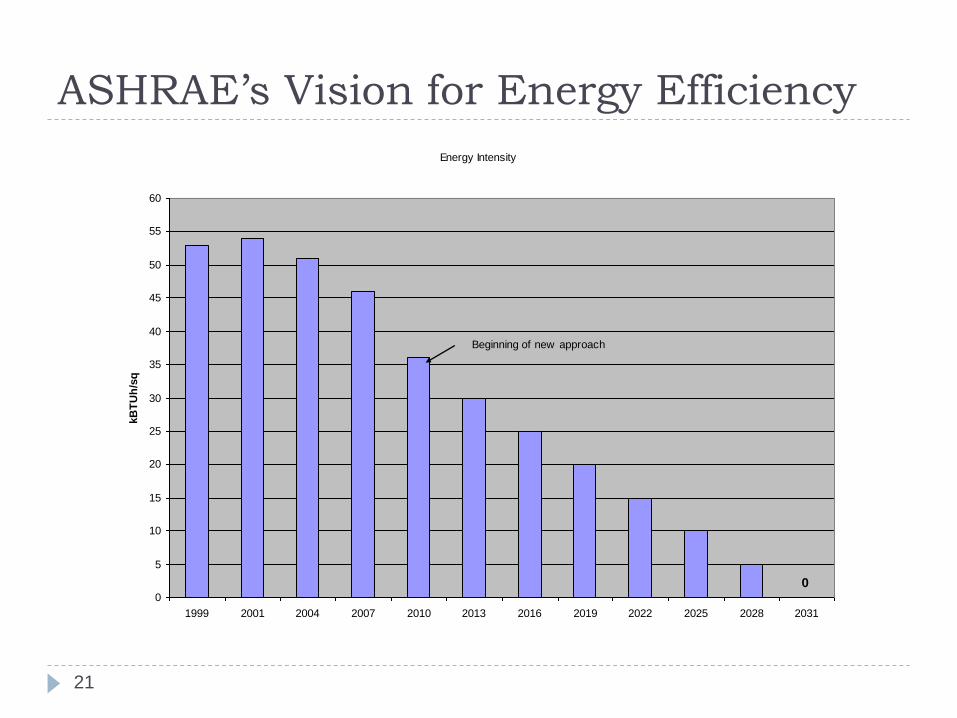
ASHRAE’s Vision for Energy Efficiency
21
Energy Intensity
0
5
10
15
20
25
30
35
40
45
50
55
60
1999 2001 2004 2007 2010 2013 2016 2019 2022 2025 2028 2031
kB
TU
h/s
q f
t
Beginning of new approach
0
Propose Changes
22
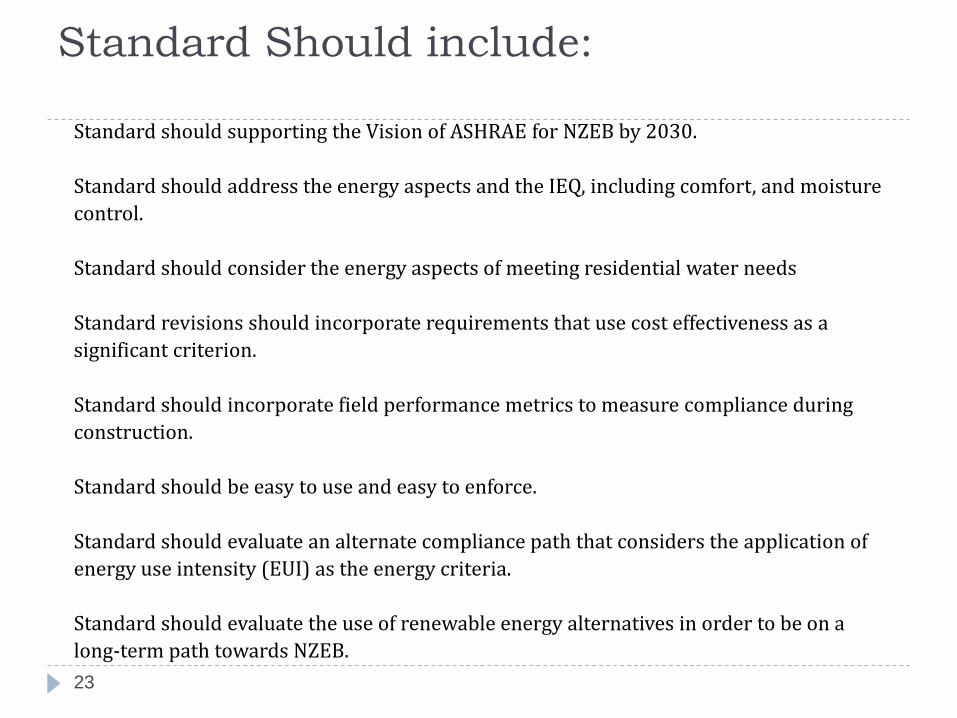
Standard Should include:
23
Standard should supporting the Vision of ASHRAE for NZEB by 2030.
Standard should address the energy aspects and the IEQ, including comfort, and moisture
control.
Standard should consider the energy aspects of meeting residential water needs
Standard revisions should incorporate requirements that use cost effectiveness as a
significant criterion.
Standard should incorporate field performance metrics to measure compliance during
construction.
Standard should be easy to use and easy to enforce.
Standard should evaluate an alternate compliance path that considers the application of
energy use intensity (EUI) as the energy criteria.
Standard should evaluate the use of renewable energy alternatives in order to be on a
long‐term path towards NZEB.
Integrated PV Systems
24

Integrating PV systems
25
Alternative energy production can be used to offset
peak load demand and avoid building new power
plants that run on fossil fuels.
Solar energy has a very good potential
Characteristics Bahrain Kuwait Qatar
Latitude (° N) 26.3 28.6 25.3
Longitude (° E) 50.7 47.9 51.6
Average Insolation (kWh/m2/day) 5.35 5.46 5.09
Solar energy will help the governments diversify their
energy sources and thus increase profitability from
exporting the oil.
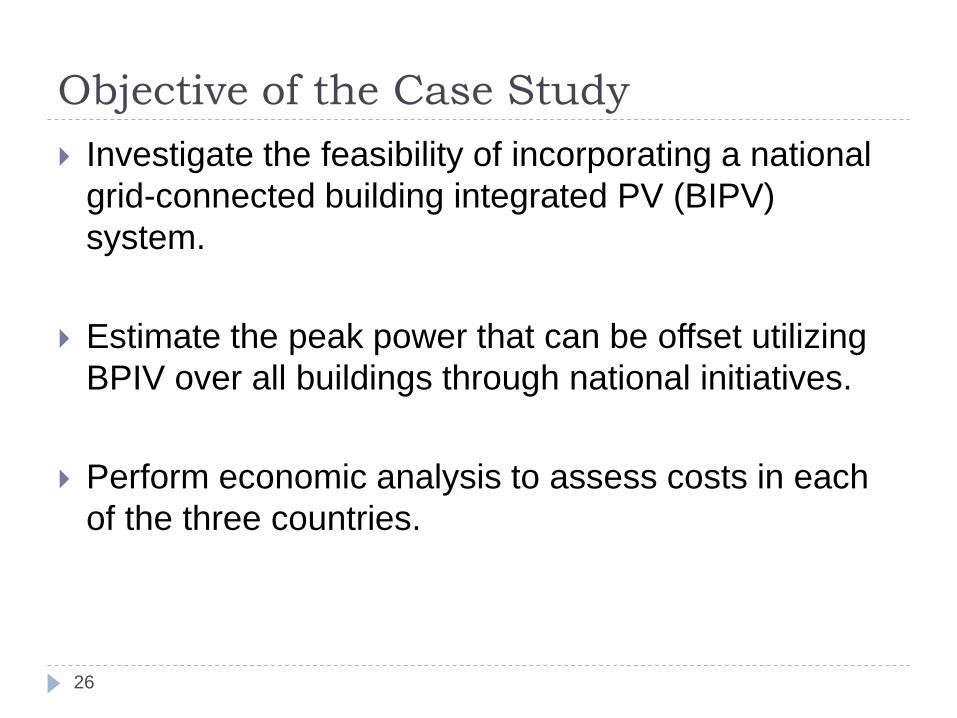
Objective of the Case Study
26
Investigate the feasibility of incorporating a national
grid-connected building integrated PV (BIPV)
system.
Estimate the peak power that can be offset utilizing
BPIV over all buildings through national initiatives.
Perform economic analysis to assess costs in each
of the three countries.

Methodology
27
Simulate building energy analysis using a validated
tool: eQuest software to predict the average energy
consumption, daily load profile, peak demand, and
CO2 emissions.
Input needed: hourly weather and solar data and
building typical plan and geometry, construction
material and layering for the envelop, fenestration
and orientation.

Methodology
28
For given electric load profile, the required PV system can be sized for a given roof area.
Sizing depends on selected PV modules type to be used and the percentage of roof area that can be covered with the PV modules.
Solar data, number of houses, results of eQUEST and PV size will serve as an input to the HOMER* software to study the total energy savings and CO2 emission reduction for one typical house.
Results are the extrapolated to the total number of houses. Economic indicators such as payback period were also part of the analysis.
Use has been validate by Bekle et al23, Bludszuweit et al24, Jamil et al25, Shaahid et al26, and many others as a good tool
to access and analyze the importance of using different renewable energy sources
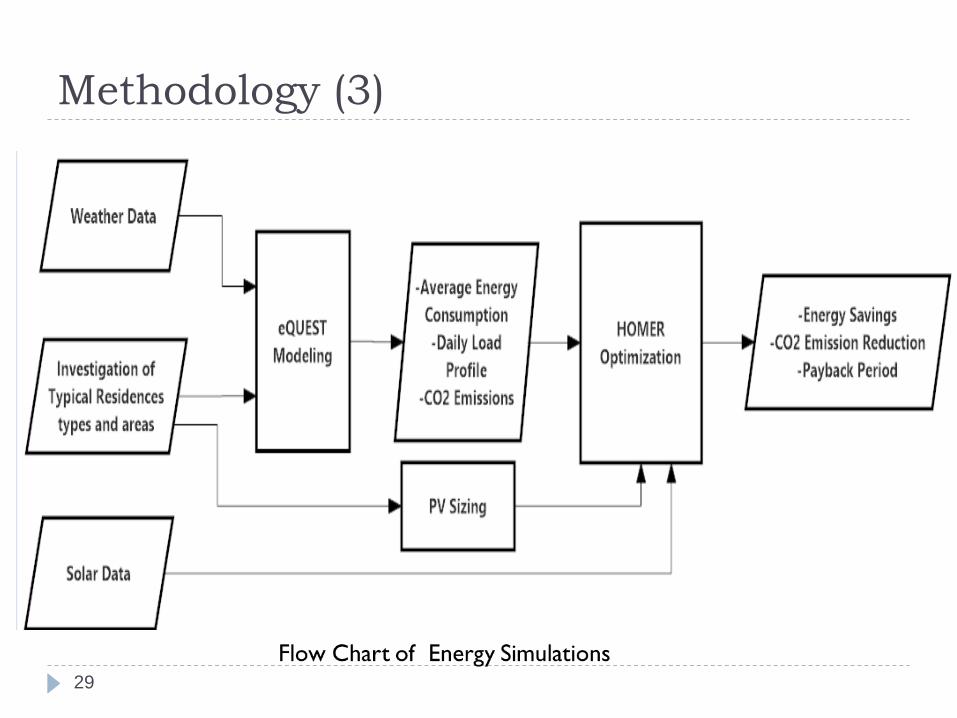
Methodology (3)
29
Number of Residential Units
30
In the Bahrain, Kuwait and Qatar, the main
residential type of houses are units of around 450 m2
roof area.
These villas are widely spread in the three countries.
Around 108,742 housing units are in Bahrain,
265,500 in Kuwait, and 98,804 in Qatar.
For this study, and since we considered a typical villa
of 450 m2 roof area, the number of villas per country
were extrapolated.
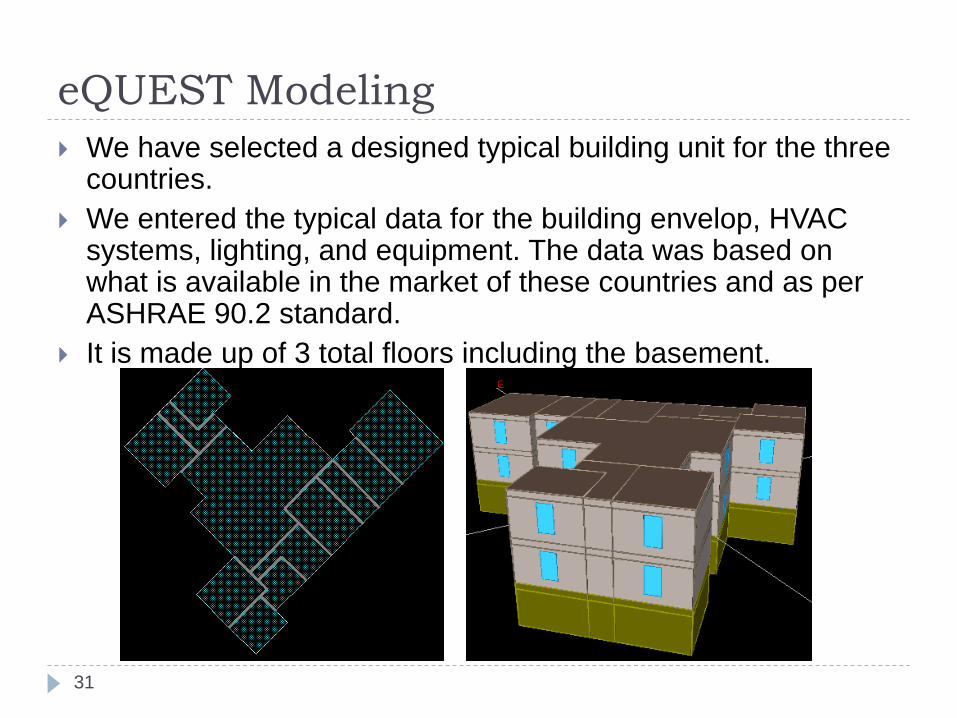
eQUEST Modeling
31
We have selected a designed typical building unit for the three countries.
We entered the typical data for the building envelop, HVAC systems, lighting, and equipment. The data was based on what is available in the market of these countries and as per ASHRAE 90.2 standard.
It is made up of 3 total floors including the basement.
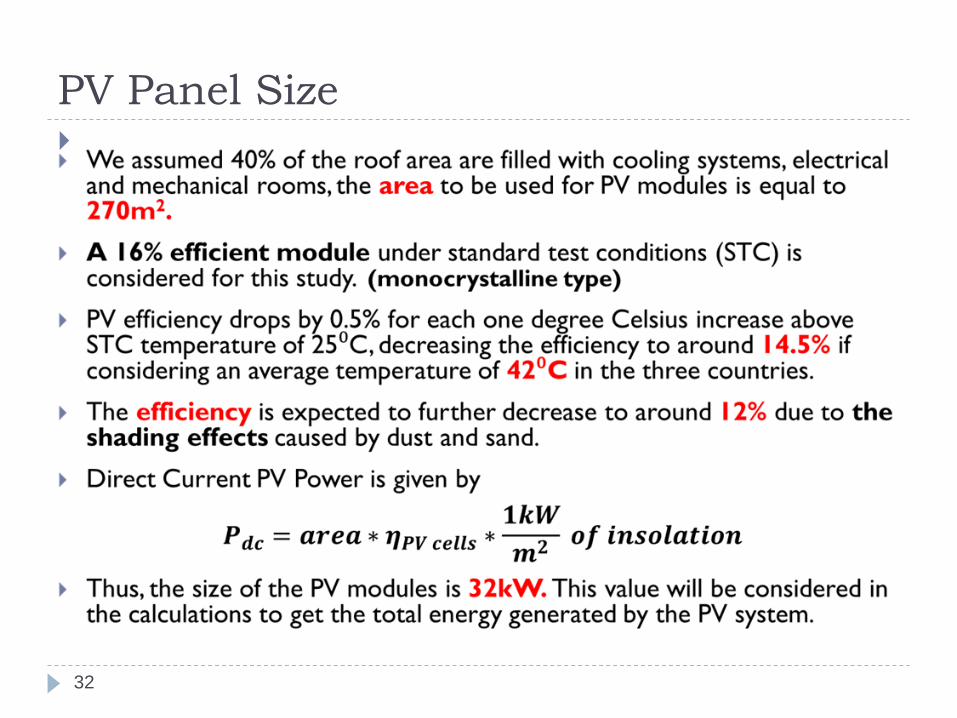
PV Panel Size
32
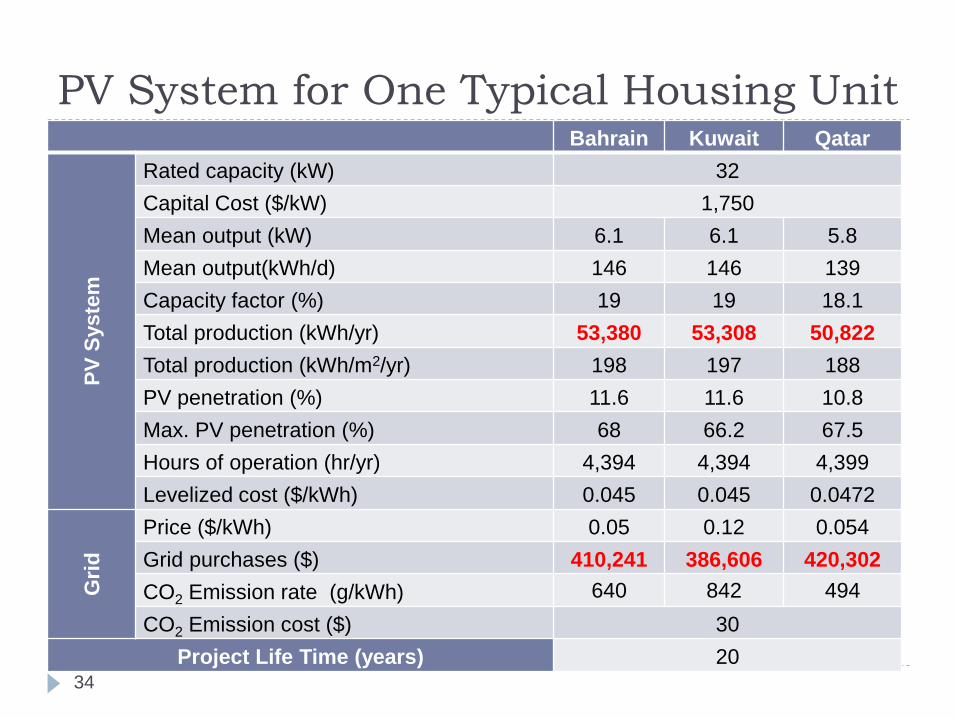
PV System for One Typical Housing Unit
34
Bahrain Kuwait Qatar
PV
Syste
m
Rated capacity (kW) 32
Capital Cost ($/kW) 1,750
Mean output (kW) 6.1 6.1 5.8
Mean output(kWh/d) 146 146 139
Capacity factor (%) 19 19 18.1
Total production (kWh/yr) 53,380 53,308 50,822
Total production (kWh/m2/yr) 198 197 188
PV penetration (%) 11.6 11.6 10.8
Max. PV penetration (%) 68 66.2 67.5
Hours of operation (hr/yr) 4,394 4,394 4,399
Levelized cost ($/kWh) 0.045 0.045 0.0472
Gri
d
Price ($/kWh) 0.05 0.12 0.054
Grid purchases ($) 410,241 386,606 420,302
CO2 Emission rate (g/kWh) 640 842 494
CO2 Emission cost ($) 30
Project Life Time (years) 20

PV System for One Typical Housing Unit
35
PV penetration percentage exceeded 60% at noon during summer.
For a typical summer day, August 18, PV penetration is highest around noon and during peak load hours where the AC power generated by the PV modules reached around 25kW.
Results and Discussion
36
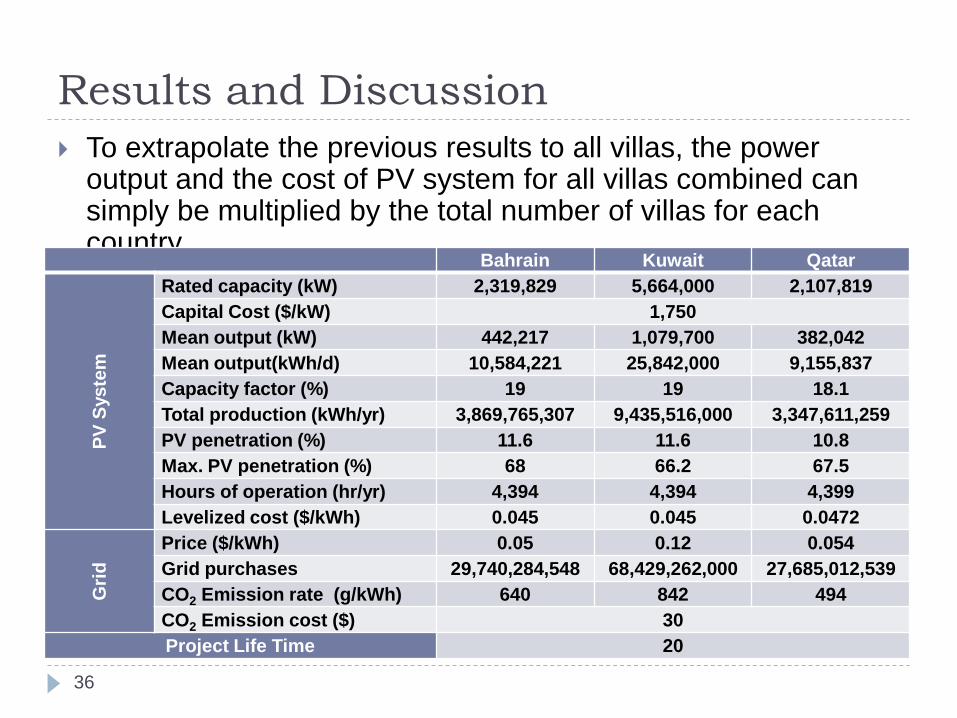
To extrapolate the previous results to all villas, the power output and the cost of PV system for all villas combined can simply be multiplied by the total number of villas for each country.
Bahrain Kuwait Qatar
PV
Sys
tem
Rated capacity (kW) 2,319,829 5,664,000 2,107,819
Capital Cost ($/kW) 1,750
Mean output (kW) 442,217 1,079,700 382,042
Mean output(kWh/d) 10,584,221 25,842,000 9,155,837
Capacity factor (%) 19 19 18.1
Total production (kWh/yr) 3,869,765,307 9,435,516,000 3,347,611,259
PV penetration (%) 11.6 11.6 10.8
Max. PV penetration (%) 68 66.2 67.5
Hours of operation (hr/yr) 4,394 4,394 4,399
Levelized cost ($/kWh) 0.045 0.045 0.0472
Gri
d
Price ($/kWh) 0.05 0.12 0.054
Grid purchases 29,740,284,548 68,429,262,000 27,685,012,539
CO2 Emission rate (g/kWh) 640 842 494
CO2 Emission cost ($) 30
Project Life Time 20

Results and Discussion
37
The savings due to CO2 reduction is not the only positive
outcome.
The investment in PV systems in typical houses will avoid
the three governments from building new power plants to
cover the shortage in power at peak hours load demand.
The peak load demand can reach higher levels than what
the current power plants can handle.
A comparison between investing in PV systems instead
of new power plants, a 2000MW power plant running on
natural gas as an example, shows that the PV systems
will decrease the reliance on the grid during the peak
hours much more than the new power plants, and
surprisingly at lower cost.
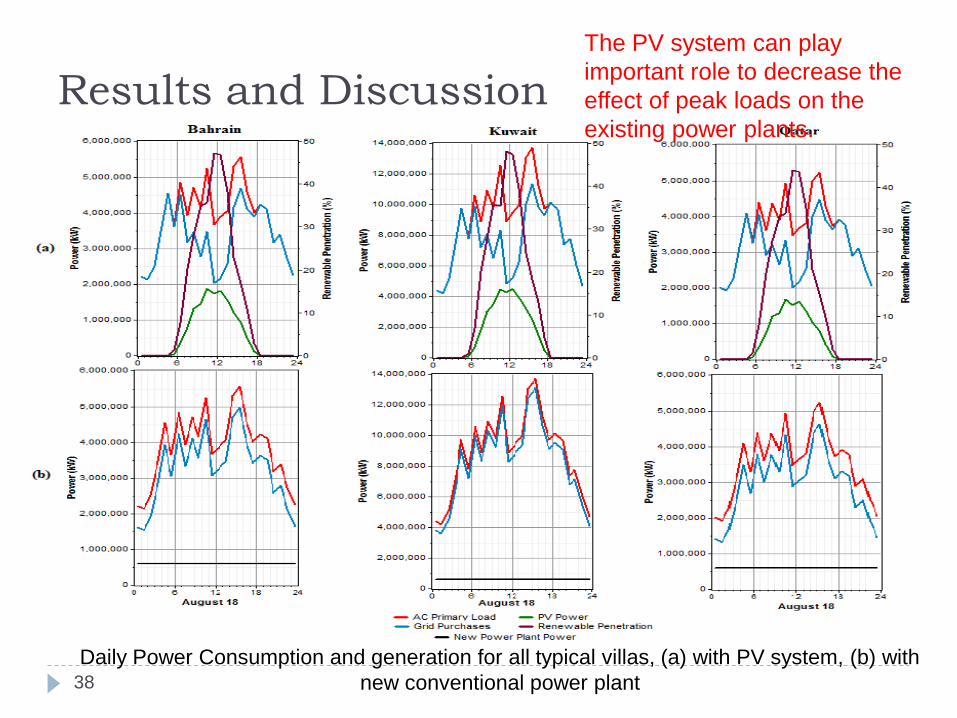
Results and Discussion
38
Daily Power Consumption and generation for all typical villas, (a) with PV system, (b) with
new conventional power plant
The PV system can play
important role to decrease the
effect of peak loads on the
existing power plants.
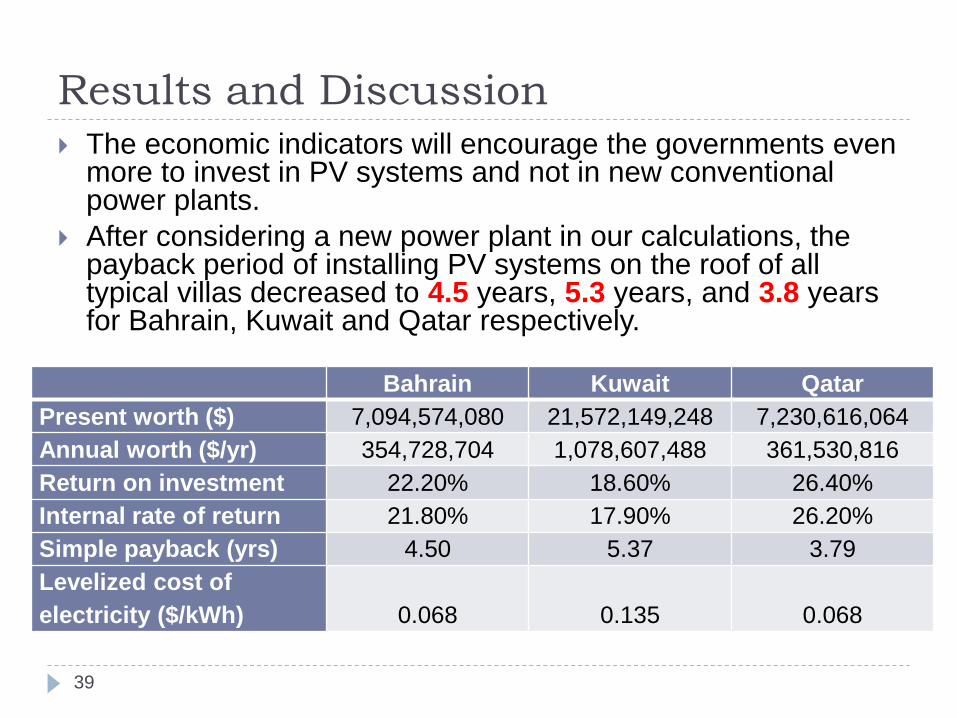
Results and Discussion
39
The economic indicators will encourage the governments even more to invest in PV systems and not in new conventional power plants.
After considering a new power plant in our calculations, the payback period of installing PV systems on the roof of all typical villas decreased to 4.5 years, 5.3 years, and 3.8 years for Bahrain, Kuwait and Qatar respectively.
Bahrain Kuwait Qatar
Present worth ($) 7,094,574,080 21,572,149,248 7,230,616,064
Annual worth ($/yr) 354,728,704 1,078,607,488 361,530,816
Return on investment 22.20% 18.60% 26.40%
Internal rate of return 21.80% 17.90% 26.20%
Simple payback (yrs) 4.50 5.37 3.79
Levelized cost of
electricity ($/kWh) 0.068 0.135 0.068
Conclusions
40
The BIPV as a potential source of electricity reduces
not only the impact on the environment, but also the
government investments to cover the peak demand
loads.
It is recommended to invest in PV systems by
subsidizing this clean energy as much as if not more
than what is currently subsidized for conventional
energy sources.
Governments should invest in energy efficient codes
to force people to look into renewable energy
sources and or to finance directly the implementation
of such systems.
Help to achieve Net-Zero Energy Houses
Challenges
41
Many challenges will be faced implementing the
BIPV system:
Low expertise in the field → require special programs to
train the staff to handle the installation and maintenance
of the system.
Retrofits and resistance to change

Thank You!
Questions?
42