Embed Size (px)
Citation preview

In D. de Waard, F. Di Nocera, D. Coelho, J. Edworthy, K. Brookhuis, F. Ferlazzo, T. Franke, and A. Toffetti (Eds.) (2018). Proceedings of the Human Factors and Ergonomics Society Europe Chapter 2017
Annual Conference. ISSN 2333-4959 (online). Available from http://hfes-europe.org
Potential of wearable devices for mental workload
detection in different physiological activity conditions
Franziska Schmalfuß, Sebastian Mach, Kim Klüber, Bettina Habelt, Matthias
Beggiato, André Körner, & Josef F. Krems
Chemnitz University of Technology
Germany
Abstract
Wearable devices have gained high popularity in the last years, especially for health
monitoring. Some devices aim at identifying mental states, but scientific studies on
the potential of wearable devices for identifying mental states are rather sparse.
Heart rate parameters proved to be valuable indicators for increasing mental
workload and growing levels of physical activity. The question arises, if wearable
devices can be used to identify high mental workload in different physiological
activity conditions. Thirty-two participants (18 female) participated in an experiment
with a 2 (mental workload) x 4 (physiological activity) factorial within-subject
design. Participants sat, stood, stepped or cycled while they fulfilled either no
secondary task (5 minutes) or a counting backwards task (5 minutes). Heart Rate
was measured via a wrist-worn mobile device and a stationary device. Results
showed that measurements of the two devices did not correlate consistently. Heart
Rate and Inter-Beat Intervals, measured via the stationary device differed
significantly with varying levels of physical activity and mental workload. Data
from the wearable device showed only the physical activity effect. Findings indicate
that wearable devices are not fully capable of identifying mental workload. Still,
wearable devices have potential for identifying and fostering reduction of high
physical load in everyday usage.
Introduction
The market share of wrist-worn wearable devices is on the rise (IDC, 2017). This
shows the high popularity this new technology has gained in the last years. Their
potential for health monitoring and health support has been intensively investigated
and discussed (e.g., Marakhimov & Joo, 2017). They allow consumers to
continuously monitor physiological parameters and manage their health and well-
being on a personal basis. Additionally, they can help physicians to get access to
their clients’ health data to offer personalized medical care (e.g., Kim & Kim, 2016).
Some devices even aim to identify mental states, stress or emotions, but scientific
studies on the potential of wearable devices for identifying different mental states in
different situations are rather sparse.
180 Schmalfuß, Mach, Klüber, Habelt, Beggiato, Körner, & Krems
The potential identification of high workload or stress opens new opportunities for
daily life usage. Wrist-worn wearable devices might be applied in the driving or
working context in order to identify situations in which users need support. For
instance, workers’ health parameters could be tracked in order to implement
solutions that respond to the observed health status and reduce the physical and
cognitive burden at work (Lavallière et al., 2016). Through technical solutions using
wearable devices, personal recommendations can be made about the sequence of the
pending work tasks, exercise (e.g., daily step count), nutrition, or practices to reduce
stress and optimize job-related (mental) workload (Swan, 2012).
Mental Workload and Heart Rate Variability (HRV)
Mental workload can be described as the relationship between the cognitive
resources that are necessary to fulfil a specific task and the operator’s cognitive
resources that are available (e.g., Wickens, 2008). Valuable physiological indicators
for increased mental workload and growing levels of physical activity are an
increase in Heart Rate (HR) and decrease in Heart Rate Variability (HRV; Mulder,
1992; De Waard & Brookhuis, 1991). HR presents the number of heart beats per
minute and Heart Rate Variability is defined as the variability of the intervals
between two heart beats, the Inter-Beat Interval (IBI; for a comprehensive overview
see, Shaffer et al., 2014). HR and HRV can be measured via electrocardiogram
(ECG) by recording the electrical activity from the heart or wearable devices that
often use optical heart rate monitors. HRV parameters can either be time-domain or
frequency-domain parameters. Typical time-domain parameters that are supposed to
be indicators for parasympathetic nervous system (PNS) activity are the standard
deviation of the RR-intervals (SDNN), root mean square of sequential deviations
(RMSSD), and the number of adjacent pairs of IBIs differing more than 50 ms
divided by the total number of Inter-Beat Intervals (pNN50). Commonly used
frequency-domain parameters are power of the high-frequency band (HF: 0.15-0.40
Hz) and the low-frequency band (LF: 0.04-0.15 Hz) and the LF/HF ratio.
Sympathetic nervous system activities as reaction to physical activity or stress
reactions should reflect in LF (Shaffer et al., 2014). The LF/HF ratio is considered as
a marker for shifts in sympathetic or parasympathetic dominance. The 0.10 Hz
component that corresponds to the LF component is supposed to be especially
sensitive to changes in mental demand (De Waard, 1996), but often all above
mentioned parameters are analysed (Hsu et al., 2015).
Potential of wearable devices for heart rate monitoring
Wearable devices represent an easy-to-use alternative to measure HR parameters in
daily context. Stahl et al. (2016) showed that measures of different wearable devices
such as Mio Alpha, Microsoft Band and Fitbit Charge HR correlate highly with the
criterion measure (Polar RS400) and with each other, even when people walk or run.
Another study showed relatively high error rates for walking, but more acceptable
error rates for cycling and running (Shcherbina et al., 2017). Furthermore, wearable
devices proved satisfying HRV measurements in order to differentiate between high
and low demanding cognitive tasks (Barber et al., 2017), although other studies
showed that HRV parameters could be too inaccurate (Reinerman-Jones et al.,
2017).

wearable devices and workload assessment 181
On the basis of the reviewed literature, we expect that HR increases and HRV
parameter decreases when mental demand is higher (H1). Furthermore, higher
physical demand should reflect in higher HR and lower HRV (H2). It is further
assumed that these effects can be detected using an ECG and a wearable device. Sun
et al. (2012) showed that higher mental workload can be identified using HR
parameters in different physiological activity conditions, but it has not been
investigated whether this is replicable with using wearable devices.
Methods
Participants
Thirty-two healthy participants finished the experiment. One data set could not be
used due to technical problems. The remaining n = 31 participants (18 female, 13
male) were on average 25 years old (SD = 5.5), 87% were right-handed and none of
them had diagnosed diabetes, cardiovascular complaints or diseases or other health
issues that would constitute a risk for participants in the study. Students (n = 29)
received course credits for participation.
Design
In an experiment with a 2 (mental workload) x 4 (activity) factorial within-subject
design, participants’ HR and HRV was assessed in each condition. They either sat,
stood, stepped, or cycled while solving an arithmetic task in parallel or doing
nothing additional. The sequence of activities was varied using the latin square. The
study procedure was approved by the ethical committee of the Chemnitz University
of Technology (no. V-163-BM-FS-Factory-24112016).
Apparatus and material
HR and HRV were measured 1) with the Microsoft Band 2 (MB2) on the non-
dominant hand and 2) with a 1-channel ECG, the SUEmpathy® (SUE) with
disposable adhesive electrodes (Dahlhausen type 405, Ag/AgC1; 45 mm diameter)
positioned on the abdomen and chest area. The SUEmpathy100 is a measuring
device for the functional diagnostics of the autonomous nervous system of the
company SUESS Medizintechnik ECG 1303, SUEmpathy® Vitalbox, SUESS
Medizin-Technik Aue). The data from the ECG sensor were recorded at 512 Hz with
12-bit resolution, and the Microsoft Band 2 data at 1 Hz. The ECG recordings were
pre-analysed with the associated software SUEmpathy100, version SUE1-4.36j
Scientific (SUESS Medizin-Technik Aue, 2009). The Windows software
development kit (SDK) coming with the MB2 allows for real-time data streaming
via Bluetooth between the device and a computer. Therefore, a self-developed
logging application was installed on a Lenovo notebook. For analyses, the collected
HR and IBIs were of interest.
All instructions for physical and arithmetic tasks were presented via LabView
(version 2014). In the arithmetic task, that was used to increase the mental workload,
participants were asked to count backwards from 5,200 by, for instance, 13 (similar
to Meinel, 2013). In the stepping condition, participants stepped with both legs on
182 Schmalfuß, Mach, Klüber, Habelt, Beggiato, Körner, & Krems
and off a step board (height: 20.5 cm x length: 89 cm x width: 35.5 cm) using one
leg at a time and following an 80 bpm beat given by a metronome (Yixiang, 2015).
In the cycling condition, participants cycled on a bike fixated with a roller fix frame
(In'Ride 300, 550 Watt B'TWIN) and followed a 90 bpm beat. The whole
experiment was video-recorded with a Sony Digital HD-video recorder to assure
data matching in case of system failure.
Subjective workload was assessed using the NASA-TLX scale (Hart & Staveland,
1988) which includes 6 items covering mental, physical and temporal demand,
effort, frustration level and performance. Items were rated on 20-point bipolar scales
(from 0 = low to 20 = high; for performance scale: 0 = success to 20 = failure).
Demographic data as well as self-judgments regarding math skills were collected via
a questionnaire.
Procedure
First, participants read the instruction including the information that disqualifying
criteria were cardiovascular complaints or diseases, diabetes, etc. and filled in the
socio-demographic questionnaire. The experimenter checked for exclusion criteria,
positioned the MB2 on participant’s non-dominant arm and started the video
recording. Participants signed the confirmation agreement, equipped him-/herself
with the electrodes of the SUEmpathy® following detailed instructions and with
potential assistance of the experimenter. When the participant stated to be ready, the
experimenter started the LabView presentation and physiological data recording.
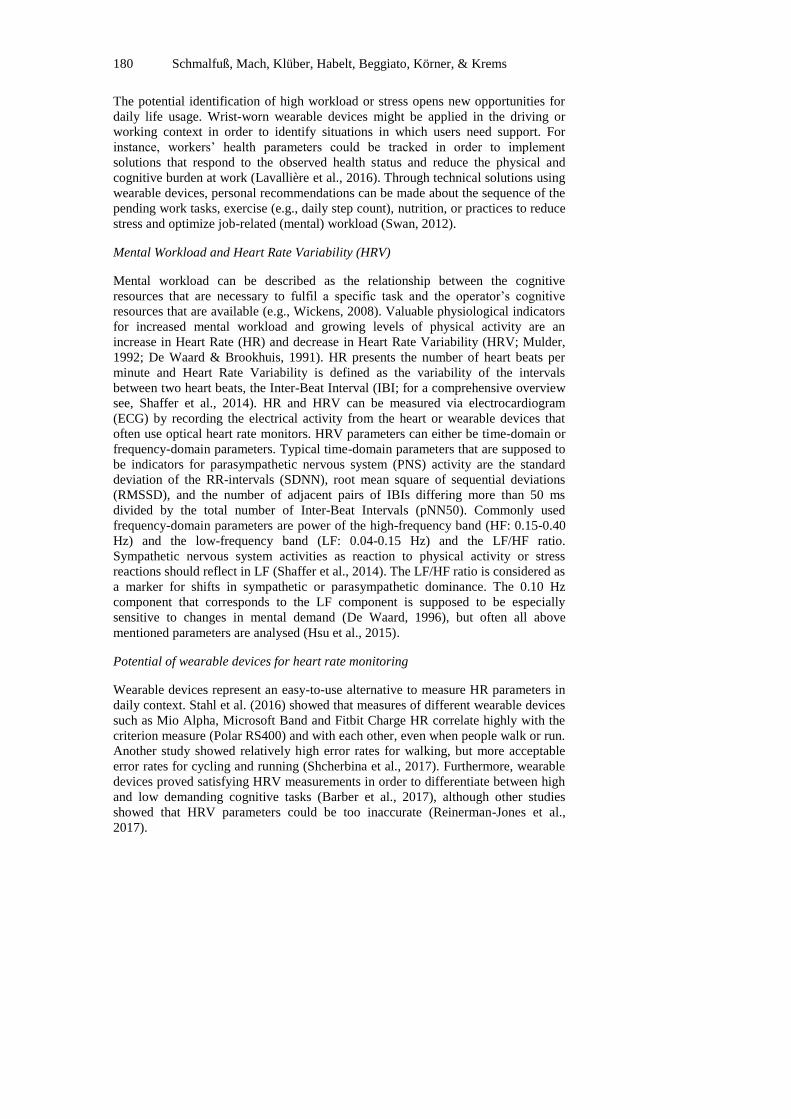
The procedure (see Figure 1) was in accordance to Sun et al. (2012) with the only
exceptions that each condition lasted 5 minutes and no mediation music was
presented in baseline and recovery phases. In the stepping and cycling condition,
participants could shortly test the physical activity (max. 1 minute).
Figure 1. Experimental sequence.
After each condition with increased mental workload, the NASA-TLX (Hart &
Staveland, 1988) was filled in by the participants. In sum, the experiment lasted 90
to 120 minutes.
Results
The HR data for both devices were transferred to Kubios (Version 3.0.2; Tarvainen
et al., 2014) in order to calculate further heart parameters. The MB2 data for the first
10 participants had to be excluded from analysis, because data were too unreliable
Procedure for every activity: sitting, standing, stepping, cycling
(practice phase only for stepping and cycling)
5
min
5
min
5
min
Prac- tice
Activity (Baseline)
Activity + Arithmetic
Task
Nasa TLX
Re-covery
wearable devices and workload assessment 183
due to the position of the MB2 (sensors on the upside of the wrist). Outlier analyses
(Grubbs, 1969) identified 0 to 4 outliers for the varying HR parameters for each
device that were excluded from further analyses. To investigate measurement
validity, inter-class correlation coefficients (ICC) were calculated between MB2,
SUE and NASA-TLX data.
Hypotheses were tested using ANOVAs for repeated measurements as well as post
hoc tests with Bonferroni correction and paired t-tests. In case of violating the
assumption of sphericity, the Greenhouse-Geißer Correction was used (Field, 2013).
When data for the different conditions were not normally distributed, log-
transformation (ln) was applied.
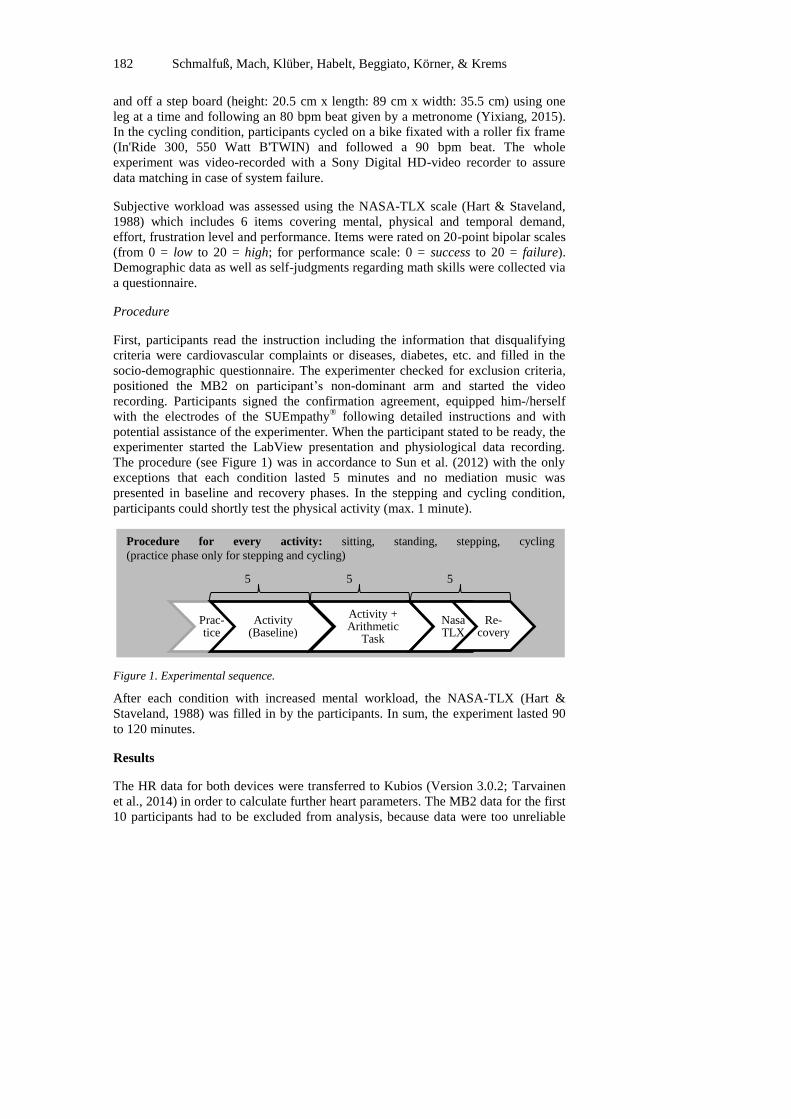
Stationary apparatus versus wearable device
As an example, Figure 2 shows raw HR data for one participant.
Figure 2. HR data for one participant (No. 21) for each condition measured via stationary
(SUE) and wearable device (MB2).
Note. MWL = conditions with higher mental workload (MWL).
The ICCs (Table 1) show that the two devices’ measures correlated only
significantly in the sitting and standing conditions.
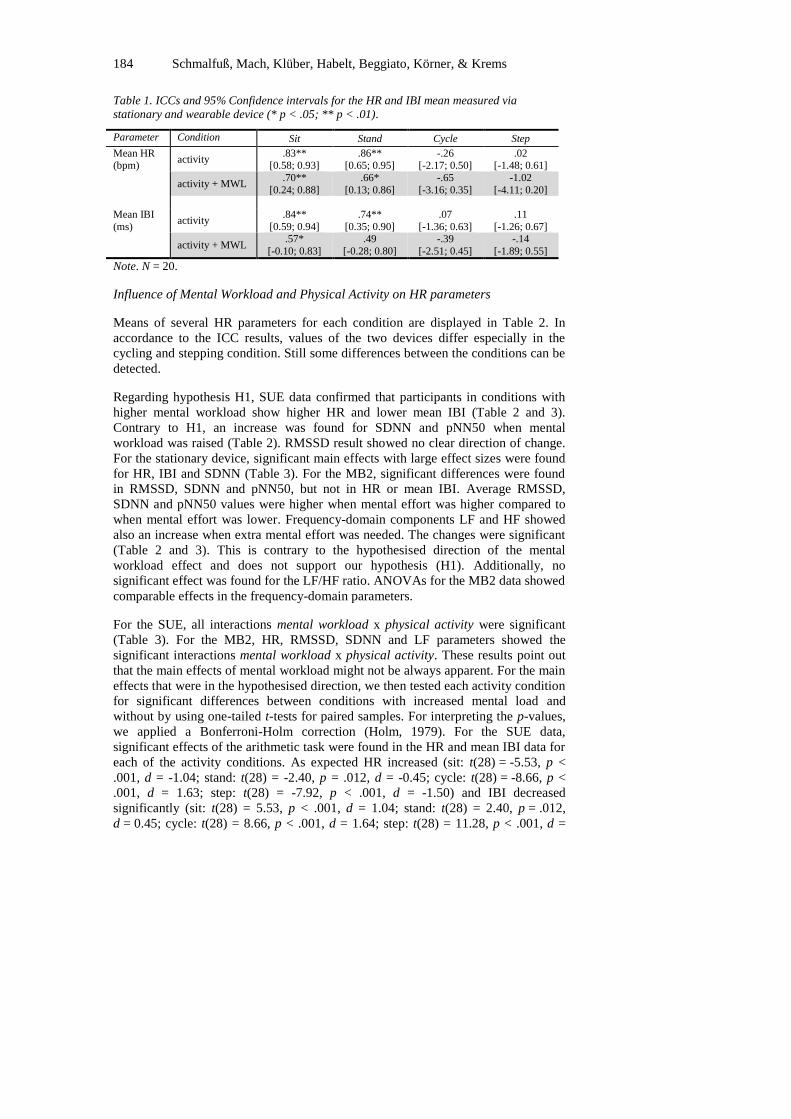
184 Schmalfuß, Mach, Klüber, Habelt, Beggiato, Körner, & Krems
Table 1. ICCs and 95% Confidence intervals for the HR and IBI mean measured via
stationary and wearable device (* p < .05; ** p < .01).
Parameter Condition Sit Stand Cycle Step
Mean HR (bpm)
activity .83**
[0.58; 0.93] .86**
[0.65; 0.95] -.26
[-2.17; 0.50] .02
[-1.48; 0.61]
activity + MWL .70**
[0.24; 0.88]
.66*
[0.13; 0.86]
-.65
[-3.16; 0.35]
-1.02
[-4.11; 0.20]
Mean IBI
(ms) activity
.84**
[0.59; 0.94]
.74**
[0.35; 0.90]
.07
[-1.36; 0.63]
.11
[-1.26; 0.67]
activity + MWL .57*
[-0.10; 0.83]
.49
[-0.28; 0.80]
-.39
[-2.51; 0.45]
-.14
[-1.89; 0.55]
Note. N = 20.
Influence of Mental Workload and Physical Activity on HR parameters
Means of several HR parameters for each condition are displayed in Table 2. In
accordance to the ICC results, values of the two devices differ especially in the
cycling and stepping condition. Still some differences between the conditions can be
detected.
Regarding hypothesis H1, SUE data confirmed that participants in conditions with
higher mental workload show higher HR and lower mean IBI (Table 2 and 3).
Contrary to H1, an increase was found for SDNN and pNN50 when mental
workload was raised (Table 2). RMSSD result showed no clear direction of change.
For the stationary device, significant main effects with large effect sizes were found
for HR, IBI and SDNN (Table 3). For the MB2, significant differences were found
in RMSSD, SDNN and pNN50, but not in HR or mean IBI. Average RMSSD,
SDNN and pNN50 values were higher when mental effort was higher compared to
when mental effort was lower. Frequency-domain components LF and HF showed
also an increase when extra mental effort was needed. The changes were significant
(Table 2 and 3). This is contrary to the hypothesised direction of the mental
workload effect and does not support our hypothesis (H1). Additionally, no
significant effect was found for the LF/HF ratio. ANOVAs for the MB2 data showed
comparable effects in the frequency-domain parameters.
For the SUE, all interactions mental workload x physical activity were significant
(Table 3). For the MB2, HR, RMSSD, SDNN and LF parameters showed the
significant interactions mental workload x physical activity. These results point out
that the main effects of mental workload might not be always apparent. For the main
effects that were in the hypothesised direction, we then tested each activity condition
for significant differences between conditions with increased mental load and
without by using one-tailed t-tests for paired samples. For interpreting the p-values,
we applied a Bonferroni-Holm correction (Holm, 1979). For the SUE data,
significant effects of the arithmetic task were found in the HR and mean IBI data for
each of the activity conditions. As expected HR increased (sit: t(28) = -5.53, p <
.001, d = -1.04; stand: t(28) = -2.40, p = .012, d = -0.45; cycle: t(28) = -8.66, p <
.001, d = 1.63; step: t(28) = -7.92, p < .001, d = -1.50) and IBI decreased
significantly (sit: t(28) = 5.53, p < .001, d = 1.04; stand: t(28) = 2.40, p = .012,
d = 0.45; cycle: t(28) = 8.66, p < .001, d = 1.64; step: t(28) = 11.28, p < .001, d =

wearable devices and workload assessment 185
2.13) with more demanding physical activity. For the MB2 data, none of the
significant mental workload effects retrieved from the ANOVAs pointed in the
hypothesised direction. However, in one-tailed t-tests for paired samples with HR
and mean IBI values, a medium effect was found when comparing the varying levels
of mental workload in the sitting condition (t(19) = 2.34, p = .016, d = 0.54). After
the Bonferroni-Holm correction it was found to no longer be significant. All other
differences were non-significant and with small effects. Overall, the mental effort
effect (H1) could be confirmed by HR and IBI data collected via SUE, but not by
MB2 data.
Table 2. Results of HR and various HRV parameters measured via SUEmpathy® (SUE) and
Microsoft Band 2 (MB2).
Para-meter
De-vice
n Sit Sit
MWL Stand
Stand MWL
Cycle Cycle MWL
Step Step
MWL
HR
(bpm)
SUE 29 73.8 79.4 87.4 90.8 107.5 116.9 112.2 122.1
MB2 20 76.3 80.2 88.2 86.9 79.7 75.5 90.4 94.6
Mean
IBI (ms)
SUE 29 828.3 766.7 703.4 673.9 567.1 524.9 542.9 495.3
MB2 20 783.8 738.5 674.5 681.8 766.4 805.4 663.0 638.6
RMSSD
(ms)
SUE 29 45.3 44.4 26.6 34.0 14.0 14.1 18.0 15.5
MB2 19 114.0 161.6 125.3 160.7 253.3 253.2 220.1 213.1
SDNN
(ms)
SUE 28 51.9 61.7 39.7 53.0 17.2 20.9 19.0 18.1
MB2 19 90.0 126.9 98.2 124.1 188.3 203.0 175.0 173.5
pNN50
(%)
SUE 28 21.5 21.8 8.4 10.9 2.2 2.8 1.5 0.9
MB2 19 30.5 53.3 38.5 54.6 72.9 71.9 77.2 72.2
LF (ms²) SUE 30 1576 2711 1206 2520 208 420 212 245
MB2 18 2475 2957 2526 4238 24725 14440 7489 6549
HF
(ms²)
SUE 29 1086 1037 399 674 83 304 198 269
MB2 18 10178 13942 5121 9426 34010 74639 22000 16229
LF/HF SUE 27 2.85 3.88 7.82 5.75 5.67 3.91 4.36 3.57
MB2 21 1.01 0.75 1.05 0.67 0.48 0.43 0.45 0.46
Note. MWL = conditions with higher mental workload (MWL).
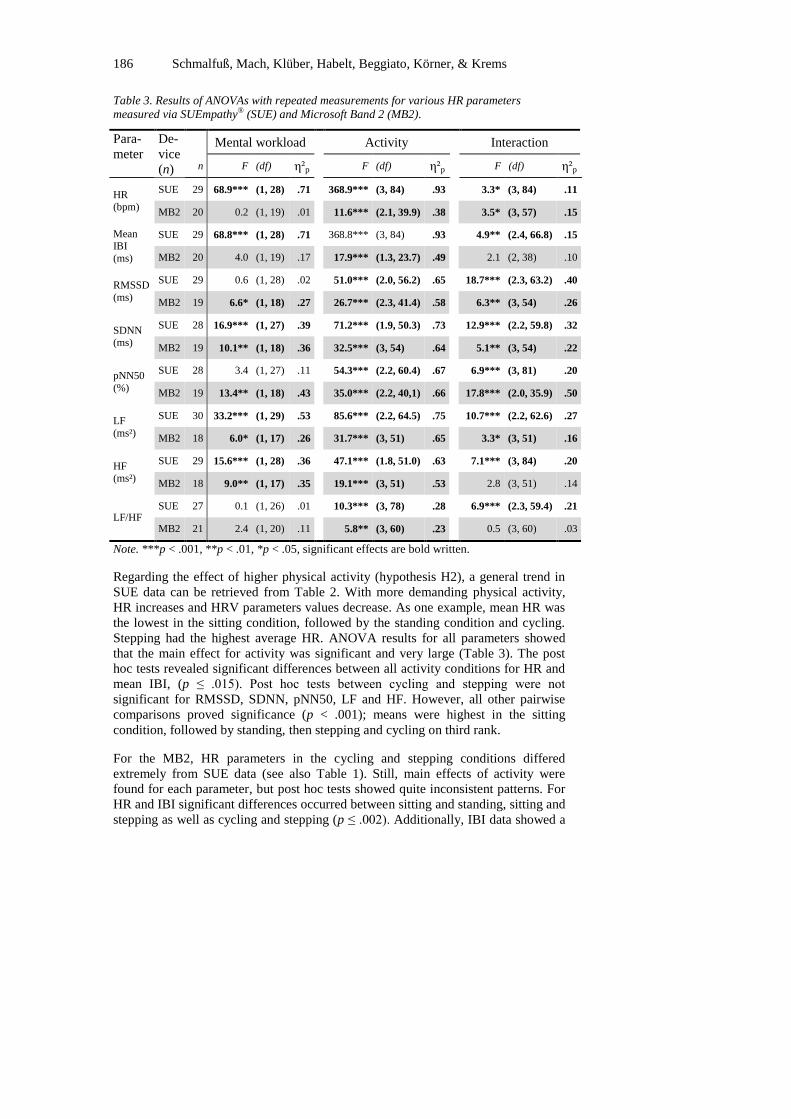
186 Schmalfuß, Mach, Klüber, Habelt, Beggiato, Körner, & Krems
Table 3. Results of ANOVAs with repeated measurements for various HR parameters
measured via SUEmpathy® (SUE) and Microsoft Band 2 (MB2).
Para-
meter
De-
vice
(n)
Mental workload Activity Interaction
n F (df) η²p F (df) η²p F (df) η²p
HR (bpm)
SUE 29 68.9*** (1, 28) .71
368.9*** (3, 84) .93
3.3* (3, 84) .11
MB2 20 0.2 (1, 19) .01 11.6*** (2.1, 39.9) .38 3.5* (3, 57) .15
Mean IBI
(ms)
SUE 29 68.8*** (1, 28) .71 368.8*** (3, 84) .93 4.9** (2.4, 66.8) .15
MB2 20 4.0 (1, 19) .17 17.9*** (1.3, 23.7) .49 2.1 (2, 38) .10
RMSSD
(ms)
SUE 29 0.6 (1, 28) .02 51.0*** (2.0, 56.2) .65 18.7*** (2.3, 63.2) .40
MB2 19 6.6* (1, 18) .27 26.7*** (2.3, 41.4) .58 6.3** (3, 54) .26
SDNN (ms)
SUE 28 16.9*** (1, 27) .39 71.2*** (1.9, 50.3) .73 12.9*** (2.2, 59.8) .32
MB2 19 10.1** (1, 18) .36 32.5*** (3, 54) .64 5.1** (3, 54) .22
pNN50
(%)
SUE 28 3.4 (1, 27) .11 54.3*** (2.2, 60.4) .67 6.9*** (3, 81) .20
MB2 19 13.4** (1, 18) .43 35.0*** (2.2, 40,1) .66 17.8*** (2.0, 35.9) .50
LF
(ms²)
SUE 30 33.2*** (1, 29) .53 85.6*** (2.2, 64.5) .75 10.7*** (2.2, 62.6) .27
MB2 18 6.0* (1, 17) .26 31.7*** (3, 51) .65 3.3* (3, 51) .16
HF (ms²)
SUE 29 15.6*** (1, 28) .36 47.1*** (1.8, 51.0) .63 7.1*** (3, 84) .20
MB2 18 9.0** (1, 17) .35 19.1*** (3, 51) .53 2.8 (3, 51) .14
LF/HF SUE 27 0.1 (1, 26) .01 10.3*** (3, 78) .28 6.9*** (2.3, 59.4) .21
MB2 21 2.4 (1, 20) .11 5.8** (3, 60) .23 0.5 (3, 60) .03
Note. ***p < .001, **p < .01, *p < .05, significant effects are bold written.
Regarding the effect of higher physical activity (hypothesis H2), a general trend in
SUE data can be retrieved from Table 2. With more demanding physical activity,
HR increases and HRV parameters values decrease. As one example, mean HR was
the lowest in the sitting condition, followed by the standing condition and cycling.
Stepping had the highest average HR. ANOVA results for all parameters showed
that the main effect for activity was significant and very large (Table 3). The post
hoc tests revealed significant differences between all activity conditions for HR and
mean IBI, (p ≤ .015). Post hoc tests between cycling and stepping were not
significant for RMSSD, SDNN, pNN50, LF and HF. However, all other pairwise
comparisons proved significance (p < .001); means were highest in the sitting
condition, followed by standing, then stepping and cycling on third rank.
For the MB2, HR parameters in the cycling and stepping conditions differed
extremely from SUE data (see also Table 1). Still, main effects of activity were
found for each parameter, but post hoc tests showed quite inconsistent patterns. For
HR and IBI significant differences occurred between sitting and standing, sitting and
stepping as well as cycling and stepping (p ≤ .002). Additionally, IBI data showed a
wearable devices and workload assessment 187
difference between standing and cycling (p = .034). For RMSSD, SDNN, LF, and
HF, sitting and stepping as well as cycling and stepping did not vary significantly,
but all other post hoc tests revealed statistically significant results (p ≤ .009). LF/HF
mean values only differed significantly between standing and cycling as well as
stepping (.009 ≤ p ≤ .013). Based on the low reliability of MB2 data, SUE data get
more weight in drawing conclusions regarding our hypothesis H2.
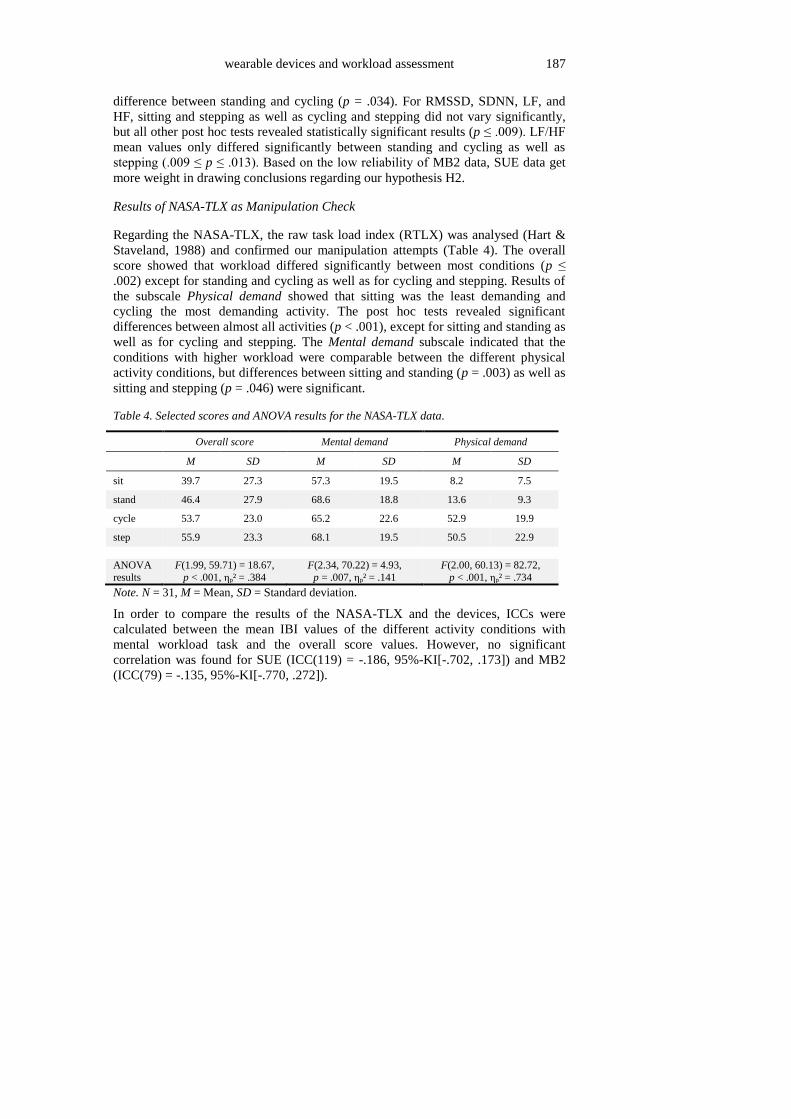
Results of NASA-TLX as Manipulation Check
Regarding the NASA-TLX, the raw task load index (RTLX) was analysed (Hart &
Staveland, 1988) and confirmed our manipulation attempts (Table 4). The overall
score showed that workload differed significantly between most conditions (p ≤
.002) except for standing and cycling as well as for cycling and stepping. Results of
the subscale Physical demand showed that sitting was the least demanding and
cycling the most demanding activity. The post hoc tests revealed significant
differences between almost all activities (p < .001), except for sitting and standing as
well as for cycling and stepping. The Mental demand subscale indicated that the
conditions with higher workload were comparable between the different physical
activity conditions, but differences between sitting and standing (p = .003) as well as
sitting and stepping (p = .046) were significant.
Table 4. Selected scores and ANOVA results for the NASA-TLX data.
Overall score Mental demand Physical demand
M SD M SD M SD
sit 39.7 27.3 57.3 19.5 8.2 7.5
stand 46.4 27.9 68.6 18.8 13.6 9.3
cycle 53.7 23.0 65.2 22.6 52.9 19.9
step 55.9 23.3 68.1 19.5 50.5 22.9
ANOVA
results
F(1.99, 59.71) = 18.67,
p < .001, ηp² = .384
F(2.34, 70.22) = 4.93,
p = .007, ηp² = .141
F(2.00, 60.13) = 82.72,
p < .001, ηp² = .734
Note. N = 31, M = Mean, SD = Standard deviation.
In order to compare the results of the NASA-TLX and the devices, ICCs were
calculated between the mean IBI values of the different activity conditions with
mental workload task and the overall score values. However, no significant
correlation was found for SUE (ICC(119) = -.186, 95%-KI[-.702, .173]) and MB2
(ICC(79) = -.135, 95%-KI[-.770, .272]).
188 Schmalfuß, Mach, Klüber, Habelt, Beggiato, Körner, & Krems
Discussion
The present experimental study aimed at identifying increased mental workload in
the course of different physical activities comparing a wearable device with a
stationary device. Data of the two devices showed no correlation when participants
moved. The low accuracy of wearable device data is contrary to findings from other
studies (e.g., Stahl et al., 2016). Worth mentioning is that the real-time data
assessment using the Microsoft SDK is only developed for reliable measurements
when resting. However, even in the less active conditions reliability was not as high
as in other studies (Barber et al., 2017). One possible explanation might be that the
device has the function to manually switch to another activity mode when recording
heart rate while, for instance, cycling. This was not used in the study, because it
would not be realistic to regularly switch modes of the wearable device while
working and standing up or starting to walk. Although it was not explicitly stated,
other researchers might have used such switches in modes. Future devices
automatically correcting HR recordings according to the physical activity might be
of higher potential for identifying increased mental workload or even overload at
work.
Still, there was a tendency in MB2 data that a higher level of mental workload came
along with smaller mean IBI values. Only in the sitting condition, the effect reached
a medium size. Contrary to findings of Barber et al. (2017), detecting increased
mental workload using the Microsoft Band 2 and HR parameters while sitting, did
not work satisfyingly in the current study. For the SUE data, the effects of increased
mental workload for all HR parameters was strong, but the hypothesised direction of
the effect was only found for HR and IBI. Most of the other analysed HRV
parameters behaved in the opposite direction. Higher mental workload resulted in
higher SDNN, LF, and HF values. This opposite direction of the mental workload
effect was also found and discussed by Schubert et al. (2009). One explanation is
that naming numbers orally, as part of the arithmetic task, influences the HRV
parameters too much, so that the mental workload effect detection is difficult when
speaking.
Results regarding the physical workload revealed more consistent effects; for all
activities, a significant decrease in mean IBI durations was found when mental
workload was increased. Additionally, both devices revealed significant effects for
the activity; higher levels of physical workload led to lower levels in mean IBI
durations. Still, the MB2 showed completely different results in the cycling
condition which leads us to the conclusion that measurement is too much biased in
order to draw any conclusions from the data. Overall, results are in line with
previous findings on the effects of physical workload on heart rate variability (e.g.,
Sun et al., 2012). The potential of a wearable device for detecting higher physical
activity on the basis of HR parameters, as also tested by Hwang and Lee (2017), was
proven again.
In line with findings of Matthews et al. (2015), NASA-TLX scores did not correlate
with physiological data. The RTLX index score showed that mental demand was
quite comparable for the different conditions with the arithmetic task. Only the
sitting condition was somewhat less demanding. This can be partly explained by the
wearable devices and workload assessment 189
additional task to follow the beat while cycling and stepping. This could have
additionally raised the mental demand. Additionally, arithmetic tests might have
varied slightly regarding their difficulty. Future research might address this and use
even more equally difficult tasks and/or another cognitive demanding task as well as
other means for ensuring similar physical demand.
Overall, the limited reliability of the used wearable device regarding HR measures in
varying activity conditions reduces the potential of (comparable) wearable devices
for a fine-grained monitoring of physical and mental effort. Thus, short-term
adaptation of workload on the basis of comparable, easy-to-use devices that measure
HR does not seem reasonable right now. Future research might concentrate on
identifying rather long-term changes that indicate stress and/or develop algorithms
that address the reduced reliability of wearable devices, especially when moving
and/or considering more variables for identifying changes in workload (e.g., step
count, galvanic skin response).
Acknowledgements
The research leading to these results has received funding from Horizon 2020, the
European Union’s Framework Programme for Research and Innovation
(H2020/2014-2020) under grant agreement no 723277.
References
Barber, D., Carter, A., Harris, J., & Reinerman-Jones, L. (2017). Feasibility of
wearable fitness trackers for adapting multimodal communication. In S.
Yamamoto (Ed.). International Conference on Human Interface and the
Management of Information (pp. 504-516). Cham: Springer.
De Waard, D. (1996). The measurement of drivers' mental workload. The Netherlands:
University of Groningen, Traffic Research Centre.
De Waard, D., & Brookhuis, K.A. (1991). Assessing driver status: A demonstration
experiment on the road. Accident Analysis & Prevention, 23, 297-307.
Field, A. (2013). Discovering statistics using IBM SPSS statistics. London: Sage.
Grubbs, F.E. (1969). Procedures for detecting outlying observations in samples.
Technometrics, 11, 1-21.
Hart, S.G., & Staveland, L.E. (1988). Development of NASA-TLX (Task Load
Index): Results of empirical and theoretical research. Advances in
Psychology, 52, 139-183. doi:10.1016/S0166-4115(08)62386-9
Holm, S. 1979. A simple sequential rejective multiple test procedure. Scandinavian
Journal of Statistics, 6, 65-70.
Hsu, B.W., Wang, M.J.J., Chen, C.Y., & Chen, F. (2015). Effective indices for
monitoring mental workload while performing multiple tasks. Perceptual
and Motor Skills, 121, 94-117.
Hwang, S., & Lee, S. (2017). Wristband-type wearable health devices to measure
construction workers' physical demands. Automation in Construction.
doi:10.1016/j.autcon.2017.06.003
IDC (2017). Worldwide wearables market to nearly double by 2021, According to
IDC. https://www.idc.com/getdoc.jsp?containerId=prUS42818517.
190 Schmalfuß, Mach, Klüber, Habelt, Beggiato, Körner, & Krems
Kim, S., & Kim, S. (2016). A multi-criteria approach toward discovering killer IoT
application in Korea. Technological Forecasting and Social Change, 102,
143-155.
Lavallière, M., Burstein, A.A., Arezes, P., & Coughlin, J.F. (2016). Tackling the
challenges of an aging workforce with the use of wearable technologies and
the quantified-self. Dyna, 83(197), 38. doi:10.15446/dyna.v83n197.57588
Marakhimov, A., & Joo, J. (2017). Consumer adaptation and infusion of wearable
devices for healthcare. Computers in Human Behavior, 76, 135-148.
doi:10.1016/j.chb.2017.07.016
Matthews, G., Reinerman-Jones, L.E., Barber, D.J., & Abich IV, J. (2015). The
psychometrics of mental workload: Multiple measures are sensitive but
divergent. Human Factors, 57, 125-143.
Meinel, J. (2013). Spezifische Effekte visueller und kognitiver Ablenkung bei der
Kraftfahrzeugführung (Specific effects of visual and cognitive distraction
while driving a motor vehicle) (PhD thesis). Humboldt-Universität zu
Berlin, Mathematisch-Naturwissenschaftliche Fakultät II.
https://doi.org/http://dx.doi.org/10.18452/16678
Mulder, L.J.M. (1992). Measurement and analysis methods of heart rate and
respiration for use in applied environments. Biological Psychology, 34, 205-
236.
Reinerman-Jones, L., Harris, J., & Watson, A. (2017, July). Considerations for using
fitness trackers in Psychophysiology research. In S. Yamamoto (Ed.).
International Conference on Human Interface and the Management of
Information (pp. 598-606). Cham: Springer.
Schubert, C., Lambertz, M., Nelesen, R.A., Bardwell, W., Choi, J.B., & Dimsdale,
J.E. (2009). Effects of stress on heart rate complexity—a comparison
between short-term and chronic stress. Biological Psychology, 80, 325-332.
Shaffer, F., McCraty, R., & Zerr, C.L. (2014). A healthy heart is not a metronome:
An integrative review of the heart’s anatomy and heart rate variability. Frontiers in Psychology, 5. doi:10.3389/fpsyg.2014.01040
Shcherbina, A., Mattsson, C.M., Waggott, D., Salisbury, H., Christle, J.W., Hastie,
T., Wheeler, M.T., & Ashley, E.A. (2017). Accuracy in wrist-worn, sensor-
based measurements of heart rate and energy expenditure in a diverse
cohort. Journal of Personalized Medicine, 7(3), 1-12.
Stahl, S.E., An, H.S., Dinkel, D.M., Noble, J.M., & Lee, J.M. (2016). How accurate
are the wrist-based heart rate monitors during walking and running
activities? Are they accurate enough? BMJ Open Sport & Exercise
Medicine, 2, doi:10.1136/bmjsem-2015-000106
Sun, F.-T., Kuo, C., Cheng, H.-T., Buthpitiya, S., Collins, P., & Griss, M. (2012).
Activity-aware mental stress detection using physiological sensors. In M.
Gris and G. Yang (Eds.), Mobile Computing, Applications, and Services:
Second International ICST Conference, MobiCASE 2010, Santa Clara, CA,
USA, October 25-28, 2010, Revised Selected Papers (pp. 282–301). Berlin,
Heidelberg: Springer. doi:10.1007/978-3-642-29336-8_16
Swan, M. (2012). Sensor mania! The internet of things, wearable computing,
objective metrics, and the quantified self 2.0. Journal of Sensor and
Actuator Networks, 1, 217-253.
wearable devices and workload assessment 191
Tarvainen, M.P., Niskanen, J.P., Lipponen, J.A., Ranta-Aho, P.O., & Karjalainen,
P.A. (2014). Kubios HRV–heart rate variability analysis software.
Computer Methods and Programs in Biomedicine, 113, 210-220.
Wickens, C.D. (2008). Multiple resources and mental workload. Human Factors,
50, 449-455.
Yixiang, X. (2015). Metronom Pro – Das Profi Metronom (Version 3.13.2) [Mobile
application software]. Retrieved from: http://appsto.re/de/FNrFC.i