Embed Size (px)
Citation preview
y = 1.8324x + 457.8
R2 = 0.2994
y = 2.8349x + 316.36
R2 = 0.6919
0
200
400
600
800
1000
1200
1400
1600
1800
0 50 100 150 200 250 300 350 400 450
Dispersible P (mg P / kg bulk soil)
P t
ot
(mg
/kg
)
Meghna Ganges
From: Ali et al. (2003); Dhaka, BUET Symposium
Ganges
Floodplain
Meghna
Floodplain
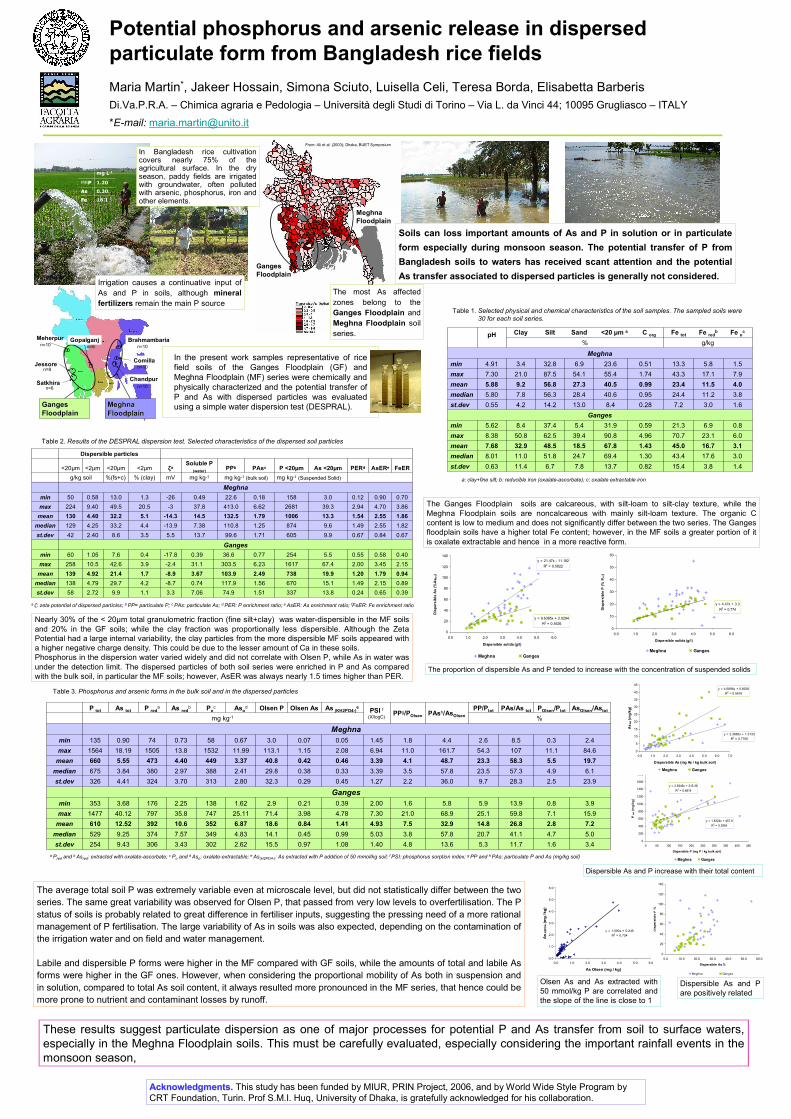
Potential phosphorus and arsenic release in dispersed
particulate form from Bangladesh rice fields
Maria Martin*, Jakeer Hossain, Simona Sciuto, Luisella Celi, Teresa Borda, Elisabetta Barberis
Di.Va.P.R.A. – Chimica agraria e Pedologia – Università degli Studi di Torino – Via L. da Vinci 44; 10095 Grugliasco – ITALY
*E-mail: [email protected]
Soils can loss important amounts of As and P in solution or in particulate
form especially during monsoon season. The potential transfer of P from
Bangladesh soils to waters has received scant attention and the potential
As transfer associated to dispersed particles is generally not considered.
1.43.815.40.8213.77.86.711.40.63st.dev
1.63.07.20.288.413.014.24.20.55st.dev
median
mean
max
min
Ganges
median
mean
max
min
Meghna
3.017.643.41.3069.424.751.811.08.01
3.116.745.01.4367.818.548.532.97.68
6.023.170.74.9690.839.462.550.88.38
0.86.921.30.5931.95.437.48.45.62
3.811.224.40.9540.628.456.37.85.80
4.011.523.40.9940.527.356.89.25.88
7.917.143.31.7455.454.187.521.07.30
1.55.813.30.5123.66.932.83.44.91
g/kg%
Fe ocFe red
bFe totC org<20 µm aSandSiltClaypH
MeghnaMeghna
FloodplainFloodplain
Satkhira
Jessore
Meherpur Brahmambaria
Chandpur
n=8
n=10 n=10n=6
n=6 n=10
n=10
GangesGanges
FloodplainFloodplain
Comilla
Gopalganj
The most As affected
zones belong to the
Ganges Floodplain and
Meghna Floodplain soil
series.
Irrigation causes a continuative input of
As and P in soils, although mineral
fertilizers remain the main P source
In Bangladesh rice cultivation covers nearly 75% of the agricultural surface. In the dry season, paddy fields are irrigated with groundwater, often polluted with arsenic, phosphorus, iron and other elements.
1.20MRPP
0.30AsAs
18.1FeFe
mg L-1
Table 1. Selected physical and chemical characteristics of the soil samples. The sampled soils were
30 for each soil series.
a: clay+fine silt; b: reducible iron (oxalate-ascorbate); c: oxalate extractable iron
0
20
40
60
80
100
120
140
0.0 10.0 20.0 30.0 40.0 50.0 60.0
Dispersible As %
Dis
pers
ible
P %
Meghna Ganges
y = 2.3883x + 1.3133
R2 = 0.7706
y = 4.6896x + 0.8258
R2 = 0.5616
0
5
10
15
20
25
30
35
40
45
0.0 1.0 2.0 3.0 4.0 5.0 6.0 7.0
Dispersible As (mg As / kg bulk soil)
As to
t (m
g/k
g)
Meghna Ganges
Table 2. Results of the DESPRAL dispersion test. Selected characteristics of the dispersed soil particles
Table 3. Phosphorus and arsenic forms in the bulk soil and in the dispersed particles
In the present work samples representative of rice
field soils of the Ganges Floodplain (GF) and
Meghna Floodplain (MF) series were chemically and
physically characterized and the potential transfer of
P and As with dispersed particles was evaluated using a simple water dispersion test (DESPRAL).
Dispersible particles
Meghna
0.390.650.2413.83371.5174.97.063.31.19.92.7258st.dev
0.892.151.4915.16701.56117.90.74-8.74.229.74.79138median
0.941.791.2019.97382.49103.93.67-8.91.721.44.92139mean
2.153.452.0067.416176.23303.531.1-2.43.942.610.5258max
0.400.580.555.52540.7736.60.39-17.80.47.61.0560min
Ganges
0.670.840.679.96051.7199.613.75.53.58.62.4042st.dev
1.822.551.499.68741.25110.87.38-13.94.433.24.25129median
1.862.551.5413.310061.79132.514.5-14.35.132.24.40130mean
3.864.702.9439.326816.62413.037.8-320.549.59.40224max
0.700.900.123.01580.1822.60.49-261.313.00.5850min
mg kg-1 (Suspended Solid)mg kg-1 (bulk soil)mg kg-1mV% (clay)%(fs+c)g/kg soil
FeERAsERePERdAs <20µmP <20µmPAscPPbSoluble P
(water)ζa<2µm<20µm<2µm<20µm
1.40
5.03
4.93
7.30
2.00
1.27
3.39
3.39
6.94
1.45
PSI f
(X/logC)
3.41.611.75.313.64.81.080.9715.52.623023.433069.43254st.dev
5.04.741.120.757.83.80.990.4514.14.833497.573749.25529median
7.22.826.814.832.97.51.410.8418.66.8735210.639212.52610mean
15.97.159.825.168.921.04.783.9871.425.1174735.879740.121477max
3.90.813.95.95.81.60.390.212.91.621382.251763.68353min
Ganges
23.92.528.39.736.02.20.450.2932.32.803133.703244.41326st.dev
6.14.957.323.557.83.50.330.3829.82.413882.973803.84675median
19.75.558.323.348.74.10.460.4240.83.374494.404735.55660mean
84.611.110754.3161.711.02.081.15113.111.99153213.8150518.191564max
2.40.38.52.64.41.80.050.073.00.67580.73740.90135min
Meghna
%mg kg-1
AsOlsen/AstotPOlsen/PtotPAs/As totPP/PtotPAsh/AsOlsenPPg/POlsen
As (KH2PO4-)eOlsen AsOlsen PAso
dPocAs red
bP redaAs totP tot
y = 1.090x + 0.245
R2 = 0.724
0.0
1.0
2.0
3.0
4.0
5.0
6.0
0.0 1.0 2.0 3.0 4.0 5.0 6.0
As Olsen (mg / kg)
As H
2P
O4- (
mg
/ k
g)
a Pred and b Asred: extracted with oxalate-ascorbate; c Po and d Aso: oxalate-extractable; e As(H2PO4-): As extracted with P addition of 50 mmol/kg soil; f PSI: phosphorus sorption index; g PP and h PAs: particulate P and As (mg/kg soil)
y = 4.47x + 3.3
R2 = 0.774
0
10
20
30
40
50
60
0.0 1.0 2.0 3.0 4.0 5.0 6.0
Dispersible solids (g/l)
Dis
pers
ible
P (
% P
tot)
Meghna Ganges
y = 9.6385x + 2.0294
R2 = 0.4626
y = 21.47x - 11.182
R2 = 0.5822
0
20
40
60
80
100
120
140
0.0 1.0 2.0 3.0 4.0 5.0 6.0
Dispersible solids (g/l)
Dis
pe
rsib
le A
s (
%A
s to
t)
Meghna Ganges
The Ganges Floodplain soils are calcareous, with silt-loam to silt-clay texture, while the
Meghna Floodplain soils are noncalcareous with mainly silt-loam texture. The organic C
content is low to medium and does not significantly differ between the two series. The Ganges
floodplain soils have a higher total Fe content; however, in the MF soils a greater portion of it
is oxalate extractable and hence in a more reactive form.
Nearly 30% of the < 20µm total granulometric fraction (fine silt+clay) was water-dispersible in the MF soils
and 20% in the GF soils; while the clay fraction was proportionally less dispersible. Although the Zeta
Potential had a large internal variability, the clay particles from the more dispersible MF soils appeared with
a higher negative charge density. This could be due to the lesser amount of Ca in these soils.
Phosphorus in the dispersion water varied widely and did not correlate with Olsen P, while As in water was
under the detection limit. The dispersed particles of both soil series were enriched in P and As compared
with the bulk soil, in particular the MF soils; however, AsER was always nearly 1.5 times higher than PER.
These results suggest particulate dispersion as one of major processes for potential P and As transfer from soil to surface waters,
especially in the Meghna Floodplain soils. This must be carefully evaluated, especially considering the important rainfall events in the
monsoon season,
Dispersible As and P
are positively related
The proportion of dispersible As and P tended to increase with the concentration of suspended solids
Olsen As and As extracted with
50 mmol/kg P are correlated and
the slope of the line is close to 1
Dispersible As and P increase with their total content
The average total soil P was extremely variable even at microscale level, but did not statistically differ between the two
series. The same great variability was observed for Olsen P, that passed from very low levels to overfertilisation. The P
status of soils is probably related to great difference in fertiliser inputs, suggesting the pressing need of a more rational
management of P fertilisation. The large variability of As in soils was also expected, depending on the contamination of
the irrigation water and on field and water management.
Labile and dispersible P forms were higher in the MF compared with GF soils, while the amounts of total and labile As
forms were higher in the GF ones. However, when considering the proportional mobility of As both in suspension and
in solution, compared to total As soil content, it always resulted more pronounced in the MF series, that hence could be
more prone to nutrient and contaminant losses by runoff.
AcknowledgmentsAcknowledgments.. This study has been funded by MIUR, PRIN Project, 2006, and by World Wide Style Program by
CRT Foundation, Turin. Prof S.M.I. Huq, University of Dhaka, is gratefully acknowledged for his collaboration.
a ζ: zeta potential of dispersed particles; b PP= particulate P; c PAs: particulate As; d PER: P enrichment ratio; e AsER: As enrichment ratio; fFeER: Fe enrichment ratio