Embed Size (px)
Citation preview
April 2010
Potential profitability for trend following systemsWhat happened to medium to long term trend following CTAs in 2008 & 2009?
Introduction to Transtrend
• Established in Rotterdam, the Netherlands in 1991.• Trading its “Diversified Trend Program” (DTP) since June 1992;
the AuM of DTP amounts to USD 7.8B as of 1 April 2010 (including notional funding).
• Trading its “Equity Trend Program” (ETP) since January 2007; the AuM of ETP amounts to USD 99M as of 1 April 2010.
• Registration: in the US with the National Futures Association
Potential profitability for trend following systems 1
• Registration: in the US with the National Futures Association (NFA) as CTA since 1994 and in the Netherlands with the Authority for Financial Markets (AFM) as asset manager since 1996.
• Organization: 57 people of which 26 are dedicated to research & development (as of 1 April 2010).
• Ownership: Transtrend is fully owned by Robeco, a Dutch asset manager which in its turn is fully owned by Rabobank.
Introduction to Trendpot
• The 2009 performance of many medium to long-term trend following programs, including Transtrend’s DTP, was disappointing after a very successful 2008.
• “The market environment did not provide sufficient strong and exploitable trends, and consequently lacked sufficient opportunity.”
• The purpose of the new measure Trendpot is to help explain and
Potential profitability for trend following systems 2
• The purpose of the new measure Trendpot is to help explain and understand the performance (or the lack thereof) of medium to long-term trend following programs like DTP.
• Although the measure can provide useful insights for individual markets, its real strength lies in explaining the performance for groups of markets and the portfolio as a whole.
Introduction to Trendpot
• Trendpot is a backward looking measure that indicates for an individual market whether a medium to long-term trend following system could potentially have been profitable when applied on that particular market during the preceding month.
• Trendpot is a number between 0 and 1:– 0 indicates a very low chance for a medium to long-term trend
following system to have been profitable
Potential profitability for trend following systems 3
following system to have been profitable– 1 indicates a very high chance for a medium to long-term trend
following system to have been profitable• The measure does not show the direction (long or short) of the
potentially profitable trend.• The measure is not defined to explain losses.
Data used
• Price history of all markets traded in DTP as of 31 January 2010• One price series for every market
– Liquidity weighted combination of tradable active months
• Based on daily closing prices• Price data for each month m reduced to 3 data points
– Highest closing price, Hm
Potential profitability for trend following systems 4
– Highest closing price, Hm
– Lowest closing price, Lm
– Closing price of last trading day, Cm
• Trendpot for month m is a function of:– Hm-2 , Lm-2 , Cm-2
– Hm-1 , Lm-1 , Cm-1
– Hm , Lm , Cm
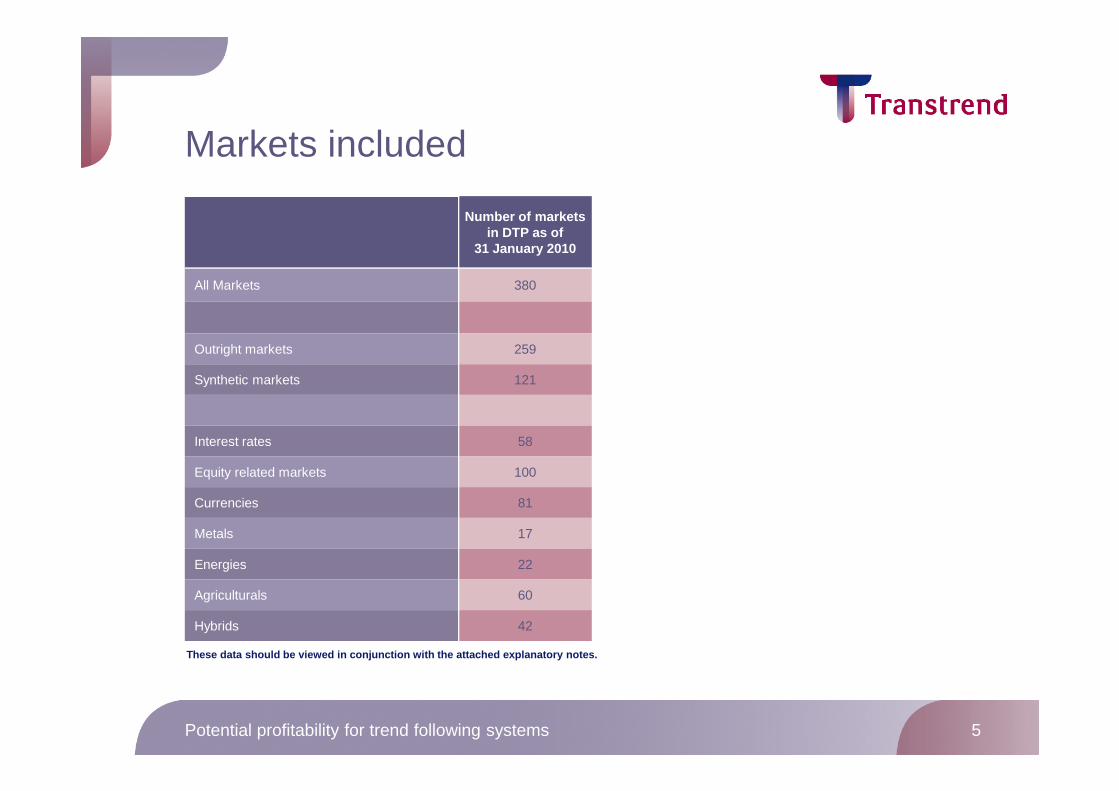
Markets included
Number of markets in DTP as of
31 January 2010
All Markets 380
Outright markets 259
Synthetic markets 121
Potential profitability for trend following systems 5
Interest rates 58
Equity related markets 100
Currencies 81
Metals 17
Energies 22
Agriculturals 60
Hybrids 42
These data should be viewed in conjunction with the attached explanatory notes.

Definition of TrendpotStep 1.• Determine whether Trendpot should measure the potential profitability of an uptrend or a downtrend
Cm
Potential profitability for trend following systems 6
m-2 m-1 m
If last month’s close Cm is higher than the close of the preceding month Cm-1, Trendpot should measure the potential profitability of a possible uptrend and vice versa.
In the next pages, we will assume Cm > Cm-1 i.e., a possible uptrend.
Cm-1
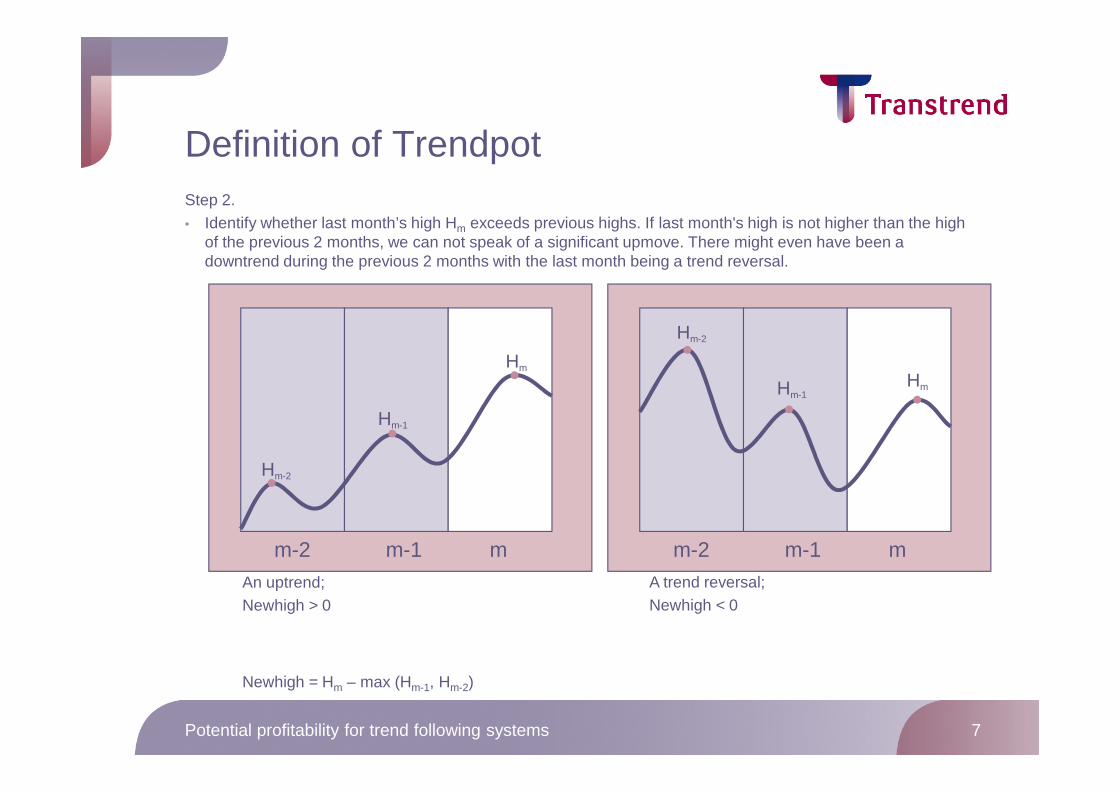
Definition of TrendpotStep 2.• Identify whether last month’s high Hm exceeds previous highs. If last month's high is not higher than the high
of the previous 2 months, we can not speak of a significant upmove. There might even have been a downtrend during the previous 2 months with the last month being a trend reversal.
Hm
HmHm-1
Hm-2
Potential profitability for trend following systems 7
m-2 m-1 m
Hm-1
Hm-2
m-2 m-1 m
Hm-1
Newhigh = Hm – max (Hm-1, Hm-2)
A trend reversal; Newhigh < 0
An uptrend; Newhigh > 0
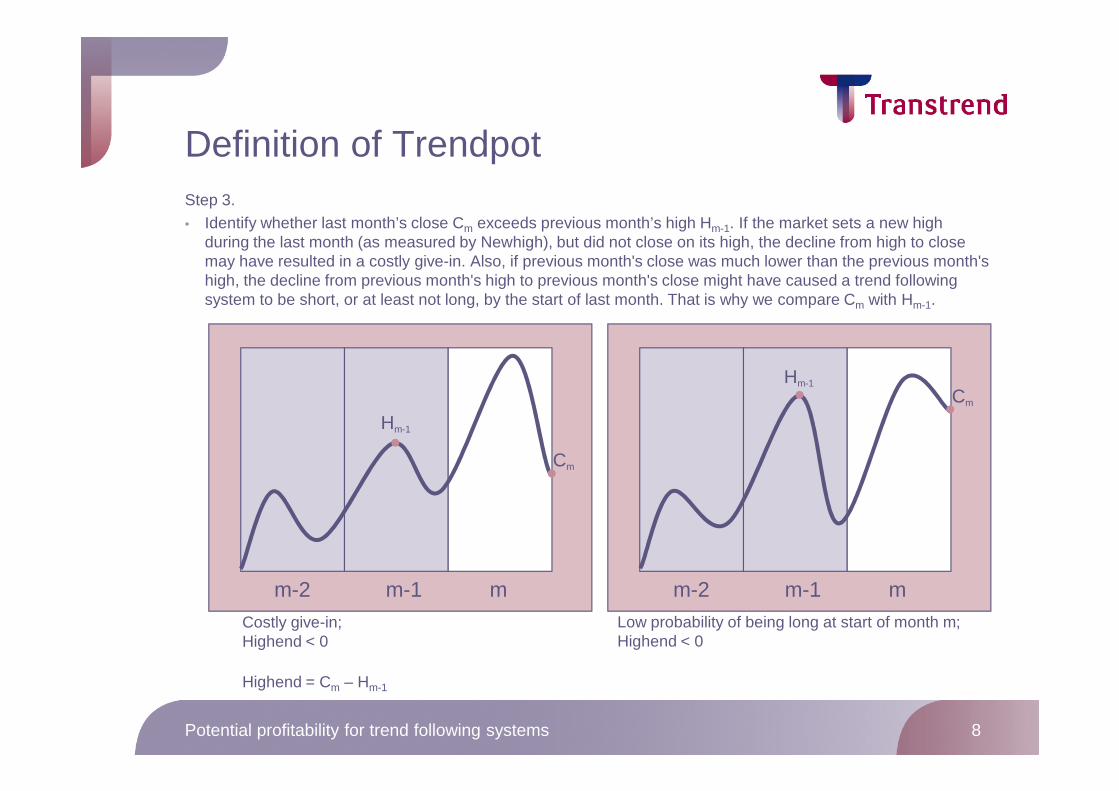
Definition of TrendpotStep 3.• Identify whether last month’s close Cm exceeds previous month’s high Hm-1. If the market sets a new high
during the last month (as measured by Newhigh), but did not close on its high, the decline from high to close may have resulted in a costly give-in. Also, if previous month's close was much lower than the previous month's high, the decline from previous month's high to previous month's close might have caused a trend following system to be short, or at least not long, by the start of last month. That is why we compare Cm with Hm-1.
CHm-1
Potential profitability for trend following systems 8
m-2 m-1 m
Cm
Hm-1
m-2 m-1 m
Cm
Highend = Cm – Hm-1
Low probability of being long at start of month m;Highend < 0
Costly give-in; Highend < 0

Definition of TrendpotStep 4.• Since we regard Newhigh and Highend both as necessary conditions for a medium to long-term trend following
system to be profitable, we define Upmove as the minimum of both.
Upmove = min(Newhigh, Highend)
Potential profitability for trend following systems 9
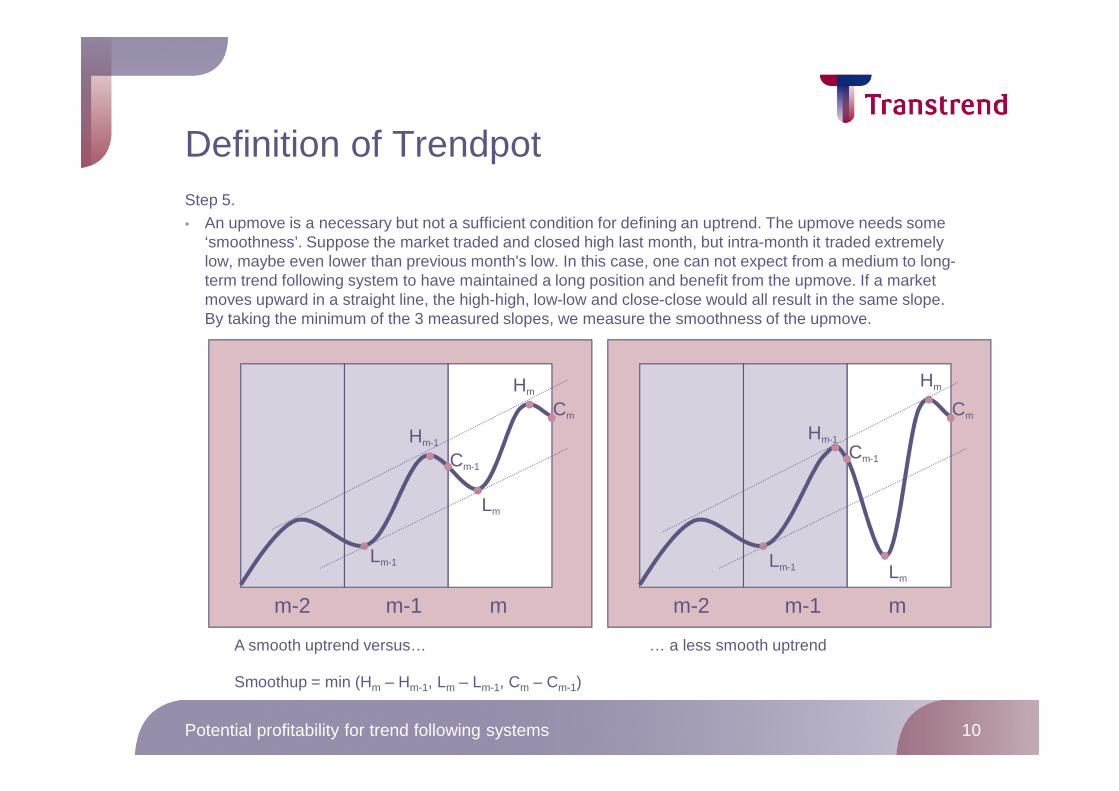
Definition of TrendpotStep 5.• An upmove is a necessary but not a sufficient condition for defining an uptrend. The upmove needs some
‘smoothness’. Suppose the market traded and closed high last month, but intra-month it traded extremely low, maybe even lower than previous month's low. In this case, one can not expect from a medium to long-term trend following system to have maintained a long position and benefit from the upmove. If a market moves upward in a straight line, the high-high, low-low and close-close would all result in the same slope. By taking the minimum of the 3 measured slopes, we measure the smoothness of the upmove.
HmHm
Potential profitability for trend following systems 10
m-2 m-1 m
Cm
Hm-1
Smoothup = min (Hm – Hm-1, Lm – Lm-1, Cm – Cm-1)
A smooth uptrend versus…
m
Cm-1
Lm
Lm-1
… a less smooth uptrend
m-2 m-1 m
Cm
Hm-1
Cm-1
Lm
Lm-1
Definition of TrendpotStep 6.• Calculate Trendup by combining Upmove and Smoothup, by taking the mean of the two and not allowing this to
get below zero.
Trendup = max (0, mean (Upmove, Smoothup))
Potential profitability for trend following systems 11
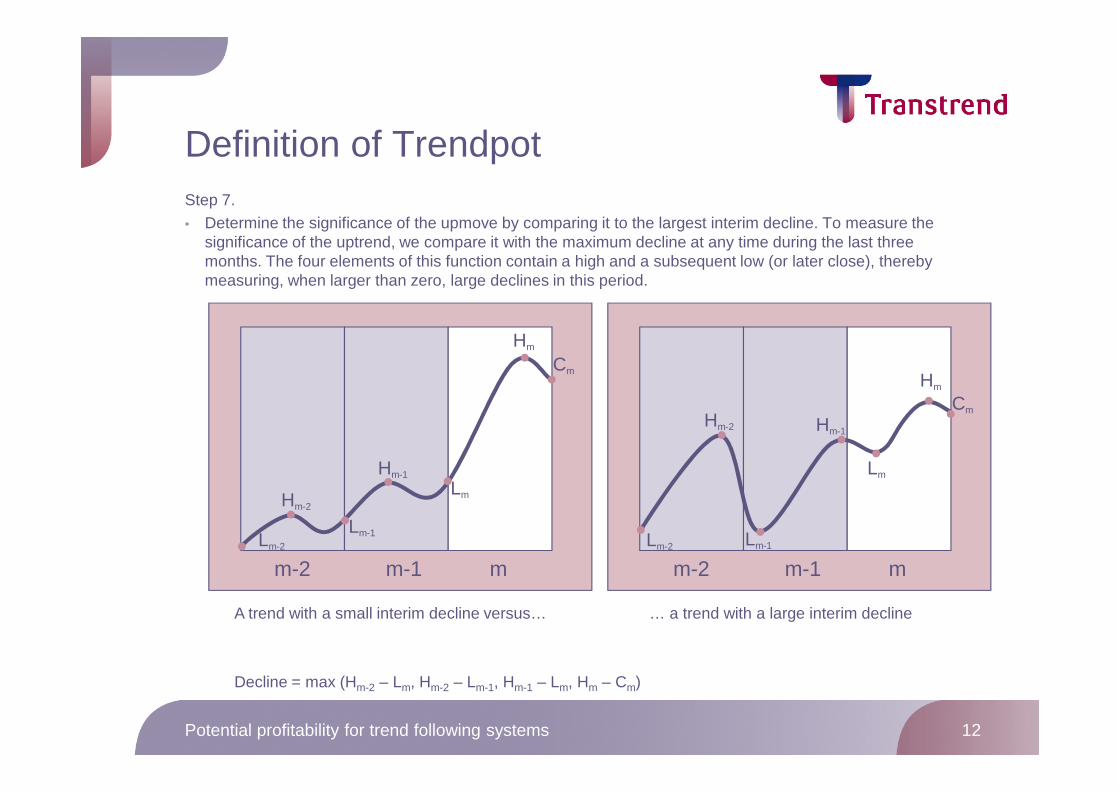
Definition of TrendpotStep 7.• Determine the significance of the upmove by comparing it to the largest interim decline. To measure the
significance of the uptrend, we compare it with the maximum decline at any time during the last three months. The four elements of this function contain a high and a subsequent low (or later close), thereby measuring, when larger than zero, large declines in this period.
Cm
Hm
CHm
Potential profitability for trend following systems 12
m-2 m-1 m
Hm-1
Decline = max (Hm-2 – Lm, Hm-2 – Lm-1, Hm-1 – Lm, Hm – Cm)
A trend with a small interim decline versus…
Hm-2
Lm
Lm-1Lm-2
m-2 m-1 m
Cm
Hm-1Hm-2
Lm
Lm-1Lm-2
… a trend with a large interim decline
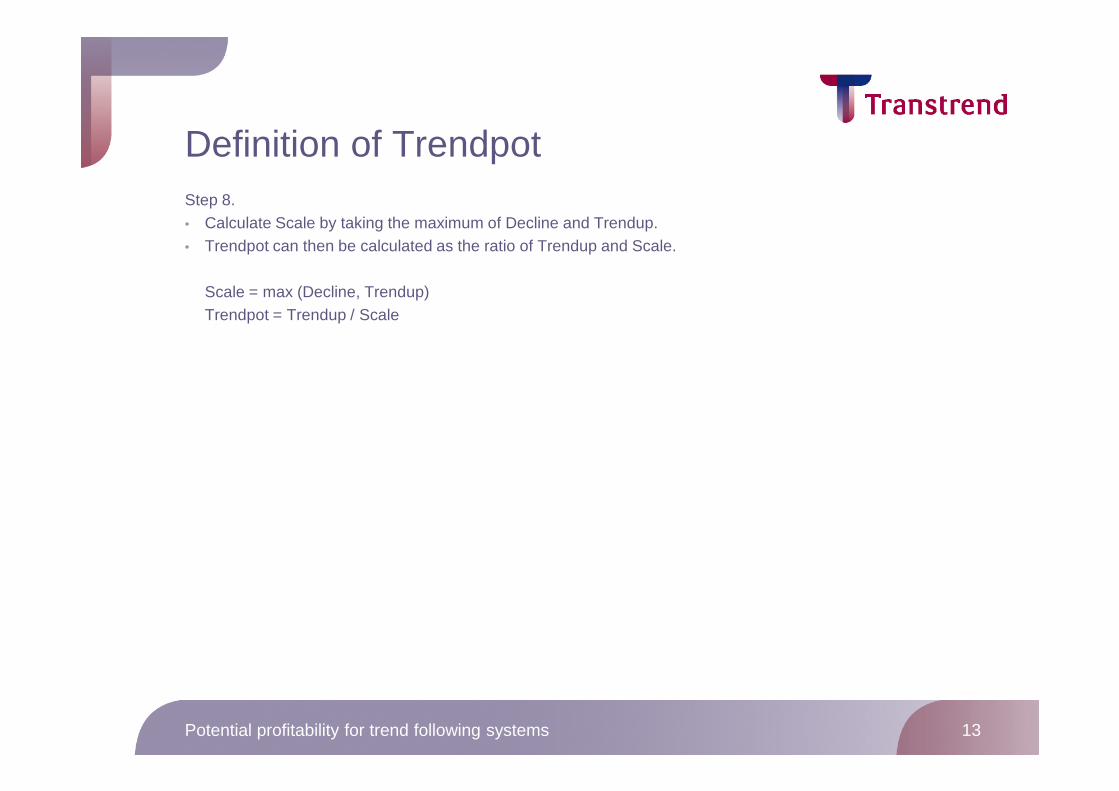
Definition of TrendpotStep 8.• Calculate Scale by taking the maximum of Decline and Trendup.• Trendpot can then be calculated as the ratio of Trendup and Scale.
Scale = max (Decline, Trendup)Trendpot = Trendup / Scale
Potential profitability for trend following systems 13
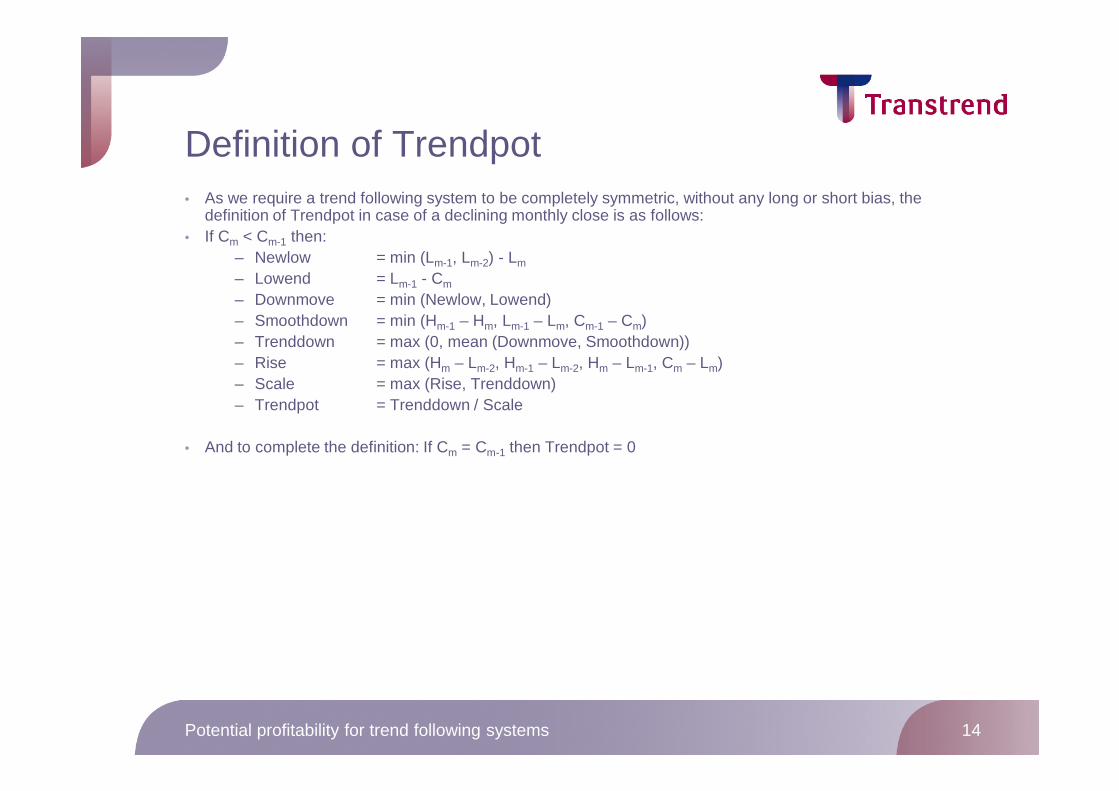
Definition of Trendpot• As we require a trend following system to be completely symmetric, without any long or short bias, the
definition of Trendpot in case of a declining monthly close is as follows:• If Cm < Cm-1 then:
– Newlow = min (Lm-1, Lm-2) - Lm
– Lowend = Lm-1 - Cm
– Downmove = min (Newlow, Lowend)– Smoothdown = min (Hm-1 – Hm, Lm-1 – Lm, Cm-1 – Cm)– Trenddown = max (0, mean (Downmove, Smoothdown))– Rise = max (Hm – Lm-2, Hm-1 – Lm-2, Hm – Lm-1, Cm – Lm)– Scale = max (Rise, Trenddown)
Potential profitability for trend following systems 14
– Trendpot = Trenddown / Scale
• And to complete the definition: If Cm = Cm-1 then Trendpot = 0
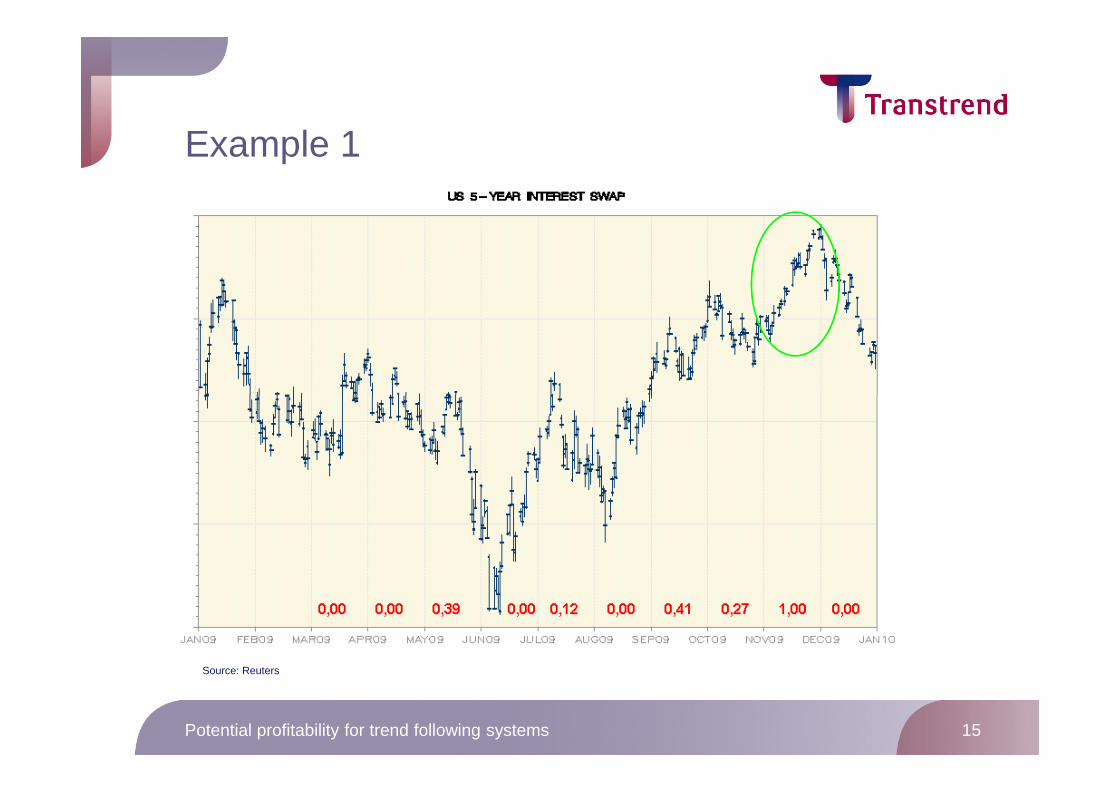
Example 1
Potential profitability for trend following systems 15
Source: Reuters
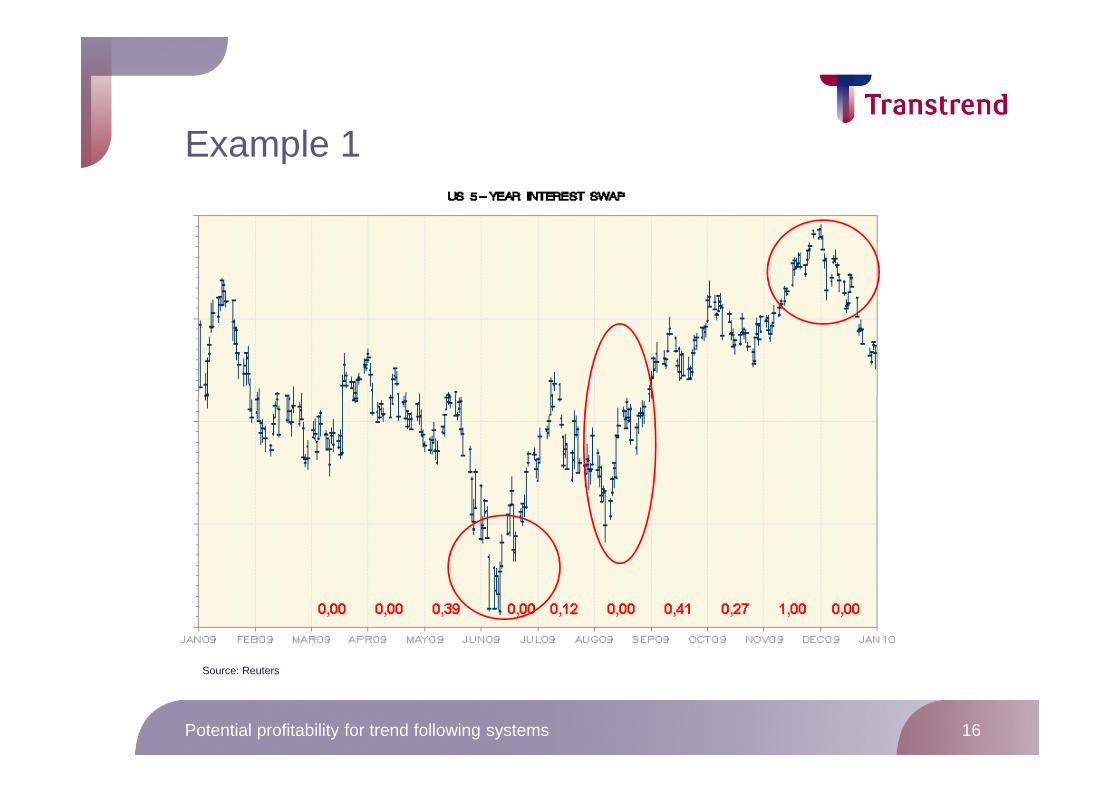
Example 1
Potential profitability for trend following systems 16
Source: Reuters
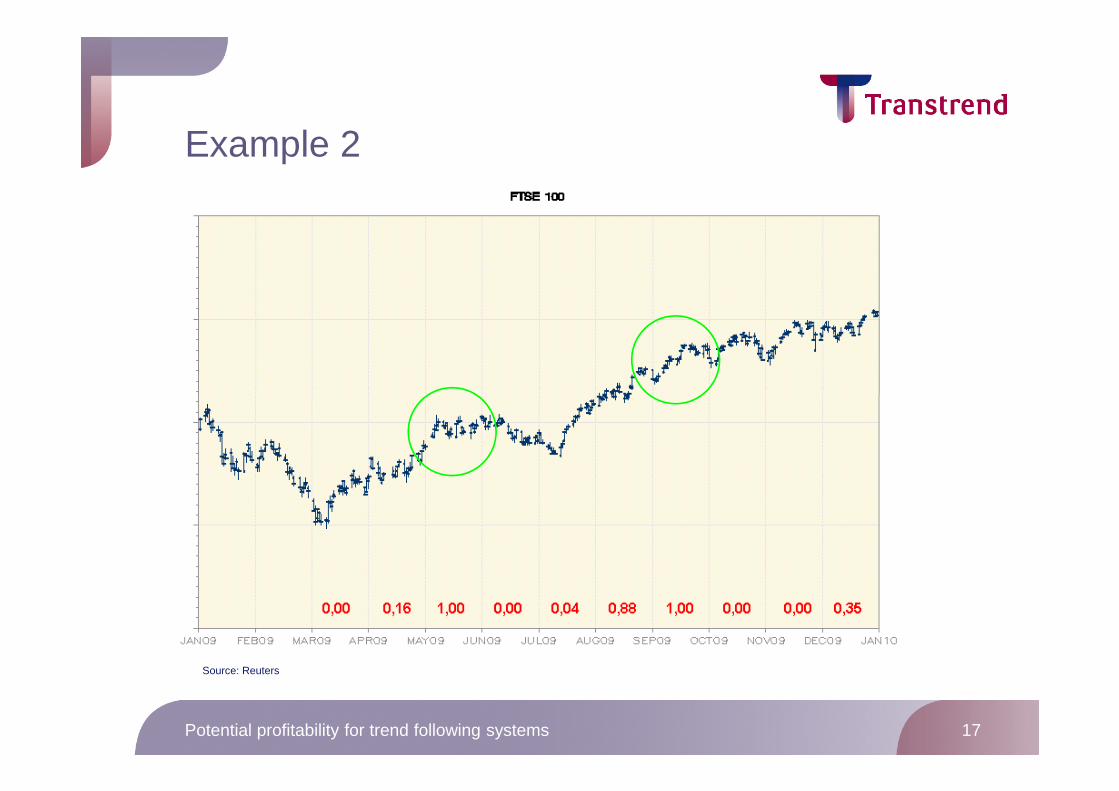
Example 2
Potential profitability for trend following systems 17
Source: Reuters
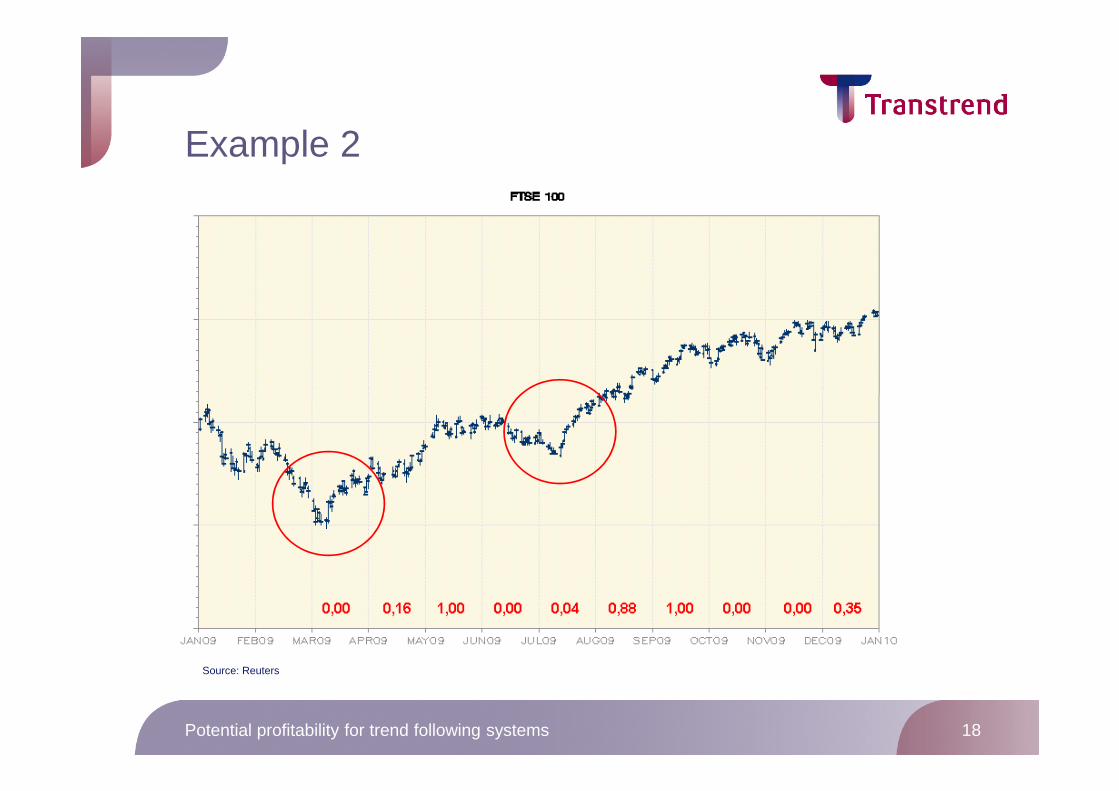
Example 2
Potential profitability for trend following systems 18
Source: Reuters
Measure versus Indicator
• Trendpot is a measure, not an indicator– No predictive value!
• A high value for Trendpot means that a medium to long-term trend following system has a high chance of having been profitable during that specific month, if it would have been active in that market.
– It does not mean that a medium to long-term trend following
Potential profitability for trend following systems 19
– It does not mean that a medium to long-term trend following system should have been active in that market during that month.
• A low value for Trendpot means that a medium to long-term trend following system has a low chance of having been profitable during that specific month, if it would have been active in that market.
– It does not mean that a medium to long-term trend following system should not have been active in that market during that month.
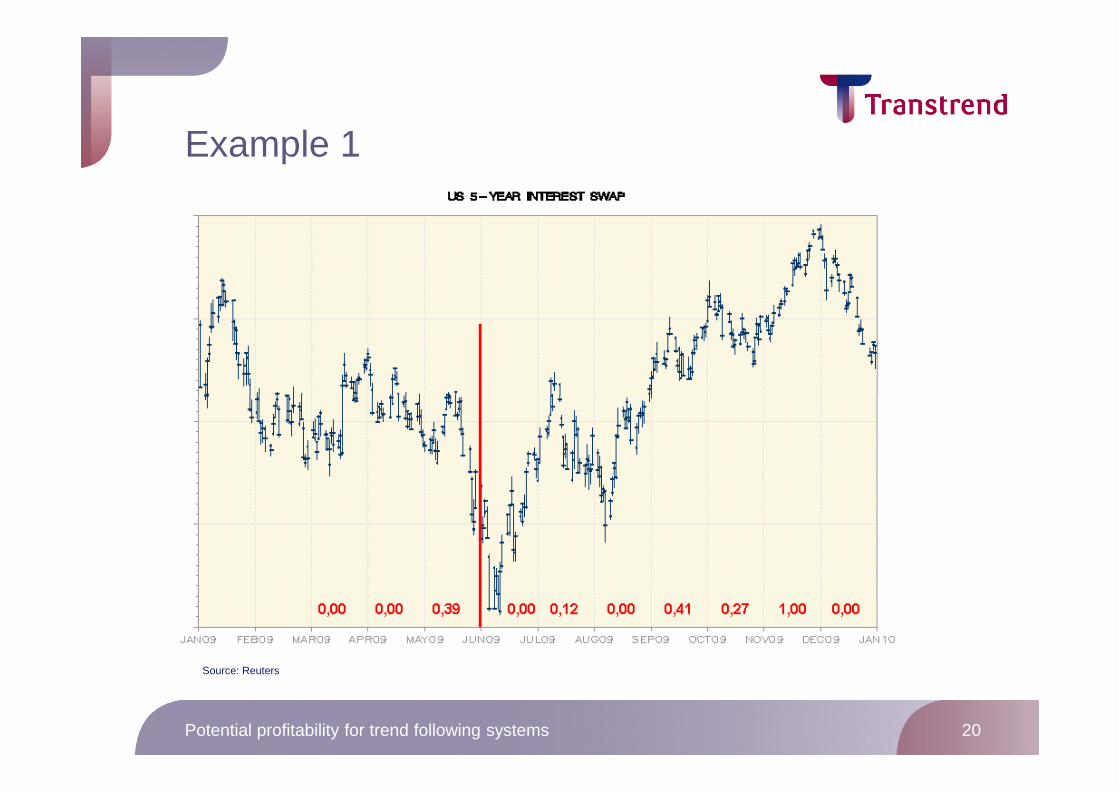
Example 1
Potential profitability for trend following systems 20
Source: Reuters
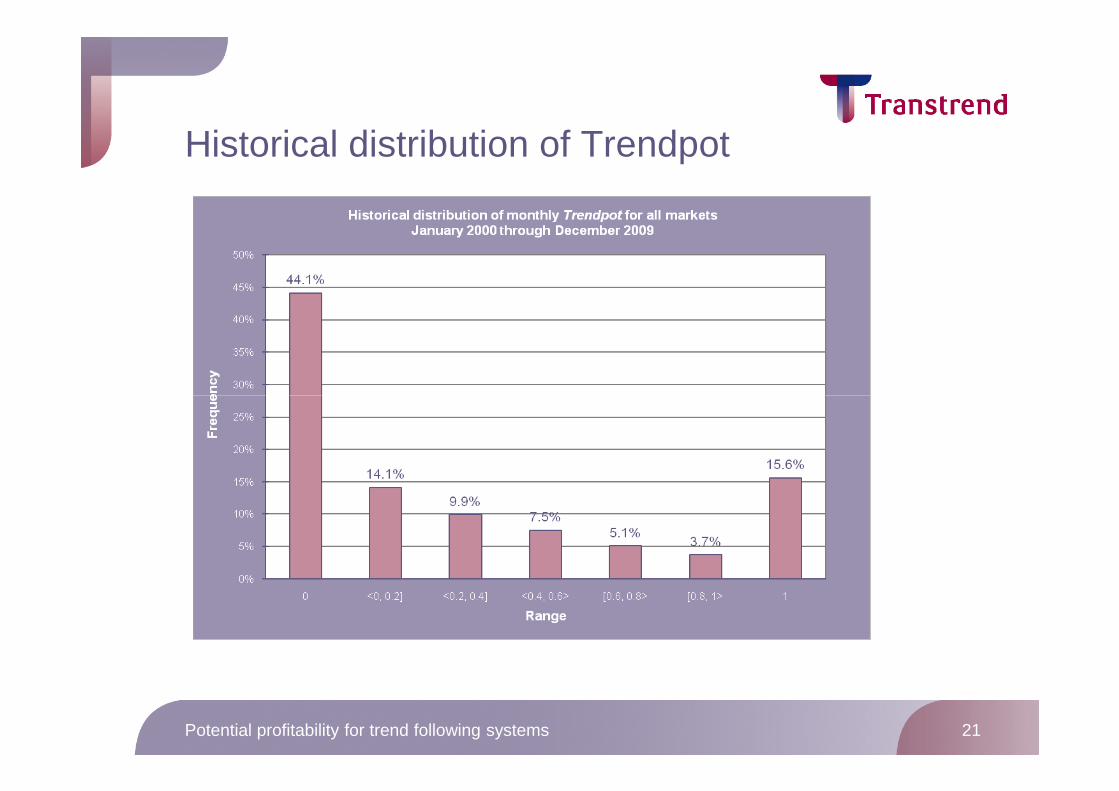
Historical distribution of Trendpot
Potential profitability for trend following systems 21

Compounding Trendpot
• Equally-weighted– The Trendpots of all markets (in the selection) are averaged, giving each market the
same weight.
• Capacity-weighted– The Trendpots of all markets (in the selection) are averaged, giving full weight to all
markets that can be traded by Transtrend without any capacity constraint, but a relatively lower weight to markets for which Transtrend's capacity is limited, relative to the extent of this limitation. Weighted this way, small markets that can only have a
Potential profitability for trend following systems 22
the extent of this limitation. Weighted this way, small markets that can only have a limited impact on Transtrend's performance also have a limited impact on the compounded Trendpot.
• Diversity-weighted– The Trendpots of all markets (in the selection) are averaged, giving each market a
weight inversely proportional to its correlation with all other markets, (again) taking into account capacity constraints. The rationale behind this is that one expects a diversified CTA to take diversification into account for allocation decisions. If two markets would be fully correlated (for instance the same product on two different exchanges), each market will be weighted for half.
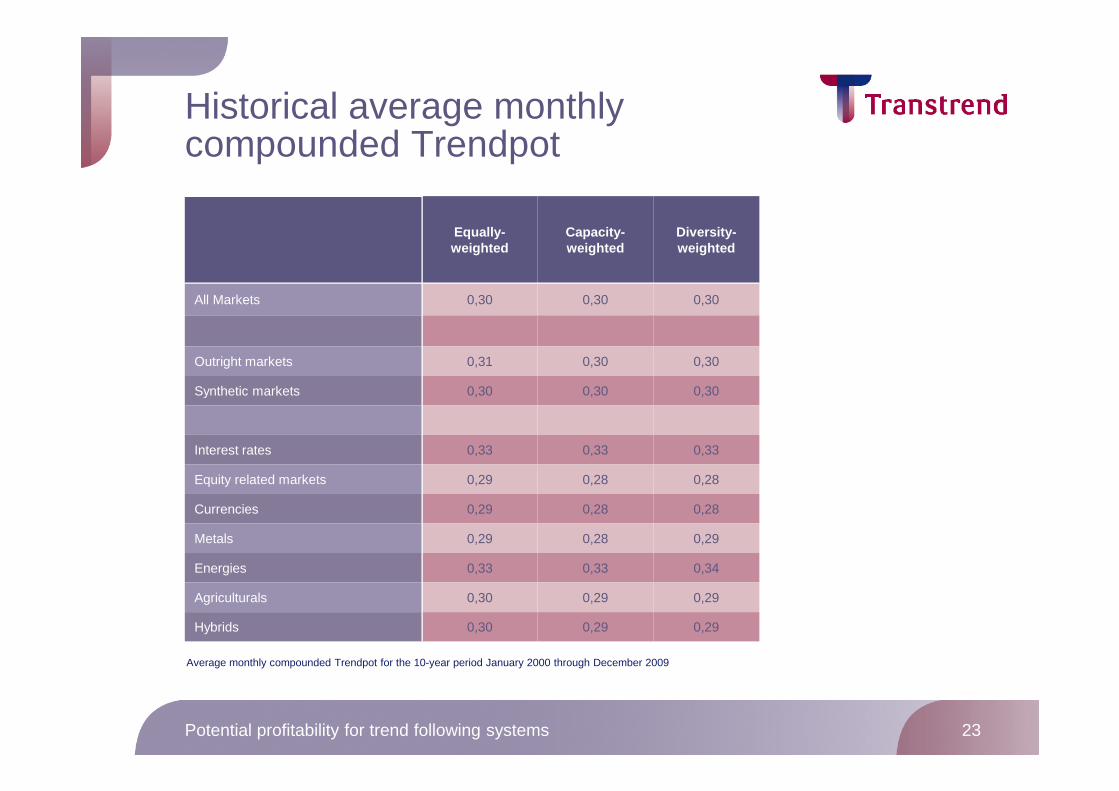
Historical average monthly compounded Trendpot
Equally-weighted
Capacity-weighted
Diversity-weighted
All Markets 0,30 0,30 0,30
Outright markets 0,31 0,30 0,30
Synthetic markets 0,30 0,30 0,30
Potential profitability for trend following systems 23
Synthetic markets 0,30 0,30 0,30
Interest rates 0,33 0,33 0,33
Equity related markets 0,29 0,28 0,28
Currencies 0,29 0,28 0,28
Metals 0,29 0,28 0,29
Energies 0,33 0,33 0,34
Agriculturals 0,30 0,29 0,29
Hybrids 0,30 0,29 0,29
Average monthly compounded Trendpot for the 10-year period January 2000 through December 2009
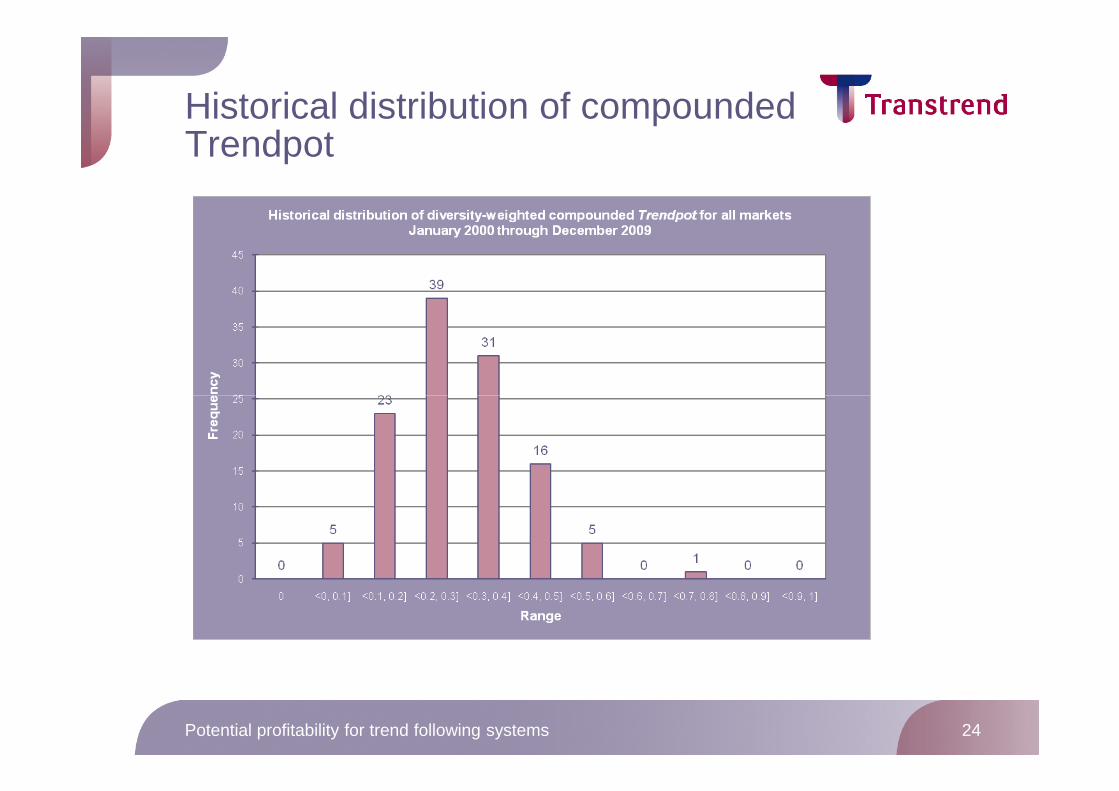
Historical distribution of compounded Trendpot
Potential profitability for trend following systems 24
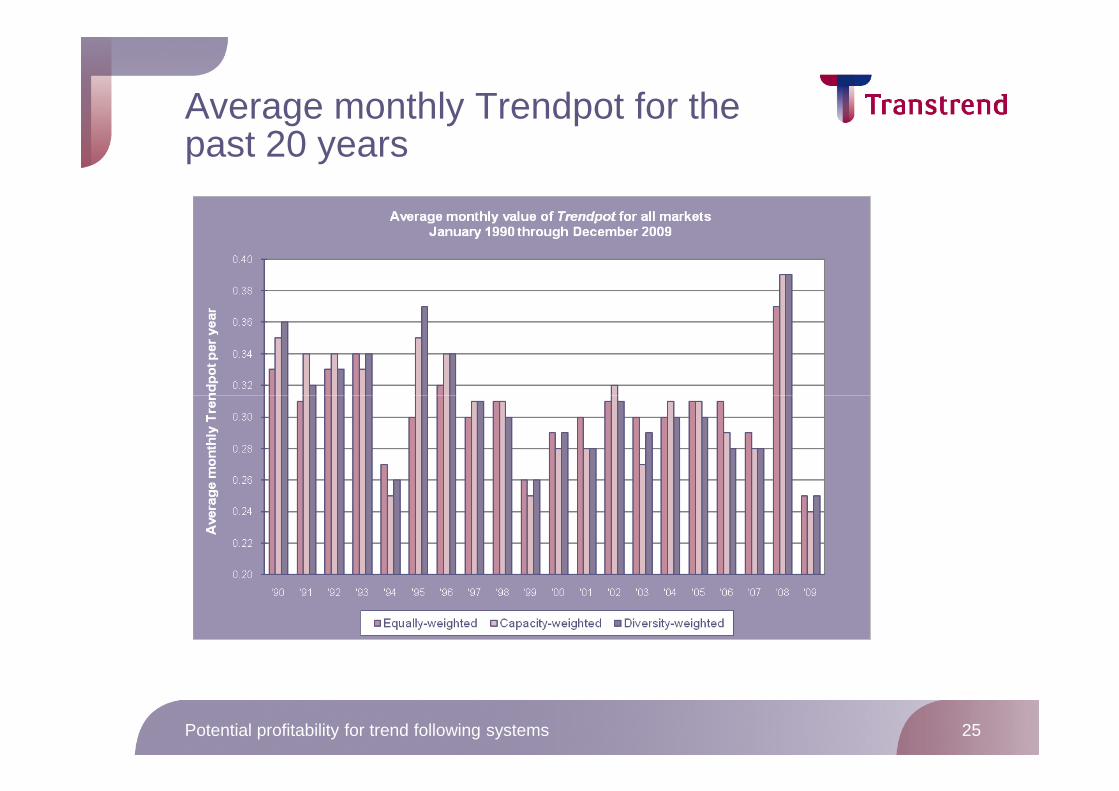
Average monthly Trendpot for the past 20 years
Potential profitability for trend following systems 25
Contact details
• Transtrend B.V.Weena 723, Unit C5.070P.O. Box 4443000 AK RotterdamThe Netherlands+31 10 453 6510
Potential profitability for trend following systems 26
+31 10 453 [email protected]
Explanatory Notes & Important NoticeIMPORTANT NOTICE
• This document is for informational purposes only. This document should not be construed as an offer to sell investment management services or interests in any investment vehicle managed by Transtrend. Trading in futures pursuant to one of Transtrend’s trading programs entails significant risks. No assurance can be given that a client will realize a profit on its investment or that it will not lose some, all or amounts in excess of its investment. Futures trading is speculative and can be highly leveraged. Futures prices are volatile. Futures trading may be illiquid and it
EXPLANATORY NOTES TO THE MARKETS INCLUDED IN THE RESEARCH PRESENTED IN THIS DOCUMENT
• For the research presented in this document, Transt rend used the price history of all markets traded in Transtrend's Diversified T rend Program (DTP) as of 31 January 2010. This includes outright futures and fo rward markets as well as synthetic markets constructed from combinations of these outright markets.
• For each market the price history is used starting from the date that the market was liquid enough to (potentially) be traded by DTP . This could be earlier than the moment that DTP actually started trading this m arket.
• For markets without a long trading history that hav e a clear precedent, the price history is backfilled with the price history of thi s precedent. For instance, the price history of Nymex NY Harbor RBOB Gasoline has b een backfilled before November '06 with the price history of Nymex Unleaded Gasoline. And the price
Potential profitability for trend following systems 27
volatile. Futures trading may be illiquid and it may not be possible to execute a buy or a sell order due to various circumstances. An investment may be subject to substantial charges for advisory fees and brokerage commissions. Any information regarding trading performance must be considered in conjunction with Transtrend’s commodity trading advisor disclosure document.
• THE VALUE OF YOUR INVESTMENT CAN FLUCTUATE. PAST PERFORMANCE IS NOT NECESSARILY INDICATIVE OF FUTURE RESULTS.
November '06 with the price history of Nymex Unleaded Gasoline. And the price history for all currency pairs containing a Euro-le g is backfilled before 1999 with the price history of the same currency with th e Euro-leg being replaced by the Deutsche Mark, where available.
• Markets that have been traded by DTP in the past, b ut that are currently not traded are not included in this research, unless th ey are used as a precedent for an actual traded market. Reasons why markets are no t traded anymore can be that the market does not exist anymore (for instanc e the Deutsche Mark versus French Franc), or because it is not liquid enough a nymore (for instance the Osaka Rubber Index).
THE VALUE OF YOUR INVESTMENT CAN FLUCTUATE. PAST PE RFORMANCE IS NOT NECESSARILY INDICATIVE OF FUTURE RESULTS.
This presentation is meant only for the person to w hich it is provided or presented by Transtrend B.V..
No part of this presentation may be reproduced and/ or distributed in any form, by print, photoprint, m icrofilm, digital data carriers or any other means without the prior written consent of Transtrend B.V..
Although Transtrend B.V. has exerted great care in c reating this document, it cannot be held responsibl e for computational or clerical errors, nor for err ors in transmission.