Embed Size (px)
Citation preview
Original Research Article
Potentials of in situ monitoring of aluminum alloyforging by acoustic emission
Bernd-Arno Behrens, Anas Bouguecha, Christian Buse, Kai Wölki,Adrian Santangelo *
Leibniz Universität Hannover, Institute of Forming Technology and Machines (IFUM), An der Universität 2,D-30823 Garbsen, Germany
a r c h i v e s o f c i v i l a n d m e c h a n i c a l e n g i n e e r i n g 1 6 ( 2 0 1 6 ) 7 2 4 – 7 3 3
a r t i c l e i n f o
Article history:
Received 19 February 2016
Accepted 23 April 2016
Available online
Keywords:
Forging
Process monitoring
Acoustic emission testing
Aluminum alloy
a b s t r a c t
Deviations during forging processes lead to workpiece failure when the forming limits of the
material are exceeded. In production processes an early detection of manufacturing faults is
preferred. The acoustic emission (AE) technique is examined with respect to its ability to
detect deviations in lubrication conditions and in the structural integrity of different
aluminum part geometries and alloys during forming. In a first step, an upsetting of varying
specimen shapes was performed in order to study correlations of occurring defects as well as
changing friction conditions with acoustic emission response. Afterwards, a cross joint was
forged and AE was analyzed. The results suggest that crack detection during forging is
feasible but limited by material ductility. In addition, it is shown that the characteristics of
the acoustic emission during forming strongly depend on the respective alloy. With respect
to faultless warm forging it is found that different stages are reflected in the AE signal,
facilitating the detection of process deviations.
# 2016 Politechnika Wrocławska. Published by Elsevier Urban & Partner Sp. z o.o. All
rights reserved.
Available online at www.sciencedirect.com
ScienceDirect
journal homepage: http://www.elsevier.com/locate/acme
1. Introduction
1.1. Forging of Al-alloys
Forged components are characterized by high mechanicalstrength under static as well as dynamic loads. These propertiescan be attributed mainly to a process-related reduced grain size,the well-distributed microstructure and their structural integritycompared to cast parts. With respect to energy and environmentconsiderations lightweight material alloys are continuouslygaining importance. Most processed metallic constructionmaterials for lightweight applications are based on aluminum
* Corresponding author. Tel.: +49 511 762 2428; fax: +49 511 762 3007.E-mail address: [email protected] (A. Santangelo)
http://dx.doi.org/10.1016/j.acme.2016.04.0121644-9665/# 2016 Politechnika Wrocławska. Published by Elsevier Urb
and there is an increasing trend of substituting bulk formed steelproducts with non-ferrous metal parts [1]. Aluminum alloys arecharacterized by a low density accompanied by a highmechanical strength compared to Fe-based alloys. Cold [2],warm [3] and hot forging [4] are possible with their respectiveadvantages and disadvantages. In order to reduce long produc-tion times due to heat treatment and enhance shape accuracy,lower practicable forging temperatures are preferred in somecases. Here, the formability is reduced and the workpiece canreact sensitively to changing process conditions resulting in ahigher cracking risk. Generally, an early detection of failures isaimed at in production. In fast and automated forging processescracks cannot always be recognized immediately.
.
an & Partner Sp. z o.o. All rights reserved.
a r c h i v e s o f c i v i l a n d m e c h a n i c a l e n g i n e e r i n g 1 6 ( 2 0 1 6 ) 7 2 4 – 7 3 3 725
Another important aspect with regard to forging qualityis friction. Adequate lubrication conditions between die andpart play a crucial role with respect to the tool life andquality of finished parts. Insufficient lubrication can lead toexcessive tool wear and improper strain distribution whichin turn can result in defective parts or insufficient diefilling.
Most commonly, the regularity of the forging process isinferred on-line from the force and displacement measure-ment of the ram. Nevertheless, process deviations are notalways reflected by these signals.
A known non-destructive technique which has the potentialto overcome the shortcomings of conventional measuringmethods is the acoustic emission technique. Its capability todetect cracking in metallic materials and changes in the frictionconditions between metals has been proven before [5,6].
1.2. General aspects of acoustic emission technique
The acoustic emission (AE) technique is a non-destructiveevaluation technique enabling the user to draw conclusionsin situ about the structural integrity of an object. Commonly, AEis defined as elastic waves which develop during the spontane-ous release of energy in a solid body. According to this definition,it is an integral and passive inspection method with which anevent can be detected during its occurrence, and only then. Inview of their frequency range (50 kHz to several MHz), AE signalsare considered as ultrasonic waves. In a typical measurementsystem these waves are received from solid body surfaces andare converted into a voltage signal by highly sensitivepiezoelectric sensors. This signal passes a preamplifier, afrequency filter and an analog digital converter in order tofinally be recorded by a storage medium. Much effort hasalready been put into understanding the mechanisms ofacoustic emissions of static structures, but also into those oflight metal alloys under plastic deformation [7,8]. Deformation,or more precise, dislocation glide is a strong source of acousticemission. A further origin of AE is crack growth. Intensity andcharacteristics of the emitted waves depend on numerousmaterial and testing variables including strain rate, formingtemperature, grain size, solute content and stress state. Thedetection of crack growth is related to the ductility of a material.While one alloy can emit AE with high energy during cracking,other materials remain quiet which has been termed theductile-crack problem [9]. The AE amplitude is connected to thevelocity at which a crack propagates. That implies that sudden,fast propagating cracks will produce higher amplitudes than aslowly advancing crack tip over the same distance [10].Moreover, the type of crack plays an important role: the tensiletype is generally connected with a faster arrival time of peakamplitudes than the shear type [11].
The ability of monitoring friction conditions by means of AEwas shown for different material combinations in tribometertest rigs [12,13]. Commonly, these studies are performed understationary test conditions and in absence of macroscopicplastic deformation.
The property of an AE measuring system to detectstructural changes at their moment of occurrence makes ita promising potential tool for the detection of processdeviations during metal forming operations [14,15].
1.3. Acoustic emission in aluminum forging
Most research concerning AE during forming is done underidealized and highly controlled test conditions for compre-hensible reasons. By using standardized and simply shapedspecimens, conclusions can be drawn easily and reliably. Sincethe user is often confronted with unstable and more complexoperation conditions, the research outcomes cannot always betransferred to industrial cases. Great part of this research workis focused on the characterization of AE in dependence ofdeformation parameters and the material state of Al-alloys.The detection of process deviations in industrial forgingprocesses is often not the point of concern. The principalapplicability for the determination of defects within light alloyforging parts during forming processes has been provenbefore, also under idealized conditions but closer to conven-tional forging in respect of forming speed and temperature[16]. It was also used to determine the limit criterion due tocrack initiation in upsetting under superimposed pressure [17].Despite all efforts undertaken so far, the AE technique is stillnot sophisticated enough for industrial forging applications.The challenge in establishing a reliable use of the AE techniquein forging processes lies in their highly dynamic and transientcharacter in contrast to static structures with a constant basiclevel of AE. Moreover, the harsh conditions in a forgingenvironment and the multiple AE of tool and machine cancomplicate the analysis considerably. Another question is thegeneral ability to detect the cracking of a certain alloy. Theamount of AE energy emitted depends on material anddeformation and is not known ex ante.
In another study it was found that a correlation between AEand lubrication condition in hot forging of aluminum exists[18]. It remains unanswered if such a correlation holds true forother forging processes. On the one hand high energy emissiondue to deformation could overlay friction signals, on the otherhand surface condition and speed of the relative movementplay a role.
The aim of this study is to investigate AE with regard toprocess deviations, namely cracking and lubrication, in theforging of different aluminum alloys from a practical point ofview. For this purpose, upsetting and forging experimentswere carried out and the recorded signals were correlated tothe process deviations.
2. Material and methods
2.1. Experimental setup
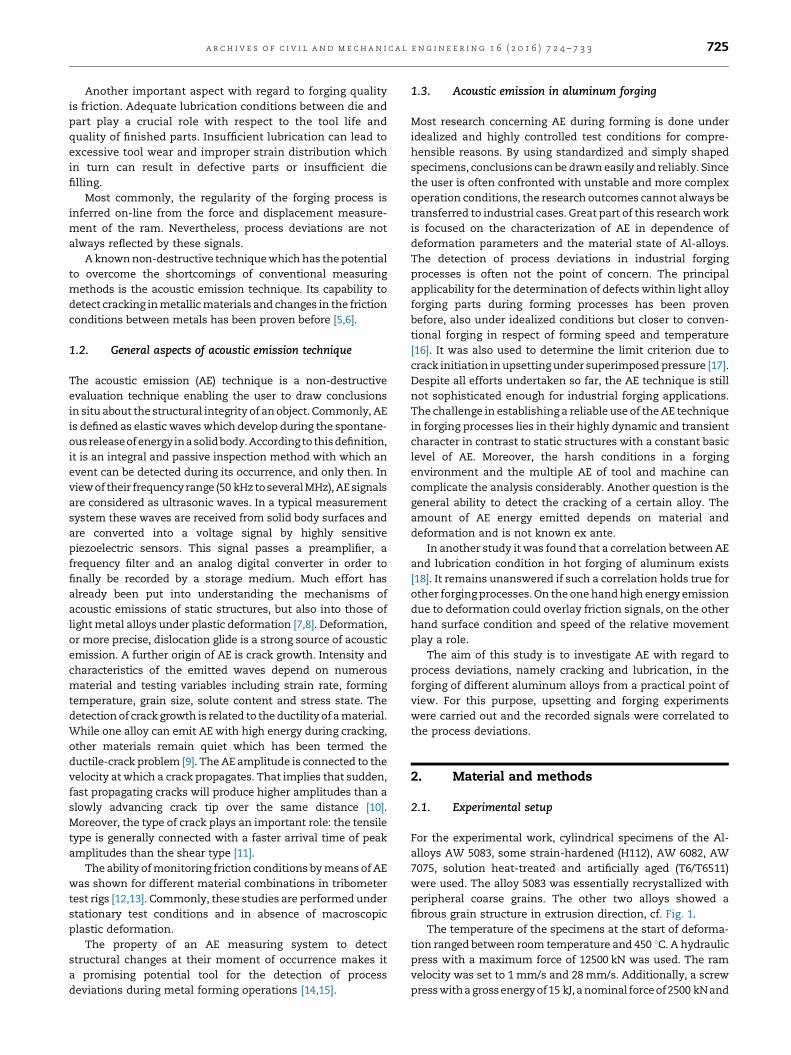
For the experimental work, cylindrical specimens of the Al-alloys AW 5083, some strain-hardened (H112), AW 6082, AW7075, solution heat-treated and artificially aged (T6/T6511)were used. The alloy 5083 was essentially recrystallized withperipheral coarse grains. The other two alloys showed afibrous grain structure in extrusion direction, cf. Fig. 1.
The temperature of the specimens at the start of deforma-tion ranged between room temperature and 450 8C. A hydraulicpress with a maximum force of 12500 kN was used. The ramvelocity was set to 1 mm/s and 28 mm/s. Additionally, a screwpress with a gross energy of 15 kJ, a nominal force of 2500 kN and
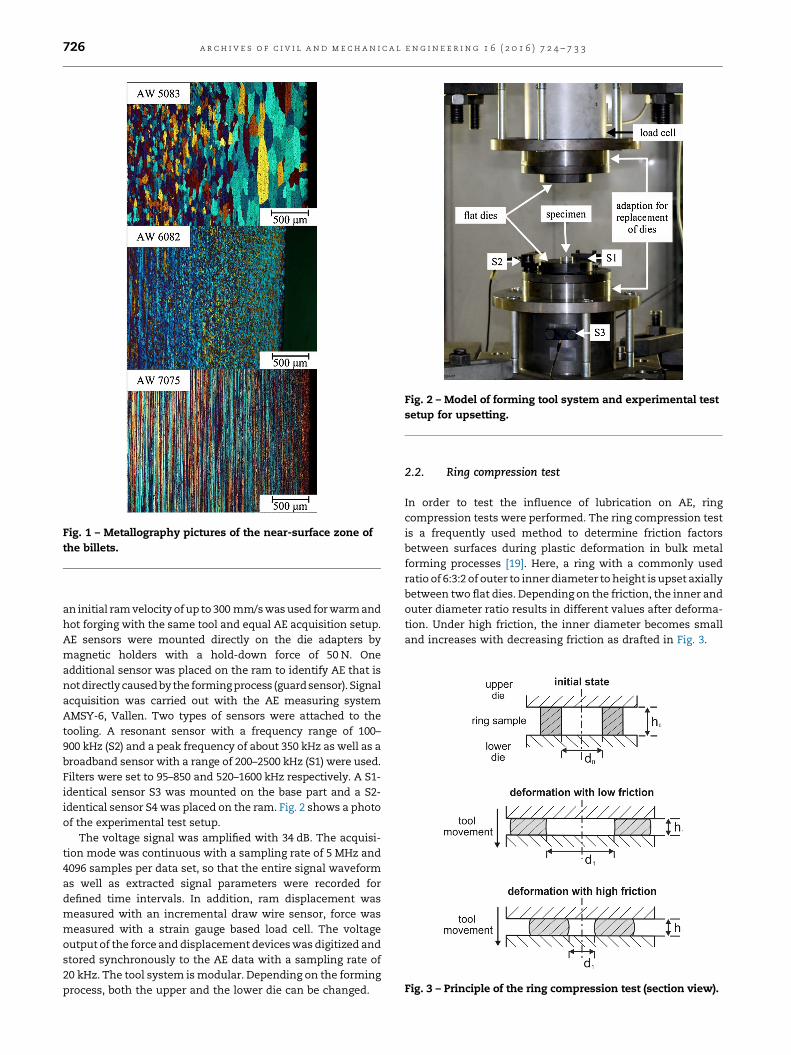
Fig. 1 – Metallography pictures of the near-surface zone ofthe billets.
Fig. 2 – Model of forming tool system and experimental testsetup for upsetting.
Fig. 3 – Principle of the ring compression test (section view).
a r c h i v e s o f c i v i l a n d m e c h a n i c a l e n g i n e e r i n g 1 6 ( 2 0 1 6 ) 7 2 4 – 7 3 3726
an initial ram velocity of up to 300 mm/s was used for warm andhot forging with the same tool and equal AE acquisition setup.AE sensors were mounted directly on the die adapters bymagnetic holders with a hold-down force of 50 N. Oneadditional sensor was placed on the ram to identify AE that isnot directly caused by the forming process (guard sensor). Signalacquisition was carried out with the AE measuring systemAMSY-6, Vallen. Two types of sensors were attached to thetooling. A resonant sensor with a frequency range of 100–900 kHz (S2) and a peak frequency of about 350 kHz as well as abroadband sensor with a range of 200–2500 kHz (S1) were used.Filters were set to 95–850 and 520–1600 kHz respectively. A S1-identical sensor S3 was mounted on the base part and a S2-identical sensor S4 was placed on the ram. Fig. 2 shows a photoof the experimental test setup.
The voltage signal was amplified with 34 dB. The acquisi-tion mode was continuous with a sampling rate of 5 MHz and4096 samples per data set, so that the entire signal waveformas well as extracted signal parameters were recorded fordefined time intervals. In addition, ram displacement wasmeasured with an incremental draw wire sensor, force wasmeasured with a strain gauge based load cell. The voltageoutput of the force and displacement devices was digitized andstored synchronously to the AE data with a sampling rate of20 kHz. The tool system is modular. Depending on the formingprocess, both the upper and the lower die can be changed.
2.2. Ring compression test
In order to test the influence of lubrication on AE, ringcompression tests were performed. The ring compression testis a frequently used method to determine friction factorsbetween surfaces during plastic deformation in bulk metalforming processes [19]. Here, a ring with a commonly usedratio of 6:3:2 of outer to inner diameter to height is upset axiallybetween two flat dies. Depending on the friction, the inner andouter diameter ratio results in different values after deforma-tion. Under high friction, the inner diameter becomes smalland increases with decreasing friction as drafted in Fig. 3.
a r c h i v e s o f c i v i l a n d m e c h a n i c a l e n g i n e e r i n g 1 6 ( 2 0 1 6 ) 7 2 4 – 7 3 3 727
The friction factor is determined from an analytically ornumerically developed graph indicating the respective frictionfactor for each inner diameter. The combination of compres-sive deformation and high surface-to-volume ratio of thespecimen renders this test ideal for analyzing lubricationconditions in conjunction with AE. For the ring compressiontests the alloy 6082 was chosen due to its low overall AEamplitude level during deformation. Deformation-related AEwould be regarded as noise in this case. The height reductionwas 60% and the ram velocity was set to 1 mm/s both, in drycondition and with the use of a mineral-oil-based lubricant.Die surfaces were polished prior to the tests.
2.3. Upsetting test
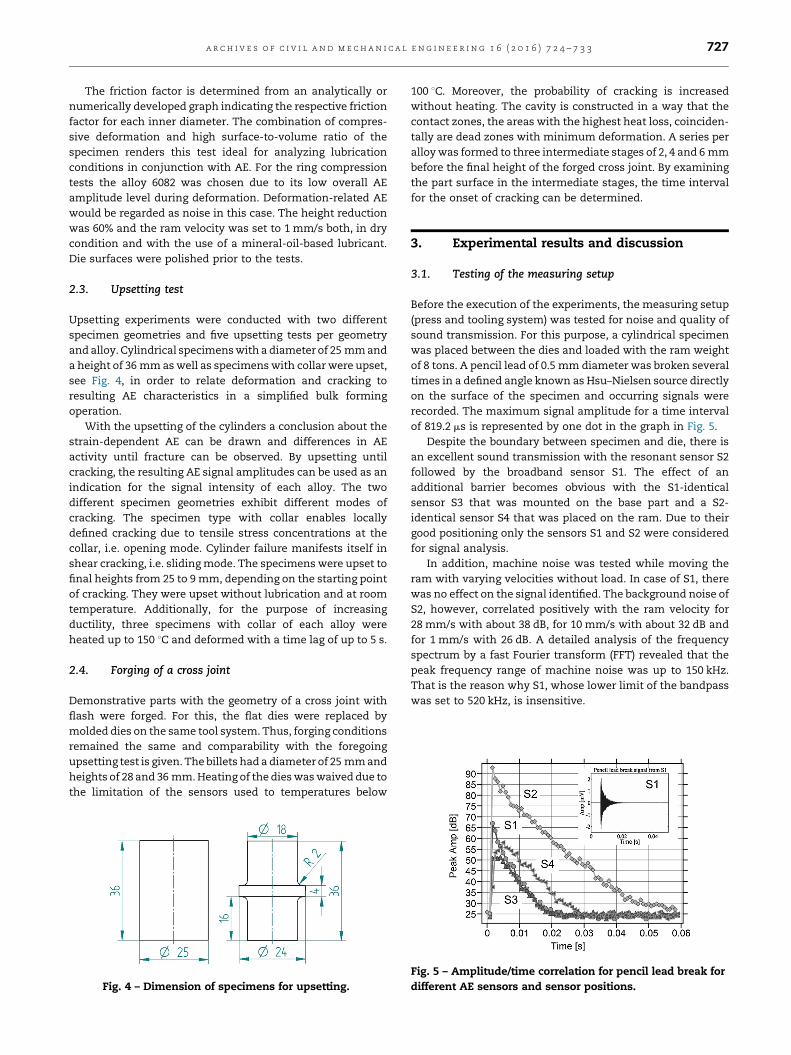
Upsetting experiments were conducted with two differentspecimen geometries and five upsetting tests per geometryand alloy. Cylindrical specimens with a diameter of 25 mm anda height of 36 mm as well as specimens with collar were upset,see Fig. 4, in order to relate deformation and cracking toresulting AE characteristics in a simplified bulk formingoperation.
With the upsetting of the cylinders a conclusion about thestrain-dependent AE can be drawn and differences in AEactivity until fracture can be observed. By upsetting untilcracking, the resulting AE signal amplitudes can be used as anindication for the signal intensity of each alloy. The twodifferent specimen geometries exhibit different modes ofcracking. The specimen type with collar enables locallydefined cracking due to tensile stress concentrations at thecollar, i.e. opening mode. Cylinder failure manifests itself inshear cracking, i.e. sliding mode. The specimens were upset tofinal heights from 25 to 9 mm, depending on the starting pointof cracking. They were upset without lubrication and at roomtemperature. Additionally, for the purpose of increasingductility, three specimens with collar of each alloy wereheated up to 150 8C and deformed with a time lag of up to 5 s.
2.4. Forging of a cross joint
Demonstrative parts with the geometry of a cross joint withflash were forged. For this, the flat dies were replaced bymolded dies on the same tool system. Thus, forging conditionsremained the same and comparability with the foregoingupsetting test is given. The billets had a diameter of 25 mm andheights of 28 and 36 mm. Heating of the dies was waived due tothe limitation of the sensors used to temperatures below
Fig. 4 – Dimension of specimens for upsetting.
100 8C. Moreover, the probability of cracking is increasedwithout heating. The cavity is constructed in a way that thecontact zones, the areas with the highest heat loss, coinciden-tally are dead zones with minimum deformation. A series peralloy was formed to three intermediate stages of 2, 4 and 6 mmbefore the final height of the forged cross joint. By examiningthe part surface in the intermediate stages, the time intervalfor the onset of cracking can be determined.
3. Experimental results and discussion
3.1. Testing of the measuring setup
Before the execution of the experiments, the measuring setup(press and tooling system) was tested for noise and quality ofsound transmission. For this purpose, a cylindrical specimenwas placed between the dies and loaded with the ram weightof 8 tons. A pencil lead of 0.5 mm diameter was broken severaltimes in a defined angle known as Hsu–Nielsen source directlyon the surface of the specimen and occurring signals wererecorded. The maximum signal amplitude for a time intervalof 819.2 ms is represented by one dot in the graph in Fig. 5.
Despite the boundary between specimen and die, there isan excellent sound transmission with the resonant sensor S2followed by the broadband sensor S1. The effect of anadditional barrier becomes obvious with the S1-identicalsensor S3 that was mounted on the base part and a S2-identical sensor S4 that was placed on the ram. Due to theirgood positioning only the sensors S1 and S2 were consideredfor signal analysis.
In addition, machine noise was tested while moving theram with varying velocities without load. In case of S1, therewas no effect on the signal identified. The background noise ofS2, however, correlated positively with the ram velocity for28 mm/s with about 38 dB, for 10 mm/s with about 32 dB andfor 1 mm/s with 26 dB. A detailed analysis of the frequencyspectrum by a fast Fourier transform (FFT) revealed that thepeak frequency range of machine noise was up to 150 kHz.That is the reason why S1, whose lower limit of the bandpasswas set to 520 kHz, is insensitive.
Fig. 5 – Amplitude/time correlation for pencil lead break fordifferent AE sensors and sensor positions.
a r c h i v e s o f c i v i l a n d m e c h a n i c a l e n g i n e e r i n g 1 6 ( 2 0 1 6 ) 7 2 4 – 7 3 3728
3.2. Ring compression test
The correspondent friction factors in the ring compressiontests were calculated as 0.35 with lubrication and 0.65 underdry conditions. A visual examination of the surface showeddifferences in roughness. In contrast to dry friction whichresulted in smooth surfaces, the lubricant caused a coarsesurface with concentric small cracks due the low formability ofthe aged alloy. Despite the considerable differences in frictionand surface quality there was only little effect on the acousticemission in terms of signal amplitudes. Only deformation witha ram velocity of 1 mm/s is considered, since in this casemachine noise is on a low level. While sensor S1 transducednearly no activity, voltage from S2 was low but increasedduring compression. The graph in Fig. 6 shows the mean of theroot mean square (rms) of five arithmetically averaged signalsper friction condition.
The curves are enveloped by their standard deviation. Therms is built for intervals of 607200 data points that equals a timeinterval of 0.12144 s. It can be stated that for the given surfacesand dimensions a change in lubrication condition is reflectedonly to a poor extent in the calculated rms. The envelopes ofstandard deviation overlap partially. Forming processes withhigh AE activity due to deformation would not allow anassessment of friction conditions in the investigated dimen-sional scale.
3.3. Upsetting of cylindrical specimens
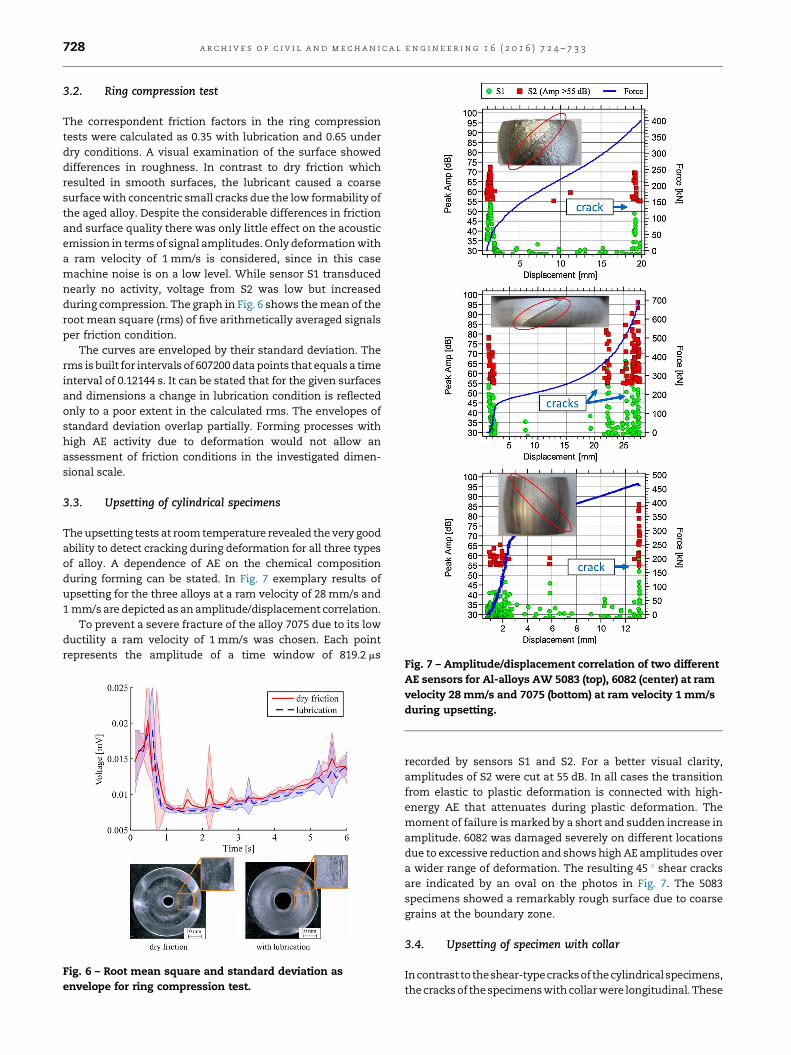
The upsetting tests at room temperature revealed the very goodability to detect cracking during deformation for all three typesof alloy. A dependence of AE on the chemical compositionduring forming can be stated. In Fig. 7 exemplary results ofupsetting for the three alloys at a ram velocity of 28 mm/s and1 mm/s are depicted as an amplitude/displacement correlation.
To prevent a severe fracture of the alloy 7075 due to its lowductility a ram velocity of 1 mm/s was chosen. Each pointrepresents the amplitude of a time window of 819.2 ms
Fig. 6 – Root mean square and standard deviation asenvelope for ring compression test.
Fig. 7 – Amplitude/displacement correlation of two differentAE sensors for Al-alloys AW 5083 (top), 6082 (center) at ramvelocity 28 mm/s and 7075 (bottom) at ram velocity 1 mm/sduring upsetting.
recorded by sensors S1 and S2. For a better visual clarity,amplitudes of S2 were cut at 55 dB. In all cases the transitionfrom elastic to plastic deformation is connected with high-energy AE that attenuates during plastic deformation. Themoment of failure is marked by a short and sudden increase inamplitude. 6082 was damaged severely on different locationsdue to excessive reduction and shows high AE amplitudes overa wider range of deformation. The resulting 45 8 shear cracksare indicated by an oval on the photos in Fig. 7. The 5083specimens showed a remarkably rough surface due to coarsegrains at the boundary zone.
3.4. Upsetting of specimen with collar
In contrast to the shear-type cracks of the cylindrical specimens,the cracks of the specimens with collar were longitudinal. These
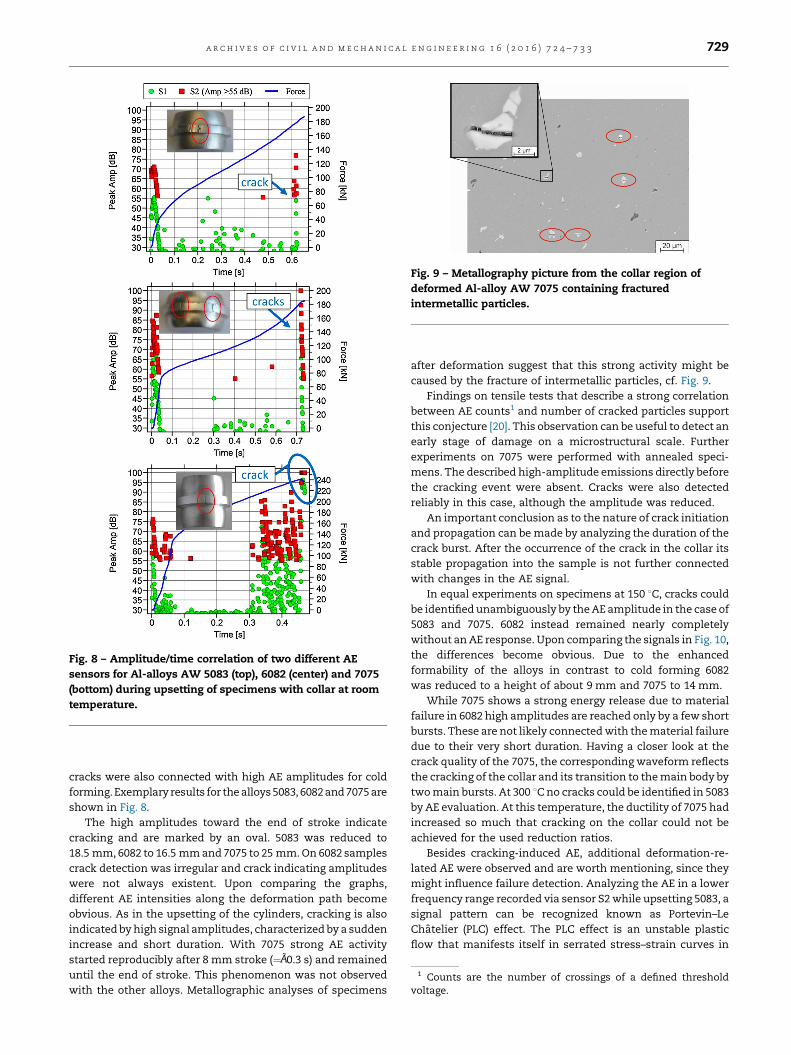
Fig. 8 – Amplitude/time correlation of two different AEsensors for Al-alloys AW 5083 (top), 6082 (center) and 7075(bottom) during upsetting of specimens with collar at roomtemperature.
Fig. 9 – Metallography picture from the collar region ofdeformed Al-alloy AW 7075 containing fracturedintermetallic particles.
1 Counts are the number of crossings of a defined thresholdvoltage.
a r c h i v e s o f c i v i l a n d m e c h a n i c a l e n g i n e e r i n g 1 6 ( 2 0 1 6 ) 7 2 4 – 7 3 3 729
cracks were also connected with high AE amplitudes for coldforming. Exemplary results for the alloys 5083, 6082 and 7075 areshown in Fig. 8.
The high amplitudes toward the end of stroke indicatecracking and are marked by an oval. 5083 was reduced to18.5 mm, 6082 to 16.5 mm and 7075 to 25 mm. On 6082 samplescrack detection was irregular and crack indicating amplitudeswere not always existent. Upon comparing the graphs,different AE intensities along the deformation path becomeobvious. As in the upsetting of the cylinders, cracking is alsoindicated by high signal amplitudes, characterized by a suddenincrease and short duration. With 7075 strong AE activitystarted reproducibly after 8 mm stroke (¼Ã0.3 s) and remaineduntil the end of stroke. This phenomenon was not observedwith the other alloys. Metallographic analyses of specimens
after deformation suggest that this strong activity might becaused by the fracture of intermetallic particles, cf. Fig. 9.
Findings on tensile tests that describe a strong correlationbetween AE counts1 and number of cracked particles supportthis conjecture [20]. This observation can be useful to detect anearly stage of damage on a microstructural scale. Furtherexperiments on 7075 were performed with annealed speci-mens. The described high-amplitude emissions directly beforethe cracking event were absent. Cracks were also detectedreliably in this case, although the amplitude was reduced.
An important conclusion as to the nature of crack initiationand propagation can be made by analyzing the duration of thecrack burst. After the occurrence of the crack in the collar itsstable propagation into the sample is not further connectedwith changes in the AE signal.
In equal experiments on specimens at 150 8C, cracks couldbe identified unambiguously by the AE amplitude in the case of5083 and 7075. 6082 instead remained nearly completelywithout an AE response. Upon comparing the signals in Fig. 10,the differences become obvious. Due to the enhancedformability of the alloys in contrast to cold forming 6082was reduced to a height of about 9 mm and 7075 to 14 mm.
While 7075 shows a strong energy release due to materialfailure in 6082 high amplitudes are reached only by a few shortbursts. These are not likely connected with the material failuredue to their very short duration. Having a closer look at thecrack quality of the 7075, the corresponding waveform reflectsthe cracking of the collar and its transition to the main body bytwo main bursts. At 300 8C no cracks could be identified in 5083by AE evaluation. At this temperature, the ductility of 7075 hadincreased so much that cracking on the collar could not beachieved for the used reduction ratios.
Besides cracking-induced AE, additional deformation-re-lated AE were observed and are worth mentioning, since theymight influence failure detection. Analyzing the AE in a lowerfrequency range recorded via sensor S2 while upsetting 5083, asignal pattern can be recognized known as Portevin–LeChâtelier (PLC) effect. The PLC effect is an unstable plasticflow that manifests itself in serrated stress–strain curves in
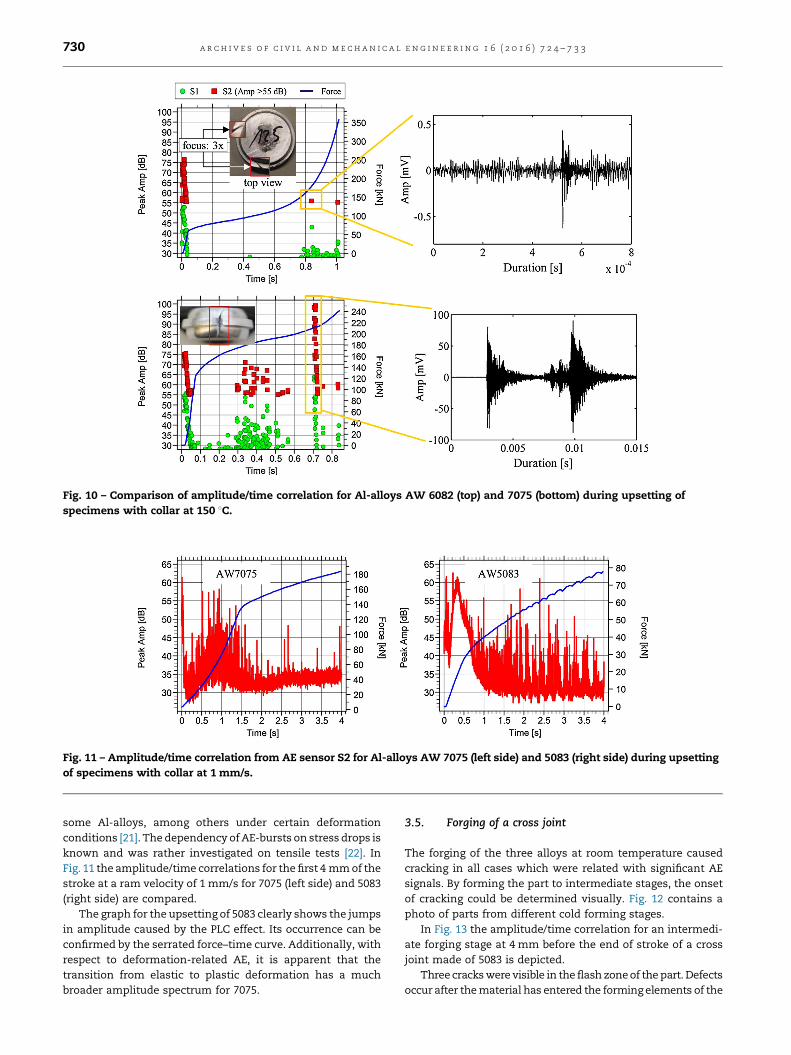
Fig. 10 – Comparison of amplitude/time correlation for Al-alloys AW 6082 (top) and 7075 (bottom) during upsetting ofspecimens with collar at 150 8C.
Fig. 11 – Amplitude/time correlation from AE sensor S2 for Al-alloys AW 7075 (left side) and 5083 (right side) during upsettingof specimens with collar at 1 mm/s.
a r c h i v e s o f c i v i l a n d m e c h a n i c a l e n g i n e e r i n g 1 6 ( 2 0 1 6 ) 7 2 4 – 7 3 3730
some Al-alloys, among others under certain deformationconditions [21]. The dependency of AE-bursts on stress drops isknown and was rather investigated on tensile tests [22]. InFig. 11 the amplitude/time correlations for the first 4 mm of thestroke at a ram velocity of 1 mm/s for 7075 (left side) and 5083(right side) are compared.
The graph for the upsetting of 5083 clearly shows the jumpsin amplitude caused by the PLC effect. Its occurrence can beconfirmed by the serrated force–time curve. Additionally, withrespect to deformation-related AE, it is apparent that thetransition from elastic to plastic deformation has a muchbroader amplitude spectrum for 7075.
3.5. Forging of a cross joint
The forging of the three alloys at room temperature causedcracking in all cases which were related with significant AEsignals. By forming the part to intermediate stages, the onsetof cracking could be determined visually. Fig. 12 contains aphoto of parts from different cold forming stages.
In Fig. 13 the amplitude/time correlation for an intermedi-ate forging stage at 4 mm before the end of stroke of a crossjoint made of 5083 is depicted.
Three cracks were visible in the flash zone of the part. Defectsoccur after the material has entered the forming elements of the
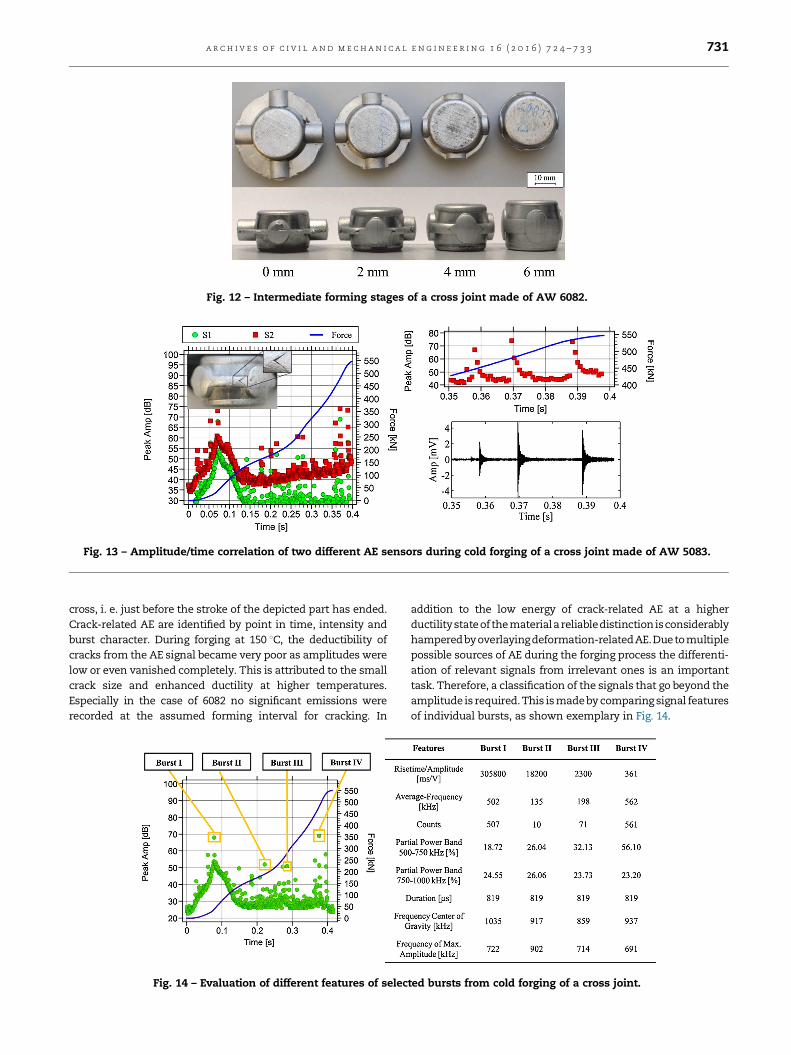
Fig. 12 – Intermediate forming stages of a cross joint made of AW 6082.
Fig. 13 – Amplitude/time correlation of two different AE sensors during cold forging of a cross joint made of AW 5083.
a r c h i v e s o f c i v i l a n d m e c h a n i c a l e n g i n e e r i n g 1 6 ( 2 0 1 6 ) 7 2 4 – 7 3 3 731
cross, i. e. just before the stroke of the depicted part has ended.Crack-related AE are identified by point in time, intensity andburst character. During forging at 150 8C, the deductibility ofcracks from the AE signal became very poor as amplitudes werelow or even vanished completely. This is attributed to the smallcrack size and enhanced ductility at higher temperatures.Especially in the case of 6082 no significant emissions wererecorded at the assumed forming interval for cracking. In
Fig. 14 – Evaluation of different features of selec
addition to the low energy of crack-related AE at a higherductility state of the material a reliabledistinction isconsiderablyhampered by overlaying deformation-related AE.Due to multiplepossible sources of AE during the forging process the differenti-ation of relevant signals from irrelevant ones is an importanttask. Therefore, a classification of the signals that go beyond theamplitude is required. This is made by comparing signal featuresof individual bursts, as shown exemplary in Fig. 14.
ted bursts from cold forging of a cross joint.
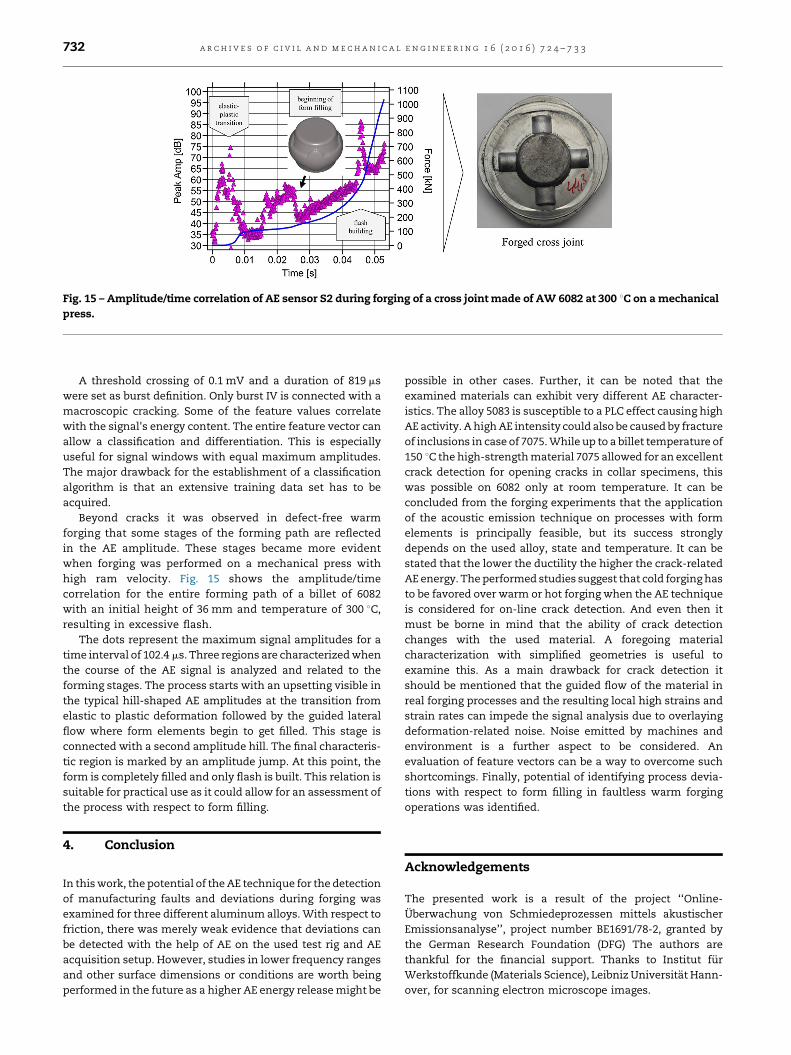
Fig. 15 – Amplitude/time correlation of AE sensor S2 during forging of a cross joint made of AW 6082 at 300 8C on a mechanicalpress.
a r c h i v e s o f c i v i l a n d m e c h a n i c a l e n g i n e e r i n g 1 6 ( 2 0 1 6 ) 7 2 4 – 7 3 3732
A threshold crossing of 0.1 mV and a duration of 819 mswere set as burst definition. Only burst IV is connected with amacroscopic cracking. Some of the feature values correlatewith the signal's energy content. The entire feature vector canallow a classification and differentiation. This is especiallyuseful for signal windows with equal maximum amplitudes.The major drawback for the establishment of a classificationalgorithm is that an extensive training data set has to beacquired.
Beyond cracks it was observed in defect-free warmforging that some stages of the forming path are reflectedin the AE amplitude. These stages became more evidentwhen forging was performed on a mechanical press withhigh ram velocity. Fig. 15 shows the amplitude/timecorrelation for the entire forming path of a billet of 6082with an initial height of 36 mm and temperature of 300 8C,resulting in excessive flash.
The dots represent the maximum signal amplitudes for atime interval of 102.4 ms. Three regions are characterized whenthe course of the AE signal is analyzed and related to theforming stages. The process starts with an upsetting visible inthe typical hill-shaped AE amplitudes at the transition fromelastic to plastic deformation followed by the guided lateralflow where form elements begin to get filled. This stage isconnected with a second amplitude hill. The final characteris-tic region is marked by an amplitude jump. At this point, theform is completely filled and only flash is built. This relation issuitable for practical use as it could allow for an assessment ofthe process with respect to form filling.
4. Conclusion
In this work, the potential of the AE technique for the detectionof manufacturing faults and deviations during forging wasexamined for three different aluminum alloys. With respect tofriction, there was merely weak evidence that deviations canbe detected with the help of AE on the used test rig and AEacquisition setup. However, studies in lower frequency rangesand other surface dimensions or conditions are worth beingperformed in the future as a higher AE energy release might be
possible in other cases. Further, it can be noted that theexamined materials can exhibit very different AE character-istics. The alloy 5083 is susceptible to a PLC effect causing highAE activity. A high AE intensity could also be caused by fractureof inclusions in case of 7075. While up to a billet temperature of150 8C the high-strength material 7075 allowed for an excellentcrack detection for opening cracks in collar specimens, thiswas possible on 6082 only at room temperature. It can beconcluded from the forging experiments that the applicationof the acoustic emission technique on processes with formelements is principally feasible, but its success stronglydepends on the used alloy, state and temperature. It can bestated that the lower the ductility the higher the crack-relatedAE energy. The performed studies suggest that cold forging hasto be favored over warm or hot forging when the AE techniqueis considered for on-line crack detection. And even then itmust be borne in mind that the ability of crack detectionchanges with the used material. A foregoing materialcharacterization with simplified geometries is useful toexamine this. As a main drawback for crack detection itshould be mentioned that the guided flow of the material inreal forging processes and the resulting local high strains andstrain rates can impede the signal analysis due to overlayingdeformation-related noise. Noise emitted by machines andenvironment is a further aspect to be considered. Anevaluation of feature vectors can be a way to overcome suchshortcomings. Finally, potential of identifying process devia-tions with respect to form filling in faultless warm forgingoperations was identified.
Acknowledgements
The presented work is a result of the project ‘‘Online-Überwachung von Schmiedeprozessen mittels akustischerEmissionsanalyse’’, project number BE1691/78-2, granted bythe German Research Foundation (DFG) The authors arethankful for the financial support. Thanks to Institut fürWerkstoffkunde (Materials Science), Leibniz Universität Hann-over, for scanning electron microscope images.
a r c h i v e s o f c i v i l a n d m e c h a n i c a l e n g i n e e r i n g 1 6 ( 2 0 1 6 ) 7 2 4 – 7 3 3 733
r e f e r e n c e s
[1] B.-A. Behrens, R. Nickel, S. Müller, Flashless precision forgingof a two-cylinder-crankshaft, Production Engineering 3 (4–5)(2009) 381–389. http://dx.doi.org/10.1007/s11740-009-0185-x.
[2] A. Forcellese, F. Gabrielli, Warm forging of aluminium alloys:a new approach for time compression of the forgingsequence, International Journal of Machine Tools andManufacture 40 (9) (2000) 1285–1297. http://dx.doi.org/10.1016/S0890-6955(99)00127-3.
[3] H. Yoshimura, Examples of precision forging by enclosed-dieforging, in: 10th International Cold Forging Congress 2000,VDI Berichte, vol. 1555, VDI Verlag, Düsseldorf, 2000, pp. 151–161.
[4] M. Kleiner, M. Geiger, A. Klaus, Manufacturing of lightweightcomponents by metal forming, CIRP Annals – ManufacturingTechnology 52 (2) (2003) 521–542. http://dx.doi.org/10.1016/S0007-8506(07)60202-9.
[5] K. Ono, Current understanding of mechanisms of acousticemission, The Journal of Strain Analysis for EngineeringDesign 40 (1) (2005) 1–15. http://dx.doi.org/10.1243/030932405X7674.
[6] V.A. Baranov, Acoustic Emission in Friction, Tribology andInterface Engineering Series, 53, Elsevier, Amsterdam, 2006.
[7] C.R. Heiple, S.H. Carpenter, Acoustic emission produced bydeformation of metals and alloys. Pt. 1. A review, Journal ofAcoustic Emission 6 (3) (1987) 177–204.
[8] C. Scruby, H. Wadley, J.E. Sinclair, The origin of acousticemission during deformation of aluminium and analuminium-magnesium alloy, Philosophical Magazine A 44(2) (1981) 249–274. http://dx.doi.org/10.1080/01418618108239532.
[9] H.N. Wadley, C.B. Scruby, J.H. Speake, Acoustic emission forphysical examination of metals, International MetalsReviews 25 (1) (1980) 41–64.
[10] C. Hellier, Acoustic emission testing, in: Handbook ofNondestructive Evaluation, McGraw-Hill, New York, 2001(chapter 10).
[11] D.G. Aggelis, E.Z. Kordatos, T.E. Matikas, Monitoring of metalfatigue damage using acoustic emission and thermography,Journal of Acoustic Emission 29 (2011) 113–122.
[12] H.S. Benabdallah, D.A. Aguilar, Acoustic emission and itsrelationship with friction and wear for sliding contact,Tribology Transactions 51 (6) (2008) 738–747. http://dx.doi.org/10.1080/10402000802044324.
[13] C.L. Jiaa, D.A. Dornfeld, Experimental studies of slidingfriction and wear via acoustic emission signal analysis,Wear 139 (2) (1990) 403–424.
[14] B.-A. Behrens, A. Santangelo, C. Buse, Acoustic emissiontechnique for online monitoring during cold forging of steelcomponents: a promising approach for online crack detectionin metal forming processes, Production Engineering 7 (4)(2013) 423–432. http://dx.doi.org/10.1007/s11740-013-0452-8.
[15] B.-A. Behrens, I. El-Galy, T. Huinink, C. Buse, OnlineMonitoring of Deep Drawing Process by Application ofAcoustic Emission, in: G. Hirt (Ed.), 10th InternationalConference on Technology of Plasticity, ICTP 2011, Steelresearch international Special edition, Verl. StahleisenGmbH, Düsseldorf, (2011) 385–389.
[16] B.-A. Behrens, T. Hagen, J. Knigge, I. Elgaly, T. Hadifi, A.Bouguecha, New trends in forging technologies, AIPConference Proceedings 1353 (1) (2011) 380–385. http://dx.doi.org/10.1063/1.3589545.
[17] B.-A. Behrens, T. Hagen, A. Klassen, J. Knigge, J. Mielke, I.Pfeiffer, Forging of aluminium components under asuperimposed hydrostatic pressure to induce local strainhardening, Advanced Material Research 137 (2010) 191–217.http://dx.doi.org/10.4028/www.scientific.net/AMR.137.191.
[18] C.K. Mukhopadhyay, S. Venugopal, T. Jayakumar, S.L.Mannan, B. Raj, B. Chatterji, R. Srinivasan, V.Gopalakrishnan, G. Madhusudan, R.S. Tripathi, Acousticemission (AE) monitoring of open die and closed die forgingprocesses of Al alloy, Materials and Manufacturing Processes22 (7) (2007) 887–892. http://dx.doi.org/10.1080/10426910701448974.
[19] K.P. Rao, K. Sivaram, A review of ring-compression testingand applicability of the calibration curves, Journal ofMaterials Processing Technology 37 (1) (1993) 295–318.
[20] M. Lugo, J.B. Jordon, M.F. Horstemeyer, M.A. Tschopp, J.Harris, A.M. Gokhale, Quantification of damage evolution in a7075 aluminum alloy using an acoustic emission technique,Materials Science and Engineering A 528 (22–23) (2011) 6708–6714. http://dx.doi.org/10.1016/j.msea.2011.05.017.
[21] A. Yilmaz, The Portevin–Le Châtelier effect: a review ofexperimental findings, Science and Technology of AdvancedMaterials 12 (6) (2011) 63001 http://dx.doi.org/10.1088/1468-6996/12/6/063001.
[22] F. Chmelík, A. Ziegenbein, H. Neuhäuser, P. Lukáč,Investigating the Portevin–Le Châtelier effect by theacoustic emission and laser extensometry techniques,Materials Science and Engineering A 324 (1–2) (2002) 200–207. http://dx.doi.org/10.1016/S0921-5093(01)01312-0.