Embed Size (px)
Citation preview

© Copyright 2012 Hewlett-Packard Development Company, L.P. The information contained herein is subject to change without notice.
Frank Wang, WW Healthcare and Life Sciences
Healthcare Payer Medical Informatics and Analytics

2
THE FACES OF HEALTHCARE Anatomy of a medical transaction
Emotional… Complex… Fragmented… Paper-based
Source: Life Magazine

3
Healthcare Client Needs are Changing to Address Drivers
Cost Reduction
Consumer Engagement
Interoperability
Business Intelligence
Management
Data Management
• Pressure to reduce operating costs due to restrictions on Medial Loss Ratios• Health Exchange-enabled Individual market requires a low cost structure • Health plans will need to re-allocate capital to new product and growth initiatives• Claims processing system modernization becomes increasingly important
• Consumerism and Individual Markets are shifting the business model• Increased number of Medicare and Medicaid membership• Multi-channel customer engagement is needed• Cloud CRM
• Accountable Care Organizations will require new partnerships with providers • Greater alignment of incentives among pharma, health plans and health providers
requires collaboration • Global Network Infrastructure expansion to support growing business needs and
industry interconnectivity
• Health plans and their partners will need to manage significantly more health data • Dashboards and other insight tools can reduce operational costs• Social network analytics is emerging • Real Time Data/Knowledge in support of Strategic Decision Making
• ICD-10 is impacting critical applications and infrastructure • Individuals moving between plans increase demand for data security and integrity• Connectivity with individual end-point devices (tablets, smart phones) require increased
data security• New healthcare delivery models in support of evidence-based medicine and
personalize medicine yield data types unfamiliar to most payers

4
BUSINESS VALUE ANALYSIS OF INFORMATION MANAGEMENT IN HEALTHCARE
ULTIMATE BUSINESS GOAL Speed Innovation to Practice Improve Quality of CareImprove Operational Efficiencies
COST CONTAINMENT---------------------------
Cut Operating Expense
QUALITY OF CARE----------------------------
Minimizing Medical Errors
COMPLIANCE----------------------------
100% compliance (HIPAA, HITECH etc.)
PATIENT THROUGHPUT---------------
Increase: 10% per year
ULTIMATE BUSINESS GOAL
EXECUTIVE KPIs(Direction)
COST x Claim-------------
Decrease
ERROR RATE---------------
Errors: 0% in 5 years
In-patients per bed per year
----------------------------Increase
COST x Bill-------------
Decrease
CORE KPIs(Direction)
LENGTH OF STAY----------------------------
Decrease
BUSINESS INITIATIVES(Strategy/Priority Language)
Improve efficiency of Clinical decision making and
Emergency services
Improve quality of healthcare services while reducing costs
Manage information for efficiency and compliance
Improve diagnostic process efficiency and patient data
integration
OPERATING KPIs--------------------PROCESS/ FUNCTION
Reduce time frame of medical service delivery and emergencyPatient response.--------------Improve clinical decision support and information sharing among healthcare stakeholders
Reduce diagnostic imaging/ data complexity ------------------Improve access to diagnostic information across clinical department
SAMPLESOLUTION
Enable new care management and risk modeling applications------------------Improve access to patient information from disparate sources
Design, develop and deliver a web-based interface for
information sharing
Implement cost effective storage optimization and scalable data
protection
Construct a single data ware-house to enable leveraging of
information as a corporate asset
Implement cost effective PACS/RISS integration
Mitigate potential data loss without a cost increase--------------Optimize storage capacity while protecting ‘business critical’ data
ROA(Asset Utilization)---------------Increase

5
The journey to accountable care requires a Healthcare IT Transformation across the entire community of care
IntegratedHealthSystem
OptimizedHealthcareIT System
PhysicianOffice
Hospitalsand
Clinics
LabFacilities
LongTermCare
Facility
Government/Commercial
Payors
ImagingCenter
HomeHealth
OutpatientSurgeryCenter
Pharmacy/PBMs
Healthcare Transformation IT Requirements • Upgrade, automate and connect
healthcare IT systems across acute, ambulatory, clinic and home settings
• Deliver an integrated clinical and financial view of a patient on demand
• Deploy “collaborative” systems to enable “team” based community care
• Establish Business intelligence platforms for reporting, outcomes measurement and disease management
• Accelerate standardization and cost take out activities ahead of new system installs
6
The 8 Building Blocks of Successful Accountable HealthcarePa
y fo
r Rep
ortin
gPa
y fo
r Out
com
es
EHR/PMS/E-Prescribing 2. Automating and Integrating Fragmented Stakeholders
InformationExchange
(HIE)3. Sharing Clinical, Operations and Financial Information
Aggregation &Analytics 4. Aggregating Siloed Data and Gaining Insight
DecisionSupport 5. Transforming collected data into clinical knowledge
HealthcarePortals and
Medical Homes6. Making clinical information accessible and “team-based” care
possible
OutcomesMeasurement &
Reporting7. Establishing Core Measures and Reporting Outcomes
RiskSharing 8. Enabling Population Based Management and Risk Sharing Models
ConvergedMedical
Infrastructure1. Establishing Standardized and Optimized IT Platforms

7
Healthcare Payer Informatics and Analytics Solution Landscape
Unique Individual
- Member, Provider,
Agent, etc.
Claims
Fees
Lab
Member
Premium
Eligibility
EBM
Groupers
CM/WMProgram
EMR
Risk
Care Management / Medical ManagementProgram
EffectivenessOutcomes Analytics
Population Analysis
CM/DM/WM Analysis
Case Management
Outcomes
Member Engagement
HEDIS
Pay 4 Performance
Bundled PmtAnalytics
Shared Savings
Cost Trends
Market Analytics
Employer Engagement
Provider Engagement
ACO
HIE
HIX
Sales Forces Analytics
NCQA
many more…
Account Management
CMS
State Reporting
8
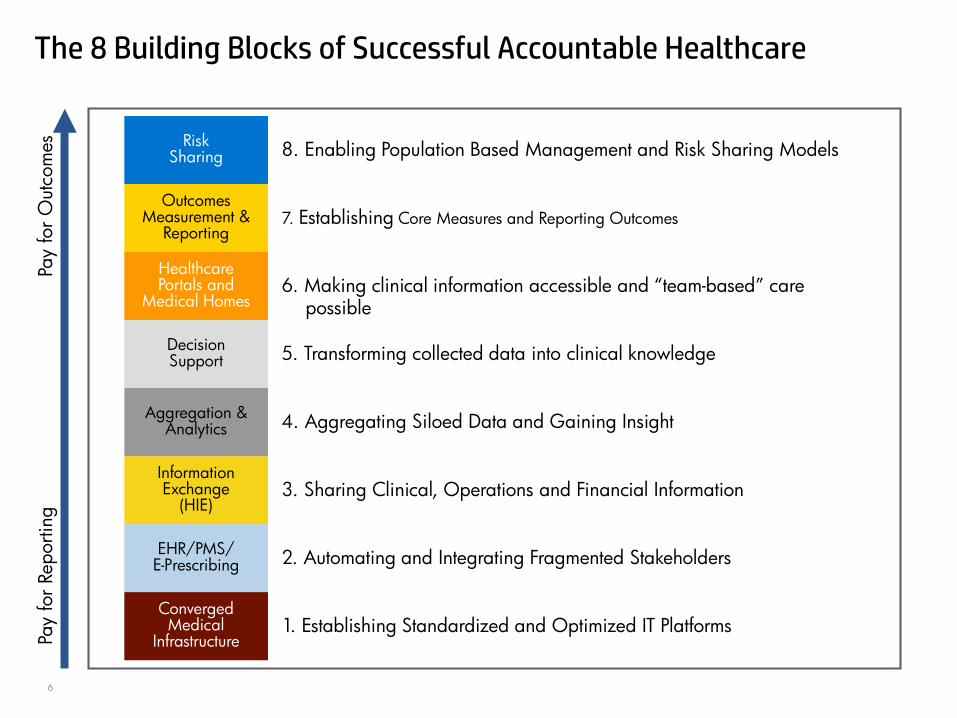
Cost and Revenue AnalyticsUnderstand your financial metrics and trend analysis
Multi-faceted
• Fraud, underwriting, MLR, clinical and coding guideline
Timely
• Reporting at the time of processing claims or claim submission
What-if Scenario
• Leverage “what-if” analysis to identify effective responses to cost drivers
9
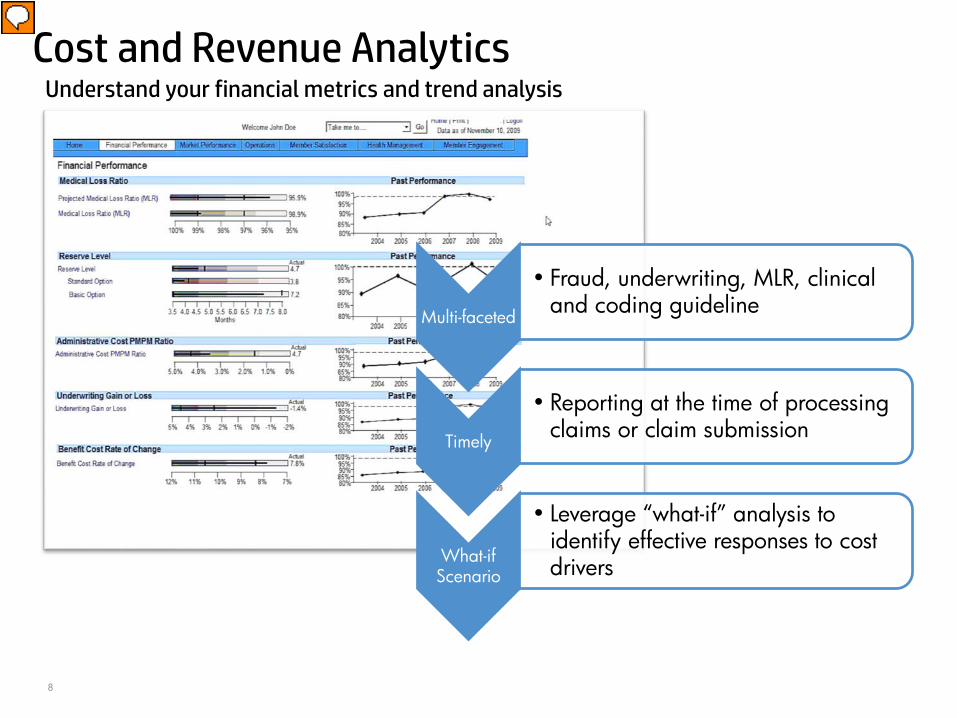
Supporting the BI needs of Healthcare Payers as they engage members in ongoing care management along the health continuum
Care Management Model
EvaluateMeasure outcomes and
adjust performanceIntervene
Targeted, evidence based methods to
impact the member’s condition
and health
Enroll Incentivize and engage members to participate
Identify & TargetRight member; right program
1
2
3
4

10
Care Management Portal
Member-centric
•Member-centric view tracking and reporting members’ health conditions, goals, recommended interventions and outcomes so that care managers can assess overall program effectiveness
Integration
•Integrates with claims data to identify members with existing or developing chronic diseases, calculates treatment plan cost savings, and track results
Easy to use•An easy to use care management portal

11
Care management to reduce hospital readmission ratesCare Management
– Fraud, underwriting, cost trending, general admin costs; clinical and coding guidelines
– Identify and analyze your cost drivers
– Reporting at the time of processing claims or claim submission
– What do you do next?
– Leverage ‘what-if’ analysis to identify effective responses to cost drivers
– Analyze fraud patterns pre-payment and streamline response; early intervention
Comprehensive
•From prevention to long-term chronic disease maintenance
Predictable
•Predictive modeling at patient and population levels to reduce hospital readmission rates
Multiple data sources
•Leverage many different data sources

12
Use Case: Stratification for Care Intervention
Mr. HP1 – 20 years, blood pressure 120 / 80
Mr. HP2 – 30 years, blood pressure 140 / 90, 15 lbs overweight, borderline high fasting blood sugar (115 mg/dl)
Mr. HP3 – 40 years, blood pressure 155 / 110, 50 lbs overweight, repeated high fasting blood sugar (140 mg/dl )
Is at risk of developing a chronic condition that can be minimized through better understanding and improved self care. He has a medium risk score. He is placed into a Disease Management program to optimize blood pressure control, achieve moderate weight reduction, and incorporate dietary modification.
Has a chronic condition that puts him at high risk for getting progressively worse. In this case, preventing or slowing progression is the goal. He is placed in a Case Management (CM) program.
The challenge is to correctly assess who is at risk, quantify the risk, then match the individual with the best care intervention.Is healthy and thus has a very low risk
score. Based on this, he is directed to the Wellness program.
13
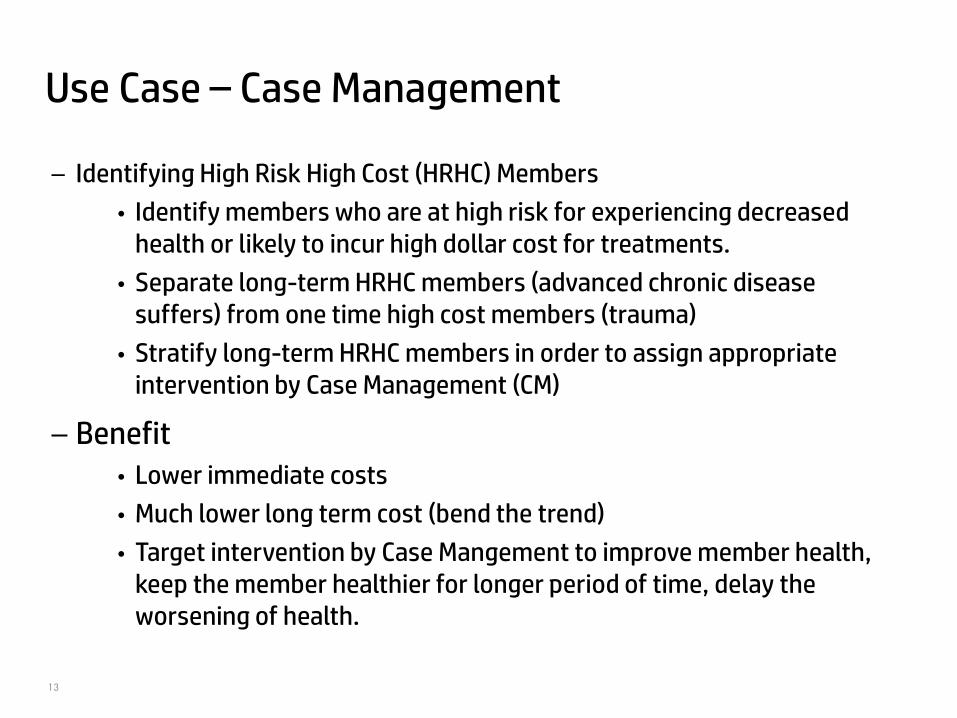
Use Case – Case Management
– Identifying High Risk High Cost (HRHC) Members
• Identify members who are at high risk for experiencing decreased health or likely to incur high dollar cost for treatments.
• Separate long-term HRHC members (advanced chronic disease suffers) from one time high cost members (trauma)
• Stratify long-term HRHC members in order to assign appropriate intervention by Case Management (CM)
– Benefit• Lower immediate costs
• Much lower long term cost (bend the trend)
• Target intervention by Case Mangement to improve member health, keep the member healthier for longer period of time, delay the worsening of health.

Insurance Performance – Case Management
MemberID
Firstname
LastName Age Total Cost Expected Amount
Year 2
1 De-ID De-ID 60 $10,565 $109,051.00
2 De-ID De-ID 61 $27,013 $78,934.00
3 De-ID De-ID 50 $28,805 $51,971.00
4 De-ID De-ID 59 $8,372 $66,154.00
5 De-ID De-ID 86 $17,674 $65,604.00
6 De-ID De-ID 61 $420,318 $14,575.00
7 De-ID De-ID 55 $29,925 $48,609.00
8 De-ID De-ID 54 $4,828 $55,133.00
9 De-ID De-ID 87 $5,161 $55,062.00
10 De-ID De-ID 5 $620,887 $5,570.00
One time event (Blue)
• Little impact for future•Goal: encourage healthy behavior
Continued progression (Yellow)
• Slow progression, moderate affect long term costs•Goal: Extend time the member feels healthy
Sudden change for the worse (Red)
• Rapid progression into disease, large affect on long-term costs
•Goal: Stop or moderate descent into disease

15
Utilization Management (UM)
Appropriateness
•Reviews prior authorization, eligibility, benefits limits and services limits
Necessity
•Provides concurrent and retrospective reviews based on evidence-based guidelines, clinical criteria (InterQual, Milliman, Solucient)
Efficiency
•Proactively manages therapeutic duplication, level of care and length of services
16
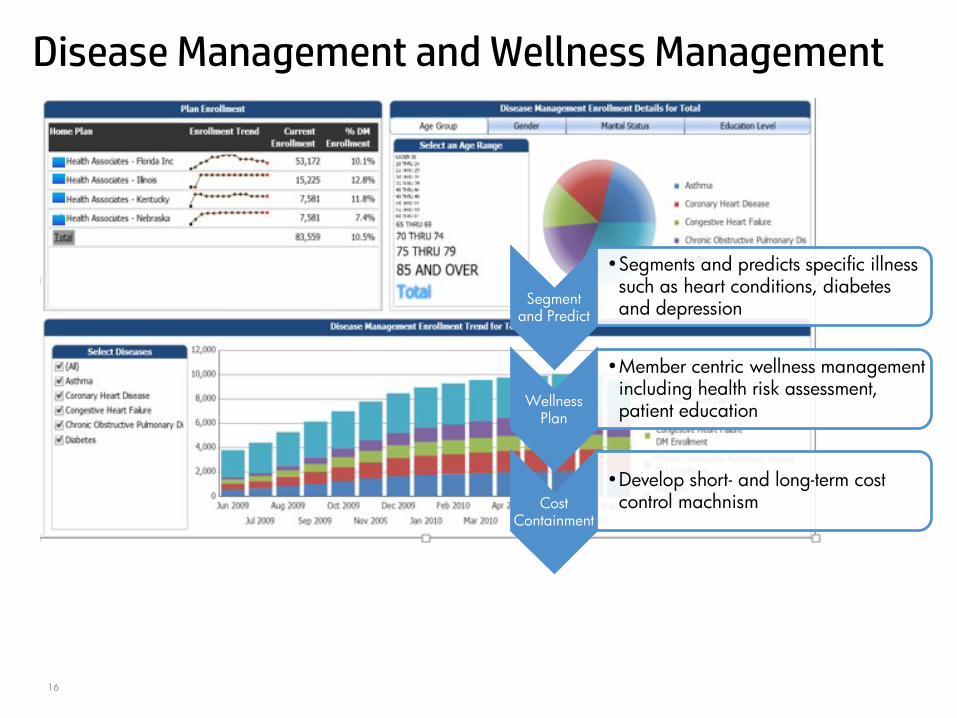
Disease Management and Wellness Management
Segment and Predict
•Segments and predicts specific illness such as heart conditions, diabetes and depression
Wellness Plan
•Member centric wellness management including health risk assessment, patient education
Cost Containment
•Develop short- and long-term cost control machnism
17
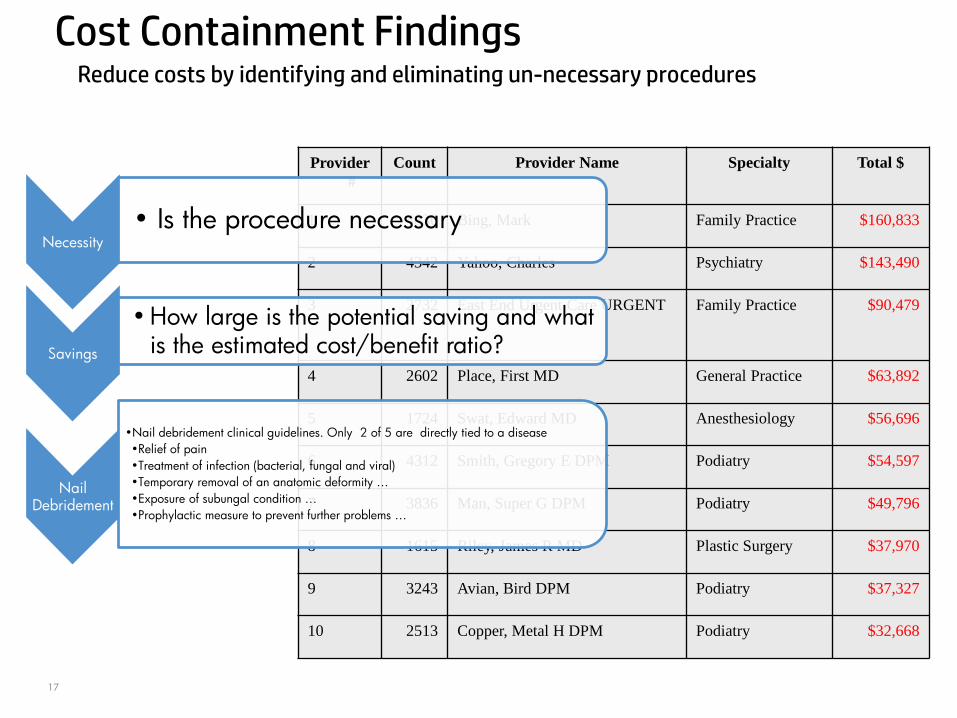
Cost Containment Findings
Provider #
Count Provider Name Specialty Total $
1 4836 Bing, Mark Family Practice $160,833
2 4342 Yahoo, Charles Psychiatry $143,490
3 2732 East End Urgent Care URGENT Family Practice $90,479
4 2602 Place, First MD General Practice $63,892
5 1724 Swat, Edward MD Anesthesiology $56,696
6 4312 Smith, Gregory E DPM Podiatry $54,597
7 3836 Man, Super G DPM Podiatry $49,796
8 1615 Riley, James R MD Plastic Surgery $37,970
9 3243 Avian, Bird DPM Podiatry $37,327
10 2513 Copper, Metal H DPM Podiatry $32,668
Reduce costs by identifying and eliminating un-necessary procedures
Necessity• Is the procedure necessary
Savings
•How large is the potential saving and what is the estimated cost/benefit ratio?
Nail Debridement
•Nail debridement clinical guidelines. Only 2 of 5 are directly tied to a disease •Relief of pain•Treatment of infection (bacterial, fungal and viral)•Temporary removal of an anatomic deformity …•Exposure of subungal condition …•Prophylactic measure to prevent further problems …

Fraud and Abuse DetectionAdditional investigation needed
Provider #
Count Provider Name Specialty Total $
1 4836 Bing, Mark Family Practice $160,833
2 4342 Yahoo, Charles Psychiatry $143,490
3 2732 East End Urgent Care URGENT
Family Practice $90,479
4 2602 Place, First MD General Practice $63,892
5 1724 Swat, Edward MD Anesthesiology $56,696
6 4312 Smith, Gregory E DPM
Podiatry $54,597
7 3836 Man, Super G DPM Podiatry $49,796
8 1615 Riley, James R MD Plastic Surgery $37,970
9 3243 Avian, Bird DPM Podiatry $37,327
10 2513 Copper, Metal H DPM Podiatry $32,668
Provider1
• Charges significantly higher than his peers
Provider 2
• Specialized in psychiatry, and is not generally associated with nail debridement
Provider 5
• Practiced in a specialty that is not generally associated with the nail debridement procedure
19
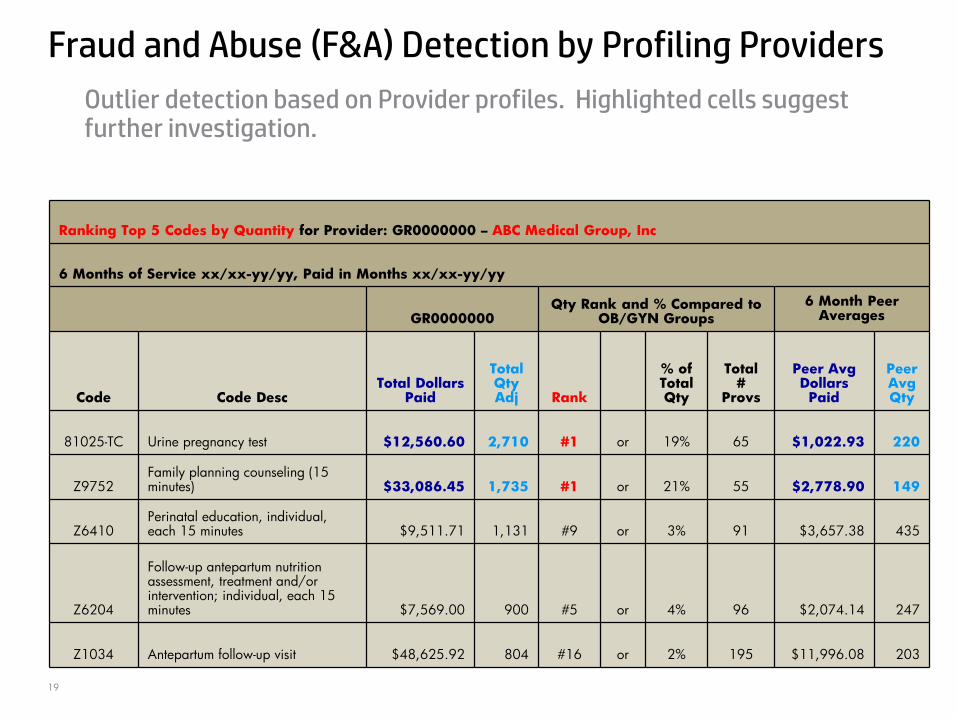
Fraud and Abuse (F&A) Detection by Profiling Providers
Ranking Top 5 Codes by Quantity for Provider: GR0000000 – ABC Medical Group, Inc
6 Months of Service xx/xx-yy/yy, Paid in Months xx/xx-yy/yy
GR0000000Qty Rank and % Compared to
OB/GYN Groups6 Month Peer
Averages
Code Code DescTotal Dollars
Paid
Total Qty Adj Rank
% of Total Qty
Total #
Provs
Peer Avg Dollars Paid
Peer Avg Qty
81025-TC Urine pregnancy test $12,560.60 2,710 #1 or 19% 65 $1,022.93 220
Z9752Family planning counseling (15 minutes) $33,086.45 1,735 #1 or 21% 55 $2,778.90 149
Z6410Perinatal education, individual, each 15 minutes $9,511.71 1,131 #9 or 3% 91 $3,657.38 435
Z6204
Follow-up antepartum nutrition assessment, treatment and/or intervention; individual, each 15 minutes $7,569.00 900 #5 or 4% 96 $2,074.14 247
Z1034 Antepartum follow-up visit $48,625.92 804 #16 or 2% 195 $11,996.08 203
Outlier detection based on Provider profiles. Highlighted cells suggest further investigation.

20
Health Information Exchange
Singular•Houses data from many clinical data sources in
a secure central structure
Enabling
•Enables key functions that reduces costs (reduced repeated testing, reduced risk of adverse events) and improves coordination of care
Payer
•Some HIE use cases have focus on sending ADTs (admissions, discharges, transfers) and discharge summaries to the health plans in lieu of manual processing

21
HIE DISTRIBUTION LAYER BUILT FOR GROWTH
Collaborate regionally and cross- border with other statesOffer clear guidance and flexible access to consumers, employers, payers pharmas

22
Timely
•Analyze compliance data ahead of time to highlight problems before submission
Streamlined
•Easier to locate, access and report; new reports can be added quickly to increase regulatory adherence
Actionable
•Provide further drilldowns to identify root-causes in order to take actions to rectify the issues
Compliance Streamlining
23
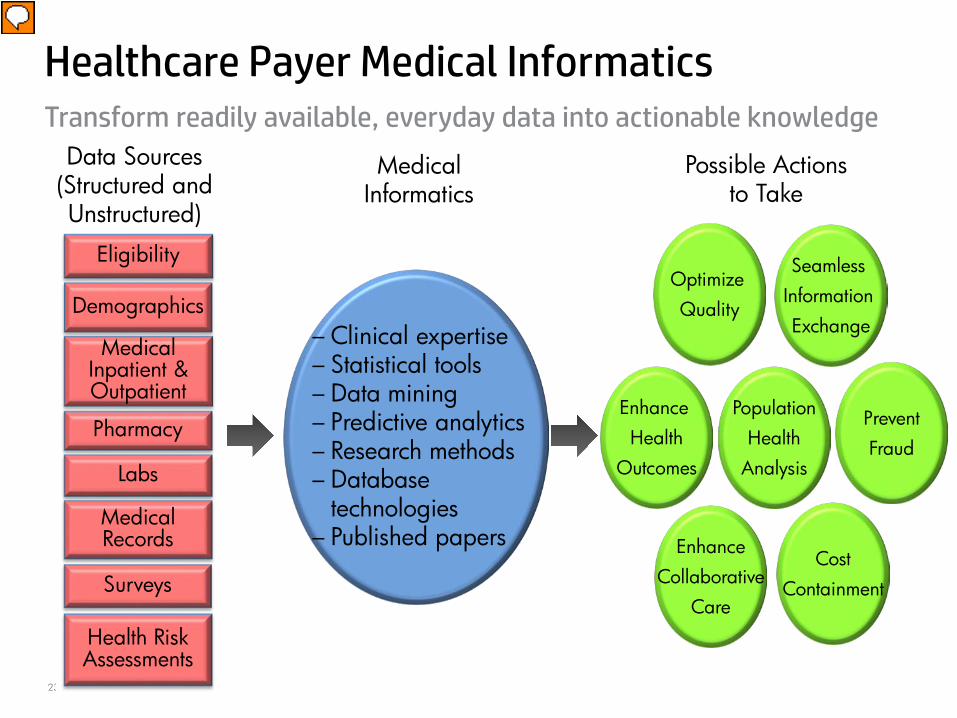
Transform readily available, everyday data into actionable knowledge
Healthcare Payer Medical Informatics
Eligibility
– Clinical expertise– Statistical tools– Data mining– Predictive analytics– Research methods– Database
technologies– Published papers
Optimize Quality
MedicalInpatient & Outpatient
Pharmacy
Data Sources (Structured and Unstructured)
Labs
Demographics
Medical Records
Surveys
Health Risk Assessments
Seamless Information Exchange
EnhanceCollaborative
Care
CostContainment
Enhance Health
Outcomes
PopulationHealth
Analysis
PreventFraud
Medical Informatics
Possible Actionsto Take

24
Predictive ModelingTurning Data into Knowledge – Example
We have 35,000 individuals in our population with diabetes.
The patients cost us $7,000 this year, a 15% increase over last year.
The national prevalence rate for diabetes is 8.3%; ours is 12%.
Hypertension is a major co-morbidity for diabetes.
Assign patient-level risk scores using a statistical model to predict which diabetics will be hospitalized next year.
Efficiently allocate care management resources to help reduce avoidable hospitalizations for at-risk patients.
Wisdom
–actionable info
5
Knowledge
–goals–targets
4
Information
–benchmarks–trends
3
Secondary Data
–averages–rates
2
Primary Data
–counts–sums
1
HP ConfidentialP

25
Turning Data into Knowledge – ExamplesWisdom
(actionable info)5Knowledge
(goals, targets)4Information
(benchmarks, trends)3Secondary Data
(averages, rates)2Primary Data
(counts, sums)1
A total of 10,000 Medicaid enrollees received mental health services in SFY 2010.
We have 35,000 individuals in our population with diabetes.
Medicare patients cared for by our physicians have an average cost of $8800 per year.
The procedure for internal fetal monitoring was billed multiple times for the same pregnancy.
Mental health services expenditures averaged $400 pmpm in 2009.
The patients cost us $7,000 this year, a 15% increase over last year.
The No. 1 DRG for our hospitalized Medicare patients is chronic heart failure.
This amount has increased by 2% in each of the past three years.
Payments for mental health services to provider X have risen 20% YOY whereas the Statewide average is 5%.
The national prevalence rate for diabetes is 8.3%; ours is 12%. Hypertension is a major co-morbidity for diabetes.
The number of heart failure patients compared to benchmark data is high.
This is not medically justified as the procedure is only performed during active labor to monitor fetal heart rate and uterine activity.
Applying data mining to large data sets, we can automatically detect more fraudulent providers and increase our ROI.
Assign patient-level risk scores using a statistical model to predict which diabetics will be hospitalized next year.
Medicare patients with Class 4 heart failure without a cardiac specialist cost over $50,000.
This procedure was controlled solely by diagnosis, which did not prevent misuse and coding errors.
We will proactively ward off complex sets of fraudulent claims using predictive analytics.
Efficiently allocate care management resources to help reduce avoidable hospitalizations for at-risk patients.
Early referral to a “Heart Failure Specialty Clinic” may lower the Medicare cost profile.
Update medical policy to reimburse fetal internal monitoring in an inpatient setting and establish limits for reimbursement consistency.
HP ConfidentialP
25
26
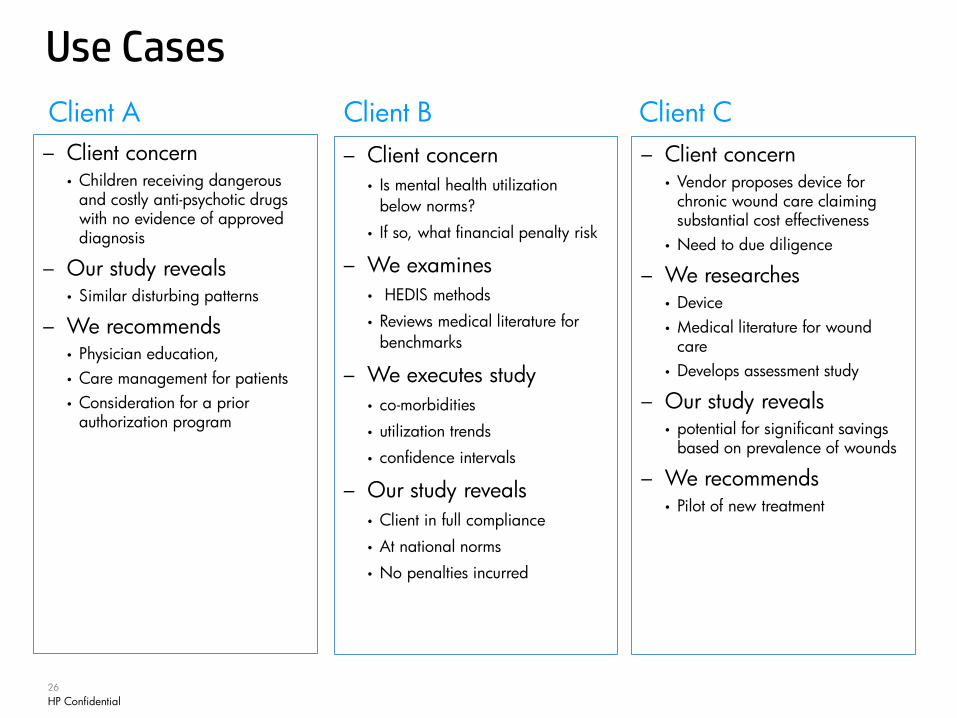
Client A Client B Client C
Use Cases
– Client concern• Vendor proposes device for
chronic wound care claiming substantial cost effectiveness
• Need to due diligence
– We researches• Device• Medical literature for wound
care• Develops assessment study
– Our study reveals• potential for significant savings
based on prevalence of wounds
– We recommends• Pilot of new treatment
– Client concern• Is mental health utilization
below norms?
• If so, what financial penalty risk
– We examines• HEDIS methods
• Reviews medical literature for benchmarks
– We executes study• co-morbidities
• utilization trends
• confidence intervals
– Our study reveals• Client in full compliance
• At national norms
• No penalties incurred
– Client concern• Children receiving dangerous
and costly anti-psychotic drugs with no evidence of approved diagnosis
– Our study reveals• Similar disturbing patterns
– We recommends• Physician education, • Care management for patients • Consideration for a prior
authorization program
HP ConfidentialP

27
Q&A