Embed Size (px)
Citation preview
WPj 3b6*TPOLICY RESEARCH WORKING PAPER 3 068
Poverty and Economic Growth in Egypt,1995-2000
Heba El-laithyMichael Lokshin
Arup Banerji
The World Bank Development Research Group kPoverty TeamJune 2003
Pub
lic D
iscl
osur
e A
utho
rized
Pub
lic D
iscl
osur
e A
utho
rized
Pub
lic D
iscl
osur
e A
utho
rized
Pub
lic D
iscl
osur
e A
utho
rized

I POLICY RESEARCH WORKING PAPER 3068
AbstractAfter a decade of slow economic growth Egypt's rate of age composition of poor households. The results show
growth recovered in the late 1990s, averaging more than that average household expenditures rose in the second
five percent a year. But the effect of this growth on half of the 1990s and the poverty rate fell from 20
poverty patterns has not been systematically examined percent to less than 17 percent. But, in addition to the
using consistent, comparable household datasets. In this ongoing divide in the urban-rural standard of living, a
paper El-Laithy, Lokshin, and Banerji use the rich set of new geographicaUlregional divide emerged in the late
unit-level data from the most recent Egyptian household 1990s. Poverty was found predominantly among less-
surveys (1995-96 and 1999-2000) to assess changes in educated individuals, particularly those working in
poverty and inequality between 1995 and 2000. Their agriculture and construction, and among seasonal and
analysis is based on household-specific poverty lines that occasional workers. These groups could suffer the most
account for the differences in regional prices, as well as from the slowing economic growth evident after 1999-
differences in the consumption preferences and size and 2000.
This paper-a product of the Poverty Team, Development Research Group-is part of a larger effort in the group to
understand the impact of economic growth on poverty. Copies of the paper are available free from the World Bank, 1818
H Street NW, Washington, DC 20433. Please contact Patricia Sader, room MC3-632, telephone 202-473-3902, fax 202-
522-1153, email address [email protected]. Policy Research Working Papers are also posted on the Web at http://
econ.worldbank.org. The authors may be contacted at [email protected], [email protected], or
[email protected]. June 2003. (28 pages)
The Policy Research Working Paper Series disseminates the findings of work in progress to encourage the exchange of ideas about
development issues. An objective of the series is to get the findings out quickly, even if the presentations are less than fully polished. The
papers carry the names of the authors and should be cited accordingly. The findings, interpretations, and conclusions expressed in this
paper are entirely those of the authors. They do not necessarily represent the view of the World Bank, its Executive Directors, or the
countries they represent.
Produced by Partnerships, Capacity Building, and Outreach
POVERTY AND ECONOMIC GROWTH IN EGYPT, 1995-2000
Heba El-laithy
Faculty of Economics,
University of Cairo, Cairo, Egypt
hflaithvyigega.net
Michael Lokshin*
Development Research Group,
The World Bank, 1818 H Street NW, Washington, D.C., 20433, USA
mlokshin(l)worldbank.org
Arup Banerji
Middle East and North Africa Region,
The World Bank, 1818 H Street NW, Washington, D.C., 20433, USA
abanerj i2worldbank.org
* Corresponding author. The findings, interpretations, and conclusions of this paper are those ofthe authors and should not be attributed to the World Bank, its Executive Directors, or thecountries they represent. We thank Martin Ravallion for extremely helpful suggestions andcomments on this paper.

1. Introduction
The late 1990s were, in economic terms, a watershed period for Egypt. After a decade of
slow economic growth, averaging less than 4 percent per year between 1987 and 1995,
overall growth rebounded to reach an average of 5.6 percent per year between 1996 and
2000. What was the effect of this growth on the economic dimensions of poverty (that is,
poverty in consumption and income terms) in this nation of 65 million people? This
paper answers that question, using a comprehensive set of household-level data from
1995-1996 and 1999/2000.
The economic background for the growth and poverty story in Egypt during the
late 1990s involves both a liberalizing and an inward-looking economy. Following a
significant liberalization of Egypt's economy beginning in 1991, Egypt experienced a
growth spurt. During this period, Egypt began a slow process of controlling inflation,
dismantling the historically overwhelming state domination of the economy, and opening
markets to greater competition. As a result, the private sector emerged as a more
important economic player in terms of output and jobs.
At the same time, the economy remained inward-looking, as high tariff rates and
an appreciating currency made the domestic market more attractive for Egyptian
businesses. Consequently, the growth spurt took place because of the service and
industry sectors, and a strong demand for domestic products - especially tourism,
construction, and import-substituting manufactured goods.
Our paper fills a critical gap in the literature on poverty in Egypt for three reasons.
By making use of a rich and yet rarely available dataset on household expenditures in
Egypt for two recent time periods - 1995/96 and 1999/2000 -- we offer the first analysis
of the evolution of poverty in Egypt in late 1990s. Second, we use the opportunity
provided by the large datasets to construct 'household-specific' poverty lines that
effectively address methodological problems that have cropped up in previous papers in
relation to economies of scale and regional differences. In doing so, we provide an
example of a methodology that can be useful for similar work in other countries. Third,
3
our findings, especially on the distinct change in the spatial distribution of poverty over
the course of 1990s, have critical implications for policymakers and advisors.
Limited formal and consistent empirical evidence exists on the levels and changes
in poverty and inequality in Egypt during the 1990s. To a large extent, this stems from
the fact that, up to now, no nationally representative unit-level data was available for
public use in Egypt. The first study to introduce a consistent. approach to poverty
measurement in Egypt in 1995/96 was El-Laithy and Osman (1997), but follow-up
studies did not use the same methodology to look at the evolution of poverty after 1996.
Datt, Jolliffe and Sharma (2001) constructed a poverty profile for 1997 using data from a
specially commissioned integrated household survey, but the sample size was relatively
small (2,500 households) and the survey, being a one-off exercise, did not permit
analysis of the evolution of poverty across time. The only recent paper that has used the
1999/2000 household data to examine poverty is El-Ehwany and El-Laithy (2001), but
the paper was a preliminary effort, and used non-weighted data.
While these studies give useful information on poverty in Egypt, the poverty lines
they use take into account neither regional and urban-rural differences in prices (with the
exception of Datt, Jolliffe and Sharma 2001), nor the differences in costs of living due to
economies of scale and demographic composition of the households. As a result, these
papers could well overestimate poverty in large households and in households with
children. At the same time, poverty rates in urban areas of Egypt could be
underestimated, because urban households are on average smaller than rural households,
and prices of most nonfood commodities and services and some food items are higher in
the four metropolitan cities of Egypt.
We use a methodology that takes these problems into account. Although we
follow the standard cost-of-basic-needs method to construct poverty lines, we introduce a
new approach to estimate region-specific household poverty lines'. The unit-level data in
the most recent Households Income, Expenditure and Consumption Survey (HIECS)
allows us to construct poverty lines for each household depending on its location, size,
age, and gender composition. Economies of scale are also taken into account.
'This new approach was developed in a course of multiple discussions with Martin Ravallion.
4
The results presented in this paper are critical for understanding Egypt's policy
options over the coming decade. While poverty declined for Egypt as a whole between
1995/96 and 1999/2000, there were significant differences in poverty alleviation and
household expenditure increases across different regions and different sectors of
employment. With a labor force growing at about 2.7 percent annually, over half a
million job-seekers are entering the Egyptian labor market every year. The economic
boom during the late 1990s clearly helped many in the labor force to improve their
economic welfare. However, with a rapid decline in the construction sector since 1999,
and a volatile tourism sector buffeted by the effects of regional security crises, the first
decade of the 21 st century will present policymakers with a challenge in terns of income
expansion and poverty reduction.
Policymakers also need better information on the dynamics and causes of poverty
because the government has had fewer resources available for social assistance program
in recent years. A better understanding of changes in poverty and inequality in Egypt
could facilitate both a more effective design of the social policies and greater efficiency
in social assistance programs.
This paper is organized as follows. The next section discusses the data and
methodology issues. Section 3 presents estimates of poverty and inequality in Egypt in
1999/2000. Section 4 describes the changes in poverty and inequality in Egypt between
1995 and 2000, and Section 5 paints a profile of the poor in Egypt. Section 6 presents the
results of a multivariate poverty profile analysis and poverty simulations. Section 7
concludes.
2. Data and definitions
Our poverty analysis is based on the 1995/96 and 1999/2000 rounds of the HIECS
conducted by the Central Agency for Public Mobilization and Statistics (CAPMAS), the
official statistical agency of Egypt.
The HIECS rounds were administered over 12 months, with 10 visits to each
household over a period of one month. The 1995/96 survey's data were collected from
October 1995 to September 1996. The 1995/96 HIECS includes 14,805 households, of
5
which 6,622 reside in urban and 8183 in rural areas. The sample frame of the 1995/96
survey is based on an. updated frame of the 1986 Population Census of 503 area sampling
units that include 276 units in urban and 227 in rural areas.
Data for the most recent survey were gathered from October 1999 to September
2000. The 1999/2000 sample comprises 47,949 households, of which 28,754 reside in
urban and 19,195 in rural areas. This is the largest survey of its kind conducted in Egypt.2
The 1999/2000 HIECS was based on the 1996 Population Censuses sample frame of 600
area sampling units distributed between urban and rural areas (360 and 240 units
respectively).
The surveys of 1995/96 and 1999/2000 are highly comparable in terms of
sampling procedure and data collection methodology. The samples of both surveys are
stratified multistage random samples. The sample designs of both surveys are nationally
representative and the size of these surveys is large enough to allow for inferences at the
regional and governorate levels, with the exception of Border govemorates where the
sample sizes are small.3
Definitions of Regions in Egypt
The regional aggregates used in this paper are for Metropolitan, Lower Egypt,
Upper Egypt and Border areas. Ninety-five percent of the population of Egypt lives in the
first three regions. The Metropolitan governorates essentially comprise the four major
cities of Cairo, Alexandria, Port-Said and Suez, all in northern Egypt. Lower Egypt
(essentially the region of the Nile delta) is also in the northern part of Egypt, and Upper
Egypt, perhaps counter-intuitively, is the area mostly south of Cairo, with governorates
largely following the meandering upper reaches of the Nile. The Border areas are the less
populated desert areas bordering the Red Sea, the Sinai, and the vast Marsa Matruh and
El Wadi El Gadid areas west of the Nile.4
In 1999/2000, the Metropolitan cities had about 18 percent of Egypt's total
population, Lower Egypt had 43 percent, mostly in urban governorates; and Upper Egypt,
2 Starting from 1957 the household budget surveys were conducted in Egypt in 1964/65, 1974/75, 1981/82and in 1990/91 (CAPMAS VARIOUS ISSUES).3 For more information on the sample issues see, e.g., CAPMAS, Household, Income, Expenditure andConsumption Survey Report, Volume one, 2001.4 Also see Table 2 for the specific governorates in each region.
6
had 38 percent, with more than two-thirds (27 percent of the Egyptian population)
residing in rural areas.
Welfare Indicator
We measure welfare in terms of an aggregate money metric indicator, defined as
the amount of money required, given a set of prices, to attain a particular level of utility.
This indicator allows us to rank households' welfare levels by comparing household
observable consumption. The consumption-based approach is particularly suited for
measuring poverty in developing countries, since it relies for poverty comparisons on the
notion of deprivation from certain commodities and resources (both food and nonfood)
deemed essential for attaining a minimum level of well-being within a given society
(Hentschel and Lanjouw 2000). Consumption is the preferred indicator of well-being also
because it incorporates the life-cycle hypothesis. Households might use savings and
credit to smooth fluctuations in income, and in that case, consumption would better
reflect their actual welfare. Finally, respondents in developing countries might be
reluctant to reveal information about their income, so consumption is usually measured
more precisely than income.
The information on the components of total consumption we use in this paper
draws upon responses from several sections of the survey. In the diary the respondents
report daily food expenditures for a period of one month. Information about their.
expenditures on nonfood items is collected in the main questionnaire for the previous.
three months, or the previous year, depending on the type of commodity. All data are
converted to an annual basis. Total household consumption is then measured as the sum
of food consumption (home produced and purchased on the market), total nonfood,
expenses, and actual or imputed rental values of housing. In poverty comparisons, the
value of household consumption for 1999/2000 was deflated to 1996 Egyptian pounds
(LE).
Poverty Lines
Our analysis foilows the cost-of-basic-needs (CBN) approach in order to construct
household- and region-specific poverty lines. According to CBN methodology, poverty
7
lines represent the level of per capita expenditures at which the members of a household
can be expected to meet their basic needs. The household-specific poverty line is
calculated as a sum of the food and nonfood poverty lines.
An initial step in defining the food poverty line is to construct a minimum food
basket, that can be anchored to normative nutritional requirements. We estimate
minimum caloric requirements for 52 different types of individuals, by urban and rural,
gender and age categories, using World Health Organization standards (WHO 1985). The
total household caloric requirement is the sum of minimum caloric requirements of all
household members. Next, based on reported prices for each region in Egypt, we evaluate
the cost of obtaining a hundred calories for the households with expenditures close to the
previously estimated (El-Ehwany and El-Laithy 2001) poverty lines, i.e., from the second
quintile of expenditure distribution. The cost of a household-specific food poverty line is
calculated as the product of a household's caloric requirements and the cost to that
household of a hundred calories.
The share of nonfood expenditure is estimated by fitting Engel's curves of the
food share onto total expenditure controlling for the household's. demographic
composition. The total poverty line is then calculated by dividing the cost of the food
poverty line by the estimated share of nonfood expenditure. We use two alternative
poverty lines. The upper poverty line allows a nonfood expenditure share typical of those
individuals whose expenditure on food is equivalent to the food poverty line. The lower
poverty line restricts a nonfood expenditure to the share typical of those individual whose
total expenditure is equivalent to the food poverty line (Ravallion et al. 1994). Unless
specified, the results presented in the paper are based on this lower poverty line.
To obtain the poverty lines for 1995/96 we deflate the food and nonfood
components of the 1999/2000 poverty lines using food and nonfood CPIs. The food CPIs
are calculated for each region based on information from the HIECS on food expenditure
and quantity purchased. The nonfood components of the poverty lines are deflated with
the official regionally disaggregated nonfood CPI. Seven region-specific cost-of-living
indices for 1995-96 are derived as a weighted average of the food and nonfood CPI. We
use these composite price indices to update the 1995/96 poverty lines.
8

Thus, constructed poverty lines ensure that differences in relative prices, food and
nonfood consumption preferences, activity levels, and size and age composition of poor
households are accounted for.
3. Poverty and inequality in Egypt 1999/2000
In 1999/2000, the poverty rate in Egypt stood at 16.7 percent, based on the lower
poverty line (Table 1). Approximately 10.7 million Egyptians were poor according to this
estimates. The poverty gap index was 2.97 percent, implying a per capita poverty deficit
of LE 248 and an' average deficit of LE 1,482 for the poor. The poverty severity index of
0.8 was low by the standards of middle-income countries. Applying the upper poverty
line, the poverty rate in Egypt rises to 42 percent, bringing the number of poor to almost
27 million.
The distribution of the poor is quite uneven across the regions. In rural areas
poverty rates reach 22.1 percent. Most of the poor are concentrated in Upper Egypt.
Thirty-four percent, or 5.8 million individuals, are poor in the Upper Rural region. In the
Upper Urban region the poverty rate is lower, but still reaches 19.3 percent, or 1.4 million
people. The Upper Rural regiori contributes the most to national poverty. Almost 54.4
percent of all poor in Egypt live in the Upper Rural region, even though its share of the
total population is only 26.7 percent. Moreover, the Upper Rural region's share in overall
poverty increases with distribution-sensitive measures, reflecting the low standards of
living of the poor in this region. The ranking of the regions remains unchanged for the
poverty gap and severity of poverty indices, suggesting not only that poor households
represent a large proportion of Upper Egypt's population, but also that their expenditures
are far below the regional poverty line.
The rate of poverty, particularly extreme poverty, is relatively low (9.2 percent) in
urban areas where 41.5 percent of the population resides. The lowest incidence of poverty
is in the Metropolitan region where only 5.1 percent of households are poor. These
households constitute 3.9 percent of all poor in Egypt.
The incidence, depth and severity of poverty vary considerably within each
region. Table 2 shows poverty measures for various govemorates in urban and rural
areas. The poverty indices in the urban areas of all governorates in Upper Egypt exceed
9
the corresponding national averages, except for Menia governorate. The poverty rates in
rural Upper Egypt governorates surpass the national average, except for Giza and Aswan.
Poverty incidence is highest in the govemorate of Assuit followed by Sohag and Beni
Suef. The same pattern holds for the poverty gap and severity indices.
In Lower Egypt, Menufiya is the only governorate in which poverty measures
exceed the national average. In the Metropolitan region, Alexandria has the highest
poverty rate. The incidence of poverty in Cairo amounts to 5.01 percent, ranking fifth
among the urban govemorates in Egypt.
The national level of expenditure inequality, measured by the Gini coefficient,
reached 0.378 in 1999/2000 (Table 3). Urban areas of Egypt had higher levels of
inequality in comparison with rural areas. The Upper Urban and Metropolitan regions
had the highest inequality levels (Gini 0.406 and 0.386, respectively). The rural areas of
Lower and Upper Egypt experienced relatively low inequality: 0.248 and 0.273,
respectively. In some areas economic growth was positively correlated with changes in
inequality - mean per capita expenditure in Metropolitan and Border Urban areas
increased in tandem with inequality. Per capita expenditures in Border Rural areas
declined as inequality declined. In Lower and Upper Egypt, however, changes in
inequality and mean per capita expenditures go in opposite directions.
4. Poverty Trends: 1995/96 to 1999/2000
Following a rapid economic growth and an increase in per capita expenditure,
poverty rates in Egypt decreased between 1995/96 and 1999/2000. The average annual
per capita expenditure in 1999/2000 (evaluated at 1995 Metropolitan prices) was LE
1,599, compared with LE 1,407 in 1995/96 - an increase of 3.24 percent per year.5 The
incidence of poverty, using the lower poverty line, decreased from 19.4 percent in
1995/96 to 16.7 percent in 1999/2000, or by about 800,000 people. The headcount, depth
and severity of poverty calculated for both lower and upper poverty lines also showed
statistically significant declines. The decreases in the poverty gap and severity indices
indicate that expenditure distribution improved for the poor. The overall inequality in per
s I LE = 0.30 USD in' 1995 prices
10
capita expenditure, measured by Gini coefficient (Table 3), increased from 0.345 in
1995/96 to 0.378 in 1999/2000.
The growth of household expenditures, however, was not homogeneous across the
regions (Table 4). While average per capita expenditures declined by 0.3 percent in
Upper Rural Egypt and by 1.3 percent in Upper Urban Egypt between 1995 and 2000, it
increased by 8 percent per year in the Metropolitan region. The annual growth rate of
average household expenditures reached 2.9 percent for urban and 1 percent for rural
areas in Lower Egypt.
To answer the question of how the gains from aggregate economic growth were
distributed across households in relation to their initial expenditure we calculate the
growth-incidence curves (Ravallion and Chen, 2002). The growth-incidence curves
indicate growth rates by household expenditure quintiles. Integrating this curve up to the
poverty headcount index gives a measure of the rate of "pro-poor growth" consistent with
the Watts index for the level of poverty (Watts 1968).
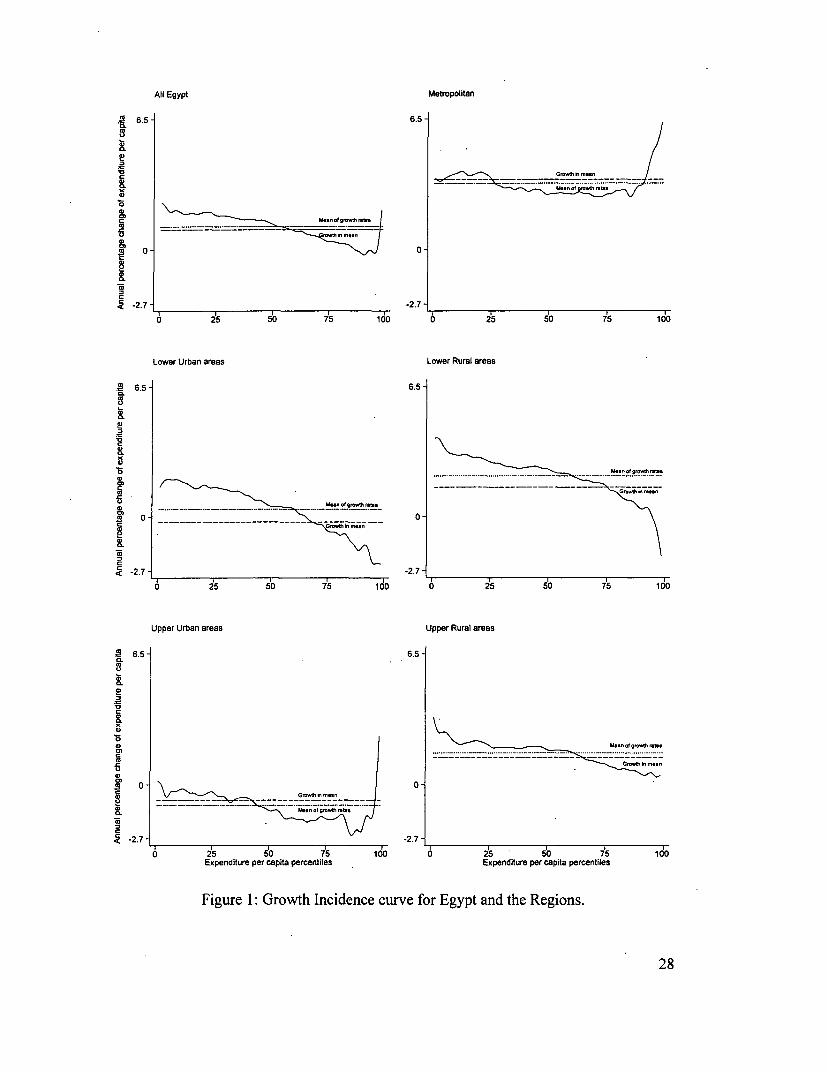
Figure 1 shows the growth-incidence curves for five regions and Egypt as a
whole. At the national level, per capita expenditure of the lower percentiles of
expenditure distribution grew at a higher than average annual rate, suggesting that poor
benefited more than the non-poor from economic growth. The aggregate picture,
however, masks the considerable regional differences. Per capita expenditure of the lower
percentiles of the expenditure distribution in Metropolitan and Upper Urban regions grew
slower than their respective averages. In Lower Egypt and Upper Rural Egypt, growth of
per capita expenditure of the poorest percentiles exceeded the regional average. Growth
in Lower Egypt and Upper rural regions mainly benefited the poor.
As a result of this unequal growth among different income groups, the inequality
in expenditure distribution differed across regions. The Metropolitan region and Upper
Egypt experienced an increase in inequality (for instance, the Gini coefficient increased
from .374 to .396 in the Metropolitan region). At the same time, the Gini coefficients
declined, by about three percentage points, for both urban and rural areas of Lower Egypt
(Table 3). Using the Theil index (Theil 1979) to decompose the inequality at the national
level into inequality between and within regions shows that 82 percent of the inequality
in 1999/2000 can be explained by within-region variation, while 18 percent can be
explained by between-region variation. The corresponding figures for 1995/96 are 87
percent and 13 percent. Comparisons over time suggest that inequality between regions is
growing - the share of overall inequality explained by differences in regional means has
increased by more than four percentage points over the period.
The interactions between changes in the mean expenditure and inequality could
explain the observed poverty dynamics across regions (Table 1). Poverty rates decreased
substantially in the Metropolitan region (from 13.1 percent to 5.1 percent) and in Lower
Rural Egypt (from 21.5 percent to 11.8 percent). In Upper Egypt, the poverty headcount
rose from 29.3 percent to 34.2 percent in rural areas and from 10.8 percent to 19.3
percent in urban areas. These differences in poverty across regions are statistically
significant, and the ranking of regions remains unchanged for other measures of poverty
- depth and severity.
Poverty Decomposition: Growth and inequality
A standard view of the relationship between economic growth and poverty is that
continued economic growth would reduce poverty. But growth may also be associated
with rising inequality, which then tends to offset part of the gains the poor make from
growth. The decline in poverty depends crucially on the extent to which economic growth
has reached the poorer members of the population.
How much would poverty have declined in Egypt if there were no changes in
welfare distribution? To answer this question we apply growth-redistribution
decomposition (Datt and Ravallion 1992). The change in poverty between two years can
be decomposed into three components. The growth component is the difference between
the two poverty indices when keeping the welfare distribution constants. The
redistribution component is the change in poverty if the mean of the two distributions is
kept constant. The residual component shows the change in poverty as a result of the
interaction of growth and inequality. Table 5 presents the results of such decomposition
for the national and regional levels. The 2.68 percentage point reduction in poverty in
Egypt between 1995 and 2000 could be decomposed into a 1.72 percentage point decline
12
in poverty resulting from the increase in the mean per capita expenditure and a 1.1
percentage point decline due to the change in the distribution. In other words, if the mean
per capita expenditure in Egypt remained unchanged between 1995 and 2000, the poverty
incidence would decline by 1.1 percentage points just because of the change in the
welfare distribution. On the other hand, if inequality stayed constant during this period,
the growth in per capita expenditure would reduce poverty by 1.72 percentage points.
Changes in both per capita expenditure and inequality resulted in decreased poverty rates.
From 1995/96 to 1999/2000, growth and redistribution components worked in
opposite directions in the Metropolitan region, where reduction in poverty (-9.18
percentage points) resulting from increased per capita mean expenditure was hampered
by worsening inequality (1.07 percentage points). In Upper and Lower Egypt both growth
and redistribution effects affected poverty in the same direction. In Lower Egypt, growth
in per capita expenditure accompanied decline in inequality, resulting in the reduction in
poverty levels (growth components are -0.61 and -4.45 for urban and rural areas,
respectively, while redistribution components were -1.51 and -5.93). The opposite
occurred in Upper Egypt, where per capita expenditure dropped and inequality worsened.
These turns for the worse were reflected in the rise of all poverty measurements. Growth
in the Metropolitan region was high enough to improve poverty levels but it was not a
pro-poor growth.
Poverty decomposition: Regional
How did these regional differences in the changes in poverty affected the
incidence of poverty at the national level? To answer this question we use regional
poverty decomposition (Ravallion anrd Huppi 1991). The change in poverty over time can
be decomposed into three components. The intra-regional effect is a contribution of
within-region change in poverty to the overall change in national poverty. The
interregional population shift measures how much national poverty would have changed
if population shifted across regions but poverty within regions remained unchanged. The
third component accounts for the interaction of the intra- and inter- regional effects.
Applying the regional decomposition to Egypt over the period 1995/96-
1999/2000 shows that almost all of the reduction in poverty at the national level can be
13
attributed to the intra-regional effect. This effect reduced poverty by 2.77 percent (Table
6). The inter-regional population movement and covariance effects were small.
With regard to regional roles in reducing poverty, the Metropolitan region may
have contributed the most, lowering the overall incidence of poverty by 1.69 percentage
points. The drop in poverty rates in the Metropolitan region and Lower Egypt dominated
outweighed increases in poverty in Upper Egypt, resulting in a net decline in the level of
national poverty. Thus, the decrease in national poverty between 1995 and 2000 could be
attributed to decreases in poverty in the Metropolitan region and Lower Rural Egypt and,
to smaller extent, to the decline in poverty in Lower Urban Egypt.
5. Who are the poor?
Poverty profiles reveal differences in the relative poverty of certain subgroups of
the population, and analysis of the poverty profiles is essential for understanding the
causes of poverty. A profile of the, poor based on 1999/2000 HIECS data reveals that
characteristics of the poor in Egypt are similar to those found in other countries of the
Middle East. The Egyptian poor tend to live in large families, have low levels of
education, work in an informal sector and be concentrated in low-paying unskilled
activities. The rate of poverty of female-headed households is higher than the average for
urban Egypt.
Table 7 shows the proportion of poor households by the education level of the
head and type of locality. Education appears to be a key dimension of welfare in Egypt.
About a third of poor households are headed by an illiterate person. The incidence of
poverty declines as household heads become educated. The households whose heads have
completed basic education are more than twice as unlikely to be poor compared with the
households headed by illiterate individuals. The likelihood of being poor falls almost to
zero for households with heads holding university or postgraduate degrees. The effect of
a head's education on the welfare status of a household seems to be much stronger in
urban areas.
Employment status of the household head also appears to influence the poverty
status of households. The poor have lower rates of labor force participation than non-poor
14
(34.6 percent versus 37.8 percent respectively). Urban households with unemployed
heads were twice as likely to be poor as urban households headed by a person with
salaried employment. The lowest poverty incidence in urban areas occurs among
households headed by a non-working head. In rural areas, employment status of the head
appears to be uncorrelated with the poverty status of a household.
Another important factor affecting the profile of the poor is sector and industry of
employment. Households in which the head works in the private sector are more likely to
be poor, both in urban and rural areas of Egypt, (the private sector is most prevalent in
rural areas). At the national level, 20 percent of households with heads working in the
private sector were poor in 2000. This is almost twice as high as the poverty rate among
households with the head working in the public sector (11 percent). The influence of the
household head's sector of employment on welfare status is more pronounced in the
urban areas of Egypt, where most of the public and government sector jobs are
concentrated.
Looking at the industry of employment, the largest proportion of poor is
concentrated in agriculture and construction. Table 7 shows that about 27 percent of poor
households have heads employed in agriculture, followed by 20 percent in construction.
The lowest incidence of poverty is registered in manufacturing and trade and finance.
6. Multivariate poverty profile and simulations
So far in the paper we have documented the incidence and changes in poverty rates
from 1995 to 2000. These indicators are intrinsically ex-post measures of well-being. At
the same time poverty-reducing policies are forward looking. Policy makers try to design
interventions that protect populations from future poverty. Such interventions are often
based on an ex-ante assessment of probability to fall into poverty.
To assess the probability of households in Egypt to be poor we rely on a two-step
approach. Let total household consumption C, be a function of household characteristics
Xi and assume that Cj is log-normally distributed. In the log form:
In (Cd =X,,8+ ei, JI5
1 5

where e, is a normally distributed error term. Then the probability of household i to be
poor is:
Pi=prob(ln(Cd<ln(zd) = P(On(zd- X,/l)/a), (2)
where z; is the household-specific poverty line, a is the standard deviation of the
regression, and 1 is a standard normal distribution function. Thus, in the first stage we
model the determinants of household consumption in the form of equation (1). In the
second stage, we simulate the effect of the covariates from the consumption regression on
the probability that a household will be poor. The poverty profile presented in the
previous section provides guidelines for the selection of the potential variables to be
included in this regression.
As a dependent variable in the consumption regression we use log of the total per
capita household consumption. The set of explanatory variables includes household size,
household demographic variables, shares of individuals with university degrees and
illiterate household members, share of unemployed, characteristics of the household head
that include gender, age and age squared, and a set of dummies for the head's educational
level, working status and sector of employment. We run separate regressions for four
urban and three rural regions of Egypt. Similar to Datt and Jolliffe (1998) we use a fixed
effect regression specification on the governorate level to correct the bias in the estimated
coefficients due to potential endogeneity or omitted variable bias. Local characteristics,
such as the degree of infrastructure development, geographical location, fertility of land,
etc., while not registered in our data, might affect the level of consumption of the
households living in particular locality. Omitting these variables in our specification
could lead to inconsistency of parameter estimates. The fixed effect specification should
control for this type of omitted variable bias.
Consumption regression results
Table 8 shows the estimation results of the consurmption regression for seven
regions of Egypt. Focusing first on household demographics, household size has a
significant and negative effect on the level of household per capita consumption in all
seven regions. The elasticity of total household consumption to household size varies
16
from 0.44 in the Metropolitan region to 0.625 in Upper Rural Egypt. These elasticities are
comparable with the elasticities reported in earlier studies. For exarnple, Datt et al, (2001)
reported an elasticity of about 0.55 for Egypt in 1997. The relationship between
household consumption and household size does not change sign with the household size
for Metropolitan, Lower urban and Border regions. For Upper Egypt and Lower Urban
areas these relation changes sign for the households with more than eight members.
In all regions the household demographic composition has-a strong and significant
effect on the level of household per capita consumption. Controlling for household size,
the presence of children age 0 to 6 has the strongest negative effect on household
consumption for all seven regions except Border Urban areas. Larger shares of children
age 7-15, the elderly and adult females also decrease household consumption.
Households with a larger proportion of literate members, especially household members
with university degrees or higher, have significantly higher per capita consumption
levels.
Consistent with the descriptive results in the previous section, characteristics of
the household head are important determinants of household consumption. The positive
and significant coefficient on the household age variable indicates that in the
Metropolitan, Upper, and Lower Urban Egypt regions, households with older head attain
higher levels of consumption. For the Lower Rural and Border regions age of the
household head has an insignificant effect on household consumption. Households
headed by female are slightly better off in Metropolitan and Upper Urban areas, but
worse off in Lower Rural Egypt.
The education level of the head has a strong impact on the level of household
well-being. During the last decade Egypt experienced a skill-shortage in fields such as
engineering and computer science. The lack of capacity pushed up the wages of workers
with special types of university education, and increased the wage-gap across skill-levels.
Technical secondary education, often geared towards traditional industrial occupations, is
no longer in demand. Similarly, low-skill jobs of the type held by workers with primary
education or less, have shrunk in number.
17

Relative to the omitted category - households in which heads have a postgraduate
degree - households with the less educated heads have significantly lower level of per
capita consumption. At biggest disadvantage are the households with illiterate heads. The
return on a head's education is the highest for urban households, especially those in the
Metropolitan region. In this region, households with university-educated heads have
about 60 percent higher per capita consumption expenditures than the households with
illiterate heads. For Egypt's rural areas the difference is only about 20 percent. Upper
Egypt is the region with the lowest educational levels, and stable jobs for unskilled
workers or workers with little education are not available here.
We also find that households in the Metropolitan, Upper, and Lower Urban areas
that have heads employed in the private or foreign/joint venture firms have a significantly
higher per capita consumption level than households whose heads work in public
enterprises or in government, or are unemployed.
Simulations
The estimates of the consumption regression make it possible to simulate the
impact of various parameters on the probability that a household will be poor. We present
the results of the poverty simulation separately for seven regions of Egypt in Table 9.
Although the data allows us to simulate various scenarios, we chose those that, from our
perspective, have most relevance for policies'aimed directly at reducing poverty.
We find that a newborn child increases risks of poverty in all regions of Egypt.
The effect of childbirth on the probability of being poor is larger in urban areas. Families
with a newly born child are 56 percent more likely to be poor in the Metropolitan region,
64 percent in Upper Urban Egypt, 45 percent in Upper Rural Egypt and by 24 percent in
Lower Rural Egypt.
Female-headed households, which constitute about 10.4 percent of Egypt's
population, are at higher risk of poverty than households with a male head in all regions
of Egypt except the Upper Rural region. There, female-headed households are 3 percent
less likely to be poor than male-headed households. Female-headed households face the
18
highest risk of poverty is in Metropolitan region, where they are 22 percent more likely to
be poor than male-headed counterparts.
When a family member loses a job the household risk of poverty increases
substantially. The impact of a job loss on the probability of being poor ranges from 113
percent for Upper Urban Egypt to 13 percent for Lower Urban Egypt. At the same time
the impact of working status on poverty depends on the sector of employment. Relative
to households with the heads who are out of the labor force, households with the heads
holding government jobs have higher risks of poverty in the Metropolitan (11 percent),
Upper Urban (7.5 percent) and Lower Urban (34 percent) region. In Upper and Lower
Rural Egypt, households with heads employed in government have lower risk of poverty
than households with heads out of the labor force.
Households with the head working in the public sector are less likely to be poor
than the households with heads out of the labor force. This is true for all regions except
Lower Urban Egypt. The risk of poverty for household with heads in the public sections
are decrease by 4.5 percent in the Metropolitan region, by 3.6 percent in Upper Urban
Egypt, 13 percent in Upper Rural Egypt, and 21 percent in Lower Rural Egypt. In the
Lower Urban region the probability of being poor increases by 14 percent.
Employment in the private sector or in a foreign firm substantially reduces the
risk of poverty. In the Metropolitan region, for example, households with heads
employed in the private sector are 41 percent less likely to be poor than those with heads
out-of-the labor force head. The poverty risks are lowest for the households with heads
employed by the foreign firms.
To estimate the impact of education on the probability of being poor, we vary the
head's level of education a household head possesses. All other variables are kept at
sample mean levels. Consistent with the descriptive results of the previous section, a
head's educational level strongly determines of the degree to which a household is more
likely to be poor. A head's education level has greater impact on household poverty in
urban areas. We observe a steady decrease in the risk of poverty for households headed
by men and women with higher levels of education. Relative to households with illiterate
heads, the probability of being poor is about 15 percent lower for households with heads
19
that can read and write, about 25 percent lower for households with heads possessing
basic education, and 65 percent lower for the households headed by high school
graduates. In all regions of Egypt, households with the heads with postgraduate degrees
are twice less likely to be poor than households with illiterate heads.
7. Conclusions
In this paper, we analyze the changes in poverty and inequality during Egypt's
high-growth years: 1995 to 2000. We find that poverty rates in Egypt as a whole declined
from 19.4 percent in 1995/96 to 16.7 percent in 1999/2000 (early 2000). Strong economic
growth and the resultant rise in household expenditures caused this decline.
Redistribution effects, though present, were generally weak, and more than offset by the
growth effects.
Despite a significant increase in average household expenditures in the late 1990s,
poverty in Egypt remains pervasive. The lower poverty line used in this report, shows
that almost 11 million people lived in poverty in 2000. The World Bank's measures of
poverty - household expenditures below $1/day and $2/day (PPP adjusted) - show are
1.7 million people and 25.9 million poor people, respectively.6
We uncover substantial differences in the rates of growth and poverty dynamics
among the four main regions of Egypt. Households living in the Metropolitan areas and
in Lower Egypt saw their per capita expenditures grow and poverty rates decline between
1995/96 and 1999/2000. At the same time, households in Upper Egypt, and Lower Rural
Egypt experienced negative or close to zero expenditure growth rates. The pattern of
redistribution also varied within the regions, with the poorest households in Lower Egypt
actually getting proportionately larger shares of expenditure growth.
The characteristics of the poor, however, were similar across regions. Households
with many children, households with poorly-educated heads, and household with heads
employed in agriculture were over-represented among the poor. Education most affected
a household's chances of being poor or nonpoor. This finding is particularly significant
6 This is based on PPP conversion factors that make the relevant per capita poverty lines 55.78 LE/monthand 111.56 LE/month respectively in 1999/2000.
20

because more than 45 percent of the poor in Egypt were illiterate in 1999/2000. Our
model of the determinants of poverty reveals that household size, household demographic
composition, and the level of education and employment status of the head are important
factors affecting household capacity to escape poverty.
Looking ahead, the slowdown of the Egyptian economy after 2000 raises
concerns about the extent of poverty today. The economic growth achieved through
domestic expansionary policies and external transfers have ultimately proven
unsustainable, and the construction boom has ended. In addition, a deteriorating fiscal
situation and increasing pressures on the balance of payments have placed a limit on the
degrees of freedom available for using an expansionary macroeconomic policy to boost
growth.
There is a strong possibility that many of Egyptians who escaped poverty during
the 1995-2000 slipped back into poverty in this decade again. Moreover, even though we
found a positive relationship between economic growth and poverty in Egypt, the
substantial growth of the last decade did not affect many of the poor. We believe that
further research is needed to understand why these households did not benefit from
growth. The insights of such analysis would help guide poverty reduction policy
initiatives. By understanding of the growth and redistribution patterns of the late 1 990s,
and by preparing a flexible set of policies that could withstand economic fluctuations, it
will be possible to devise a policy framework for a more sustained, sustainable, and
equitable growth path in Egypt.
21
References.
Baulch, B., and J., Hoddinott, (2000) "Economic Mobility and Poverty Dynamics inDeveloping Countries." Journal of Development Studies, Vol. 33(6): 1-24
Datt, G. and M. Ravallion, (2002) "Growth and Redistribution Components of Changesin Poverty Measures: A Decomposition with Applications to Brazil and India in the1980s." Journal of Development Economics, Vol. 38(2): 275-95
Datt, G. and M. Ravallion, (2002) "Is India's Economic Growth Leaving the PoorBehind?" Journal Of Economic Perspectives (U.S.), Vol 16(3): 89-108
Datt, G., Jolliffe, D., and Sharma, M. (2001) "A Profile of Poverty in Egypt" AfricanDevelopment Review/Revue Africaine de Developpement Vol. 13(2): 202-37
Datt, G., and D. Jolliffe, (1998) "Poverty in Egypt: Modeling and Policy Simulations."Mimeo, IFPRI, Washington, D.C.
Foster, J., and A.F. Shorrocks, (1988) "Poverty Ordering and Welfare Dominance", in W.Gaertner and P.K. Pattanaik (eds), Distributive Justice and Inequality, Berlin:Springer-Verlag.
Hentschel, J., and P. Lanjouw, (2000) "Household Welfare Measurement and the Pricingof Basic Services", Journal of International Development Vol. 12(1 ): 13-27
Ravallion, M., and M. Huppi, (1991) "Sectoral structure of poverty during an adjustmentperiod: evidence for Indonesia in the mid-1980s" World Development, Vol. 19: 1653-78
Ravallion, M., (1994) Poverty Comparisons, Harwood Academic Publishers,Philadelphia
Ravallion, M., (1999) "Appraising Workfare," World Bank Research Observer, Vol.14(1): 31-48
Ravallion, Martin and Shaohua Chen (2003), "Measuring Pro-Poor Growth", EconomicsLetters, Vol. 78(1): 93-99
Ravallion, Martin and Benu Bidani (1994), "How Robust is a Poverty Profile?" WorldBank Economic Review, Vol. 8(1): 75-102
Theil, H., 1979, "The Measurement of Inequality by Components of Income", EconomicsLetters, 2: 197-199.
Watts, H., (1968) "An Economic Definition of Poverty", in D.P. Moynihan (ed.), OnUnderstanding Poverty, New York: Basic Books
World Health Organization (1985) "Energy and Protein Requirements." World HealthOrganization Technical Report Series, #724, World Health Organization, Geneva
22
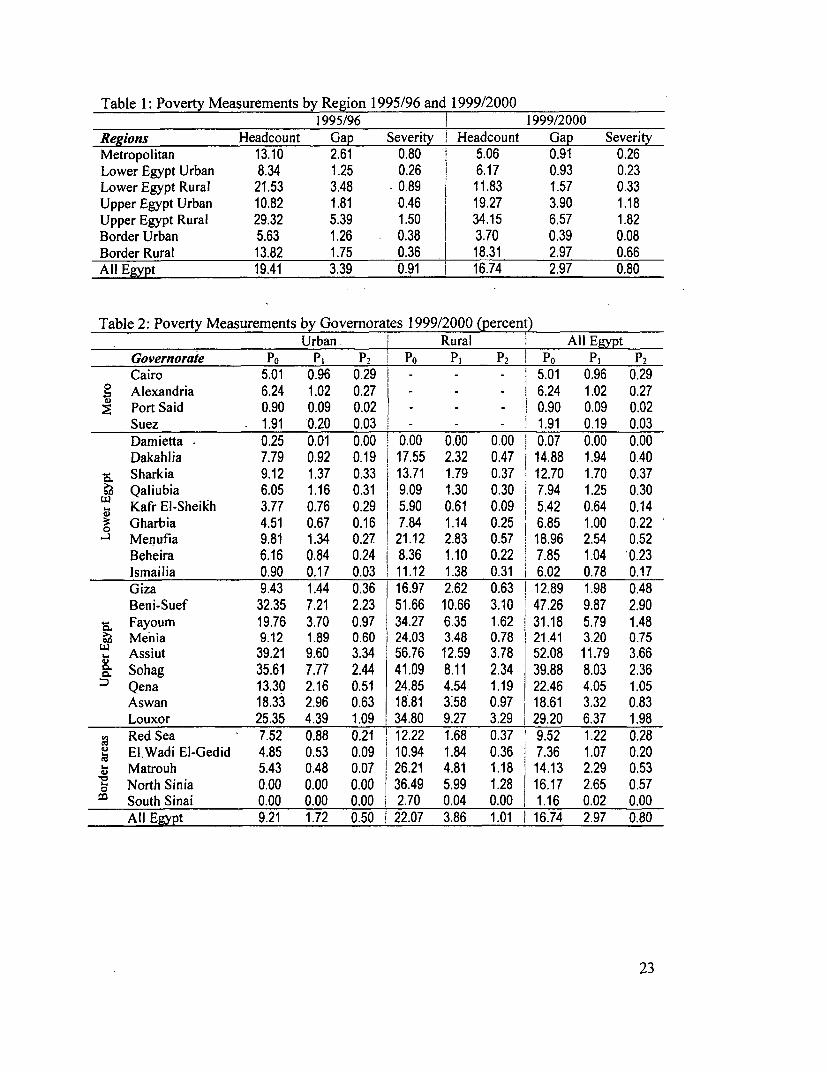
Table 1: Poverty Measurements by Region 1995/96 and 1999/20001995/96 j 1999/2000
Regions Headcount Gap Severity I Headcount Gap SeverityMetropolitan 13.10 2.61 0.80 5.06 0.91 0.26Lower Egypt Urban 8.34 1.25 0.26 6.17 0.93 0.23Lower Egypt Rural 21.53 3.48 0.89 11.83 1.57 0.33Upper Egypt Urban 10.82 1.81 0.46 19.27 3.90 1.18Upper Egypt Rural 29.32 5.39 1.50 34.15 6.57 1.82Border Urban 5.63 1.26 0.38 3.70 0.39 0.08Border Rural 13.82 1.75 0.36 1 18.31 2.97 0.66All Egypt 19.41 3.39 0.91 16.74 2.97 0.80
Table 2: Poverty Measurements by Governorates 1999/2000 (percent)Urban. Rural All Egypt
Governorate PO PI P2 Po PI P2 Po PI P2Cairo 5.01 0.96 0.29 I - - - 5.01 0.96 0.29
0g Alexandria 6.24 1.02 0.27 - - - I 6.24 1.02 0.272 Port Said 0.90 0.09 0.02 - - 0.90 0.09 0.02
Suez - 1.91 0.20 0.03 - - - 1.91 0.19 0.03Damietta 0.25 0.01 0.00 ! 0.00 0.00 0.00 0.07 0.00 0.00Dakahlia 7.79 0.92 0.19 1 17.55 2.32 0.47 j 14.88 1.94 0.40
, Sharkia 9.12 1.37 0.33 I 13.71 1.79 0.37 12.70 1.70 0.373 Qaliubia 6.05 1.16 0.31 9.09 1.30 0.30 7.94 1.25 0.30Q Kafr El-Sheikh 3.77 0.76 0.29 5.90 0.61 0.09 5.42 0.64 0.143 Gharbia 4.51 0.67 0.16 7.84 1.14 0.25 6.85 1.00 0.22
Menufia 9.81 1.34 0.27 21.12 2.83 0.57 118.96 2.54 0.52Beheira 6.16 0.84 0.24 i 8.36 1.10 0.22 7.85 1.04 0.23Ismailia 0.90 0.17 0.03 11.12 1.38 0.31 6.02 0.78 0.17Giza 9.43 1.44 0.36 16.97 2.62 0.63 12.89 1.98 0.48Beni-Suef 32.35 7.21 2.23 51.66 10.66 3.10 I 47.26 9.87 2.90
. Fayoum 19.76 3.70 0.97 34.27 6.35 1.62 . 31.18 5.79 1.489 Menia 9.12 1.89 0.60 24.03 3.48 0.78 21.41 3.20 0.75
Assiut 39.21 9.60 3.34 56.76 12.59 3.78 52.08 11.79 3.66f Sohag 35.61 7.77 2.44 41.09 8.11 2.34 39.88 8.03 2.36
= Qena 13.30 2.16 0.51 24.85 4.54 1.19 1 22.46 4.05 1.05Aswan 18.33 2.96 0.63 18.81 3.58 0.97 18.61 3.32 0.83Louxor 25.35 4.39 1.09 34.80 9.27 3.29 29.20 6.37 1.98Red Sea 7.52 0.88 0.21 12.22 1.68 0.37 9.52 1.22 0.28
a El.Wadi El-Gedid 4.85 0.53 0.09 1 10.94 1.84 0.36 7.36 1.07 0.20Q Matrouh 5.43 0.48 0.07 26.21 4.81 1.18 14.13 2.29 0.53O North Sinia 0.00 0.00 0.00 36.49 5.99 1.28 16.17 2.65 0.57
South Sinai 0.00 0.00 0.00 2.70 0.04 0.00 1.16 0.02 0.00All Egypt 9.21 1.72 0.50 | 22.07 3.86 1.01 16.74 2.97 0.80
23

Table 3: Measures of inequality for 1996 and 2000 by region.Measures of inequality
Regions Gini 1996 Gini 2000 Theil 1996 Theil 2000Metropolitan 0.374 0.396 0.268 0.308Lower Urban 0.316 0.288 0.180 0.154Lower Rural 0.280 0.248 0.145 0.113Upper Urban 0.383 o.406 0.301 0.370Upper Rural 0.268 0.273 0.128 0.137Border Urban 0.254 0.308 0.111 0.169Border Rural 0.365 0.283 0.253 0.132All Egypt 0.345 0.378 0.234 0.295DecompositionWithin regions 0.204 0.243Between regions 0.031 0.052
Table 4: Average and annual percentage change in per capita consumption between 1996and 2000. I
Average expenditure per capita Annual percent growthRegions 1996 2000Metropolitan 2096.82 2848.92 7.96Lower Urban 1582.81 1649.97 1.04Lower Rural 1123.08 1257.62 2.87Upper Urban 1529.47 1450.05 -1.32Upper Rural 912.03 900.00 -0.33Border Urban 1436.53 2082.77 9.73Border Rural 1549.30 1310.72 -4.09All Egypt 1407.72 1599.30 3.24
Table 5: Growth and redistribution decomposition of poverty changes between 1996 and2000 by region.
Percentage change in incidence of poverty between 1996-2000Regions Growth Redistribution Residual Actual ChangeMetropolitan -9.178 1.073 0.061 -8.044Lower Urban -0.611 -1.511 -0.046 -2.168Lower Rural -4.449 -5.934 0.679 -9.704Upper Urban 1.294 6.906 0.247 8.448Upper Rural 3.552 1.083 0.198 4.833Border Urban 6.836 -4.416 -4.355 -1.934Border Rural 29.055 -10.415 -14.158 4.483All Egypt -1.723 -1.074 0.119 -2.677
24
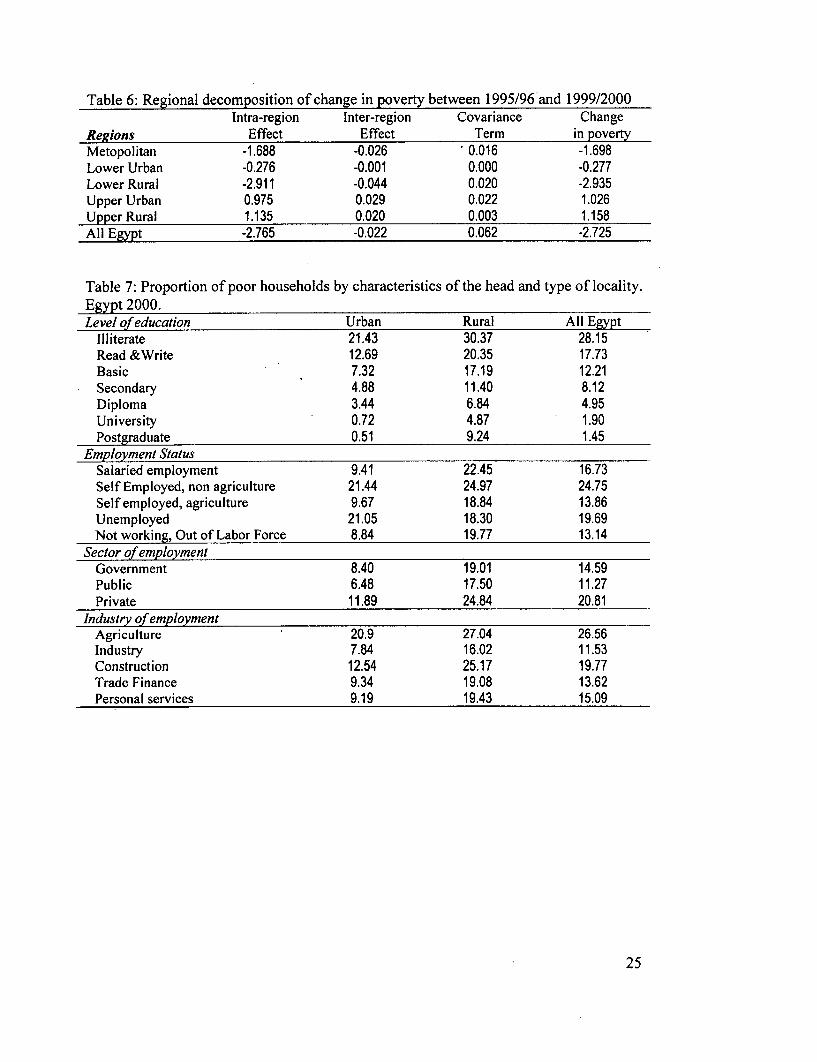
Table 6: Regional decomposition of change in poverty between 1995/96'and 1999/2000Intra-region Inter-region Covariance Change
Regions Effect Effect Term in povertyMetopolitan -1.688 -0.026 0.016 -1.698Lower Urban -0.276 -0.001 0.000 -0.277Lower Rural -2.911 -0.044 0.020 -2.935Upper Urban 0.975 0.029 0.022 1.026Upper Rural 1.135 0.020 0.003 1.158All Egypt -2.765 -0.022 0.062 -2.725
Table 7: Proportion of poor households by characteristics of the head and type of locality.Egypt 2000.Level of education Urban Rural All Egypt
Illiterate 21.43 30.37 28.15Read &Write 12.69 20.35 17.73Basic 7.32 17.19 12.21Secondary 4.88 11.40 8.12Diploma 3.44 6.84 4.95University 0.72 4.87 1.90Postgraduate 0.51 9.24 1.45
Employment StatusSalaried employment 9.41 22.45 16.73Self Employed, non agriculture 21.44 24.97 24.75Self employed, agriculture 9.67 18.84 13.86Unemployed 21.05 18.30 19.69Not working, Out of Labor Force 8.84 19.77 13.14
Sector of employmentGovernment 8.40 19.01 14.59Public 6.48 17.50 11.27Private 11.89 24.84 20.81
Industry of employmentAgriculture 20.9 27.04 26.56Industry 7.84 16.02 11.53Construction 12.54 25.17 19.77Trade Finance 9.34 19.08 13.62Personal services 9.19 19.43 15.09
25
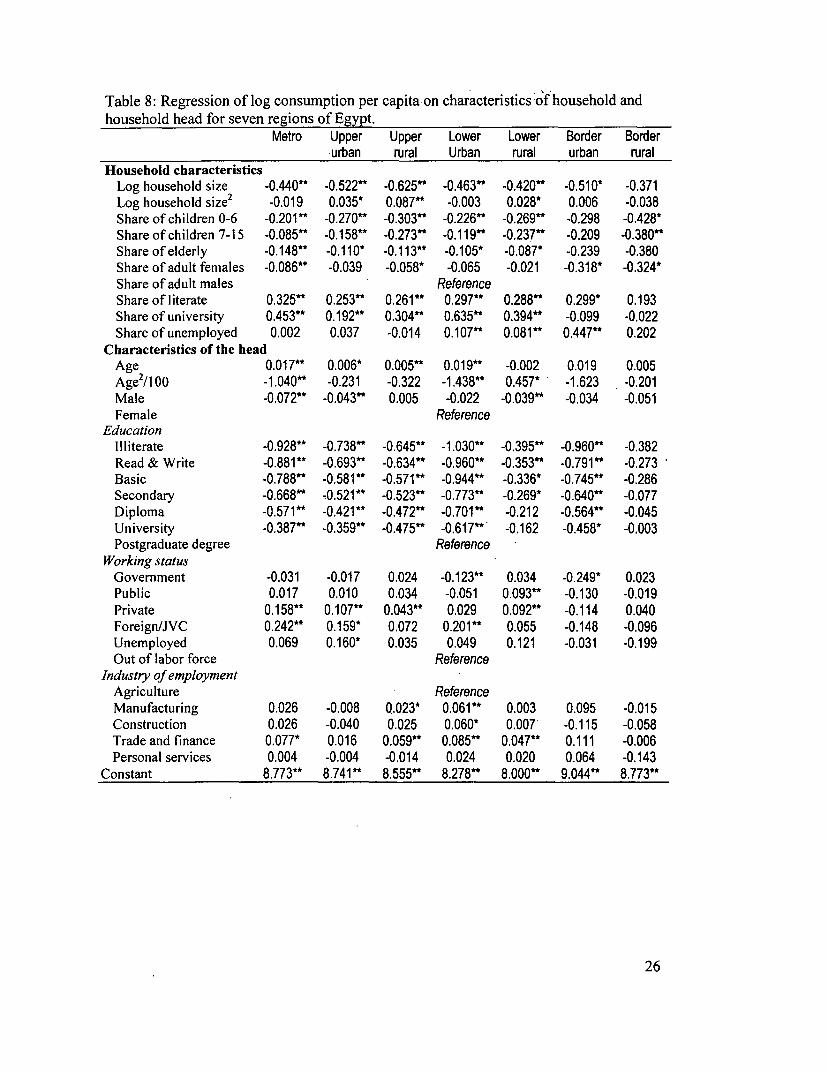
Table 8: Regression of log consumption per capita on characteristics of household andhousehold head for seven regions of Egypt.
Metro Upper Upper Lower Lower Border Borderurban rural Urban rural urban rural
Household characteristicsLog household size -0.440** -0.522** -0.625** -0.463** -0.420** -0.510* -0.371Log household size2 -0.019 0.035* 0.087** -0.003 0.028* 0.006 -0.038Share of children 0-6 -0.201** -0.270** -0.303* -0.226** -0.269** -0.298 -0.428*Share of children 7-15 -0.085** -0.158* -0.273* -0.119** -0.237* -0.209 -0.380**Share of elderly -0.148** -0.110k* -0.113** -0.105* -0.087* -0.239 -0.380Share of adult females -0.086** -0.039 -0.058* -0.065 -0.021 -0.318* -0.324*Share of adult males ReferenceShare of literate 0.325** 0.253** 0.261** 0.297** 0.288** 0.299* 0.193Share of university 0.453** 0.192** 0.304** 0.635** 0.394** -0.099 -0.022Share of unemployed 0.002 0.037 -0.014 0.107** 0.081* 0.447** 0.202
Characteristics of the headAge 0.017** 0.006* 0.005** 0.019** -0.002 0.019 0.005Age2/100 -1.040** -0.231 -0.322 -1.438** 0.457* -1.623 -0.201Male -0.072** -0.043** 0.005 -0.022 -0.039** -0.034 -0.051Female Reference
EducationIlliterate -0.928** -0.738** -0.645** -1.030** -0.395** -0.960** -0.382Read & Write -0.881** -0.693** -0.634** -0.960** -0.353** -0.791 ** -0.273Basic -0.788** -0.581** -0.571 ** -0.944** -0.336* -0.745** -0.286Secondary -0.668** -0.521** -0.523** -0.773** -0.269* -0.640** -0.077Diploma -0.571** -0.421 ** -0.472** -0.701** -0.212 -0.564** -0.045University -0.387** -0.359** -0.475** -0.617** -0.162 -0.458* -0.003Postgraduate degree Reference
Working statusGovernment -0.031 -0.017 0.024 -0.123** 0.034 -0.249* 0.023Public 0.017 0.010 0.034 -0.051 0.093** -0.130 -0.019Private 0.158** 0.107** 0.043** 0.029 0.092** -0.114 0.040Foreign/JVC 0.242** 0.159* 0.072 0.201** 0.055 -0.148 -0.096Unemployed 0.069 0.160* 0.035 0.049 0.121 -0.031 -0.199Out of labor force Reference
Industry of employmentAgriculture ReferenceManufacturing 0.026 -0.008 0.023* 0.061** 0.003 0.095 -0.015Construction 0.026 -0.040 0.025 0.060* 0.007 -0.115 -0.058Trade and finance 0.077* 0.016 0.059** 0.085** 0.047** 0.111 -0.006Personal services 0.004 -0.004 -0.014 0.024 0.020 0.064 -0.143
Constant 8.773** 8.741** 8.555** 8.278** 8.000** 9.044** 8.773**
26

Table 9: Impact of changes in household characteristics and characteristics of the household head on poverty. Percent change.Metro Upper Upper Lower Lower Border Border
Urban Rural Urban Rural Urban RuralChild born in the family 56.22 63.93 45.02 34.79 23.97 65.91 34.82Family member looses job 26.93 113.06 13.26 13.22 45.9 -13.6 42.07Female headed households -21.95 -17.47 2.92 -5.49 -10.08 -16.67 -15.59Head education
change from illiterate to read and write -14.93 -17.28 -6.25 -16.06 -11.58 -57.86 -30.25change from illiterate to basic -39.7 -51.05 -31.64 -19.57 -15.68 -66.66 -26.09change from illiterate to secondary -62.68 -63.97 -47.6 -50.59 -32.03 -82.64 -68.38change from illiterate to diploma -75.57 -79.4 -61.19 -60.89 -44.36 -89.15 -72.72change from illiterate to University degree -89.92 -85.74 -60 -70.74 -53.26 -94.83 -75.95change from illiterate to postgraduate degree -98.95 -99.01 -99.14 -98.51 -76.38 -99.92 -77.53
Sector of employmentUnemployed 0.42 3.12 0.52 4.55 3.86 24.65 8.39employed in the government job 10.85 7.42 -9.77 34.12 -7.59 221.22 -5.77employed in the public sector job -4.55 -3.57 -13.12 13.75 -20.79 89.91 6.57employed in the private sectorjob -41.27 -36.8 -17.25 -6.81 -21.13 79.88 -9.42employed in the foreign firm -57.17 -50 -29.26 -43.17 -12.22 121.15 30.69
All Egypt Metropolltan
. 6.5- 6.5-
CL
eC \M..n or g,n.C , |0~~ 0
o O- o -
<-2.7 -2.7 -
b 25 50 75 ida b 2s 50 75 ida
Lower Urban areas Lower Rural areas
. 6.5 6.5
2
C
0
a _ .
C - …0
< -2.7- -2.7 -
As 50 TS 100 0 25 50 75 100
Upper Urban areas Upper Rural areas
2 6.5 6.5-
s L
r . . ... . . ................ . .
o - o
~~~~~~~~~~~~~~~~Mon CI G.a mom.n
. -2.7- O2.7
2 50 7 ida 6 25 50 75 100Expenditure per capita percentiles Expenditure per capita percentiles
Figure 1: Growth Incidence curve for Egypt and the Regions.
28
Policy Research Working Paper Series
ContactTitle Author Date for paper
WPS3043 The Incentive-Compatible Design Thorsten Beck May 2003 K. Labrieof Deposit Insurance and Bank 31001Failure Resolution: Concepts andCountry Studies
WPS3044 Impregnated Nets Cannot Fully Mead over May 2003 H. SladovichSubstitute for DDT: Field Bernard Bakote'e 37698Effectiveness of Malaria Prevention Raman Velayudhanin Solomon Islands Peter Wilikai
Patricia M. Graves
WPS3045 Causes and Consequences of Civil Klaus Deininger May 2003 M. FernandezStrife: Micro-Level Evidence from 33766Uganda
WPS3046 Migration, Spillovers, and Trade Ross Levine May 2003 E. KhineDiversion: The Impact of Sergio L. Schmukler 37471Internationalization on Stock MarketLiquidity
WPS3047 Comparing Mortgage Credit Risk Robert Buckley May 2003 0. HimidPolicies: An Options-Based Approach Gulmira Karaguishiyeva 80225
Robert Van OrderLaura Vecvagare
WPS3048 Targeted Transfers in Poor Countries: Martin Ravallion May 2003 P. SaderRevisiting the Tradeoffs and Policy 33902Options
WPS3049 Hidden Impact? Ex-Post Evaluation Shaohua Chen May 2003 P. Saderof an Anti-Poverty Program Martin Ravallion 33902
WPS3050 The Changing Financial Landscape: Wafik Grais May 2003 R. VoOpportunities and Challenges for Zeynep Kantur 33722the Middle East and North Africa
WPS3051 Regional, Multilateral, and Unilateral Glenn W. Harrison May 2003 P. FlewittTrade Policies of MERCOSUR for Thomas F. Rutherford 32724Growth and Poverty Reduction in David G. TarrBrazil Angelo Gurgel
WPS3052 Long-Run Impacts of China's WTO Kym Anderson May 2003 S. LipscombAccession on Farm-Nonfarm Income Jikun Huang 87266Inequality and Rural Poverty Elena lanchovichina
WPS3053 Economic Impacts of China's Elena lanchovichina May 2003 S. LipscombAccession to the World Trade William Martin 87266Organization
WPS3054 The New Comparative Economics Simeon Djankov May 2003 G. SorensenEdward Glaeser 37088Rafael La PortaFlorencio Lopez-de-SilanesAndrei Shleifer
WPS3055 The Global Growth of Mutual Funds Deepthi Fernando May 2003 A. YaptencoLeora Klapper 31823Viktor SullaDimitri Vittas

Policy Research Working Paper Series
ContactTitle Author Date for paper
WPS3056 Avoiding the Pitfalls in Taxing Patrick Honohan May 2003 A. YaptencoFinancial Intermediation 31823
WPS3057 Teaching Adults to Read Better and Helen Abadzi May 2003 H. AbadziFaster: Results from an Experiment 80375in Burkina Faso
WPS3058 Working for God? Evaluating Service Ritva Reinikka May 2003 H. SladovichDelivery of Religious Not-for-Profit Jakob Svensson 37698Health Care Providers in Uganda
WPS3059 Do Capital Flows Respond to Risk Cesar Calder6n May 2003 T. Tourouguiand Return? Norman Loayza 87431
Luis Serven
WPS3060 World Market Integration through the Rui Albuquerque May 2003 T. TourouguiLens of Foreign Direct Investors Norman Loayza 87431
Luis Servwn
WPS3061 Reciprocity in Free Trade Caroline Freund May 2003 P. FlewittAgreements 32724
WPS3062 Labor Effects of Adult Mortality in Kathleen Beegle May 2003 E. de CastroTanzanian Households 89121
WPS3063 Trade Liberalization, Firm Paolo Epifani May 2003 P. FlewittPerformance, and Labor Market 32724Outcomes in the Developing World:What Can We Learn from Micro-LevelData?
WPS3064 Trade Policy, Trade Volumes, and Ana M. Fernandes May 2003 A. FernandesPlant-Level Productivity in Colombian 33983Manufacturing Industries
WPS3065 Ghost Doctors: Absenteeism in Nazmul Chaudhury May 2003 H. SladovichBangladeshi Health Facilities Jeffrey S. Hammer 37698
WPS3066 The Potential Demand for and Shreelata Rao Seshadri May 2003 H. SladovichStrategic Use of an HIV-1 Vaccine P. Subramaniyam 37698in Southern India Prabhat Jha
WPS3067 The Mini-Integrated Macroeconomic Pierre-Richard Agenor May 2003 M. GosiengfiaoModel for Poverty Analysis: A Framework 33363for Analyzing the Unemployment andPoverty Effects of Fiscal and LaborMarket Reforms


![LOKSHIN CALUMNIATED BY KGB#+ · 2012-03-27 · till 1946”. (See the above-quoted article of M.G.Neuhaus, p. 34) Citation 3. “During the war Svjatoslav [Richter] lived in my family](https://img.pdfslide.net/doc/110x75/5e7680293404e84e377897fc/lokshin-calumniated-by-kgb-2012-03-27-till-1946a-see-the-above-quoted-article.jpg)