Embed Size (px)
Citation preview

Poverty and Social Exclusion of Women in Japan
Aya K. Abe
IntroductionIt is common among both developed and devel-oping countries that women are more affected than men by the social disadvantages of poverty (Goldberg 2010). Although one of the earlier stud-ies has pointed out that Japan has not experienced the “feminization of poverty,” 1) like other devel-oped countries (Axinn 1990), this argument was made based mostly on the ratio of single-mother households among poor households. A subsequent study, however, which includes an analysis of the elderly, has pointed out that the feminization of poverty in Japan is significant, thus contesting the results of previous studies (Kimoto and Hagi-wara 2010). Since then, more and more statistical data demonstrating the poverty risk of women is emerging, and the remarkably high poverty rate of female-headed households is being highlighted. For example, the relative poverty rate of single-person households of elderly women is over 50% and for single-mother households, almost 60% (Abe 2010).
The issue of poverty, however, is hardly ever discussed from the context of gender (Osawa 2010). Moreover, there is a tendency that poverty is a “men’s issue.” For example, even though the poverty among female elderly single-person households is remarkably high, there is no debate on how to raise their well-being. Also, even though there is a spreading awareness that the non-regular employment, represented by those doing tempo-rary or part-time jobs, is leading to the phenome-non of the working poor, and despite it being clear that the overwhelming majority of non-regular workers are women, there is weak recognition that the working-poor is women’s issue. Almost all people staying in “Hakenmura” (temporary work-ers village) in Hibiya Park at the end of 2008 after the “Lehman Shock” were men, giving an impres-sion that it is only men who had lost housing and employment. But this turn-out did not indicate that women were not being affected as well. It simply meant that for women, sleeping rough in a park was unacceptable and unavailable option in terms of their physical safety. Women tend to use all possible means to avoid sleeping rough, even sometimes engaging in sex industry. Poverty among working women has been a problem long before Hakenmura, yet “the working poor” was recognized only when it began to affect men.
The effects on women are “hard to identify” even from the perspective of social exclusion (inclusion). As will become evident, women engage much more in informal social interaction than men, yet they are overwhelmingly behind when it comes to formal social participation (e.g. voting at elections, political activities). Compared to men, more of women’s lives and activities are centered within the family, making their situation more difficult to grasp. Outside the family, we can only surmise that many women in dire situation are being pulled into the “dark side” of society, such as the sex industry, but in such case, they are literally being excluded from mainstream society. However, reliable data of the “dark side” of the society is not available.
This paper looks at poverty and social exclu-sion from the perspective of gender, comparing female and male poverty and social exclusion. This is an area where social analysis is very much lacking. What we do know is that the female pov-erty rate according to income is higher that the male poverty rate, particularly among households headed by women (single mother and single-person female households) (Abe 2010). However, besides that, not much is known.
This chapter will proceed as follows. First, Part 1 will focus on female poverty (low-income) based on income data and compare it to male pov-erty. It will make an international comparison of the gap between female and male poverty rates according to attribute to elucidate the gender gap in Japan’s poverty rate. Part 2 will look at whether the feminization of poverty is taking place in Japan based on the ratio of women among the poor. Part 3 outlines the notion of social exclusion and how it is measured, then considers the gender gap in terms of how social exclusion takes place. Finally, Part 4 presents future directions for the gender analysis of poverty and social exclusion.
1. The Gender Gap in Poverty Rates(1) Gender bias in income dataLet’s begin by looking at female poverty as under-stood through income data. Before examining the statistics, note that a certain gender bias exists in poverty measure using data on income and con-sumption. Most common poverty measure using income data uses data on the amount of household income that is the total income earned by members
61
Japanese Journal of Social Security Policy, Vol.9, No.1 (March 2012)

of that household, adjusted according to the num-ber of people within the household (equivalent household income). For example, the OECD determines poverty according to relative income, using 50 to 60 percent of the median equivalent household income as the poverty line, and defin-ing individuals falling below this as poor.
This definition, however, is based on several assumptions. First assumption is in the notion of “household income.” Here, the budget constraint of the household as a whole is the amount repre-senting the total income of all its members, but in reality, not all income in the household is pooled and shared. For example, in many families, the husband hands over part of his income to his wife to cover the family’s living expenses, using the remainder of his income completely on himself. Also, for double income couples, it is probably more common for each to contribute to the living expenses and handle what remains individually, rather than deposit each income into a common wallet (e.g. bank account) to collectively manage living expenses. And when it comes to multi-gen-erational households, we know little about how individual member of a household shares living expenses. Households in Japan are more diverse than the West, and the sharing of household expenses is much more complex in the case of non-nuclear families. Where elderly persons live with their grown-up child in the same household, it is not clear whose income their living expenses are drawn from and what amount this is, or how much money they have to spend freely.
All in all, it is very difficult to gain a good understanding of how the income of household members is pooled and shared. The poverty mea-sure based on household income, thus assumes that members of a household each gain the same amount of utility from the household income. This is extremely biased against women in particular. The amount of income and pension earned by
women is less than men in the first place, so the amount they have to use freely as individuals is also less. Even if female income were the same as that of males, women tend to spend more on their children and family than men, and less on themselves (Haddad and Kanbur 1990, Lundberg and Pollack 1996). For these reasons, poverty measurement calculated based on the assump-tion of all household members having equivalent incomes are, in the case of women, probably an underestimate.
(2) Female poverty rate (low income)Even with this bias, the poverty rate based on household income (low income rate) is still a useful index because as a result of it, the female poverty rate cannot be overestimated. This section of the paper looks at the situation of female poverty from the aspect of low income. Figures 1 to 7 below show the poverty rate (low income rate) according to the attribute, for both males and females. That is, we estimate the percentage of women and men under each attribute that are poor (low income). Here, we focus on and develop arguments regard-ing the gender gap in the poverty rate.
Let’s start by looking at the poverty rate by age group. Figure 1 shows the poverty rate accord-ing to age group and sex (estimates from Ministry of Health, Labour and Welfare’s 2007 Compre-hensive Survey of Living Condition of the People on Health and Welfare “Kokumin seikatsu Kiso Chosa 2007”). Though in their early 20s, the pov-erty rate for men is higher than that for women, it reverses in the late 20s, and the gender gap widens as the age group rises, with a difference of up to six to seven percent between men and women in their 70s and 80s (Figure 1). Incidentally, the male poverty rate is higher than the female poverty rate only in the early 20s age group, but this is because of the sharp rise in the male poverty rate in this age group from the late 1990s.
62
Japanese Journal of Social Security Policy, Vol.9, No.1 (March 2012)

30%
25%
20%
15%
10%
5%
0%
20–2
5 yea
r old
25–2
9 yea
r old
30–34 y
ear o
ld
35–39
year
old
40–44
year
old
45–49
year
old
50–54 y
ear o
ld
55–59
year
old
60–64 y
ear o
ld
65–69
year
old
70–7
4 yea
r old
75–7
9 yea
r old
80 ye
ar old
or ov
er
Note: Figures 1 through 7 are calculated from the annual Comprehensive Survey of Living Conditions of the People on Health and Welfare (Ministry of Health, Labor and Welfare)
Source: Abe (2010)
Figure 1: Poverty rates classified by 5-year age bracket and sex (2007)
menwomen
30%
25%
20%
15%
10%
5%
0%1995 1998 2001 2004 2007
Source: Abe (2010)
Figure 2: The trend of poverty rates classified by sex and age bracket
20–64 year old (men)20–64 year old (women)65 year old or over (men)65 year old (women)
63
Japanese Journal of Social Security Policy, Vol.9, No.1 (March 2012)

45%
40%
35%
30%
25%
20%
15%
10%
5%
0%with spouse single widowed divorced
Source: Abe (2010)
Figure 3: Poverty rates of the working-age group(20–64 years old) classified by martal status and sex (1995 and 2007)
1995 men1995 women2007 men2007 women
Figure 2 shows changes in male and female poverty rates from 1995 to 2007. As seen in Figure 1, the poverty rate in Japan rises with age, so to separate the impact of the ageing of population, I divided the adult population into two groups—the 20 to 64 year old people of working-age and the elderly, aged over 65. This shows, among the latter group, a leveling out among women and a slight decline among males from the late 90s to late 2000s, and in the working-age group, an increase for both. The gender gap for the working-age group is constant at about 2 points, showing no widening, but neither does it show any signs of narrowing. The 5-point gender gap among the elderly is large in the first place, rising to above 6 points in 2004 and 2007. Since women have lon-ger life expectancy than men, the ageing of elderly population itself may be the cause of the gender gap in this age group to further widen.
<Marital Status>Next, we look at the poverty rate according to mar-ital status (Figures 3 and 4). Among the working-age group, the poverty rate is lowest for both men and women with spouses, with almost no change between 1995 and 2007. The lack of a gender gap
here can be explained, as previously noted, by the fact that male and female members of the same household are presumed to have the same standard of living. The poverty rate is next lowest among single men and women, and again, the gender gap is not large. In 2007, the poverty rate among single men rose to a level even higher than single women. The gender gap is largest when it comes to people who have been widowed or divorced. The poverty rate of women who have been widowed is high, but this decreased slightly from 1995 to 2007, and with the poverty rate of widowed men rising, the gender gap has narrowed. The poverty rate for both men and women who have divorced is highest, and there is a wide gender gap here. The poverty rate for divorced women is almost 40%, and though the number of divorced women rising from 1995 to 2007, there has been no change in the poverty rate over this period. The poverty rate for divorced men is particularly high compared to men in other marital statuses, and this increased 5 points from 1995 to 2007, bringing the rate to 25%. Thus, the gender gap between divorced men and divorced women is still large, but it decreased from 1995 to 2007.
64
Japanese Journal of Social Security Policy, Vol.9, No.1 (March 2012)

50%
45%
40%
35%
30%
25%
20%
15%
10%
5%
0%with spouse single widowed divorced
Source: Abe (2010)
Figure 4: Poverty rates of the elderly classified by marital status and sex (1995 and 2007)
1995 men1995 women2007 men2007 women
70%
60%
50%
40%
30%
20%
10%
0%
single
elde
rly
hous
ehold
of th
e elde
rly
Other h
ouse
holds
single
the elderly 20–64 years old children (20 years old or younger)
coup
le on
ly
coup
le with
unmarr
ied ch
ildren
Mother-
child
hous
ehold
Father-
child
hous
ehold
Three-ge
nerat
ion-fa
mily
Other h
ouse
holds
coup
le with
unmarr
ied ch
ildren
Mother-
child
hous
ehold
Father-
child
hous
ehold
Three-ge
nerat
ion-fa
mily
Other h
ouse
holds
Source: Abe (2010)
Figure 5: Poverty rates classified by age group and household type (2007)
menwomen
65
Japanese Journal of Social Security Policy, Vol.9, No.1 (March 2012)

45%
40%
35%
30%
25%
20%
15%
10%
5%
0%Mostly working mostly
housework but have a job
commute to school
stay-at-home others
Source: Abe (2010)
Figure 6: Poverty rates of the working age (20–64 years old) classified by employment status and sex (2007)
menwomen
mostly other than housework and commute to school but have
a job
mostly commute to school but have a job
<Household Type>Next, Figure 5 looks at the poverty rate accord-ing to household type. We can see that the female poverty rate is prominently high in the case of single-person households of elderly women and single mother households (working-age people with child/children). The poverty rate of women in such households is over 50%, which means that about one in two such household is poor. The high poverty rate of single-mother households is relatively well known even in Japan, but the situ-ation of single elderly women is virtually ignored up to now. We cannot overlook the poverty rate of working-age single women either, at over 30%. The poverty rate for single men is also high, but if we look at the gender gap, we can see that for single-person households, it is wide for both the elderly and people of working-age.
<Employment Status>Finally, Figures 6 and 7 calculate the poverty rate based on employment status. First of all, the poverty rate of working-age women that are either “mostly working,” “mostly housework but have a job,” or “stay-at-home” is almost the same across the board at 12 to 13 percent. In other words, hav-ing a job does not necessarily reduce the poverty risk of women. These poverty rates, however, are calculated for all women from 20 to 64 years old,
and there might be a big difference in poverty rates between working women and non-working women if the rates are calculated by smaller age groups. Among those mostly in school (students), both men and women’s poverty rates are high. The poverty rate is highest for stay-at-home men, with a big gap compared to stay-at-home females. These figures include both married and non-mar-ried people, but we can see that for stay-at-home women, it is likely that their household has bread-winner (most likely their husbands or fathers), but for stay-at-home men, even if their household might have income earner (like their wives), it is not likely that their household will have income above the poverty line. However, sample size of stay-at-home men is rather small.
Regarding the elderly, the female poverty rate is high regardless of their employment status. It is worth noting that the poverty rate of working elderly women is higher than for men. There has been recent awareness of the problem of the work-ing poor (those who remain poor despite working), but the policy discussion mainly focused on young men. However, the data shows that the working poor is more prevalent in women than men, and in elderly than in working-age population. Even though the number of working elderly women is small, the risk is greater.
66
Japanese Journal of Social Security Policy, Vol.9, No.1 (March 2012)

30%
25%
20%
15%
10%
5%
0%Mostly working mostly housework
but have a jobstay-at-home others
Source: Abe (2010)
Figure 7: Poverty rates of the elderly classified by employment status and sex (2007)
menwomen
mostly other than housework and
commute to school but have a job
Table 1: International comparison of the gender gap in poverty rates (25 to 54 years only) Mid-2000s
Male (M) Female (F) F-M Male (M) Female (F) F-MAnglophone Southern European
Australia 11.0 12.7 1.7 Greece 8.9 9.9 1.0 Canada 10.3 12.6 2.2 Italy 11.2 12.0 0.8 Ireland 10.6 13.5 2.9 Spain 8.3 10.2 1.9 United kingdom 8.5 11.0 2.5 average 9.4 10.7 1.2 United States 11.0 13.9 2.8 Latin America
average 10.3 12.7 2.4 Brazil 17.3 18.3 0.9 Continental European Colonbia 16.9 19.1 2.2
Austria 5.7 6.5 0.9 Guatemala 22.1 21.4 -0.8 Belgium 4.5 6.6 2.1 Mexico 17.1 17.4 0.3 France 5.0 6.2 1.2 Peru 21.9 22.3 0.4 Germany 5.4 7.1 1.7 Uruguay 14.9 15.5 0.6 Luxembourg 5.0 6.5 1.6 average 18.4 19.0 0.6 Netherlands 2.7 4.6 2.0
average 4.7 6.3 1.6 Nordic European Japan
Denmark 3.8 3.2 -0.6 1995 9.63 11.03 1.40 Finland 4.7 3.3 -1.5 1998 9.79 11.65 1.86 Norway 4.7 3.8 -1.0 2001 11.52 13.12 1.60 Sweden 5.4 5.0 -0.3 2004 10.04 11.94 1.90
average 4.7 3.8 -0.8 2007 10.96 12.61 1.65 Eastern European
Hungary 7.4 6.8 -0.6 average all years 10.39 12.07 1.68 Slovenia 7.3 5.8 -1.5
average 7.4 6.3 -1.1
Note: Japan data calculated by author from Abe (2010).
3) International comparison of the gender gap in poverty rates
67
Japanese Journal of Social Security Policy, Vol.9, No.1 (March 2012)

We next compare Japan’s poverty rate gender gap to other developed countries. Table 1 uses inter-national comparisons of the poverty rate in devel-oped countries for males and females based on the Luxembourg Income Study (LIS) from the early to mid-2000s, which is calculated by Gornick and Jantti (2001). The data for Japan was added by the author. To avoid reflecting differences in factors such as the country’s age composition, education and pension systems, the analysis focused on men and women of working-age, from ages 25 to 54 years. According to the classifications used by Gornick and Jantti (2010), in Anglo-Saxon coun-tries (Australia, Canada, Ireland, UK, USA), the poverty rate gender gap is generally large and the female poverty rate is 2.4 points higher than the male poverty rate on average. In Continental European countries (Austria, Belgium, France, Germany, Luxembourg, Holland), the gender gap is one to two points, with an average gap of 1.6 points. What is surprising is the situation in Northern European countries (Denmark, Finland, Norway, Sweden) and Eastern European countries (Hungary, Slovenia), where the male poverty rate is higher than the female rate, with an average gap in the former of 0.8 points, and in the latter, 1.1. A closer examination reveals that in North-ern European countries, the female poverty rate is higher than male poverty rate before redistribution (taxes, benefits, etc.), but lower after redistribution (disposable income). In other words, the govern-ment’s redistribution function is not only reducing the gender gap in the poverty rate, it is reversing it. In Eastern European countries, the female poverty rate is low even before redistribution, so it shows that it is not common in all countries that the female poverty risk is higher than for males. The gender gap is slightly less in Southern European countries (Greece, Italy, Spain) than Continental European countries, and in Latin American coun-tries (Brazil, Colombia, Guatemala, Mexico, Peru, Uruguay), excluding Colombia, the gap is under one point, showing an even smaller gender gap than Southern Europe. However, the poverty rate for both men and women is high in Latin American countries in the first place, such that the gender gap seems small when compared to it.
How does Japan fare? A look at the gender gap of the poverty rate from 1995 to 2007 shows it to be about the same level as the Continental Europe, with an average gap of 1.68 points. The poverty rate for both men and women, however, is higher than Continental Europe in the first place, and about the same as Anglo-Saxon countries. In other words, from the perspective of poverty risk, the risk for Japanese women is the same as
in Anglo-Saxon countries, but from the perspec-tive of the gender gap, it is similar to Continental Europe. This means that in terms of the working-age group, although the female poverty risk in Japan is as high as in Anglo-Saxon countries, the gender gap in poverty rates is being suppressed probably due to factors such as the much lower divorce rate, and high rate of single-women stay-ing with parents.
Japan’s poverty rate gender gap is, however, growing with ageing of society, so the situation may be very different in the case for the elderly. Unfortunately, Gornick and Jantti (2010) do not have any data regarding this, making such com-parison impossible.
2. The Feminization of Poverty(1) Is the feminization of poverty taking place? In Part 2, we saw that the poverty rate/low-income rate for women is higher, and particularly so in certain households (single mother and single-per-son female elderly households) where it climbs to over 50%. This can be termed as “povertization of women,” i.e. the increase of poor women among all women. On the other hand, the concept “femi-nization of poverty” as observed by D. Pearce (1978) was about increase of women among the poor. This is an important viewpoint in terms of policy making. Looking at what attributes can be observed among the poor, as opposed to what the attributes are of people with high poverty rates, is inevitable in determining the target of poverty alleviation policies. For example, if the poor are mostly elderly, labor related policies have limited effect. If the poor are mostly children, income guarantees targeting children such as child allow-ance are effective. In the same way, understanding the ratio of women among the poor is important and fundamental when considering gender-sensi-tive policy-making.
For demographic reasons such as women hav-ing a longer life expectancy than men, the percent-age of women in a population is slightly more than half. If there were no gender bias in poverty, there would be no difference between the percentage of women among the poor and the percentage of women in general population. Table 2 calculates the percentage of women among the poor accord-ing to age and compares it to the percentage of women in the population.
From 1995 to 2007, the percentage of women among the poor rose from 55.8% to 57.0%. In other words, the feminization of poverty can be noted to a certain extent. However, if we look at the increase according to age group, there is no consistency in the trend. Over the same time
68
Japanese Journal of Social Security Policy, Vol.9, No.1 (March 2012)
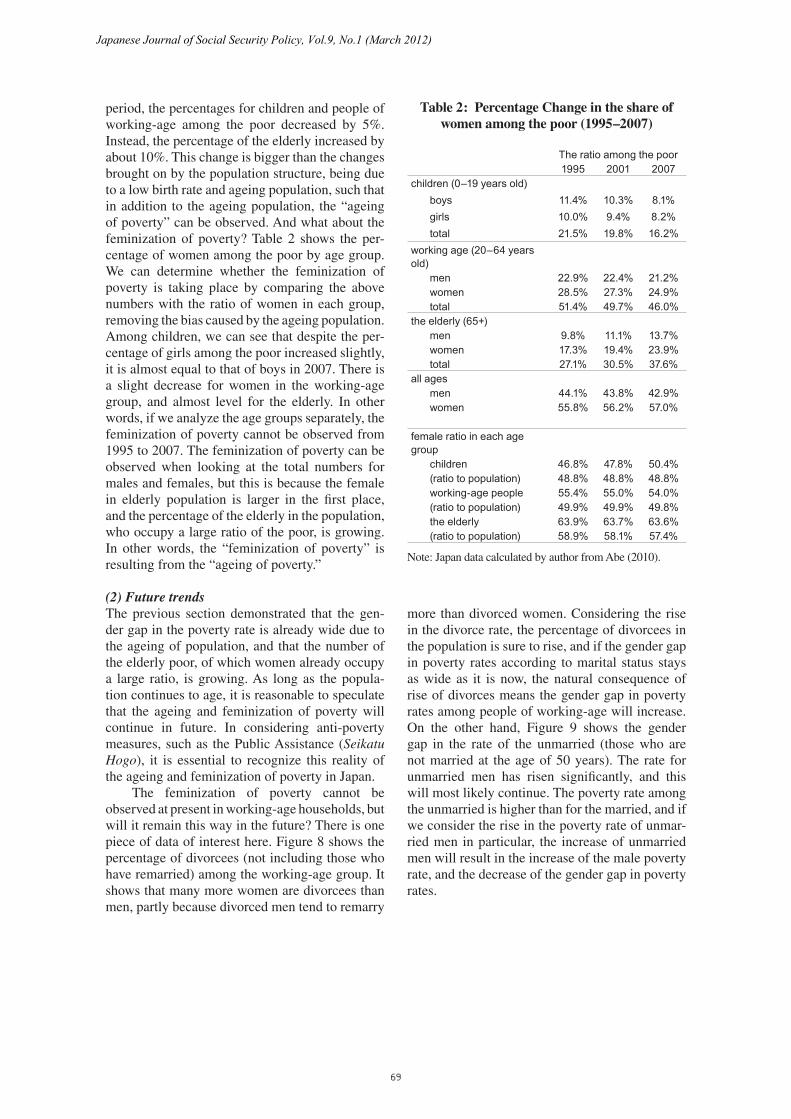
Table 2: Percentage Change in the share of women among the poor (1995–2007)
The ratio among the poor1995 2001 2007
children (0–19 years old)boys 11.4% 10.3% 8.1%girls 10.0% 9.4% 8.2%total 21.5% 19.8% 16.2%
working age (20–64 years old)
men 22.9% 22.4% 21.2%women 28.5% 27.3% 24.9%total 51.4% 49.7% 46.0%
the elderly (65+)men 9.8% 11.1% 13.7%women 17.3% 19.4% 23.9%total 27.1% 30.5% 37.6%
all agesmen 44.1% 43.8% 42.9%women 55.8% 56.2% 57.0%
female ratio in each age group
children 46.8% 47.8% 50.4%(ratio to population) 48.8% 48.8% 48.8%working-age people 55.4% 55.0% 54.0%(ratio to population) 49.9% 49.9% 49.8%the elderly 63.9% 63.7% 63.6%(ratio to population) 58.9% 58.1% 57.4%
Note: Japan data calculated by author from Abe (2010).
period, the percentages for children and people of working-age among the poor decreased by 5%. Instead, the percentage of the elderly increased by about 10%. This change is bigger than the changes brought on by the population structure, being due to a low birth rate and ageing population, such that in addition to the ageing population, the “ageing of poverty” can be observed. And what about the feminization of poverty? Table 2 shows the per-centage of women among the poor by age group. We can determine whether the feminization of poverty is taking place by comparing the above numbers with the ratio of women in each group, removing the bias caused by the ageing population. Among children, we can see that despite the per-centage of girls among the poor increased slightly, it is almost equal to that of boys in 2007. There is a slight decrease for women in the working-age group, and almost level for the elderly. In other words, if we analyze the age groups separately, the feminization of poverty cannot be observed from 1995 to 2007. The feminization of poverty can be observed when looking at the total numbers for males and females, but this is because the female in elderly population is larger in the first place, and the percentage of the elderly in the population, who occupy a large ratio of the poor, is growing. In other words, the “feminization of poverty” is resulting from the “ageing of poverty.”
(2) Future trends The previous section demonstrated that the gen-der gap in the poverty rate is already wide due to the ageing of population, and that the number of the elderly poor, of which women already occupy a large ratio, is growing. As long as the popula-tion continues to age, it is reasonable to speculate that the ageing and feminization of poverty will continue in future. In considering anti-poverty measures, such as the Public Assistance (Seikatu Hogo), it is essential to recognize this reality of the ageing and feminization of poverty in Japan.
The feminization of poverty cannot be observed at present in working-age households, but will it remain this way in the future? There is one piece of data of interest here. Figure 8 shows the percentage of divorcees (not including those who have remarried) among the working-age group. It shows that many more women are divorcees than men, partly because divorced men tend to remarry
more than divorced women. Considering the rise in the divorce rate, the percentage of divorcees in the population is sure to rise, and if the gender gap in poverty rates according to marital status stays as wide as it is now, the natural consequence of rise of divorces means the gender gap in poverty rates among people of working-age will increase. On the other hand, Figure 9 shows the gender gap in the rate of the unmarried (those who are not married at the age of 50 years). The rate for unmarried men has risen significantly, and this will most likely continue. The poverty rate among the unmarried is higher than for the married, and if we consider the rise in the poverty rate of unmar-ried men in particular, the increase of unmarried men will result in the increase of the male poverty rate, and the decrease of the gender gap in poverty rates.
69
Japanese Journal of Social Security Policy, Vol.9, No.1 (March 2012)

9%
8%
7%
6%
5%
4%
3%
2%
1%
0%
15–1
920
–24
25–2
930
–3435
–3940
–4445
–4950
–5455
–5960
–6465
–6970
–74
75+
Source: Ministry of Internal Affairs and Communications, Statistics Bureau Census 2004, Table 4-4
Figure 8: Percentage of the divorced, according to sex and age group (2005)
menwomen
18%
16%
14%
12%
10%
8%
6%
4%
2%
0%1970 1975 1980 1985 1990 1995 2000 2005
Source: National Institute of Population and Social Security Research, Population Statistics 2010.
Figure 9: Percentage of unmarried during his/her life-cycle, according to sex
menwomen
70
Japanese Journal of Social Security Policy, Vol.9, No.1 (March 2012)

3. Social Exclusion from the Perspective of Gender
(1) Social Exclusion From here, the paper will focus on social exclu-sion, often discussed in tandem with poverty, from the perspective of gender. Let us begin by reaf-firming the definition of social exclusion from the perspective of gender.
The notion of social exclusion first emerged in France to supplement the idea of poverty, which often referred to a lack of financial resources, with a more multifaceted concept that was later incorporated into the social policies of various countries. In France, Revenu minimum d’insertion (RMI, meaning “minimum integration income”), which put forward the idea of social inclusion in social policy, was introduced in 1988, and an anti-social exclusion law was established in 1998. In the UK, the Social Exclusion Unit was estab-lished in the Cabinet Office (1999). At its Lisbon Summit in 2000, the European Commission (EC) made it compulsory for member states to estab-lish a National Action Plan for Social Inclusion to Combat Poverty and Social Exclusion. In Japan, (former) Prime Minister Kan initiated the launch of the Task Force Team for Inclusive Society in January 2011 and then established Unit for Pro-motion of Social Inclusion in the Cabinet Office in April 2011 2).
Even so, in Japan, there has been no formal definition of “social exclusion” and politicians, bureaucrats and activists are using the term in vari-ous contexts (Fukuhara 2007, Iwata 2008). There are writers more authoritative on this topic (e.g. Fukuhara 2007, Iwata 2008), which can be referred to by the reader. We confirm here, for understand-ing of the basics, the difference between poverty and social exclusion. We begin by looking at the definition of social exclusion as written in a 1992 EC document:
“The concept of social exclusion is a dynamic one, referring both to processes and consequent situations…. More clearly than the concept of poverty, understood far too often as referring exclusively to income, it also states out the multidimensional nature of the mechanisms whereby individuals and groups are excluded from taking part in the social exchanges, from the component practices and rights of social integration and of identity. Social exclusion does not only mean insufficient income, and it even goes beyond participation in working life: it is felt and shown in the fields of hous-ing, education, health and access to services” (EC 1992, “Towards a Europe of Solidarity:
Intensifying the fight against social exclusion, fostering integration,” in Fukuhara 2010)
As seen from this, the greatest difference between poverty and social exclusion is, first of all, that social exclusion more clearly addresses the lack of relations, such as social support and participation, than the conventional understanding of poverty. The lack of social relations and social participation has been brought up in relation to poverty, but the main concern was to understand how the lack of resources leads to the lack of social relations 3). Social exclusion is new in that the lack of social relations is understood independently from lack of resources. The second characteristic of social exclusion is that compared to poverty, which is a term to describe a status of an indi-vidual, social exclusion focuses on the mechanism or process of how an individual is being excluded. In other words, it questions what is and how it is excluding; such as what social mechanism or pol-icy is the cause of an individual being excluded. For example, how individuals are left out of social security system or labor market is of great interest in understanding social exclusion. Finally, social exclusion concerns the link between the individual and society: What social construct does the indi-vidual belong to or is he/she a member of, and is he/she recognized as a social citizen?
(2) Paid and unpaid work Several potential problems arise when applying this concept of social exclusion to women. First prob-lem concerns the position of women in the labor market. The quality of integration into the labor market —unemployment and job instability— is at the foundation of how the social exclusion is understood (Fukuhara 2007: 16). This is linked to the development of the concept of social exclusion in France, which began with the problems faced by the long-term unemployed. The work (labor) is simply a way to earn living expenses, but rather that labor in itself is a way for social participation, “Work” provides opportunity to interact with oth-ers and give people a “role” in society. In other words, even if, for example, a person is not fac-ing any financial difficulties, exclusion from the labor market (unemployment or being on welfare) implies the loss of opportunities for social relations and social participation, and being pushed to the margins of society. The most typical case of social exclusion is exclusion from the labor market.
This explanation, however, is easy to compre-hend in terms of working-age men, but for work-ing-age women or the elderly, it is not so clear-cut. For women, paid work in the labor market is not
71
Japanese Journal of Social Security Policy, Vol.9, No.1 (March 2012)

anything more than a choice among many other activities. Many women, especially in Japan, are engaging in other activities broadly categorized as “unpaid work.” Such activities include caring for children and elderly at home, and activities in the community (e.g. PTA and neighborhood associa-tion involvement) or the household chores. There are, of course, cases of men taking on unpaid work in the home or community, but this ratio and extent is small in comparison with women. Should such activities counted as social participation or as being excluded from the paid work in the labor market?
Here, some insights from other country are useful. In a series of trials to measure social exclusion in the UK, “participation” and “exclu-sion” was redefined in this way: “An individual is socially excluded if he or she does not participate in key activities of the society in which he or she lives” (Burchardt, Le Grand et al. 2002; Houston 2007).
“Key activities” are divided into four areas—consumption, production, political engagement and social interaction—and the activities of women in each area analyzed. Production included labor, and domestic work as a “socially valued activity” (Burchardt, Le Grand et al. 2002). However, it was later pointed out (Houston 2007), that 21st Century UK does not place much value in domes-tic work, and that it is not a “key activity.” The problem of the social exclusion of women in the area of production is considered grave for many reasons: The ratio of women engaged in paid work in the “socially valued” labor market is less than men; Even if they are in paid work, the wages they receive for their labor are less than men; Women have a lesser status than men in the labor market; The range of job types for women in the labor market is smaller than for men (Houston 2007).
Like the UK, it cannot be said that domestic work in Japan is considered a “socially valued activity” in the same way as paid work. Further, the situation of women in the labor market is also similar, if not worse. However, treating detach-ment from the labor market or working for low wages (e.g. part-time) as social exclusion may stir some disagreement. As we saw in the above analy-sis of low income (Figures 6 and 7), for women, detachment from the labor market is not necessar-ily linked with poverty. We can imagine a stigma attached to not being in the labor market (i.e. not having a paid job) for men, but for women, what kind of activities are considered “socially valued”? There is no easy way to determine this.
(3) Social exclusion of women as a groupA second problem that arises when analyzing the social exclusion of women is whether to ana-lyze the women as individuals or as a group. For example, let’s use the participation of a woman in her neighborhood association as an indicator of social exclusion from a community participation perspective. In many communities, the majority of men participate in neighborhood associations (Chonai-kai), and the majority of women partici-pate in groups limited to women, such as women’s associations. Here, all men participate in typical men’s activities and all women in typical women’s activities in the community, and at the individual level, probably neither men nor women would be judged as socially excluded. However, if all impor-tant decisions about the community are made at meetings that only men take part in, and no women are present, all women in that community could be interpreted as being excluded from social participation as a group. This example applies to foreign nationals and other ethnic minorities, as well. Even if the group is socially excluded from Japanese society as a whole, the individual may not be excluded within his/her smaller group (soci-ety). Should we understand this situation as social exclusion, or as something different, for example, segregation? How should we interpret the reality that as a group, women comprise the majority of the population and are the majority by headcount, yet men make most of the decisions in society? Again, this is not an easy question.
4. The Gender gap in Social Exclusion (1) Data Although there are such conceptual problems with what indicators to use to determine the social exclusion of women, in this section, the paper will attempt to analyze the gender gap of social exclu-sion in Japan. The data used is the 2008 Social Life Survey 4), which was prepared by the author and conducted in February 2009, targeting a ran-dom sample of 1,320 adult males and females nationwide. Valid samples collected numbered 1,021, with an effective response rate of 77%. The survey differs from others in that its sole purpose was to identify status of social exclusion in ways discussed below. Firstly, it looks not only at lack of economic resources but also lack of social rela-tions and participation. More concretely, it includes social relations indicative questions, such as the lack of social capital (people who will help when in need). Secondly, it determines exclusion from various public systems and services in the soci-ety, such as social insurances (health, pension and long-term care) and government services (access
72
Japanese Journal of Social Security Policy, Vol.9, No.1 (March 2012)

to public services, libraries, sports facilities, etc.). Thirdly, the survey examines the relationship of an individual to not only the public constructs but also to the indivudal constructs such as the frequency of communication with friends and acquaintances and attachment to personal network of family and friends (e.g. attendance of ceremonial functions), to determine whether there is exclusion in the private sphere. Fourthly, the survey also looks at individual’s participation in the society, such as voting, volunteer work and community activities (e.g. PTA, neighborhood associations).
The survey asserted that what is “lacking” in each area is involuntary, and not by preference. It is only then that we can ensure it is an “enforced lack”—an important pillar of the concept of social exclusion. In addition, the survey specifically tried to capture an involuntary “lack” caused by non-financial reasons as well as financial reasons. For example, constraints can be physical or health-related, time-related, geography-related (such as lack of access due to distance), or brought on by social norms such as negative public image.
(2) Method of analysis This paper follows in the wake of previous studies in Europe and analyzed social exclusion in eight dimensions considered to be the fundamental axes of social exclusion. These are: lack of basic human needs, material deprivation, exclusion from systems and services, lack of social relations (network), inadequate housing, lack of social par-ticipation, subjective poverty, and relative poverty (based on income data). In each dimension, the social exclusion rate is calculated using data from a number of survey items, of which total about 50 in number. Appendix 1 is a list of the items, their content and the exclusion rate. Appendix 2 shows basic statistics gathered for the indexes of the eight dimensions. The social exclusion rate refers to the ratio of respondents who are above the standard exclusion cut-off point, measured by the number of items they mark as relevant in each area. What must be borne in mind is that the absolute value of the exclusion rate does not shed much light: it can easily change based on the number and choice of items used for each dimension. For example, the exclusion rate for one dimension will decrease significantly if you swap items that are relatively more available for ones that are less so. That is, the
exclusion rate is influenced by the items selected for the list. However, it is possible to compare exclusion rate between two or more groups of individuals. This paper compares men and women in terms of their social exclusion rate for each of the eight dimensions and deliberate whether gen-der gaps exist.
Two methods for analysis are used. First, respondents are divided according to sex, age group, household type (e.g. single-person elderly household, single working age household), employment status (full-time employment, non-regular employment, self-employed, retiree, homemaker, unemployed (meaning unemployed and looking for work and excludes housewives, househusbands, students and retirees)), academic background (junior high, senior high, technical college, junior college or university graduate), marital status (married, single, divorced or wid-owed). The social exclusion rate is then calculated for each of the eight dimensions, and the attributes of people in high or low social exclusion risk groups are identified.
Next, the paper analyzes the gender gaps in the social exclusion rates according to attribute. For example, is there a gender gap in the social exclusion risk for men and women in their 20s? Is there a gender gap in the social exclusion risk for men and women who are divorced, or in non-regular employment? Through this, the paper tries to discern whether being male or female has a dif-ferent impact under the same situations.
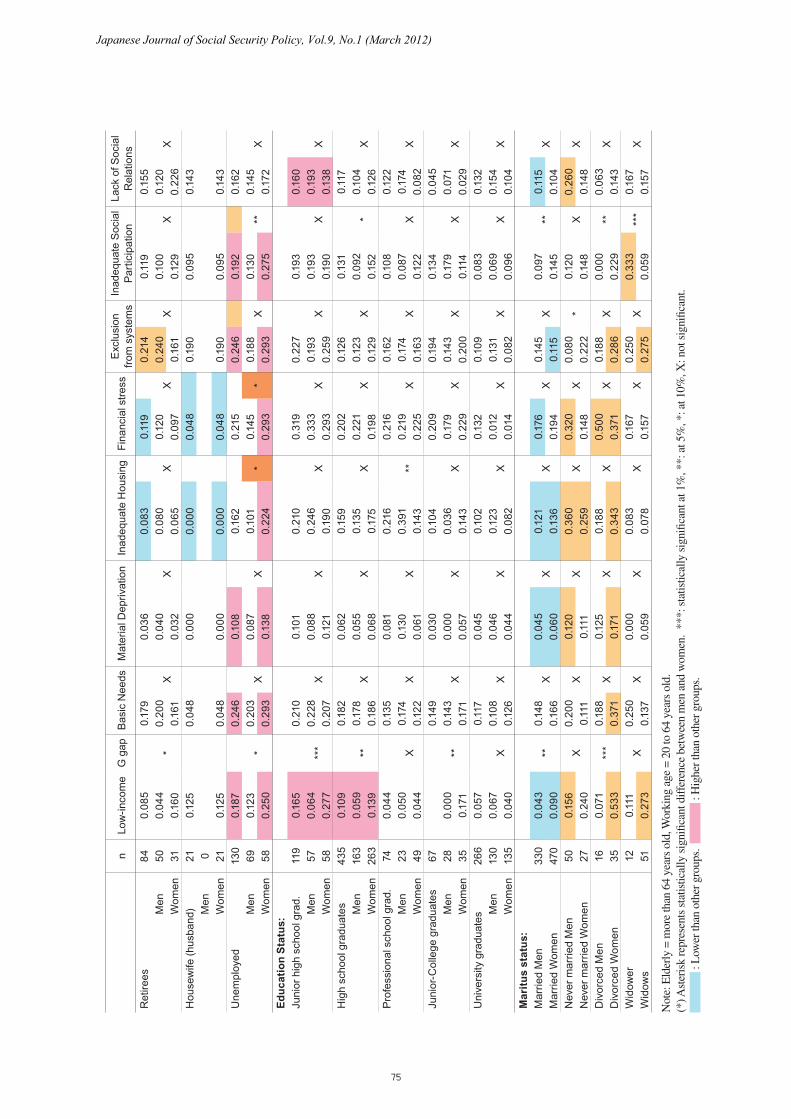
Table 3 shows the results. The colored cells show a statistically-significant difference (chi-square test, p<0.1) between individuals with the particular attribute and all other respondents. Blue cells indicate that the exclusion rate is statistically significantly lower, and orange cells, higher. For example, the cell for 20 – 29 year-old men with low income is orange, showing a statistically-significant difference between the exclusion rate for the 20 – 29 year-old male group and that for the rest of the sample (including 20 – 29 year-old females). The sign to the right of each area shows the gender gap ascertained for that attribute, with a star if statistically-significant and an x-mark if not. Please note that because the sample is small, it may not be possible to ascertain a statistically significant result for some attributes.
73
Japanese Journal of Social Security Policy, Vol.9, No.1 (March 2012)

Tab
le 3
: So
cial
Exc
lusi
on R
ate,
by
gend
er a
nd b
y at
trib
utes
nLo
w-in
com
eG
gap
Bas
ic N
eeds
Mat
eria
l Dep
rivat
ion
Inad
equa
te H
ousi
ngFi
nanc
ial s
tress
Exc
lusi
on
from
sys
tem
sIn
adeq
uate
Soc
ial
Parti
cipa
tion
Lack
of S
ocia
l R
elat
ions
All
sam
ple
0.10
9 0.
166
0.06
3 0.
149
0.20
0 0.
145
0.12
5 0.
120
(All)
men
410
0.05
9 **
*0.
159
X0.
056
X0.
154
X0.
205
X0.
141
X0.
102
*0.
132
X(A
ll) w
omen
585
0.13
9 0.
174
0.06
8 0.
149
0.19
8 0.
144
0.14
2 0.
113
Age
cat
egor
y:20
– 29
’sM
en31
0.22
2 X
0.22
6 X
0.12
9 X
0.38
7 X
0.25
8 X
0.16
1 X
0.09
7 X
0.12
9 X
Wom
en50
0.19
2 0.
240
0.22
0 0.
300
0.24
0 0.
080
0.20
0 0.
060
30 –
39’s
Men
890.
035
**0.
157
X0.
067
X0.
214
X0.
258
X0.
112
X0.
045
*0.
146
XW
omen
133
0.10
9 0.
196
0.05
3 0.
165
0.21
1 0.
158
0.12
0 0.
083
40 –
49’s
Men
660.
016
***
0.09
1 **
0.03
0 X
0.13
6 X
0.25
8 X
0.03
0 X
0.15
2 X
0.12
1 X
Wom
en13
30.
142
0.21
1 0.
075
0.13
5 0.
256
0.08
3 0.
128
0.14
3 50
– 59
’sM
en69
0.03
2 **
0.14
5 X
0.02
9 X
0.11
6 X
0.17
4 X
0.11
6 X
0.13
0 X
0.15
9 X
Wom
en11
40.
126
0.13
2 0.
044
0.13
2 0.
167
0.13
2 0.
123
0.09
7 60
– 69
’sM
en75
0.09
2 X
0.20
0 X
0.06
7 X
0.12
0 X
0.20
0 X
0.26
7 X
0.10
7 X
0.12
0 X
Wom
en10
00.
167
0.15
0 0.
050
0.12
0 0.
150
0.19
0 0.
140
0.16
0 >7
0M
en77
0.06
3 X
0.16
7 X
0.05
2 X
0.07
8 X
0.10
4 **
0.16
9 X
0.10
4 *
0.11
7 X
Wom
en52
0.10
8 0.
115
0.03
9 0.
077
0.15
4 0.
269
0.23
1 0.
115
Hou
seho
ld ty
pes:
Sin
gle-
pers
on E
lder
ly45
0.06
7 0.
156
0.02
2 0.
156
0.11
1 0.
289
0.08
9 0.
067
Men
150.
000
X0.
133
X0.
000
X0.
067
X0.
133
X0.
200
X0.
133
X0.
000
XW
omen
280.
095
0.14
3 0.
036
0.17
9 0.
107
0.28
6 0.
071
0.10
7 S
ingl
e-pe
rson
Wor
king
age
112
0.13
4 0.
143
0.09
8 0.
295
***
0.25
0 0.
143
0.09
8 0.
179
Men
540.
080
X0.
167
X0.
111
X0.
389
***
0.29
6 X
0.07
4 **
0.09
3 X
0.25
9 *
Wom
en42
0.17
5 0.
143
0.09
5 0.
262
0.21
4 0.
238
0.14
3 0.
119
Empl
oym
ent s
tatu
s:Fu
ll-tim
e (re
gula
r)50
40.
047
0.12
9 0.
052
0.15
7 0.
175
0.10
3 0.
107
0.10
7 M
en19
90.
021
**0.
111
X0.
040
X0.
186
X0.
186
X0.
121
X0.
096
X0.
126
XW
omen
301
0.06
4 0.
143
0.06
0 0.
140
0.16
6 0.
093
0.11
6 0.
093
Non
-reg
ular
em
ploy
men
t91
0.24
7 0.
242
0.09
9 0.
165
0.31
9 0.
165
0.15
4 0.
165
Men
310.
172
X0.
290
X0.
129
X0.
161
X0.
387
X0.
129
X0.
194
X0.
226
XW
omen
540.
275
0.24
1 0.
093
0.18
5 0.
315
0.20
4 0.
130
0.13
0 S
elf-e
mpl
oyed
131
0.06
8 0.
168
0.03
8 0.
168
0.29
0 0.
137
0.12
2 0.
084
Men
490.
000
**0.
184
X0.
041
X0.
184
X0.
347
X0.
082
X0.
061
X0.
122
XW
omen
790.
113
0.16
5 0.
038
0.16
5 0.
253
0.15
2 0.
152
0.06
3
74
Japanese Journal of Social Security Policy, Vol.9, No.1 (March 2012)
nLo
w-in
com
eG
gap
Bas
ic N
eeds
Mat
eria
l Dep
rivat
ion
Inad
equa
te H
ousi
ngFi
nanc
ial s
tress
Exc
lusi
on
from
sys
tem
sIn
adeq
uate
Soc
ial
Parti
cipa
tion
Lack
of S
ocia
l R
elat
ions
Ret
irees
840.
085
0.17
9 0.
036
0.08
3 0.
119
0.21
4 0.
119
0.15
5 M
en50
0.04
4 *
0.20
0 X
0.04
0 X
0.08
0 X
0.12
0 X
0.24
0 X
0.10
0 X
0.12
0 X
Wom
en31
0.16
0 0.
161
0.03
2 0.
065
0.09
7 0.
161
0.12
9 0.
226
Hou
sew
ife (h
usba
nd)
210.
125
0.04
8 0.
000
0.00
0 0.
048
0.19
0 0.
095
0.14
3 M
en0
Wom
en21
0.12
5 0.
048
0.00
0 0.
000
0.04
8 0.
190
0.09
5 0.
143
Une
mpl
oyed
130
0.18
7 0.
246
0.10
8 0.
162
0.21
5 0.
246
0.19
2 0.
162
Men
690.
123
*0.
203
X0.
087
X0.
101
*0.
145
*0.
188
X0.
130
**0.
145
XW
omen
580.
250
0.29
3 0.
138
0.22
4 0.
293
0.29
3 0.
275
0.17
2 Ed
ucat
ion
Stat
us:
Juni
or h
igh
scho
ol g
rad.
119
0.16
5 0.
210
0.10
1 0.
210
0.31
9 0.
227
0.19
3 0.
160
Men
570.
064
***
0.22
8 X
0.08
8 X
0.24
6 X
0.33
3 X
0.19
3 X
0.19
3 X
0.19
3 X
Wom
en58
0.27
7 0.
207
0.12
1 0.
190
0.29
3 0.
259
0.19
0 0.
138
Hig
h sc
hool
gra
duat
es43
50.
109
0.18
2 0.
062
0.15
9 0.
202
0.12
6 0.
131
0.11
7 M
en16
30.
059
**0.
178
X0.
055
X0.
135
X0.
221
X0.
123
X0.
092
*0.
104
XW
omen
263
0.13
9 0.
186
0.06
8 0.
175
0.19
8 0.
129
0.15
2 0.
126
Prof
essi
onal
sch
ool g
rad.
740.
044
0.13
5 0.
081
0.21
6 0.
216
0.16
2 0.
108
0.12
2 M
en23
0.05
0 X
0.17
4 X
0.13
0 X
0.39
1 **
0.21
9 X
0.17
4 X
0.08
7 X
0.17
4 X
Wom
en49
0.04
4 0.
122
0.06
1 0.
143
0.22
5 0.
163
0.12
2 0.
082
Juni
or-C
olle
ge g
radu
ates
670.
149
0.03
0 0.
104
0.20
9 0.
194
0.13
4 0.
045
Men
280.
000
**0.
143
X0.
000
X0.
036
X0.
179
X0.
143
X0.
179
X0.
071
XW
omen
350.
171
0.17
1 0.
057
0.14
3 0.
229
0.20
0 0.
114
0.02
9 U
nive
rsity
gra
duat
es26
60.
057
0.11
7 0.
045
0.10
2 0.
132
0.10
9 0.
083
0.13
2 M
en13
00.
067
X0.
108
X0.
046
X0.
123
X0.
012
X0.
131
X0.
069
X0.
154
XW
omen
135
0.04
0 0.
126
0.04
4 0.
082
0.01
4 0.
082
0.09
6 0.
104
Mar
itus
stat
us:
Mar
ried
Men
330
0.04
3 **
0.14
8 X
0.04
5 X
0.12
1 X
0.17
6 X
0.14
5 X
0.09
7 **
0.11
5 X
Mar
ried
Wom
en47
00.
090
0.16
6 0.
060
0.13
6 0.
194
0.11
5 0.
145
0.10
4 N
ever
mar
ried
Men
500.
156
X0.
200
X0.
120
X0.
360
X0.
320
X0.
080
*0.
120
X0.
260
XN
ever
mar
ried
Wom
en27
0.24
0 0.
111
0.11
1 0.
259
0.14
8 0.
222
0.14
8 0.
148
Div
orce
d M
en16
0.07
1 **
*0.
188
X0.
125
X0.
188
X0.
500
X0.
188
X0.
000
**0.
063
XD
ivor
ced
Wom
en35
0.53
3 0.
371
0.17
1 0.
343
0.37
1 0.
286
0.22
9 0.
143
Wid
ower
120.
111
X0.
250
X0.
000
X0.
083
X0.
167
X0.
250
X0.
333
***
0.16
7 X
Wi d
ows
510.
273
0.13
7 0.
059
0.07
8 0.
157
0.27
5 0.
059
0.15
7
Not
e: E
lder
ly =
mor
e th
an 6
4 ye
ars
old,
Wor
king
age
= 2
0 to
64
year
s ol
d.(*
) Ast
eris
k re
pres
ents
sta
tistic
ally
sig
nific
ant d
iffer
ence
bet
wee
n m
en a
nd w
omen
. **
*: s
tatis
tical
ly s
igni
fican
t at 1
%, *
*: a
t 5%
, *: a
t 10%
, X: n
ot s
igni
fican
t. :
Low
er th
an o
ther
gro
ups.
:
Hig
her t
han
othe
r gro
ups.
75
Japanese Journal of Social Security Policy, Vol.9, No.1 (March 2012)

(3) Gender gap by age groupLet us first examine whether there is a difference between all men and all women in each of the eight dimensions. Women have higher exclusion rate in five dimensions: low income, lack of basic needs, material deprivation, exclusion from sys-tems and services, and lack of social participation. The male exclusion rate is conversely higher for the dimensions of inadequate housing, economic stress, and lack of social relations. However, only dimensions of low income and social participation are of statistical significance, with no significant gender gap in other areas.
However, a more detailed look at the table reveals a big difference in the exclusion risk patterns of men and women. Males and females in their 20s both have a high exclusion rate for dimensions that are more financial in nature, such as low income, material deprivation and housing inadequacy, but not for non-money-related dimen-sions such as exclusion from systems and services, social participation and social relations. No statis-tically significant gender gap can be observed in any area for this age group. Moving on to the 30s, the male risk for low income decreases and a gen-der gap emerges, continuing into the 40s and 50s, and a statistically significant gap again disappears from the 60s. Even in other areas, the exclusion rate for males in their 30s is generally low, even lower than females in their 30s in the dimension of social participation.
In the 40s, male dominance is clear in finan-cial-related areas such as low income and basic needs. In other dimensions, however, such a gen-der gap is not apparent. Exclusion from systems and services is low for both men and women in their 40s compared to other age groups, showing that there is a relatively lower social exclusion risk for both sexes in this age group.
For the 50s, similar to the 40s age group, men continue to have a lower risk of low income than women, but a significant gender gap is not recognized in other dimensions. In an analysis by the author based on a previous survey, the social exclusion rate for men in their 50s was identified as high (Abe 2007), but this was not seen in the current survey. Despite not being statistically-significant, however, the high exclusion rate for men in their 50s in the social relations is of great interest.
Worth noting is that the exclusion rate for men in their 60s is high in the area of systems and services. The rate is also high for women in their 60s, so that the gender gap is not statistically significant, but there is a statistically significant gap when comparing men in their 60s to all other
respondents in general. The female exclusion rate becomes higher
in several areas when it comes to women in their 70s. The gender gap is statistically significant in the areas of economic stress and social participa-tion, and the exclusion rate is higher than the rest of society in terms of exclusion from systems and services.
(4) Gender gap by household type Next, let us look at the differences that emerge between household types. Single-person elderly households and working-age households in par-ticular are high-risk groups. There is a high rate of exclusion from systems in single-person elderly households, and this is the same for men and women (no statistically significant gender gap). The risk is high when it comes to single working-age households. This is particularly so for both men and women in terms of inadequate housing, but it is statistically significantly higher for men than women. Regarding social relations, the risk is high for male single-person households in the working-age group, which cannot be observed among women of the same. Conversely, exclusion from systems and services for female single-per-son households in the working age group is nota-ble, which is not seen among male single-person households for both elderly and working age.
(5) Gender gap by employment statusA look at the exclusion rate by employment status reveals first and foremost how low the exclusion risk is for those in full-time employment. This is particularly so in terms of women in full-time employment compared to all other women, and a statistically significant low rate can be observed even for non-financial-related dimensions. The reverse is true for those in non-regular employ-ment. There is a high exclusion risk of low income, basic needs, and economic stress. Comparing men and women in non-regular employment reveals no statistically significant gap, but the male exclusion rate is mostly higher, with especially high-risk for men in non-regular employment in terms of eco-nomic stress and social relations.
The highest risk is observed for the unem-ployed, and among them, the exclusion risk for females is higher than other respondents in seven of the eight areas (excluding social relations). This trend cannot be observed among male unem-ployed. It seems that adverse effects of dropping out of the labor market, is more serious for women compared to men.
The sample for housewives was small, mak-ing an analysis difficult, but the social exclusion
76
Japanese Journal of Social Security Policy, Vol.9, No.1 (March 2012)

risk is generally low for this group. As with the poverty rate according to income, being a house-wife, i.e. voluntarily exiting the labor market with the security of a husband’s income, does not lead to social exclusion.
(6) Gender gap by marital status Next, looking at marital status, we first note that the exclusion risk for divorced women is extremely high, extending into many dimensions. The exclu-sion rate is statistically significantly higher than the rest of the sample throughout, other than for social participation and social relations. Even in these two dimensions, where it is not statistically significantly, the rate is still high. It is evident how such women risk social exclusion in mul-tiple dimensions. The exclusion risk if high for divorced men in some dimensions, in particular financial stress. However, the sample of divorced men is rather small to draw conclusions. The risk is low for both married men and women, and mar-ried women in particular for all dimensions. The risk is higher among never married (single) men in five of eight dimensions. Even compared to divorced men, the exclusion rate for single men is high in many areas, in particular regarding social relations, with a risk that is prominently higher than other areas.
(7) Gender gap and Education status Whether there is a gender gap between men and women of the same education status was one of the questions the paper was set to answer, how-ever, the answer could not be obtained. The table reveals that in areas other than low income, there were hardly any attributes whereby a gender gap could be observed.
5. Policy ImplicationsDrawing on data, this paper has provided an over-view of the situation of poverty and social exclu-sion among women in Japan. Based on results, I would like to conclude with a number of policy implications. First, it should be pointed out that there must be a clearer awareness of the feminiza-tion of poverty when discussing policy options for poverty alleviation. Although the “povertization”
of women is also an issue that requires attention, the issue of the feminization of poverty is falling through the cracks in current policy debates on poverty. Anti-poverty measures without consider-ation of the fact that almost 60% of those affected are women (Table 2) cannot be effective. At the same time, the ageing of the poverty is also an important perspective. As Table 2 shows, the ratio of women among Japan’s poor is slowly rising, but this increase is mainly brought on by ageing of the population, and the ratio of elderly women among all poor is rapidly increasing. The ratio of women above 65 years among the poor was 17.3% in 1995, rising to 23.9% in 2007. To resolve the issue of poverty, policy debates on income security for the elderly, such as the public pension system, cannot be avoided.
Next, learning from results of the analysis on social exclusion, first, the social exclusion of both young males and females, particularly those who are single, may become more of a social problem in the future. For working-age never-married men and single-person households in particular, the social exclusion risk is high, even in the dimen-sion of social relations. Next, social exclusion is extremely high among the unemployed (not including housewives, students or retirees), and further, I want to call attention in particular to the noticeable trend among women. In this attribute-based analysis, the social exclusion risk for women in this category is highest, and they face multiple risks.
As previously mentioned, in measuring the social exclusion of women, it is necessary to further deliberate whether an analysis at an indi-vidual level such as that introduced here is telling the whole story. Even if they form a majority by headcount, it is important to add a multi-leveled analysis in discussing the situation of women in a position of disadvantage as a group. Houston (2007) argues that women are socially excluded based on data at the national level about the per-centage of women in public office and the wage gap. I end this paper by bringing attention to the need to incorporate this type of national-level data in debates about social exclusion and consider this point in future research.
77
Japanese Journal of Social Security Policy, Vol.9, No.1 (March 2012)

Appendix 1: The item used for the social exclusion index, and its exclusion rate
Deprivation Rate
Economic Reasons
2006 Kawasaki
Survey
1. Basic Human Needs
1 Food
They cannot buy the food which a family needs for a pocketbook reason. (those cases of “it is often,” “it being sometimes,” and “it being rarely” for the past one year)
6.5% 6.5% 10.3%
They cannot eat three per day. 1.1% 1.1% not available
2 Clothing
They cannot buy the clothing which a family needs for a pocketbook reason. (those cases of “it is often,” “it being sometimes,” and “it being rarely” for the past one year)
14.7% 14.7% 19.4%
They cannot buy new underwear even once a year.
3.8% 3.8% didn’t use
3 Health care service
They cannot consult a doctor for an economical reason, when required.
1.8% 1.8% 2.2%
They cannot consult a dentist for an economical reason, when required.
3.0% 3.0%
2. Material Deprivation
Consumers’ durables
They cannot have one or more of the following nine items for a pocketbook reason.
(All the nine items are those items that are supported by not less than 50% of average citizens as social necessaries)
Television 0.1% 0.1% 0.5%Refrigerator 0.0% 0.0% 0.5%Microwave oven 0.5% 0.5% 2.1%Air conditioning apparatus 1.0% 1.0% 1.4%Kettle machine 1.1% 1.1% 2.4%Telephone 1.4% 1.4% 2.6%Videocassette recorder 2.0% 2.0% 3.3%Full dress 2.2% 2.2% 3.1%Enough bedding for all families 1.6% 1.6% 2.7%
3. Exclusion from the public systemsmultiple answers
Reason for work
A family’s reason
Economic reason
Reasons of health
conditions
Other reasons
1 Vote of an election
The case of “being uninterested” (9.6%) is excluded within the cases of “it does not go” and “seldom going.” (in total, 16.8%)
2.6% 1.57% 0.4% 0.0% 0.4% 0.5% 7.2%
2 Public pension insurance
Those who have not joined a public pension and an individual annuity
1.5% 9.2%
3 Public Health Insurance
Those who have not joined a public health insuracne and a private helath insurance
3.5% multiple answers 4.3%
4 Public facilities and public services
Those who cannot use at least one of the following public facilities and the services
45.2%
The reason related with
geographical and
equipment
Economic reason
Reasons of health
conditions
Other reasons 45.2%
Library 17.5% 8.1% 0.0% 1.6% 7.9% 25.4%Public sport and facility public offices (public pool etc.)
25.3% 9.7% 1.8% 3.3% 10.5% 32.4%
78
Japanese Journal of Social Security Policy, Vol.9, No.1 (March 2012)

Deprivation Rate
Economic Reasons
2006 Kawasaki
Survey
A public hall 6.5% 1.7% 0.1% 0.7% 4.0% 7.6%Health center 12.9% 3.5% 0.2% 1.1% 8.1% 16.5%A public holes, town association, etc. 11.5% 2.5% 0.2% 2.5% 7.4% 14.2%
A park and open space 8.9% 2.8% 1.5% 4.6% 25.4% 10.7%Public transportation services (public Buss, a train, etc.)
7.4% 2.2% 0.2% 1.1% 4.0% 4.0%
5 Lifeline
The stop experience of a telephone, electricity, and/or gas (Lifeline)
5.0% 5.0% 7.0%
Electricity 0.6%gas 1.8%telephone (including mobile phones) 4.5%
4. Lack of social-related affiars
1 Communication with people
The ratio of those people who talk only or less once with people (a family is included) every 2 or 3 days
2.7% 5.7%
3 Relation with a relative
Those who cannot do attending a relative’s ceremonial occasions for an economical reason
2.9% 2.9% 3.3%
4 Social network
Those who have one items or more of there “there is not those who can rely on in addition to a family living together” about the following six items
32.1% 20.5%
No friend and acquaintance who take care of the sick time
11.3% 8.1%
No friend and acquaintance who help surrounding work of the house which is not made alone
13.4% 11.6%
No partner who holds a life consultation of change of occupation, move, marriage, etc.
8.7% 8.6%
No partner who holds consultation of the trouble in a spouse and a home
8.7% 9.7%
No partner who talks together when lonely 5.9% 5.6%
No friend and acquaintance which sometimes takes care of a child or old parents
13.9% 14.1%
No friend and acquaintance who lends the money collected when troubled
21.3% n/a
5. Lack of suitable living environment
1 Instability of a dwellin
Toilet Had arrears in paying rent in the past year
3.9% 3.9% 4.2%
2 Living environment
Could not afford more than 3 items of the 8 below
1.6% 1.6% 3.6%
Toilet only for a family 0.2% 0.2% 1.2%Cookhouse only for a family (kitchen) 0.2% 0.2% 1.7%
Bathroom only for a family 0.5% 0.5% 3.3%
Appendix 1: The item used for the social exclusion index, and its exclusion rate (Continued)
79
Japanese Journal of Social Security Policy, Vol.9, No.1 (March 2012)

Deprivation Rate
Economic Reasons
2006 Kawasaki
Survey
Washroom different from a cookhouse 3.5% 3.5% 7.4%
Bedroom different from a table and a dining room 2.9% 2.9% 8.6%
Two or more bedrooms 9.5% 9.5% 17.3%3 Health impairment caused by a residence
There is a family who injured health by the fault of the residence.
2.0% 2.0% didn’t use
6. Lack of a social activitymultiple answers
Reason for work
A family’s reason
Economic reason
Reasons of health
conditions
Other reasons
1 TravelThe family travel of a stopping cliff is 1 or less time per year (the cace of no concern is excluded).
40.9% 16.8% 5.8% 26.7% 4.8% 5.3% 35.1%
2 Dining out
The frequency of dining out with a family is 1 or less time per month or there is completely nothing.
35.6% 37.4%no questions on the reason
3 Social activity
The case when one or more of the following three items is lacking.
66.1%
A town association, children’s association, an old-man meeting, a ladies’ society, PTA, etc.
25.2% 14.4% 4.7% 0.5% 4.4% 8.1% 38.6%
A volunteer and social service activity 45.5% 26.3% 12.6% 2.6% 8.1% 9.7% 49.1%
A hobby and a sport 26.0% 14.5% 7.6% 4.7% 5.9% 3.0% 26.2%7. Economical stress 1 the sence of objective poverty
Very painful circumstances of household living
11.5% 10.0%
2 Household economy situation
A household economy is a situation in the red every month.
n/a 20.0%
It has got into debt for living expenses. 17.9% not
available
3 Savings “No savings” and “Storage is pulled down” 44.2% 41.9%
4 Nonpayment to pay
The payment about the following items has been overdue.
14.6%
Credit card 5.2%Consumer loan 2.3%the other debts (housing loan etc.) 2.7%
National pension premium 9.5%National health insurance premium 7.4%
8. Relative poverty based on income
Household income
the share of those whose equivalent income is less than 50% of average household income
10.9%
Source: The author’s tabulation based on “The Survey on social life and living status of the family”
Appendix 1: The item used for the social exclusion index, and its exclusion rate (Continued)
80
Japanese Journal of Social Security Policy, Vol.9, No.1 (March 2012)

Appendix 2: Statistics for Each Dimension
index of social exclusion (standardized) ratio of being excluded
Dimensions the number of items average Standard Deviation exclusion line the
number of items exclusion rate (%)
lack of basic needs 6 0.051 0.139 1 16.6%material deprivation 9 0.010 0.043 1 6.3%exclusion from systems 14 0.072 0.108 3 14.5%lack of social relations 9 0.099 0.187 3 12.0%lack of adequate housing 8 0.028 0.081 1 14.9%lack of activities 5 0.346 0.278 4 12.5%economic stress 8 0.109 0.160 2 20.0%Income Poverty 1 296.8 487.4871935 114.6 10.9%
(*) Author defines the exclusion line so that the exclusion rate is 10% – 20%. The exclusion rate = the ratio of respondents whose number of excluded items exceeds exclusion line.
Notes1) The term “feminization of poverty” was first
coined by D. Pearce in a paper she published in 1978 (Pearce 1978). Goldberg, G. S., Ed. (2010). Poor Women in Rich Countries: The Feminization of Poverty over the Life Course, Oxford University Press.
2) The Task Force for An Inclusive Society was established by high officials from various government ministries and agencies, led by deputy chief Cabinet secretary, Tetsuro Fukuyama with Makoto Yuasa, who has many years of experiences in the private sec-tor supporting the homeless, and Yasuyuki Shimizu, who set up a non-profit organiza-tion to combat suicide.
3) Poverty studies legendary Townsend has long used the notion of relative deprivation, establishing poverty indexes that touch upon the multidimensional aspects of poverty, such as social relations and social exchange (Townsend 1979).
4) This survey was carried out as part of the Health, Labour and Welfare Sciences Research Grant for the Research on Policy Planning and Evaluation Program’s “Study on the situation of low income earners and social security” (2007– 2009, Principal Researcher: Aya K. Abe).
ReferencesAbe, A. (2010). “Nihon no hinkon no doko to
shakai keizai kaiso ni yoru kenko kakusa no jokyo (Trends for poverty in Japan and health disparity according to s socioeco-nomic strata).” Cabinet Office Gender Equal-ity Bureaul/Special Committee on Gender Impact Assessment and Evaluation. Seikatsu konnan ni kakaeru danjo ni kansuru kentokai hokokusho — shugyo kozo kihon chosa/kokumin seikatsu kiso chosa: tokubetsu shukei (Report of investigative commission regarding men and women facing livelihood difficulties: Special data on employment status survey and comprehensive survey of living conditions, Final Report), Cabinet Office, 2010.3.31, pp. 37– 55, 113 –178.
Abe, A. (2002). “Hinkon kara shakaiteki haijo e: Shihyo no kaihatsu to genjo (From poverty to social exclusion: Development and status of the index).” Kaigai shakai hosho kenkyu. (The Review of Comparative Social Security Research), National Institute of Population and Social Security Research, Vol.141, pp. 67– 80.
Axinn, J. (1990). “Japan: a special case,” The Feminization of Poverty: Only in America? G. S. Goldberg and E. Kremen. (eds.), Prae-ger Publishers, pp. 91–106.
Burchardt, T., J. Le Grand, et al. (2002). “Degrees of Exclusion: Developing a Dynamic, Multidimensional Measure,” Understanding Social Exclusion. J. Hills, J. Le Grand and D. Piachard, eds., Oxford University Press, pp. 30 – 43.
European Commission, 1992, Towards a Europe of Solidarity: Intensifying the Fight against Social Exclusion.
81
Japanese Journal of Social Security Policy, Vol.9, No.1 (March 2012)

Fukuhara, H. (Ed.) (2007). Shakaiteki haijo/hosetsu to shakai seisaku (Social exclusion/inclusion and social policy), Horitsu Bunka Sha.
Fukuhara, H. (2007). “Shakaiteki haijo/hoset-suron no genzai to tenbo (The social exclu-sion/inclusion debate: Today and future prospects).” Fukuhara, H. eds., Shakaiteki haijo/hosetsu to shakai seisaku (Social exclusion/inclusion and social policy), Horitsu Bunka Sha, pp. 13 – 39.
Fukuhara, H. (2010). “Shiryo (Materials).” Second Meeting of the Cabinet Office Task Force Team for a Society Inclusive of Indi-viduals. 2011.2.22. Cabinet Office website.
Goldberg, G. S., Ed. (2010). Poor Women in Rich Countries: The Feminization of Poverty Over the Life Course, Oxford University Press.
Gornick, J. C. and M. Jantti (2010) “Women, Poverty, and Social Policy Regime: A Cross-National Analysis.” Luxembourg Income Study Working Paper Series No.534.
Haddad, L. and R. Kanbur (1990) “How Serious is the Neglect of Intra-Household Inequal-ity?,” The Economic Journal, Vol.100, No.402, pp. 866 – 881.
Houston, D. M. (2007). “Women’s Social Exclu-sion,” Multidisciplinary Handbook of Social Exclusion Research., D. Abrams, J. Christian and D. Gordon. Chichester eds., John Wiley & Sons Ltd, pp. 17– 28.
Iwata, M. (2008). Shakaiteki haijo: Sanka no ketsujo/futashikana kizoku (Social exclusion: Lack of participation/uncertain belonging), Yuhikaku Publishing Co. Ltd.
Kimoto, K. and K. Hagiwara (2010). “Feminiza-tino of Poverty in Japan: A Speicial Case?,” Poor Women in Rich Countries: The Femi-nization of Poverty Over the Life Course, G. S. Goldberg (eds.), Oxford University Press, pp. 202–229.
Lundberg, S. and R.A.Pollack (1996) “Bargain-ing and Distribution in Marriage,” The Jour-nal of Economic Perspectives, Vol.10, No.4, pp. 139–158.
Osawa, M. (2010). Ima koso kangaetai seikatsu hosho no shikumi (It’s time to think about our life security system), Iwanami Shoten.
Pearce, D. (1978). “The feminization of poverty: Women, work and welfare,” The Urban and Social Change Review, Vol.11, No.1&2, pp. 28–38.
Townsend, P. (1979). Poverty in the United King-dom, Allen Lane and Penguin Books.
Aya K. Abe, Ph.D (National Institute of Popula-tion and Social Security Research)
82
Japanese Journal of Social Security Policy, Vol.9, No.1 (March 2012)