Embed Size (px)
Citation preview
Poverty, Jobs and the Los Angeles Economy An Annual Analysis of U.S. Census Data and the Challenges Facing Our Region
Los Angeles Alliance for a New Economy August 26, 2008
POVERTY, JOBS AND THE LOS ANGELES ECONOMY
2
EXECUTIVE SUMMARY
The data released today by the U.S. Census Bureau present a mixed picture of how the Los Angeles economy performed in 2007. The percentage of Los Angeles County residents living below the federal poverty line decreased in 2007 over the previous year, but income inequality became more severe. Median household income rose slightly, but the difference was not statistically significant. The data also reveal that Los Angeles had higher levels of poverty and income inequality than the state and nation—and that many L.A. residents remain poor even though they are working. These high rates of poverty have a disproportionate impact on children, minorities and women.
The U.S. Census Bureau’s American Community Survey data release covers 2007, when the Los Angeles economy was adding new jobs. In 2008, the situation has worsened for L.A.’s residents due to a dramatic rise in the cost of basic necessities and a deteriorating economy. An increase in the state’s minimum wage, active efforts by labor and community groups to improve job quality and innovative policy campaigns at the local level have mitigated the negative effects of the downturn for many workers.
KEY FINDINGS
EXTREME POVERTY
The percentage of L.A. County residents living in extreme poverty in 2007 decreased over the previous year from 15.4% to 14.7%. An estimated 1,426,762 people lived below the 2007 federal poverty threshold, which is $20,650 per year for a family of four. The rates were higher for the cities of Los Angeles (18.5%) and Long Beach (18.2%).
One in five of the County’s children lived in extreme poverty in 2007. Child poverty was even worse for the cities of Los Angeles and Long Beach, with rates of 27.2% and 26.9%, respectively.
The federal poverty threshold, which has not been revised since it was developed in the early sixties, is considered in this report to be a measure of extreme poverty.
BELOW SELF‐SUFFICIENCY
Almost two out of five L.A. County residents (36.9%) did not have enough income to meet their basic needs in 2007. These 3,587,068 residents lived below twice the federal poverty threshold of $41,300 for a family of four in 2007. This threshold is a better measure of economic deprivation than the federal poverty threshold and takes into account the high cost of living in Los Angeles.
One in four workers in L.A. County did not have enough income to meet their basic needs, according to a detailed analysis of 2006 American Community Survey data. The
POVERTY, JOBS AND THE LOS ANGELES ECONOMY
3
industries with the highest poverty levels in 2006 were construction and leisure and hospitality.
EARNINGS AND INCOME
Thirty percent of L.A. County’s three million full‐time workers earned less than $25,000 per year in 2007. The typical worker in L.A. County—at the middle of the earnings distribution—earned $27,571 in wages and salary, compared to $30,702 in California, and $28,640 in the United States. The typical woman in L.A. County earned just over three‐quarters of what her male counterpart earned.
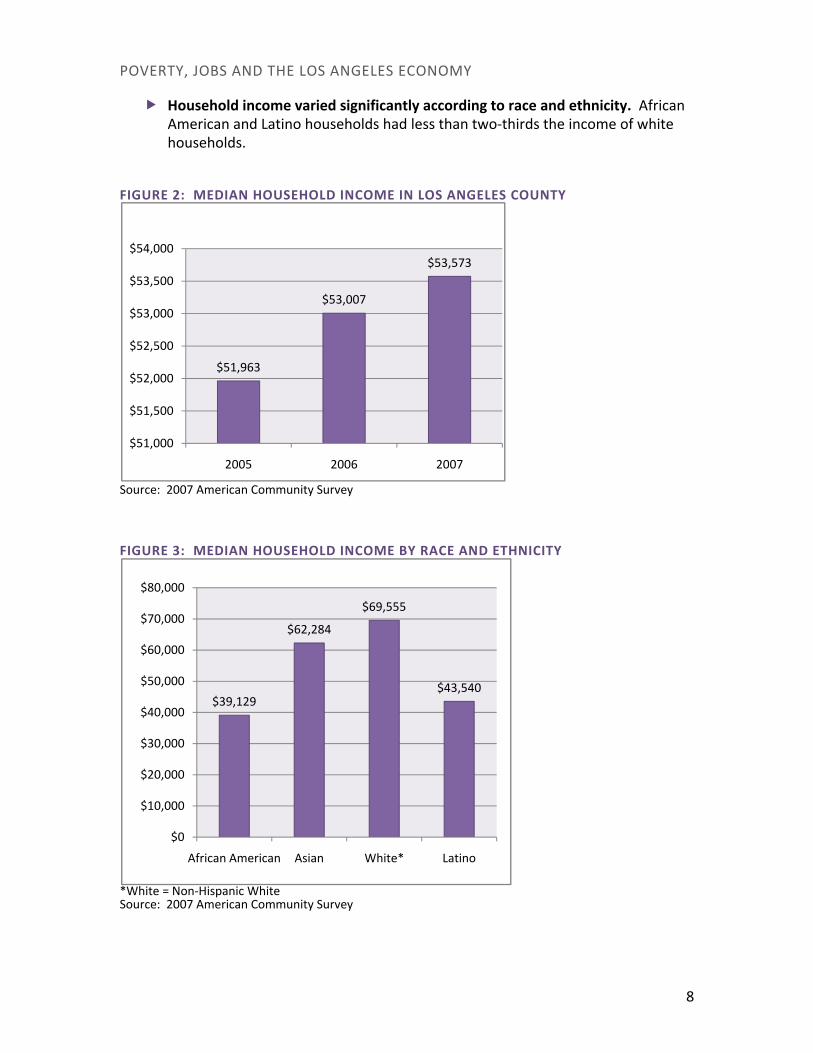
Median household income in L.A. County increased over the previous year by $566 in real terms. The increase was within the survey’s margin of error. The typical Los Angeles County household had an income of $53,573 in 2007, compared to $59,948 for the state and $50,740 for the nation. The typical African American and Latino households had less than two‐thirds the income of white households.
Income inequality increased in 2007 over the previous year, with a smaller share of households accounting for a larger share of all income in L.A. County. L.A. County had higher levels of income inequality than the state and nation in 2007. The 20% of households with the highest incomes claimed more than 50% of all income in the county, while the lowest‐earning 20% received 3% of the pie. Of the five largest California cities, Los Angeles had the highest level of inequality.
Of the five largest California cities, Los Angeles had the highest level of inequality.
The picture painted by the 2007 census data suggests that policymakers at all levels of government need to prioritize building an economy that works for everyone. Los Angeles leaders and activists have made important strides in raising wages and preserving middle‐class jobs in key sectors, from tourism to retail to film and television. But much more needs to be done to address the poverty and economic insecurity that make living and raising children in L.A. such a challenge. Efforts to improve job quality help not only the affected workers and their families, but also create jobs and revitalize communities as workers’ increased earnings circulate in the local economy.
An agenda for shared prosperity, included in this report, calls on civic leaders to work together to improve job quality, protect the rights of employees, expand health insurance and other safeguards, and improve access to quality education. Business, labor and community groups, along with elected leaders all have key roles to play in creating shared prosperity

POVERTY, JOBS AND THE LOS ANGELES ECONOMY
4
INTRODUCTION
The data released today by the U.S. Census Bureau present a mixed picture of how the Los Angeles economy performed in 2007. The percentage of Los Angeles County residents living below the federal poverty line decreased in 2007 over the previous year, but income inequality became more severe. Median household income rose slightly, but the difference was not statistically significant. The data also reveal that Los Angeles had higher levels of poverty and income inequality than the state and nation—and that many L.A. residents remain poor even though they are working. These high rates of poverty have a disproportionate impact on children, minorities and women.
This report is based, for the most part, on data from the 2007 American Community Survey. In 2008, the situation has worsened for Los Angeles residents. Fuel prices have increased by more than a dollar a gallon over the past year,1 and food prices have risen at twice the annual rate of the last decade, with certain staples increasing even more dramatically, including milk (up by 26%) and eggs (up by 40%.)2 The number of home foreclosures in LA County had more than tripled over the previous year (as of July),3 and the downturn in the region’s housing market has resulted in an estimated loss of $8.3 billion in economic output.4
Los Angeles County had 15,100 fewer jobs in July 2008 than it did in July 2007. Unemployment levels in July (at 7.5%) were the highest in more than a decade.5
Rising levels of household debt, mortgage foreclosures and increasing income volatility have affected families across the income spectrum.
Across the country, increasing economic insecurity is affecting not only the poor and the unemployed, but also is creeping into the middle class. Health and retirements benefits have been cut back over the past decade. Rising levels of household debt, mortgage foreclosures and increasing income volatility have affected families across the income spectrum. Indeed, the greatest increase in income volatility over the last 15 years has been among those with college degrees.6 These national trends have occurred even as productivity has risen rapidly. Between 1995 and 2005, productivity in the U.S. grew by 33.4%, three times the rate of wages.7
Like the rest of the country, the L.A. region is experiencing severe economic pain. But as a center of international trade and a hub for technological innovation, L.A. has a strong base on which to build. And while the construction industry has been hurt by the contraction in the housing market, billions of dollars in voter‐approved bonds for schools, roads and other public projects will ensure a steady source of jobs for many in the county.8 Other major projects expected to stimulate the local economy are expansion projects at the Ports of L.A. and Long Beach, hospital construction projects, and major downtown developments.9
State and local laws are helping to protect some of the lowest wage earners most likely to live in poverty. The California minimum wage rose to $8 per hour in January 2008, a

POVERTY, JOBS AND THE LOS ANGELES ECONOMY
5
6.7% increase over the previous year that will help L.A. County’s lowest‐paid workers. However, the state’s minimum wage is still well below self‐sufficiency standards. Someone working full time at this rate would still earn $252 below the 2008 federal poverty line for a family of three, a measure of extreme hardship.10
L.A.’s civic and labor leaders have been at the forefront of efforts to improve jobs and build a sustainable economy. A living wage ordinance for hotel workers on Century Boulevard near LAX will raise wages for several thousand workers.11 The union representing nearly 70,000 grocery workers in Southern California signed a contract with the major grocery chains in late 2007 that reversed the declining job standards in that industry. Early this year, the union representing security officers reached an agreement with building owners to raise compensation for 4,000 largely African American workers by about 40 percent.12
These efforts to improve job quality help not only the affected workers and their families, but also contribute to job creation.
These efforts to improve job quality help not only the affected workers and their families, they contribute to job creation. A recent study showed that union workers in L.A. County earn an average of 27% more than non‐union workers in the same occupation, and that these higher earnings result in the creation of more than 64,000 jobs.13
Action is needed at every level of government in order to address the high levels of poverty that plague this region. This report includes a Prosperity Agenda intended to launch a discussion of how to reenergize the economy in a way that has broad benefits.
About this brief
This report relies on the 2007 American Community Survey (ACS) released on August 26, 2008. The analysis of the 2007 data has been supplemented by the Economic Policy Institute’s analysis of 2006 ACS data. The report was prepared by Jessica Goodheart, Research Director for the Los Angeles Alliance for a New Economy, and research intern Lauren Akins.
POVERTY, JOBS AND THE LOS ANGELES ECONOMY
6
NEW CENSUS DATA SHOW HIGH POVERTY AND INCOME INEQUALITY IN LOS ANGELES COUNTY
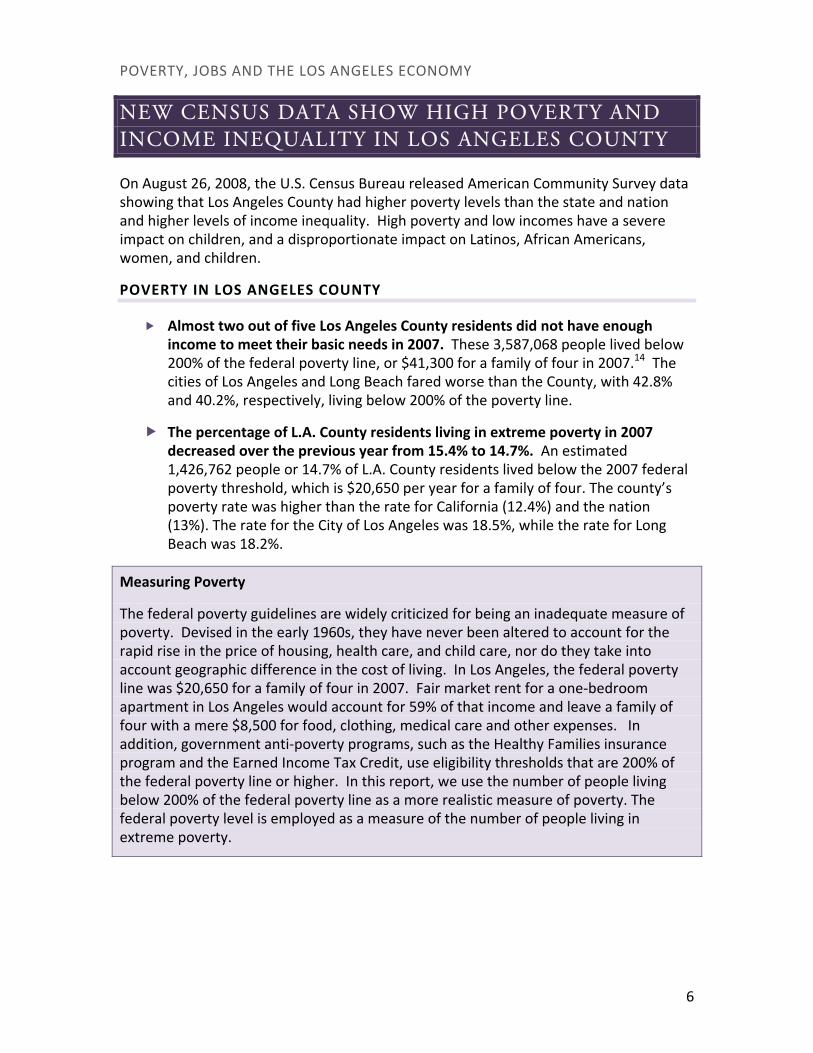
On August 26, 2008, the U.S. Census Bureau released American Community Survey data showing that Los Angeles County had higher poverty levels than the state and nation and higher levels of income inequality. High poverty and low incomes have a severe impact on children, and a disproportionate impact on Latinos, African Americans, women, and children.
POVERTY IN LOS ANGELES COUNTY
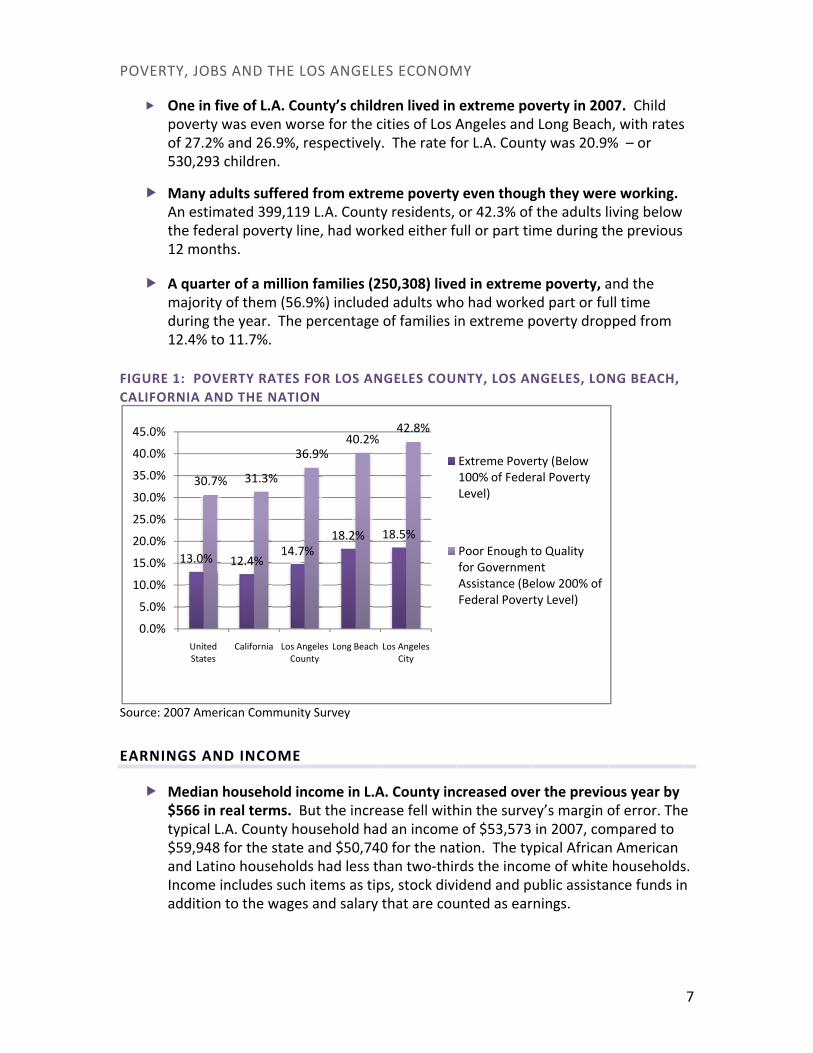
Almost two out of five Los Angeles County residents did not have enough income to meet their basic needs in 2007. These 3,587,068 people lived below 200% of the federal poverty line, or $41,300 for a family of four in 2007.14 The cities of Los Angeles and Long Beach fared worse than the County, with 42.8% and 40.2%, respectively, living below 200% of the poverty line.
The percentage of L.A. County residents living in extreme poverty in 2007 decreased over the previous year from 15.4% to 14.7%. An estimated 1,426,762 people or 14.7% of L.A. County residents lived below the 2007 federal poverty threshold, which is $20,650 per year for a family of four. The county’s poverty rate was higher than the rate for California (12.4%) and the nation (13%). The rate for the City of Los Angeles was 18.5%, while the rate for Long Beach was 18.2%.
Measuring Poverty
The federal poverty guidelines are widely criticized for being an inadequate measure of poverty. Devised in the early 1960s, they have never been altered to account for the rapid rise in the price of housing, health care, and child care, nor do they take into account geographic difference in the cost of living. In Los Angeles, the federal poverty line was $20,650 for a family of four in 2007. Fair market rent for a one‐bedroom apartment in Los Angeles would account for 59% of that income and leave a family of four with a mere $8,500 for food, clothing, medical care and other expenses. In addition, government anti‐poverty programs, such as the Healthy Families insurance program and the Earned Income Tax Credit, use eligibility thresholds that are 200% of the federal poverty line or higher. In this report, we use the number of people living below 200% of the federal poverty line as a more realistic measure of poverty. The federal poverty level is employed as a measure of the number of people living in extreme poverty.
POVE
0.0
5.0
10.0
15.0
20.0
25.0
30.0
35.0
40.0
45.0
FIGUCALIF
Source
EARN
ERTY, JOBS
13.0%
30.7%
0%
0%
0%
0%
0%
0%
0%
0%
0%
0%
United States
One in fivpoverty wof 27.2% 530,293 c
Many aduAn estimathe feder12 month
A quartermajority oduring the12.4% to
RE 1: POVEFORNIA AND
e: 2007 Americ
NINGS AND
Median h$566 in retypical L.A$59,948 fand LatinoIncome inaddition t
AND THE L
12.4%14.7
31.3%
36
California Los AnCou
ve of L.A. Cowas even woand 26.9%, rchildren.
ults sufferedated 399,119al poverty lihs.
r of a millionof them (56.e year. The 11.7%.
RTY RATES D THE NATIO
can Communit
D INCOME
household ineal terms. BA. County hofor the state o householdncludes suchto the wages
LOS ANGELE
%18.2%
6.9%40.2%
ngeles unty
Long Beach
ounty’s childorse for the crespectively
d from extre9 L.A. Countne, had wor
n families (2.9%) includepercentage
FOR LOS ANON
ty Survey
ncome in L.ABut the increousehold hadand $50,74
ds had less thh items as tips and salary
ES ECONOM
18.5%
42.8%
Los Angeles City
dren lived in cities of Los Ay. The rate fo
eme povertyy residents,rked either f
250,308) lived adults whof families i
NGELES COU
A. County inease fell withd an income0 for the nathan two‐thirps, stock divithat are cou
MY
Extreme Pove100% of FedeLevel)
Poor Enough tfor GovernmeAssistance (BeFederal Pover
extreme poAngeles andor L.A. Coun
y even thougor 42.3% ofull or part ti
ed in extremo had workein extreme p
NTY, LOS AN
creased ovehin the survee of $53,573 tion. The tyrds the incomidend and punted as ear
erty (Below ral Poverty
to Quality ent elow 200% of rty Level)
overty in 200d Long Beachnty was 20.9%
gh they werf the adults lme during th
me poverty, aed part or fupoverty drop
NGELES, LON
er the previoey’s margin oin 2007, com
ypical Africanme of white ublic assistarnings.
07. Child h, with rates% – or
e working. iving below he previous
and the ull time pped from
NG BEACH,
ous year by of error. Thempared to n American householdsnce funds in
7
e
s. n
POVERTY, JOBS AND THE LOS ANGELES ECONOMY
8
Household income varied significantly according to race and ethnicity. African American and Latino households had less than two‐thirds the income of white households.
FIGURE 2: MEDIAN HOUSEHOLD INCOME IN LOS ANGELES COUNTY
Source: 2007 American Community Survey
FIGURE 3: MEDIAN HOUSEHOLD INCOME BY RACE AND ETHNICITY
*White = Non‐Hispanic White Source: 2007 American Community Survey
$51,963
$53,007
$53,573
$51,000
$51,500
$52,000
$52,500
$53,000
$53,500
$54,000
2005 2006 2007
$39,129
$62,284
$69,555
$43,540
$0
$10,000
$20,000
$30,000
$40,000
$50,000
$60,000
$70,000
$80,000
African American Asian White* Latino

POVERTY, JOBS AND THE LOS ANGELES ECONOMY
9
L.A. County had high levels of income inequality. The 20% of households with the highest incomes claimed more than half of all income in the County, while the lowest‐earning fifth received 3% of the pie. The top 5% of households, meanwhile, claimed almost a quarter (24.8%) of all the income in the County.
Income inequality in L.A. County increased in 2007 over the previous year, according to the Gini ratio, the standard international measure of income inequality.* L.A. County had higher levels of income inequality than the state and nation. The County’s Gini ratio was 0.493 in 2007, compared to 0.484 in 2006. Of the five largest California cities, the City of Los Angeles had the highest level of inequality, as indicated by the Gini coefficient, which was 0.529 for the city.
The 20% of households with the highest incomes claimed more than 53% of all income in L.A. County, while the lowest‐earning 20% received 3% of the pie. Of the five largest California cities, Los Angeles had the highest level of inequality.
FIGURE 4: DISTRIBUTION OF AGGREGATE INCOME BY QUINTILE IN L.A. COUNTY
Source: 2007 American Community Survey
* The Gini coefficient assigns a higher number the more unequally income is distributed. A measure of 0 indicates perfect equality, while a 1 indicates inequality, i.e. one person has all the income.
Lowest Fifth3%
Second‐Lowest Fifth
8%
MIddle Fifth14%
Second‐Highest Fifth
22%
Top Fifth53%
POVERTY, JOBS AND THE LOS ANGELES ECONOMY
10
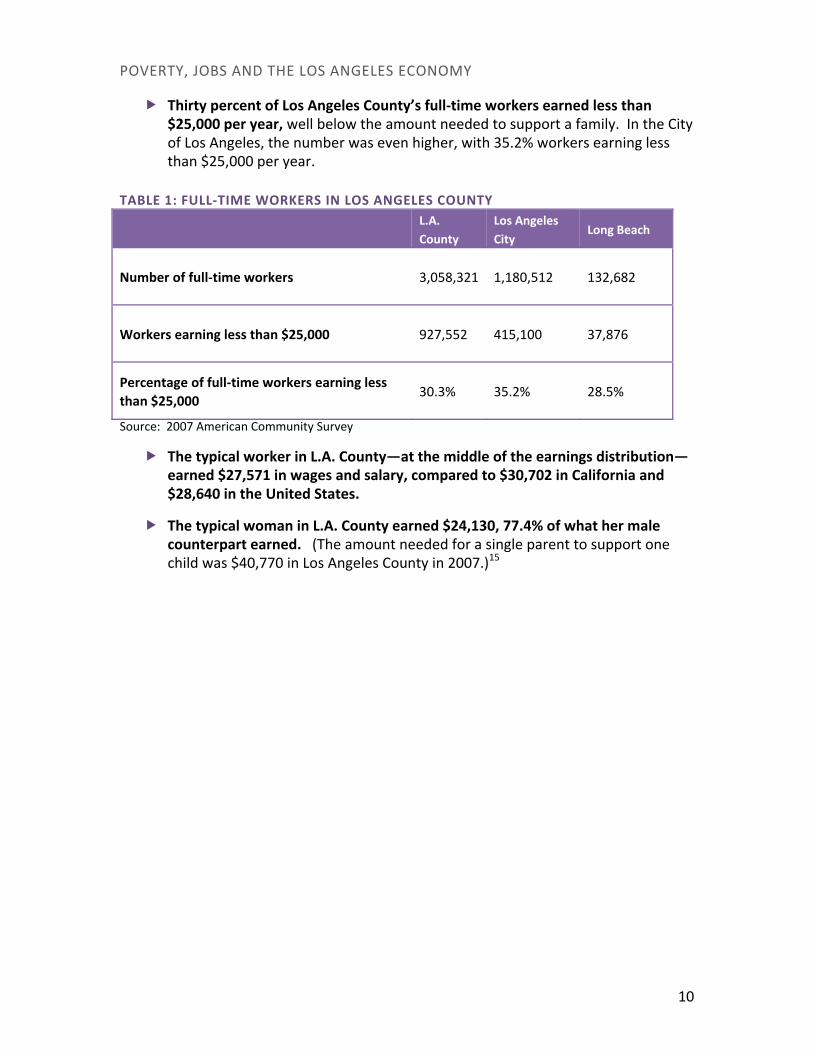
Thirty percent of Los Angeles County’s full‐time workers earned less than $25,000 per year, well below the amount needed to support a family. In the City of Los Angeles, the number was even higher, with 35.2% workers earning less than $25,000 per year.
TABLE 1: FULL‐TIME WORKERS IN LOS ANGELES COUNTY FULL‐TIME WOS COUNT
L.A. County
Los Angeles City
Long Beach
Number of full‐time workers 3,058,321 1,180,512 132,682
Workers earning less than $25,000 927,552 415,100 37,876
Percentage of full‐time workers earning less than $25,000
30.3%
35.2%
28.5%
Source: 2007 American Community Survey
The typical worker in L.A. County—at the middle of the earnings distribution—earned $27,571 in wages and salary, compared to $30,702 in California and $28,640 in the United States.
The typical woman in L.A. County earned $24,130, 77.4% of what her male counterpart earned. (The amount needed for a single parent to support one child was $40,770 in Los Angeles County in 2007.)15
POVERTY, JOBS AND THE LOS ANGELES ECONOMY
11
PRIOR YEAR’S DATA SHOW LINK BETWEEN POVERTY AND EMPLOYMENT
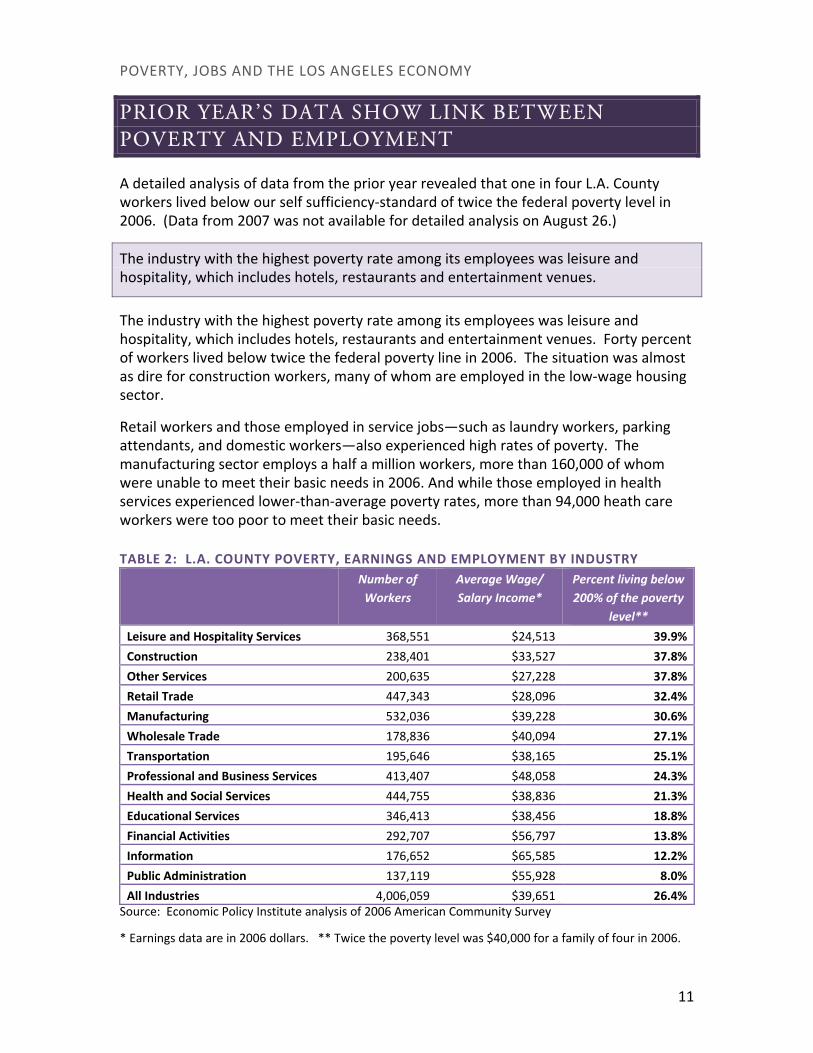
A detailed analysis of data from the prior year revealed that one in four L.A. County workers lived below our self sufficiency‐standard of twice the federal poverty level in 2006. (Data from 2007 was not available for detailed analysis on August 26.)
The industry with the highest poverty rate among its employees was leisure and hospitality, which includes hotels, restaurants and entertainment venues.
The industry with the highest poverty rate among its employees was leisure and hospitality, which includes hotels, restaurants and entertainment venues. Forty percent of workers lived below twice the federal poverty line in 2006. The situation was almost as dire for construction workers, many of whom are employed in the low‐wage housing sector.
Retail workers and those employed in service jobs—such as laundry workers, parking attendants, and domestic workers—also experienced high rates of poverty. The manufacturing sector employs a half a million workers, more than 160,000 of whom were unable to meet their basic needs in 2006. And while those employed in health services experienced lower‐than‐average poverty rates, more than 94,000 heath care workers were too poor to meet their basic needs.
TABLE 2: L.A. COUNTY POVERTY, EARNINGS AND EMPLOYMENT BY INDUSTRY Number of
Workers Average Wage/ Salary Income*
Percent living below 200% of the poverty
level**
Leisure and Hospitality Services 368,551 $24,513 39.9%
Construction 238,401 $33,527 37.8%
Other Services 200,635 $27,228 37.8%
Retail Trade 447,343 $28,096 32.4%
Manufacturing 532,036 $39,228 30.6%
Wholesale Trade 178,836 $40,094 27.1%
Transportation 195,646 $38,165 25.1%
Professional and Business Services 413,407 $48,058 24.3%
Health and Social Services 444,755 $38,836 21.3%
Educational Services 346,413 $38,456 18.8%
Financial Activities 292,707 $56,797 13.8%
Information 176,652 $65,585 12.2%
Public Administration 137,119 $55,928 8.0%
All Industries 4,006,059 $39,651 26.4%Source: Economic Policy Institute analysis of 2006 American Community Survey * Earnings data are in 2006 dollars. ** Twice the poverty level was $40,000 for a family of four in 2006.

POVERTY, JOBS AND THE LOS ANGELES ECONOMY
12
A PROSPERITY AGENDA FOR LOS ANGELES
The fact that 3.7 million people in Los Angeles County lack the income to meet their basic needs presents a serious challenge for our entire region. It impacts our schools, our business climate, our health system and our civic life. While it’s clear that education is highly correlated with economic success in the 21st century, it is also the case that better education alone will not address poverty. We need a strategy to improve the quality of the jobs that are available to residents and to address other problems that create economic insecurity, such as a lack of affordable housing and health care. Business, community and labor groups as well as governments leaders have key roles to play in creating shared prosperity.
WHAT GOVERNMENT SHOULD DO
Raise the floor: This country was built on the notion that hard work should be rewarded with decent pay and benefits. Government needs to set wage standards that reflect the cost of living. Living wage laws in Los Angeles have helped raise the wage floor for tens of thousands of underpaid service workers and should be expanded to cover more employees. The state should follow the lead of ten other states and index the minimum wage to inflation so it reflects increases in the cost of living.16
Protect the rights of employees: The high levels of poverty and income inequality in Los Angeles stem in large part from the inability of working people to bargain for better pay and economic security. One of the main obstacles is intimidation tactics employed by many businesses.17 The passage of the federal Employee Free Choice Act would help restore the ability of workers to elect a union to represent them by eliminating the heavy barriers that currently exist. Unionization not only improves the pay and benefits of workers represented, it also stimulates the local economy by increasing the spending power of L.A.’s residents.18
Eliminate predatory work conditions: An estimated 670,000 workers in Los Angeles County work off the books, are paid under the table or are misclassified as independent contractors.19 These workers lack safety net benefits, such as Social Security and unemployment insurance, and often their basic rights (such as their right to a minimum wage or overtime pay) are ignored. Better enforcement of existing labor laws and legislation to address employees who are misclassified as independent contractors can go a long way toward addressing these predatory conditions.
Provide access to quality education: Education levels are highly correlated to economic success, and yet Los Angeles has staggering high school dropout rates (one in three Los Angeles Unified students fails to graduate)20 and the state ranks 34th among the 50 states in K through 12 education spending.21 The state
POVERTY, JOBS AND THE LOS ANGELES ECONOMY
13
should address the fiscal barriers to increasing education spending, and also recognize that addressing poverty is essential to ensuring educational success.
Make healthcare affordable: In Los Angeles County, 2.1 million people do not have health insurance and more than 40% of adults earning below 200% of the poverty line lack health insurance of any kind.22 A lack of medical insurance has economic and social costs, as well as human costs, including missed classroom time, lost productivity and a reliance on costly emergency rooms for problems that should be addressed with routine care. The state and federal governments need to take action to solve this deepening crisis.
Ensure economic security: Our social safety net should enable those who are able to work to participate fully in the economy and enjoy a secure retirement. Children and those who are unable to work should be protected from economic privation. A functioning social safety net is particularly important during economic downturns, when workers lose jobs and see their hours cut.
Link public investment to good jobs: Government officials should tie public investment in infrastructure, private development and other subsidies to the creation of good jobs. Those jobs should be made available to communities most in need. Otherwise, taxpayers must pay twice for government subsidies to business and the cost of low‐wage, no benefit employment (i.e., expenditures for Food Stamps, school lunches and health care for the uninsured.) Public investment in private development should target industries that are tied to the region and that provide quality jobs or the opportunity to raise job standards.
WHAT BUSINESS SHOULD DO
Take the high‐road: Los Angeles County’s businesses should recognize that their future is tied to the success of the region, and strive to provide good jobs and decent benefits. Fortunately, many business leaders have seen the wisdom of the high road approach, and are providing good, family‐sustaining jobs. And some business leaders have come out in support of policies to improve job quality, such as living wage laws and project labor agreements. Such policies make good business sense by allowing firms to compete on the basis of quality and service—rather than by lowering standards—and helping them to increase the productivity of their workforce. Likewise, developers who build mixed‐income housing are tapping into an important market and ensuring that L.A.’s workforce has a place to live.
Behave responsibly: Too many Los Angeles businesses operate below the radar and do not comply with local and federal labor laws.23 Los Angeles businesses should comply with existing laws and behave responsibly toward their employees and consumers.
Support smart public investment: Many business leaders recognize that a healthy business climate requires a well‐maintained infrastructure, a world‐class education system and a health care system that works. Business leaders should
POVERTY, JOBS AND THE LOS ANGELES ECONOMY
14
take leadership in supporting smart public investment in schools, public transportation and health care—and should insist that the benefits of those programs are broadly shared.
WHAT COMMUNITY AND LABOR SHOULD DO
Organize to raise standards: Labor unions have a responsibility to organize workers and improve and maintain standards in the industries where workers are represented. The passage of the Employee Free Choice Act at the federal level should facilitate organizing workers into unions by eliminating many of the barriers that now exist. Unions representing janitors, security officers, health care workers, hotel workers and others have shown that much can be done even in the absence of such legislation.
Work in broad coalitions: The fight for good jobs, universal health insurance, affordable housing and quality education cannot be won without broad coalitions that include key stakeholders. The Coalition for Clean and Safe Ports, which is fighting to address truck‐related pollution and sweatshop conditions at the Ports of Los Angeles and Long Beach, has demonstrated the benefits of bringing environmentalists, public health advocates, neighborhood groups and labor unions together around a common agenda.
Develop innovative policy and programs: Labor and community organizations cannot wait for government leaders to propose policies to address the poverty and inequality that affect their neighborhoods. They need to be at the forefront of crafting new initiatives, such as the Green Jobs Program, an initiative of the Los Angeles Apollo Alliance, which aims to prepare residents from low‐income communities for careers in the green manufacturing and green building sectors.

POVERTY, JOBS AND THE LOS ANGELES ECONOMY
15
1 Automobile Club of Southern California, (2008, June 20). Gas Price Averages Near $4.60 In Most Areas, [Press Release]. From
http://news.aaa‐calif.com/pr/aaa/weekendgaswatch‐June‐20‐08.aspx?ncid=6052, accessed on August 15, 2008.
2 Gavin, R., “Surging Costs of Groceries Hit Home,” The Boston Globe, March 9, 2008.
3 Information compiled from Foreclosure.com by Bubble Tracking, from http://bubbletracking.blogspot.com/2006/12/tracking‐
foreclosures‐and‐pre.html, accessed on August 14, 2008.
4 Global Insight. (November 2007). US Metro Economies: The Mortgage Crisis – Economic and Fiscal Implications for Metro Areas.
Lexington, MA: Global Insight, p. 6. From www.usmayors.org/metroeconomies/1107/report.pdf, accessed on August 13, 2008. The
estimated $8.3 billion is for the Los Angeles Metropolitan Statistical Area, which includes Los Angeles, Long Beach, and Santa Ana.
5 Employment Development Department, California Labor Market Information, from
http://www.calmis.ca.gov/htmlfile/county/losangel.htm, accessed on August 15, 2008. Fine, H., “Update: July Jobless Rate Highest
in 11 Years,” Los Angeles Business Journal, August 15, 2008.
6 Jacob Hacker and Elisabeth Jacobs, “The Rising Instability of American Family Incomes, 1969‐2004: Evidence from the Panel Study of
Income Dynamics,” Economic Policy Institute, May 9, 2008. From http://www.epi.org/content.cfm/bp213, accessed on August 14,
2008. See also Gosselin, Peter, High Wire: The Precarious Financial Lives of American Families (New York, Basic Books, 2008).
7 Lawrence Mishel, Jared Bernstein, and Sylvia Allegreto, The State of Working America 2006/2007, Economic Policy Institute, Cornell
University Press, 2007: pp. 4‐5.
8 Bond monies include: “Proposition 12 ‐ 2000 Parks Bond Act,” California State Parks, from www.parks.ca.gov/?page_id=22317,
accessed on August 19, 2008; “Implementation of the Transportation Bond,” Legislative Analyst’s Office, from
http://www.lao.ca.gov/analysis_2007/transportation/tran_03_anl07.aspx , accessed on August 25, 2008; “2006 Proposition 1D:
Kindergarten‐University Public Education Facilities Bond Act of 2006,”Legislative Analyst’s Office, from
www.lao.ca.gov/ballot/2006/1D_11_2006.htm, accessed on August 19, 2008. See also Merl, J., “School Bond Measure Depends on
a Willingness to Add Debt,” Los Angeles Times, February 22, 2004, p B‐1.
9 Jack Kyser, Nancy Sidhu, Candice Flor Hynek, and Shannon Sedgwick, “2008‐2009 Economic Forecast and Industry Outlook: Mid‐
Year Update for California and Southern California Including the National and International Setting,” Los Angeles County Economic
Development Corporation, July 2008, pp 27‐28.
10 Alissa Anderson Garcia, “Policy Points: California’s Two‐Step Minimum Wage Increase Provides an Important Boost to Low‐Wage
Workers’ Earnings.” California Budget Project, December 2007.
11 Hymon, S., “L. A. Living Wage Law is Upheld,” Los Angeles Times, December 28, 2007.
12 Service Employees International Union, (January 26, 2008). Security Officers Ratify Historic Union Contract in Los Angeles, [Press
Release].
13 Dan Flaming, “The Economic Footprint of Unions in Los Angeles,” Economic Roundtable, December 2007.
14 “The 2008 Health and Human Services Poverty Guidelines,” United States Department of Health and Human Services, from
http://aspe.hhs.gov/poverty/08Poverty.shtml, accessed on August 12, 2008.
15 “Economic Policy Institute basic family budget calculator for 2008,” from
http://www.epi.org/content.cfm/datazone_fambud_budget, accessed on August 15, 2008.
POVERTY, JOBS AND THE LOS ANGELES ECONOMY
16
16 See Garcia, “Policy Points: California’s Two‐Step Minimum Wage Increase Provides an Important Boost to Low‐Wage Workers’
Earnings.”
17 See Cohen, Larry, and Hurd, Richard, "Fear, Conflict, and Union Organizing" in Bronfenbrenner, Kate, Friedman, Sheldon, Hurd,
Richard, and Oswald, Rudolph, Organizing to Win: New Research on Union Strategies, (Ithaca, Cornell University Press, 1998) pp 181‐
196. Also see Smith, Robert Michael, From Blackjacks to Briefcases: A History of Commercialized Strike‐Breaking and Union‐Busting,
(Athens, Ohio University Press, 2003).
18 Flaming, “The Economic Footprint of Unions in Los Angeles.”
19 Dan Flaming, “Poverty, Inequality and Justice: A Vanishing Middle Class in Southern California,” Economic Roundtable for the Pat
Brown Institute, The California Agenda Public Policy Lecture Series, Los Angeles, CA, March 22, 2006.
20 Landsberg, M. and Blume, H., “1 in 4 California High School Students Drop Out, State Says,” Los Angeles Times, July 17, 2008.
21 Jean Ross, “School Finance Facts: How Does California Compare?: Funding California’s Public Schools.” California Budget Project,
October 2007. The figure listed is for per student spending for 2005‐2006.
22 UCLA Center for Health Policy Research, “California Health Interview Survey 2005” and “Health Insurance Coverage Fact Sheets for
California Counties and Regions,” April 2007. An estimated 2.1 million Angelenos were uninsured for all or pat of the year in 2005.
23 "Labor Commissioner Cites Los Angeles, Orange County Carwashes over $350,000 for Violations," Business Wire, July 21, 2008.
Cleeland, N., "Lawsuit Against Forever 21 Alleges Unfair Labor Practices," Los Angeles Times, September 7, 2001, p C‐2. Chuck Byun,
"Forever in Trouble?; The Legal Troulbes of Korean American‐owned Clothing Retailer Forever 21 Points to the Major Role Korean
Immigrants Play in the Multibillion‐dollar Garment Industry," KoreAm Journal, 14/3, June 1, 2003, pp 41‐47. Gonzales, R., "Spice
Importer to Pay Workers $73,000 in Back Wages," San Gabriel Valley Tribune, August 13, 2008.