Embed Size (px)
Citation preview

PovertyofvisionholdsbackAustralia
DavidLeitch,ITK,April2018

AboutITK
• DavidLeitch– PrincipalITK• ResearchanalystatUBS,JPMorganandpredecessorfirmsfor33years.David’svarious teams achievedNo1inGreenwichsurveyin3separatesectorsoverthattimeperiod.Consistenttop3inutilities2004-2016.
• Analysisofelectricity,gasanddecarbonisation.• Companyanalysis• Investmentsecondopinions• Marketreviews
• Someworkisdoneonvoluntarybasisandfoundatwww.reneweconomy.com.au.
2

Politics- Thepeopleareaheadofthepollies
3
0.0
2.0
4.0
6.0
8.0
10.0
12.0
Vote Seats*
Shareofnationaltotal%
LowerhouseofParliamentdoesn'trepresentnationalopinion
Nationals+50%LibNationals Greens 0% 10% 20% 30% 40% 50% 60% 70%
Renewables+storage
Renewables+fossilfuels
Maintainstatusquo
HowshouldwepowerAustralia?
Source:ClimateInstitutesurvey2017
50%
60%
70%
80%
2012 2013 2014 2015 2016 2017
Australianswhoacceptclimatechange,includes64%ofLiberalvotersand54%ofNationalvoters
Source:ClimateInstitutesurvey2017
DespitehighpowerpricesthesittingpartyinVictoria,theALP,isregardedbyvotersasmorelikelythantheCoalitiontomaintainelectricitysupplyandkeeppowerpriceslower

Home ownersvotewiththeirwallets
• Basedon480,000 USApropertysales• Propertiesprojectedtobeexposedtosealevelrisesellat7%discountrelativetootherwisesimilarproperties• Thisdiscountisnotinrentsjustinsalesprice• Propertiesnotionallyexposedto1footofexpectedrisesellata22%discount• Therewasnodiscountin2007• Thepricediscountisconsistentwiththe“severe”sealevelriseforecastsofclimatechangemodels• Source:BernsteinGustafson&Lewis2017
4

Temperaturerising,alarmsareflashing
5
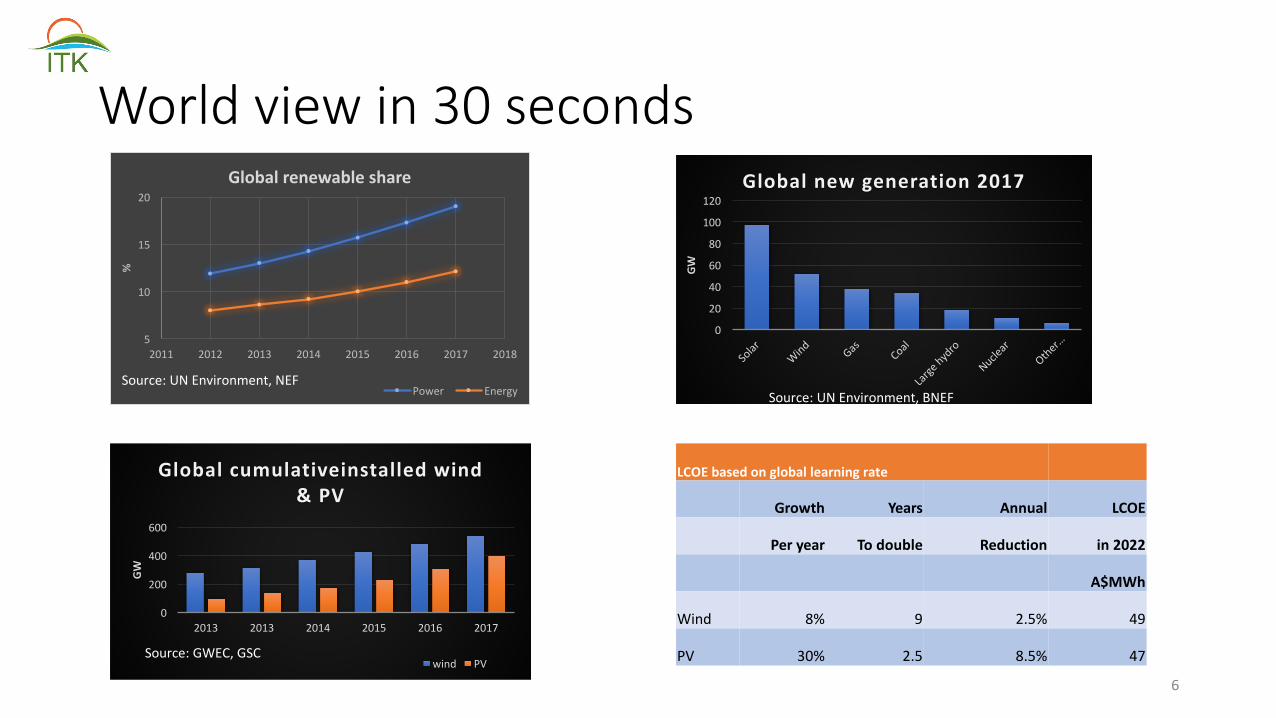
World viewin30seconds
6
0
20
40
60
80
100
120
GW
Globalnewgeneration2017
Source:UN Environment,BNEF
5
10
15
20
2011 2012 2013 2014 2015 2016 2017 2018
%
Globalrenewableshare
Power EnergySource:UN Environment,NEF
0
200
400
600
2013 2013 2014 2015 2016 2017
GW
Globalcumulativeinstalledwind&PV
wind PVSource:GWEC,GSC
LCOEbasedongloballearningrate
Growth Years Annual LCOE
Peryear Todouble Reduction in2022
A$MWh
Wind 8% 9 2.5% 49
PV 30% 2.5 8.5% 47

PolicyforahighVREgrid
RenewablesmuchmoresensitivetoWACCrequirement
PV GasCapacity MW 200 200Capex $M 330 278LCOEfor6.5%projectIRR* $MWh 66 82.5LCOEfor7.5%projectIRR* $MWh 72 84.8Change % 9% 3%*$8GJgas
7
• ReducerisktoVREinvestorstokeepWACClow• Reduceconnectioncostsbybuildingtransmissiontonewrenewablezones• Minimiseamountofdispatchablegenerationrequired,butstartbuildingitnow.• Continuetosupportbehindthemeterforsystemresilience

MorethanhalfofNSWcoalfleettocloseby2035– morelikelytobeearlierthanlater?• 4/5NSWcoalgeneratorstocloseinnext14years• NSWcoalcostsarerising• GladstoneinQLDandYallourn inVictoriaalsolikelytocloseby2032orthereabouts
8

Dependingonmixabout20GWnewpowerneededinNSW
9
0200400600800100012001400160018002000
2018
2019
2020
2021
2022
2023
2024
2025
2026
2027
2028
2029
2030
2031
2032
2033
2034
2035
ANNUAL
MWNEW
VRE
REQ
UIRED
ReplacingcoalinNSW
Liddell ValesPoint Eraring Bayswater MtPiper
NSWneedsd20GWpowerby2035Closure Years Annualnewbuild AnnualMWPowerat TotalpowerComment
TWh Date toclose TWh @32%capfactor GWLiddell 8.2 2022 4 2.1 732 2.9AnnouncedValesPoint 8.1 2029 11 0.7 262 2.9Eraring 17.8 2032 14 1.3 454 6.4AnnouncedBayswater 16.2 2035 17 1.0 339 5.8AnnouncedMtPiper 7.3 2043 25 0.3 105 2.6Total 57.6NSWdemand 70.8 5.31 1893 21
• Moreifbatteries,pumpedhydrohavetoberecharged• MoreforEVs• Buthowmuchdispatchable power?• Whatpolicywillminimisepriceandreliabilityuncertaintyfacingthisdemand?

NewsupplyisinadequateinNSW
• ManyPVprojectsappeartoberunningbehindscheduleacrosstheNEM,particularlyQLD
10
889669
1138
331144
342
1260
708
320
0
210
100
0
500
1000
1500
2000
2500
NSW QLD VIC SA TAS
MW
NEWGENERATIONUNDERCONSTRUCTION
Wind PV Gas Coal

PolicywhatitneedstobeGoal Maintainreliabilitystandardatefficient
costconsistentwithdecarbonisation
Objective Notsogradual replacementofageingcoalfuelledelectricitywithVRE,assistedbyzeroormuchloweremissionfirminggenerationanddemandresponse
Method 1. Study– IdentifyhowmuchdispatchablepowerneededforgivenlevelofVRE
2. Plan– What hastobebuiltfirst?Whattheobstacles?Whoisresponsibleandwhohasauthority?
3. ACT– buildconsensus, implementplan
Policy Howmuchcentral control,howmuchislefttomarkets?Shouldthemarketbecapacityorenergyorboth.WhatistheroleofFederalandStateGovt? 11
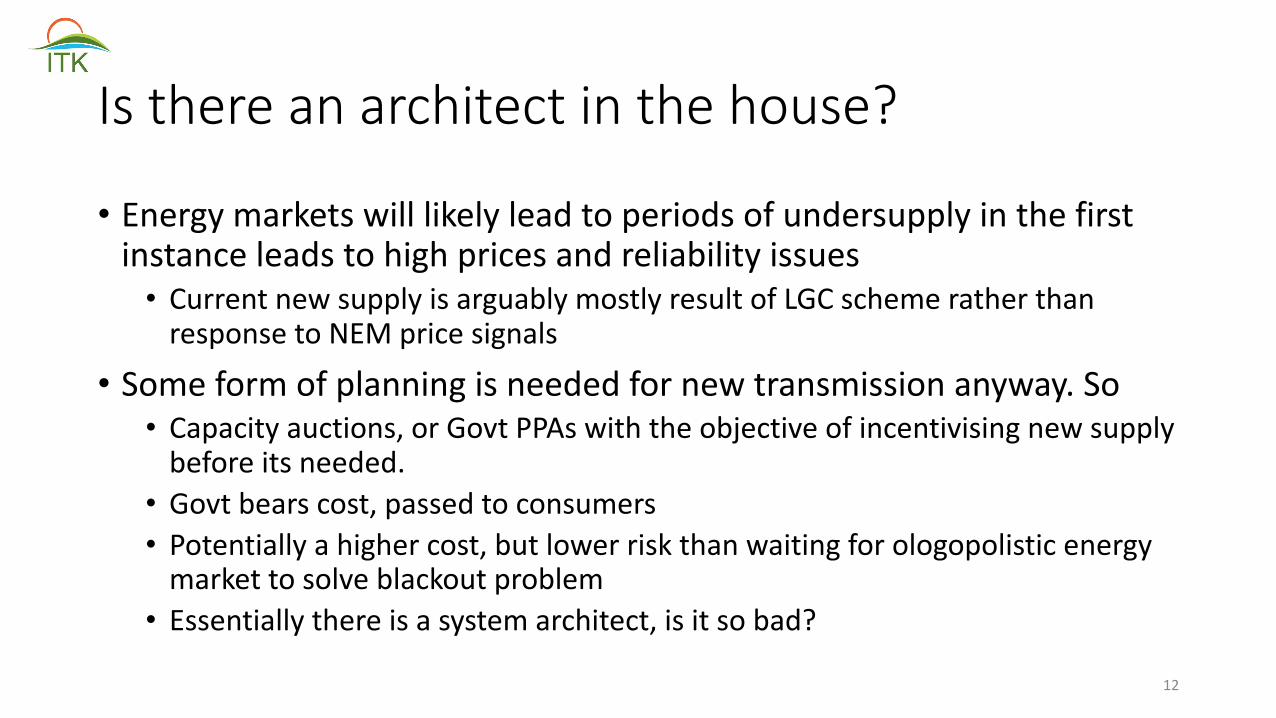
Isthereanarchitectinthehouse?
• Energymarketswill likelyleadtoperiodsofundersupplyinthefirstinstanceleadstohighpricesandreliabilityissues• CurrentnewsupplyisarguablymostlyresultofLGCschemeratherthanresponsetoNEMpricesignals
• Someformofplanningisneededfornewtransmissionanyway.So• Capacityauctions,orGovtPPAswiththeobjectiveofincentivisingnewsupplybeforeitsneeded.• Govtbearscost,passedtoconsumers• Potentiallyahighercost,butlowerriskthanwaitingforologopolistic energymarkettosolveblackoutproblem• Essentiallythereisasystemarchitect,isitsobad?
12

Therulemakingprocesshasnovisionorgoal
13
CostVariableElecrticity
Balancingcost
Costofelectricity
Balancetechnologiesexpensivebuthowmuchisneeded?• Demandmanagement• Battery• Pumpedhydro• Concentratingthermal• Biomass• Hydrogen• Gas• Remainingcoal
Renewableguarantee
FederalGovtbasedonParisminimum
Retailerrenewableobligation
Reliabilityguarantee
ESBbasedonAEMOforecast
Somenewdispatchablegenerationprocurementmethod

14
Aplanisrequired“By mid-2018, the COAG Energy Council should develop and maintain a strategic energy plan informed by the Panel’s blueprint to guide the operation and evolution of the National Electricity Market.” Finkel recommendation 7.1

ExecutionofplanformallyrestswiththeEnergySecurityBoardCOAGLeaders
COAGEnergyCouncil
EnergySecurityBoard
AustralianEnergyMarket
Operator
AustralianEnergyMarketCommission
ReliabilityPanel
AustralianEnergy
RegulatorSYSTEMOPERATOR REGULATORRULEMAKER
SENIORCOMMITTEEOFOFFICIALS
AnnualStatementsofExpectation
MarketBodies’statementofintentandannualreportagainstperformanceindicators
Annualreportonstrategicpriorities
andprogressagainststrategicenergyplan
AnnualHealthoftheNEMreportandprogresson
implementationofblueprints
Butwhereistheaccountability?Whereisthemanager?
Investorconsiderations
• Incumbentsincentivised towait• Benefitfromkeepingsupplytight• Expectnewbuildcoststofall,leaveittothelastminute• Butrisklosingmarketshareifnewentrantsgoearly• Riskregulation,orGovtpenaltyifseentobetooobviouslygouging
• Newentrants• Encouragedtotakeriskbyspotprice• Butneedtoprotectinvestmentlongerterm• Needlowbarrierstoentry• Easierwithaccesstoendusermarkets
16

17
AEMOhas thebeginningsofaplan
• TheplanwillleadtolotsofrelativelylowcostVRE• Butdoesnotyetincorporatefirming• Doesnotincorporateoverallsystemtargets• It’snotauniversallyacceptedplan
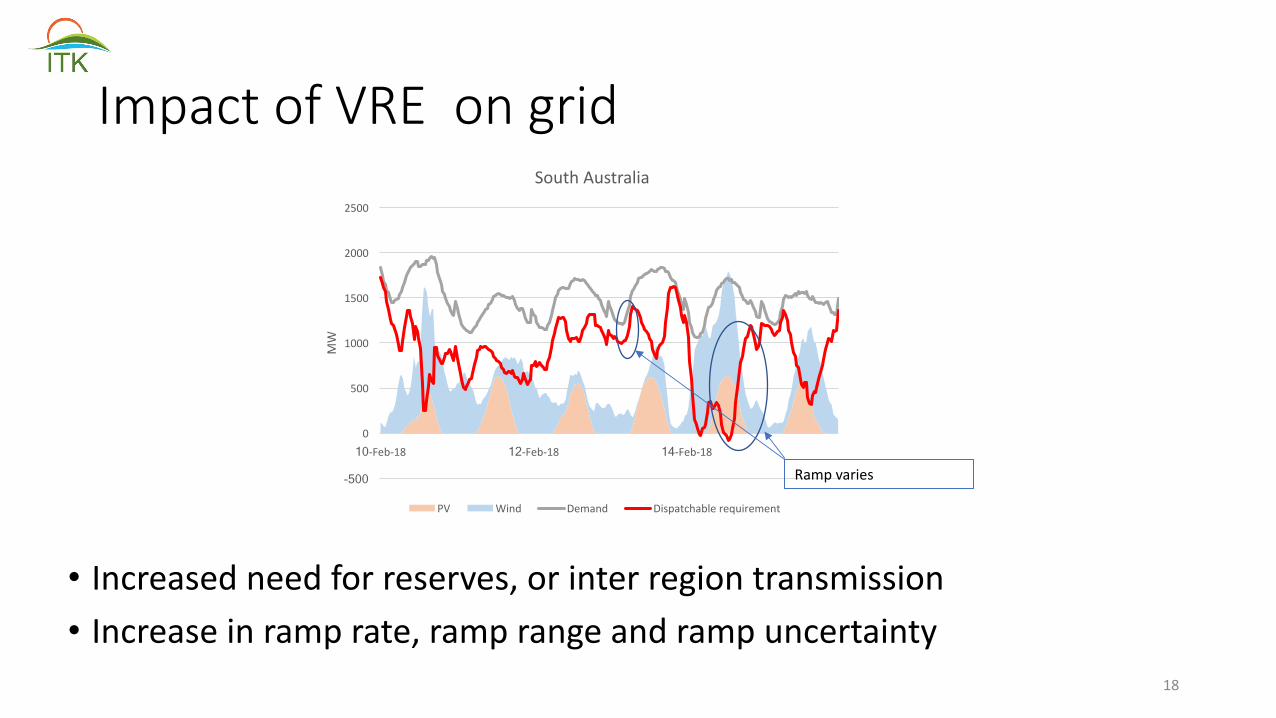
ImpactofVRE ongrid
• Increasedneedforreserves,orinterregiontransmission• Increaseinramprate,ramprangeandrampuncertainty
18
-500
0
500
1000
1500
2000
2500
10-Feb-18 12-Feb-18 14-Feb-18
MW
SouthAustralia
PV Wind Demand Dispatchablerequirement
Rampvaries

ImpactofVREonVREgenerators
• Morechanceofcurtailment• Curtailmentlowersvalue• ThenextunitofVREisworthlesstothesystemthantheunitthatcamebefore
• Lowerprice expectations
19

Costofindividuallyfirmedrenewables
20
$-
$50
$100
$150
$200
$250
$300
$350
Windnostore PVnostore Wind/PHES UtilityPV/PHES Biomass+AD Wind/Batt Conc.Solar UtilityPV/Batt Wind/H2 UtilityPV/H2 RooftopPV/Batt DryBiomass$2.5/GJ
Levelised
Costo
fEne
rgy($/M
Wh)
LCOEcontributions- 4hoursstorage2020estimates
collection initialconversion storage finalconversion
Source:ARENAstudyforthcoming

Lowercostswhenasystemviewistaken100%renewables
Power Energy LCOEGW TWh $MWh
PV 30 49Wind 43 159Total 73 208 50Spillagecost 6
HoursFirming 17 26 13Transmission 6Total 75SourceBlakersFeb2017
21
• Firminginvestmentmayneedcentralplanning• Transmission• Environment• Location• Quantity
• Blakers studyarguablyalreadyleadstoSnowy2.0

Carbatterypricesarefalling,butdata isanecdotal
22
0
20
40
60
80
100
120
140
160
180
200
ChevvyBolt TeslaModel3 Audi Teslatruck
2015 2016 2017 2017
US/KW
H
Electriccarbattterypackprices

Residentialbatteries cost3X-6Xcarbatteries
23
0 200 400 600 800 1000 1200 1400 1600
TeslaPowerwall2GCLE-KwBe5.6
SunGrowSBP4K8Ampetus"Super"LithiumBYDB-BoxLVResidential
SolaXPowerStationSoltaro
Alpha-ESSECOS5AmpetusEnergyPod
LGAquionAspen48S-2.2
OpalStoragePylontechUS2000B
DCSPV5.0DCSPV5.0DCSPV10.0TrinabessPowercube
RedflowZcellArvioSiriusCapacitorModule
Hybrid"Home"PlusDeltaHybridE5
Simpliphi
$KWH
Residentialbatteriescheapest50%of35brands
Source:Solarquotes