Embed Size (px)
Citation preview
POVERTY REDUCTION STRATEGY
PAPER:
1ST QUARTERLY PROGRESS REPORT FY 2009/10
PRSP Secretariat - Finance Division Government of Pakistan
1st QUARTERLY PROGRESS REPORT
FY 2009/10
The report has been written by Strengthening Poverty Reduction Strategy (PRS)
Monitoring Project, United Nations Development Program (UNDP), Federal Bank of Cooperatives, Islamabad.
1st Quarterly Progress Report FY 2009/10 Poverty Reduction Strategy Paper (PRSP)
1
Table of Contents List of Tables ........................................................................................................................... 2 List of Figures/Graphs/Boxes……………………………………………………………………….3 List of Acronyms ..................................................................................................................... 4 1 Introduction ................................................................................................................ 5 2 Overview of Pakistan’s Economy ................................................................................ 8 2.1 Agriculture .................................................................................................................... 8 2.2 Industry ........................................................................................................................ 9 2.3 Services ....................................................................................................................... 9 2.4 Inflation ....................................................................................................................... 10 2.5 Fiscal Balance………………………………………………………………………..…….11 2.6 Trade Balance ............................................................................................................ 11 2.7 Current Account Balance ........................................................................................... 11 3 Pro Poor Budgetary Expenditures………………………..……………………… .....12 3.1 Trends in Expenditure…………………………………………………….………………….12 3.1.1 Distribution of Expenditure………………………………………………………………..14 3.1.2 PRSP Budgetary Expenditures by Province and Sectors……………………………..16 3.2 Current and Development Expenditure…………………………………………………….17 3.3 PRSP Expenditures in Sub Sectors of Education and Health: ................................... 20 3.3.1 PRSP Expenditures in Sub Sector of Education .................................................... 20 3.3.2 PRSP Expenditures in Sub Sector of Health……………………………………………21 4 Protecting the Poor and Vulnerable .......................................................................... 24 4.1 Zakat .......................................................................................................................... 24 4.2 Employees’ Old Age Benefit Institution (EOBI) .......................................................... 26 4.3 Pakistan Bait-ul-Mal (PBM) ........................................................................................ 27 4.4 Benazir Income Support Program (BISP) .................................................................. 28 4.5 Punjab Food Support Scheme (PFSS) ...................................................................... 29 4.6 Punjab Sasti Roti Initiative/Scheme ........................................................................... 29 4.7 Workers Welfare Fund (WWF) ................................................................................... 30 4.8 Microfinance ............................................................................................................... 30 4.8.1 Active Borrowers by Peer Group ............................................................................ 31 4.8.2 Active Savers by Peer Group ................................................................................. 31 4.8.3 Active Policy Holders by Peer Group ..................................................................... 32 4.8.4 Summary of Microcredit Indicators ......................................................................... 33 5 Monitoring of PRSP Output (Intermediate) Indicators ............................................. 33 5.1 TT- Immunization Coverage ....................................................................................... 35 5.2 Lady Health Workers (LHWs) .................................................................................... 36 5.3 Land Distribution ........................................................................................................ 36 5.4 People Works Programme (PWP)-I ........................................................................... 36 5.5 Employment ............................................................................................................... 37

1st Quarterly Progress Report FY 2009/10 Poverty Reduction Strategy Paper (PRSP)
2
List of Tables Table 2.1 Growth in Key Macroeconomic Indicators…………………………………………10 Table 3.1: PRSP Budgetary Expenditures and Percentage Change between Q1 FY2009-10 & FY2008-09………………………………………………………........................12 Table 3.2: Effect of subsidies on overall expenditure change between Q1 FY 2008-09 and Q1 FY2009-10……………………………………………..……………..14 Table 3.3: Comparison of Proportional Contribution of PRSP Sectors in Budgetary Expenditures between Q1 FY 2008/09 and FY 2009/10……………………………….........15 Table 3.4: Percentage change in PRSP expenditures between Q1 FY 2008/09 and FY 2009/10 by sector and province……………………………………………………………………………………………16 Table 3.5: Total Current and Development PRSP Expenditure up to Q1 (FY 2008/09 – FY 2009/10)…………………………………………………..…………………17 Table 3.6: Percent change in Current and Development expenditure by provinces………………………………………………………………………...………………..18 Table 3.7: Percentage change in Current and Development Expenditure by sectors between Q 1 FY 2008/09 and FY2009/10…………………………………………………… 19 Table 3.8: Percentage change in PRSP education expenditures between Q1 FY 2008/09 and FY 2009/10 by province and sectors of Education…………………………….………..19 Table 3.9: Percentage distribution of education expenditures in Q1 FY 2008/09 and FY 2009/10 by province and sectors of Education……………………………………………….20 Table 3.10: Percentage change in PRSP health expenditures between Q1 FY 2008/09 and Q1 FY 2009/10 by province and sectors of Health…………………………………………..21 Table 3.11: Percentage distribution of health expenditures in Q1 FY 2008/09 and Q1 FY 2009/10 by province and sectors of Health…………………………………………………..22 Table 4.1: Comparison of Zakat Programmes Quarter I FY 2008/09 and Quarter I FY 2009/10……………………………………………………………………………………..24 Table 4.2: Programmes of Employees Old Age Benefits Institution (EOBI)……...............25 Table 4.3: Programmes of Pakistan Bait-ul-Mal (PBM)…………………………................26 Table 4.4: Benazir Income Support Programme…………………………………................27 Table 4.5: Microfinance Analysis…………………………………………………….............28 Table 4.6 Active Borrowers by Peer Group........................................................................29 Table 4.7: Active Savers by Peer Group………………………………………………..........30 Table 4.8: Active Policy Holders by Peer Group……………………………………………..30 Table 4.9: Summary of Microcredit Provision………………………………….....................32 Table 5.1: TT- Immunization Coverage for Pregnant Women……………..…………........33 Table 5.2: Lady Health Workers…..…………………………………………………………...34
1st Quarterly Progress Report FY 2009/10 Poverty Reduction Strategy Paper (PRSP)
3
Lists of Figures/Graphs/Boxes
Figure 3.1………………………………………….………………………………………………18 Graph 1…………………………………………………………………………………………….29 Graph 2…………………………………………………………………………………………….30 Graph 3…………………………………………………………………………………………….31 Box 1.1………………………………………………………………………………………………7 Box 2.1…………………………………………………………...................................................9
1st Quarterly Progress Report FY 2009/10 Poverty Reduction Strategy Paper (PRSP)
4
List of Acronyms AJ & K Azad Jammu & Kashmir BISP Benazir Income Support Programme CDA Capital Development Authority CPI Consumer Price Index CNIC Computerized National Identity Card CCT Conditional Cash Transfers CFIs Commercial Financial Institutions CSP Child Support Programme CSW Civil Society Wing EOBI Employee Old Age Benefit Institutions FY Financial Year FATA Federal Administrative Tribal Areas FSP Food Support Program FANA Federal Administrative Northern Areas FDI Foreign Direct Investment GOP Government of Pakistan GDP Gross Domestic Product GLP Gross Loan Portfolio ICT Islamabad Capital Territory LSM Large Scale Manufacturing LHWs Lady Health Workers LFS Labor Force Survey MIS Management Information System MPA Member Provincial Assembly MFIs Micro Finance Institutions MFBs Micro Finance Banks NEMIS National Education Management Information System NCRCL National Centre for Rehabilitation of Child Labor NGO Non-Governmental Organization NWFP North West Frontier Province PMN Pakistan Microfinance Network PWP-I Peoples Works Programme-I PBM Pakistan Bait-ul-Mal PRSP Poverty Reduction Strategy Paper PPPs Public Private Partnerships PSLM Pakistan Social and Living Standard Measurement Survey PFSS Punjab Food Support Scheme RSPs Rural Support Programmes SPI Sensitive Price indicator SBP State Bank of Pakistan TT-1 Tetanus Toxoid-1 TT-2+ Tetanus Toxoid-2+ WPI Wholesale Price Index WWF Workers Welfare Fund
1st Quarterly Progress Report FY 2009/10 Poverty Reduction Strategy Paper (PRSP)
5
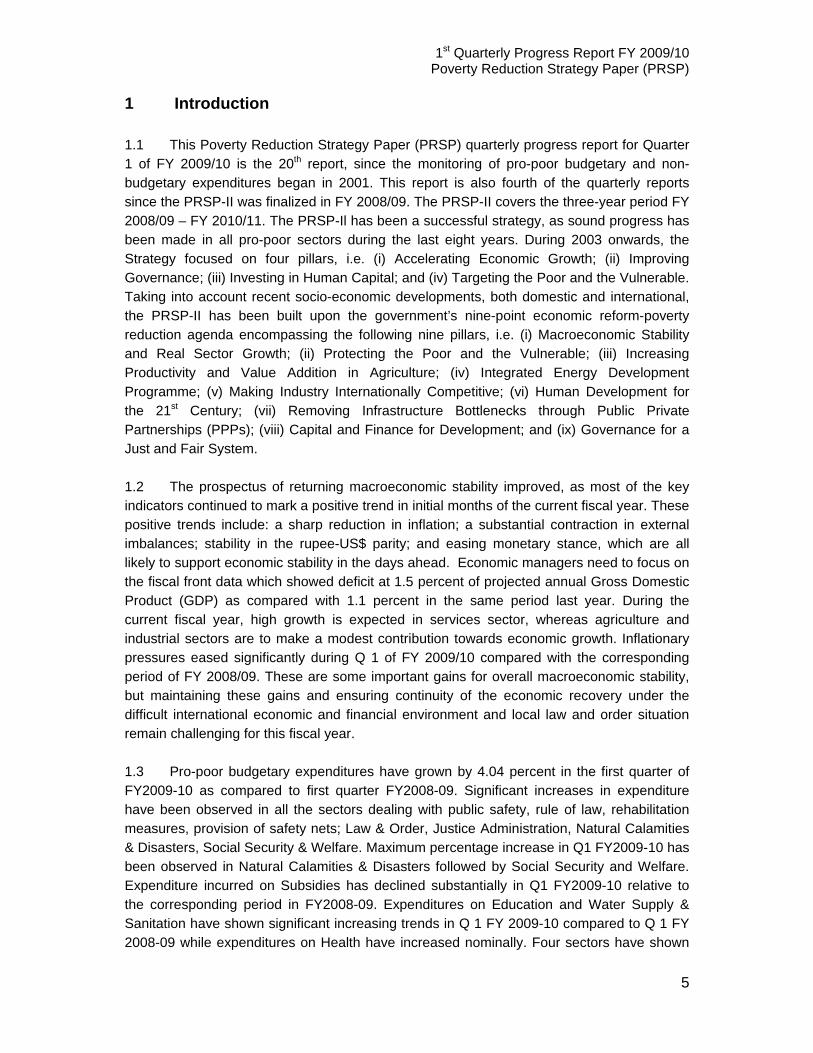
1 Introduction 1.1 This Poverty Reduction Strategy Paper (PRSP) quarterly progress report for Quarter 1 of FY 2009/10 is the 20th report, since the monitoring of pro-poor budgetary and non-budgetary expenditures began in 2001. This report is also fourth of the quarterly reports since the PRSP-II was finalized in FY 2008/09. The PRSP-II covers the three-year period FY 2008/09 – FY 2010/11. The PRSP-Il has been a successful strategy, as sound progress has been made in all pro-poor sectors during the last eight years. During 2003 onwards, the Strategy focused on four pillars, i.e. (i) Accelerating Economic Growth; (ii) Improving Governance; (iii) Investing in Human Capital; and (iv) Targeting the Poor and the Vulnerable. Taking into account recent socio-economic developments, both domestic and international, the PRSP-II has been built upon the government’s nine-point economic reform-poverty reduction agenda encompassing the following nine pillars, i.e. (i) Macroeconomic Stability and Real Sector Growth; (ii) Protecting the Poor and the Vulnerable; (iii) Increasing Productivity and Value Addition in Agriculture; (iv) Integrated Energy Development Programme; (v) Making Industry Internationally Competitive; (vi) Human Development for the 21st Century; (vii) Removing Infrastructure Bottlenecks through Public Private Partnerships (PPPs); (viii) Capital and Finance for Development; and (ix) Governance for a Just and Fair System. 1.2 The prospectus of returning macroeconomic stability improved, as most of the key indicators continued to mark a positive trend in initial months of the current fiscal year. These positive trends include: a sharp reduction in inflation; a substantial contraction in external imbalances; stability in the rupee-US$ parity; and easing monetary stance, which are all likely to support economic stability in the days ahead. Economic managers need to focus on the fiscal front data which showed deficit at 1.5 percent of projected annual Gross Domestic Product (GDP) as compared with 1.1 percent in the same period last year. During the current fiscal year, high growth is expected in services sector, whereas agriculture and industrial sectors are to make a modest contribution towards economic growth. Inflationary pressures eased significantly during Q 1 of FY 2009/10 compared with the corresponding period of FY 2008/09. These are some important gains for overall macroeconomic stability, but maintaining these gains and ensuring continuity of the economic recovery under the difficult international economic and financial environment and local law and order situation remain challenging for this fiscal year. 1.3 Pro-poor budgetary expenditures have grown by 4.04 percent in the first quarter of FY2009-10 as compared to first quarter FY2008-09. Significant increases in expenditure have been observed in all the sectors dealing with public safety, rule of law, rehabilitation measures, provision of safety nets; Law & Order, Justice Administration, Natural Calamities & Disasters, Social Security & Welfare. Maximum percentage increase in Q1 FY2009-10 has been observed in Natural Calamities & Disasters followed by Social Security and Welfare. Expenditure incurred on Subsidies has declined substantially in Q1 FY2009-10 relative to the corresponding period in FY2008-09. Expenditures on Education and Water Supply & Sanitation have shown significant increasing trends in Q 1 FY 2009-10 compared to Q 1 FY 2008-09 while expenditures on Health have increased nominally. Four sectors have shown
1st Quarterly Progress Report FY 2009/10 Poverty Reduction Strategy Paper (PRSP)
6
declining expenditure trends; Roads, Highways & Bridges, Population Planning, Land Reclamation and Subsidies. 1.4 This Quarterly Progress Report covers the status of tracking poverty reduction efforts during Q 1 of FY 2009/10 (July – September). Section 1 of the report briefly introduces the PRSP-II and its nine pillars. Section 2 gives an overview of Pakistan’s economy along with a brief discussion on key macroeconomic indicators. This section also compares the economic progress of Quarter 1 FY 2009/10 with Quarter 1 of FY 2008/09. Section 3 gives an analysis of the budgetary expenditures for 17 pro-poor sectors in general and education and health sectors in particular. Section 4 highlights both budgetary and non-budgetary modes to provide social protection to the poor and vulnerable and also illustrates expenditure tracking of the non-budgetary programmes. Section 5 briefly discusses monitoring of PRSP output (intermediate) indicators.
1st Quarterly Progress Report FY 2009/10 Poverty Reduction Strategy Paper (PRSP)
7
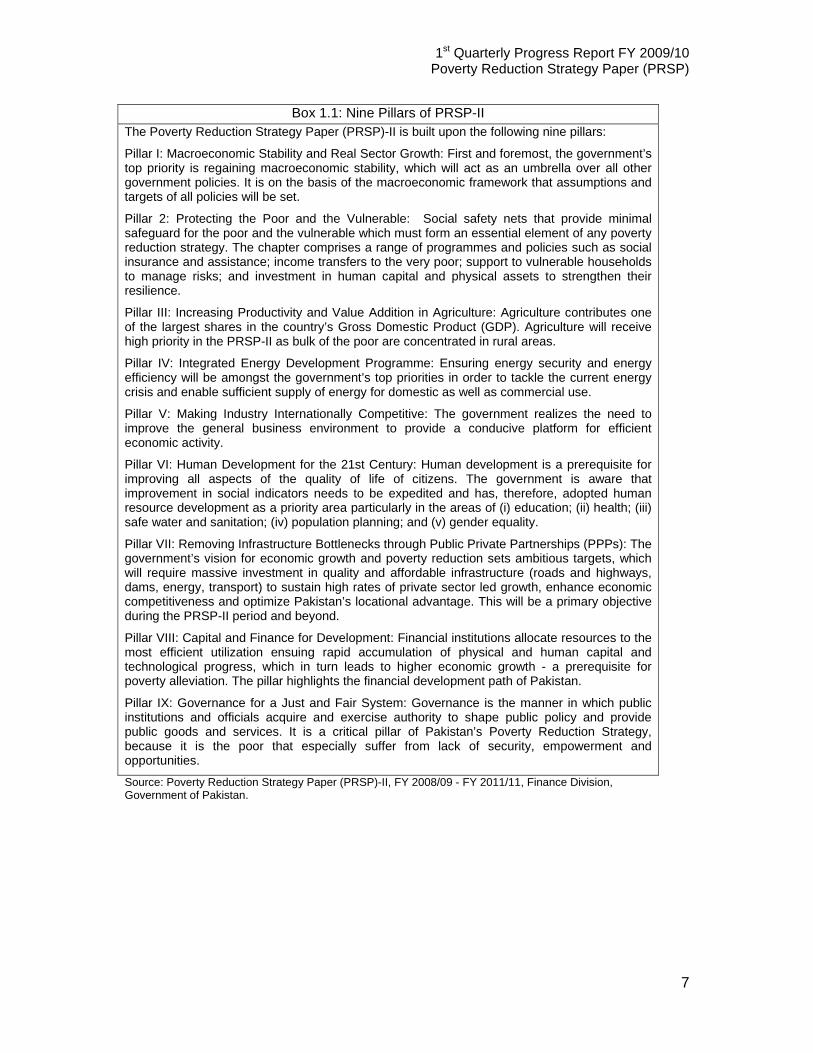
Box 1.1: Nine Pillars of PRSP-IIThe Poverty Reduction Strategy Paper (PRSP)-II is built upon the following nine pillars:
Pillar I: Macroeconomic Stability and Real Sector Growth: First and foremost, the government’s top priority is regaining macroeconomic stability, which will act as an umbrella over all other government policies. It is on the basis of the macroeconomic framework that assumptions and targets of all policies will be set.
Pillar 2: Protecting the Poor and the Vulnerable: Social safety nets that provide minimal safeguard for the poor and the vulnerable which must form an essential element of any poverty reduction strategy. The chapter comprises a range of programmes and policies such as social insurance and assistance; income transfers to the very poor; support to vulnerable households to manage risks; and investment in human capital and physical assets to strengthen their resilience.
Pillar III: Increasing Productivity and Value Addition in Agriculture: Agriculture contributes one of the largest shares in the country’s Gross Domestic Product (GDP). Agriculture will receive high priority in the PRSP-II as bulk of the poor are concentrated in rural areas.
Pillar IV: Integrated Energy Development Programme: Ensuring energy security and energy efficiency will be amongst the government’s top priorities in order to tackle the current energy crisis and enable sufficient supply of energy for domestic as well as commercial use.
Pillar V: Making Industry Internationally Competitive: The government realizes the need to improve the general business environment to provide a conducive platform for efficient economic activity.
Pillar VI: Human Development for the 21st Century: Human development is a prerequisite for improving all aspects of the quality of life of citizens. The government is aware that improvement in social indicators needs to be expedited and has, therefore, adopted human resource development as a priority area particularly in the areas of (i) education; (ii) health; (iii) safe water and sanitation; (iv) population planning; and (v) gender equality.
Pillar VII: Removing Infrastructure Bottlenecks through Public Private Partnerships (PPPs): The government’s vision for economic growth and poverty reduction sets ambitious targets, which will require massive investment in quality and affordable infrastructure (roads and highways, dams, energy, transport) to sustain high rates of private sector led growth, enhance economic competitiveness and optimize Pakistan’s locational advantage. This will be a primary objective during the PRSP-II period and beyond.
Pillar VIII: Capital and Finance for Development: Financial institutions allocate resources to the most efficient utilization ensuing rapid accumulation of physical and human capital and technological progress, which in turn leads to higher economic growth - a prerequisite for poverty alleviation. The pillar highlights the financial development path of Pakistan.
Pillar IX: Governance for a Just and Fair System: Governance is the manner in which public institutions and officials acquire and exercise authority to shape public policy and provide public goods and services. It is a critical pillar of Pakistan’s Poverty Reduction Strategy, because it is the poor that especially suffer from lack of security, empowerment and opportunities. Source: Poverty Reduction Strategy Paper (PRSP)-II, FY 2008/09 - FY 2011/11, Finance Division, Government of Pakistan.

1st Quarterly Progress Report FY 2009/10 Poverty Reduction Strategy Paper (PRSP)
8
2 Overview of Pakistan’s Economy 2.1 During Quarter 1 of FY 2009/10, the prospectus of returning macroeconomic stability improved, as most of the key indicators continued to mark a positive trend in initial months of the current fiscal year. These positive trends include: a sharp reduction in inflation; a substantial contraction in external imbalances; stability in the rupee-US$ parity; and easing monetary stance, which are all likely to support economic stability in the days ahead. However, on the fiscal front data for Quarter 1 FY 2009/10 shows deficit at 1.5 percent of projected annual GDP as compared with 1.1 percent in Q 1 of FY 2008/09. (see table 2.1). Whereas, the trade deficit reduced to 3.1 percent in Quarter 1 FY 2009/10 as compared with 5.3 percent in Q 1 FY 2008/09 and current account deficit reduced to 0.8 percent in Q 1 of FY 2009/10 as compared with 4.4 percent in Q 1 FY 2008/09. Overall economy is likely to grow 3.0 percent to 3.5 percent compared to 2.0 percent growth recorded for last fiscal year. High growth is expected in services sector, whereas agriculture and industrial sectors are to make a modest contribution towards economic growth. Inflationary pressures eased significantly during Q 1 of FY 2010 compared with the corresponding period of FY 2009. On average, CPI inflation during Q 1 FY 2010 was 10.5 percent which dropped significantly compared with 19-20 percent during Q 1 FY 2008/09. These are some important gains for overall macroeconomic stability, but maintaining these gains and ensuring continuity of the economic recovery under the difficult international economic and financial environment and local law and order situation remains challenging for this fiscal year. 2.1 Agriculture 2.2 The initial months’ review of agriculture sector’s performance in FY 2009/10, suggests that overall growth outlook for agriculture is somewhat gloomy in the current fiscal year and its performance is likely to be low as compared to FY 2008/09. However, a bumper wheat crop is expected on account of slight improvement in water supply, and relatively lower and stable fertilizer prices. Initial estimates further suggest that the performance of khraif crops in FY 2009/10 would be significantly weaker than in the corresponding period last year. Cotton was the only major crop to see increase in cultivated area whereas the area has declined under rice and sugarcane cultivation. The initial estimate for cotton production does not appear to be substantially higher than the previous Year1 FY 2008/09. Despite the increase in area, production is projected to remain around 12.1 million bales against the target of 13.4 million bales. 2.3 Initial estimates indicate a sharp decline in rice harvest relative to record crop last year, though it is higher than the target for FY 2009/10. The decline is the combined impact of lower area under rice, as well as, drop in its yield. The decline in area was anticipated due to decline in international prices and farmers disappointment over lower prices. Farmers were demanding a more active government response in the rice trade to stabilize the prices. The decline in yield is mainly attributed to shortfall in irrigation water in some rice growing districts during sowing time; the impact was further compounded by dry weather, particularly 1 However, the Sindh cotton crop is thought to be substantially higher than in the previous Year, benefitting from increase cultivation of Bt cotton. If the Punjab crop follows patters (or even remain unchanged from FY 09), the FY 10 cotton production could be significantly higher than suggested by initial estimates.

1st Quarterly Progress Report FY 2009/10 Poverty Reduction Strategy Paper (PRSP)
9
in Multan and Sargodha Region. Sugarcane after achieving a record harvest in FY 2007/08, its output dropped for the second consecutive year during FY 2009/10. The main reason was that the farmers brought lower area under sugarcane cultivation owing to constant disappointment from sugar mills on marketing issues. The growers may have thought to raise yield through higher application of fertilizers to maximise their gains. However, it is pertinent to mention that a balanced used of fertilizer helps maximise the crop yields, market related issues impede farmers to apply an appropriate mix of the nutrients (see Box 2.1).
Box 2.1: Fertilizer Issues Faced by the Farming Sector The main issues that farming sector faces today, regarding fertilizers consumption are:
a) Difficulties in timely availability at affordable prices b) Adulteration, and
c) Imbalanced use of Nutrients/fertilizers. At crucial stages fertilizers are usually missing from sale points and growers are on the mercy of traders. Efforts should be made to ensure regular supply of fertilizers. Delayed availability/application of fertilizers increases cost of production on one hand, and unable to play any active part in yield increases-resulting in misuse of resources and national wealth. Adulteration in fertilizers is common to maximize profit, which cause heavy cash and yield losses to the grower and shake their confidence. It is required to strictly impose lay upon those found involved in fertilizer adulteration. Researchers/Scientists agree that balanced use of fertilizers is necessary for yield maximization. Stakeholders should make efforts to educate farmers to apply balanced fertilizers. Through print and electronic media efforts to educate should be made to inform growers regarding balanced use of fertilizers to maximize crop yields. Balanced use of fertilizers also helps to reduce various plant diseases, thus increases yield. Fertilizer is an expansive and valuable input; and should be used judiciously.
Source: State Bank of Pakistan, First Quarter Report 2.2 Industry 2.4 The Large Scale Manufacturing (LSM) sector after declining for 13 consecutive months recovered mildly during July-October FY 2009/10 when it grows by 0.7 percent as compared with a decline of 5.0 percent during July-October FY 2008/09, (see table 2.1). The encouraging outcome was that almost half of the LSM sub-groups showed improvement from the previous year, mainly including industries producing consumer and intermediate goods. However, LSM has to still face the challenging factors including: severe energy shortages, deterioration in domestic law & order situation, and most importantly, weak external demand on the back of global recession and slowdown in domestic demand. 2.5 After slow start in July-August FY 2010, the LSM took impetus in October FY 2010 on the back of strong ginning activities and consolidating improvements in cement and auto mobile industries. Overall, textiles, leather, automobiles and rubber were few sectors that recorded net improvement in production in July-October FY 2010. In contrast, petroleum, metals and capital goods were major industries showing decline in production. The pace of recovery in domestic economy and in LSM will also depend on the supply and costs of two critical and vital factors: energy and finance. It is increasingly important for the sector to focus on removing structural constraints that hinder path to high growth in the longer term. 2.3 Services 2.6 Once again, the services sector has continued to maintain growth pattern in economic activity like in recent years. The growth in Services sector slightly increased in FY 2009/10 as compared with FY 2008/09 mainly on the back of an expected recovery in
1st Quarterly Progress Report FY 2009/10 Poverty Reduction Strategy Paper (PRSP)
10
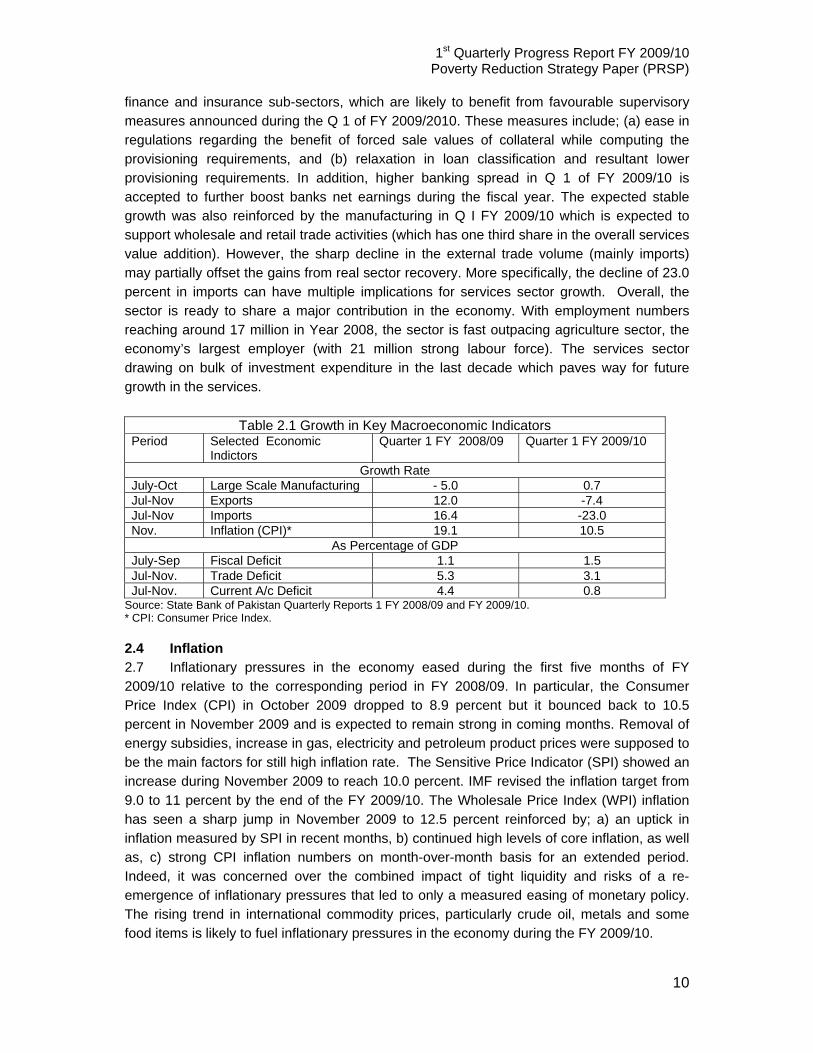
finance and insurance sub-sectors, which are likely to benefit from favourable supervisory measures announced during the Q 1 of FY 2009/2010. These measures include; (a) ease in regulations regarding the benefit of forced sale values of collateral while computing the provisioning requirements, and (b) relaxation in loan classification and resultant lower provisioning requirements. In addition, higher banking spread in Q 1 of FY 2009/10 is accepted to further boost banks net earnings during the fiscal year. The expected stable growth was also reinforced by the manufacturing in Q I FY 2009/10 which is expected to support wholesale and retail trade activities (which has one third share in the overall services value addition). However, the sharp decline in the external trade volume (mainly imports) may partially offset the gains from real sector recovery. More specifically, the decline of 23.0 percent in imports can have multiple implications for services sector growth. Overall, the sector is ready to share a major contribution in the economy. With employment numbers reaching around 17 million in Year 2008, the sector is fast outpacing agriculture sector, the economy’s largest employer (with 21 million strong labour force). The services sector drawing on bulk of investment expenditure in the last decade which paves way for future growth in the services.
Table 2.1 Growth in Key Macroeconomic Indicators Period Selected Economic
Indictors Quarter 1 FY 2008/09 Quarter 1 FY 2009/10
Growth Rate July-Oct Large Scale Manufacturing - 5.0 0.7 Jul-Nov Exports 12.0 -7.4 Jul-Nov Imports 16.4 -23.0 Nov. Inflation (CPI)* 19.1 10.5
As Percentage of GDP July-Sep Fiscal Deficit 1.1 1.5 Jul-Nov. Trade Deficit 5.3 3.1 Jul-Nov. Current A/c Deficit 4.4 0.8
Source: State Bank of Pakistan Quarterly Reports 1 FY 2008/09 and FY 2009/10. * CPI: Consumer Price Index. 2.4 Inflation 2.7 Inflationary pressures in the economy eased during the first five months of FY 2009/10 relative to the corresponding period in FY 2008/09. In particular, the Consumer Price Index (CPI) in October 2009 dropped to 8.9 percent but it bounced back to 10.5 percent in November 2009 and is expected to remain strong in coming months. Removal of energy subsidies, increase in gas, electricity and petroleum product prices were supposed to be the main factors for still high inflation rate. The Sensitive Price Indicator (SPI) showed an increase during November 2009 to reach 10.0 percent. IMF revised the inflation target from 9.0 to 11 percent by the end of the FY 2009/10. The Wholesale Price Index (WPI) inflation has seen a sharp jump in November 2009 to 12.5 percent reinforced by; a) an uptick in inflation measured by SPI in recent months, b) continued high levels of core inflation, as well as, c) strong CPI inflation numbers on month-over-month basis for an extended period. Indeed, it was concerned over the combined impact of tight liquidity and risks of a re-emergence of inflationary pressures that led to only a measured easing of monetary policy. The rising trend in international commodity prices, particularly crude oil, metals and some food items is likely to fuel inflationary pressures in the economy during the FY 2009/10.
1st Quarterly Progress Report FY 2009/10 Poverty Reduction Strategy Paper (PRSP)
11
2.5 Fiscal Balance 2.8 The fiscal deficit has increased to 1.5 percent of GDP during Q 1 FY 2010 compared to 1.1 percent during corresponding Q 1 of last fiscal year. The higher than expected deficit in Q 1 of the FY 2010 was due to unexpected rise in spending related to anti-terrorists operations and delays in some revenue receipts into the next quarter. According to the SBP report, “the rising fiscal imbalance and greater quasi-fiscal activities2 have increased the risk to macroeconomic stability”. As far as revenues are concerned, during Quarter 1 FY 2010 the major contribution in revenue was of non-tax revenue. This is because jumps in non-tax revenue are unpredictable, and are often not sustained in each quarter of the fiscal year. In the emerging scenario, the government faces very difficult choices, with high pressure to enhance social sector spending and to build an infrastructure, even as the costs of the anti-military campaign continue to mount. At the same time, weak economy constraints and its ability to raise revenue from the existing tax base to provide needed essential services and public goods. In the medium term, given the government expenditure pace, revenue enhancement through tax reforms will be a key to fiscal consolidation. 2.6 Trade Balance 2.9 Pakistan’s trade deficit declined significantly by 37.8 percent during July-Nov FY 2009/10 in contrast to 20.8 percent rise in the same period last year. The main reason for decline in deficit was entirely due to 23.0 percent fall in the import bill as exports continued to decline, recording fall of 7.7 percent. The contraction in imports was a result of combination of restrained demand, better domestic production of some key commodities (wheat and cotton) as well as fall in the international commodity prices. Similar to imports, the fall in exports was also broad-based. Growth in all main categories either further declined or turned negative. Both the star performers of FY 2008/09, rice and cement, posted negative growth during July-Nov. FY 2009/10. Rice exports suffered due to fall in prices as international supply conditions improved. Cement exports on the other hand declined due to fall in demand July-Nov. FY 2010. 2.7 Current Account Balance 2.10 The lower current account deficit during July-Nov FY 2009/10 is a result of strong growth in remittances and inflows from the IFIs and a fall in imports which is still more than the decline in exports. The net foreign investment contracted by 22.4 percent and net portfolio investment turned positive, contributing 301 million US$ during July-November, against a decline of 182 US $ in the corresponding year last year. Foreign Direct Investment, on the other hand, did not show any signs of recovery and declined by 52.3 percent during the period under review. The deteriorating law and order situation and low activity in the privatization process were the two main reasons for reduced Foreign Direct Investment (FDI) in the country. Pakistan’s current account deficit decreased significantly to 0.8 percent during Q 1 FY 2009/10 compared to 4.4 percent during the same period i.e. Q 1 FY 2008/09.
2 quasi-fiscal activities are activities (under the direction of government) of central banks or other public financial or nonfinancial ...
1st Quarterly Progress Report FY 2009/10 Poverty Reduction Strategy Paper (PRSP)
12
2.11 It seems that the positive macroeconomic trends in the economy do prevail during the FY 2009/10, however, it is feared that they might not be sustainable. The on-going war against terrorism, severe energy crisis, low ratio of FDI, bleak chances of joint ventures and privatization would be serious challenges for the country. In such a scenario, when there is a need to spend more on social sector and social safety nets, it is highly recommended to control government spending, limited borrowing from the banking system and rapid growth in services sector. There is a need to enhance the rate of growth of the economy particularly by concentrating on program designed to raise agriculture incomes, making necessary investments for removing constraints in the manufacturing sector, and enhancing tax-GDP ratio.
1st Quarterly Progress Report FY 2009/10 Poverty Reduction Strategy Paper (PRSP)
13
3 Pro Poor Budgetary Expenditures Introduction:
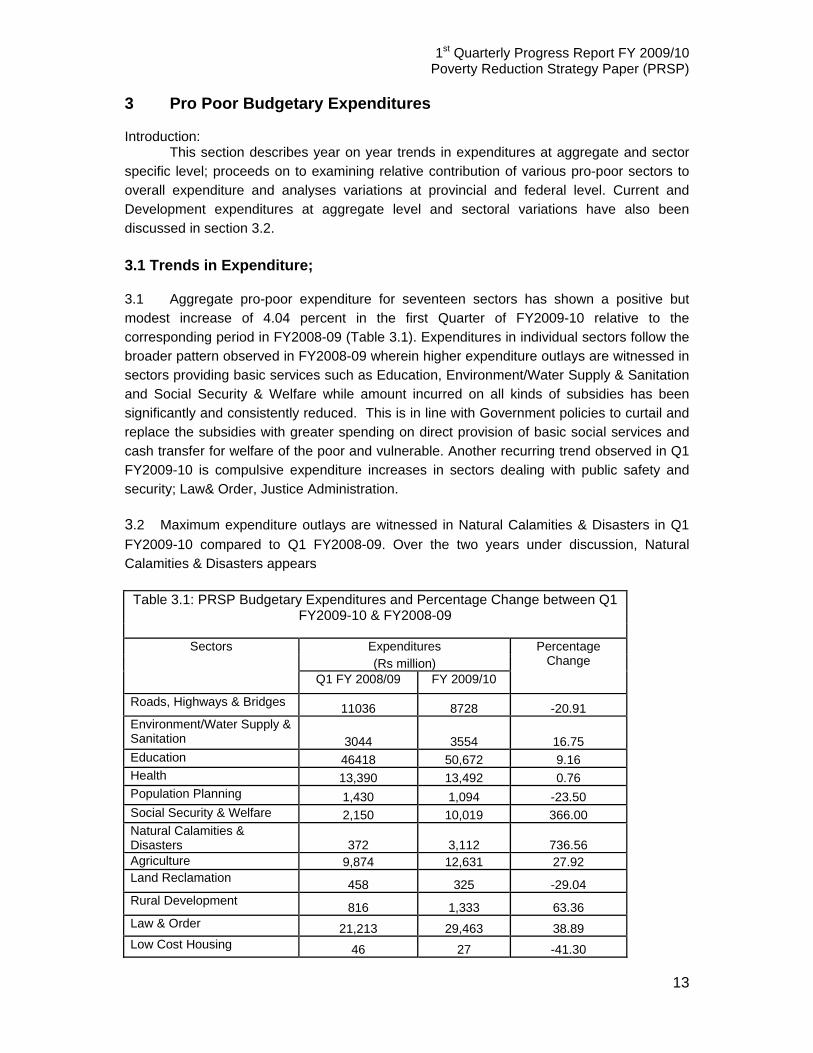
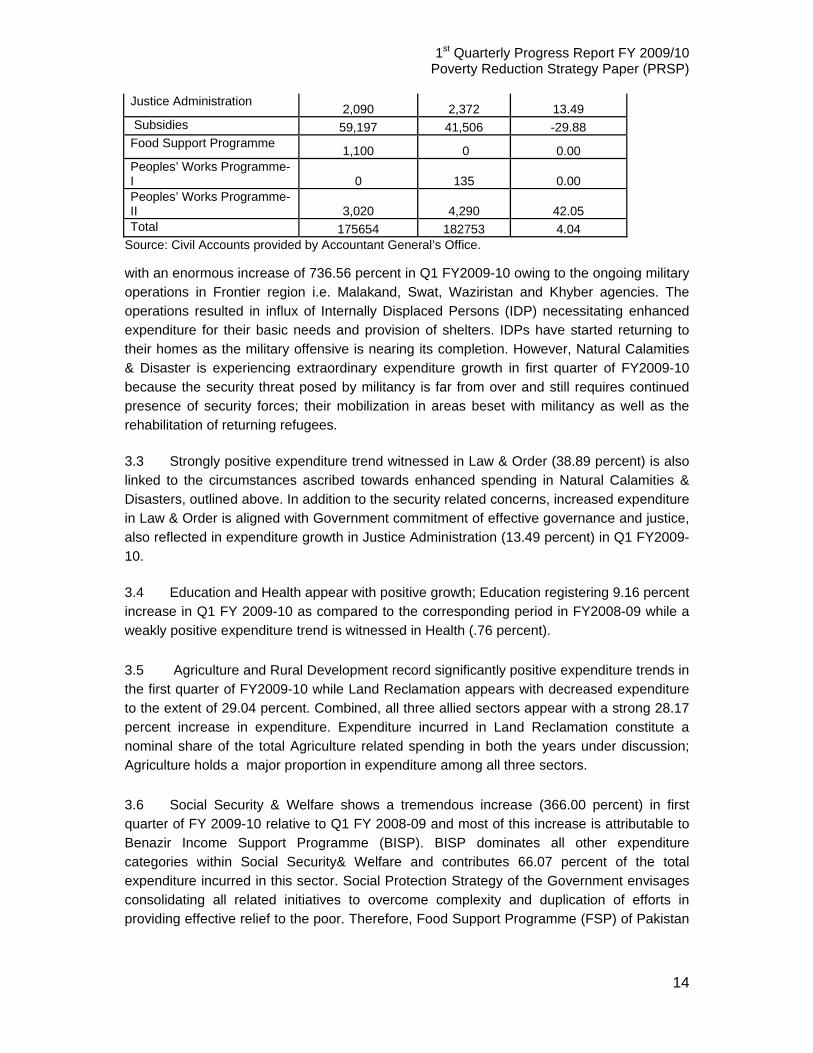
This section describes year on year trends in expenditures at aggregate and sector specific level; proceeds on to examining relative contribution of various pro-poor sectors to overall expenditure and analyses variations at provincial and federal level. Current and Development expenditures at aggregate level and sectoral variations have also been discussed in section 3.2. 3.1 Trends in Expenditure; 3.1 Aggregate pro-poor expenditure for seventeen sectors has shown a positive but modest increase of 4.04 percent in the first Quarter of FY2009-10 relative to the corresponding period in FY2008-09 (Table 3.1). Expenditures in individual sectors follow the broader pattern observed in FY2008-09 wherein higher expenditure outlays are witnessed in sectors providing basic services such as Education, Environment/Water Supply & Sanitation and Social Security & Welfare while amount incurred on all kinds of subsidies has been significantly and consistently reduced. This is in line with Government policies to curtail and replace the subsidies with greater spending on direct provision of basic social services and cash transfer for welfare of the poor and vulnerable. Another recurring trend observed in Q1 FY2009-10 is compulsive expenditure increases in sectors dealing with public safety and security; Law& Order, Justice Administration. 3.2 Maximum expenditure outlays are witnessed in Natural Calamities & Disasters in Q1 FY2009-10 compared to Q1 FY2008-09. Over the two years under discussion, Natural Calamities & Disasters appears
Table 3.1: PRSP Budgetary Expenditures and Percentage Change between Q1
FY2009-10 & FY2008-09
Sectors Expenditures Percentage Change (Rs million)
Q1 FY 2008/09 FY 2009/10
Roads, Highways & Bridges 11036 8728 -20.91 Environment/Water Supply & Sanitation 3044 3554 16.75 Education 46418 50,672 9.16 Health 13,390 13,492 0.76 Population Planning 1,430 1,094 -23.50 Social Security & Welfare 2,150 10,019 366.00 Natural Calamities & Disasters 372 3,112 736.56 Agriculture 9,874 12,631 27.92 Land Reclamation 458 325 -29.04 Rural Development 816 1,333 63.36 Law & Order 21,213 29,463 38.89 Low Cost Housing 46 27 -41.30
1st Quarterly Progress Report FY 2009/10 Poverty Reduction Strategy Paper (PRSP)
14
Justice Administration 2,090 2,372 13.49 Subsidies 59,197 41,506 -29.88 Food Support Programme 1,100 0 0.00 Peoples’ Works Programme-I 0 135 0.00 Peoples’ Works Programme-II 3,020 4,290 42.05 Total 175654 182753 4.04
Source: Civil Accounts provided by Accountant General’s Office. with an enormous increase of 736.56 percent in Q1 FY2009-10 owing to the ongoing military operations in Frontier region i.e. Malakand, Swat, Waziristan and Khyber agencies. The operations resulted in influx of Internally Displaced Persons (IDP) necessitating enhanced expenditure for their basic needs and provision of shelters. IDPs have started returning to their homes as the military offensive is nearing its completion. However, Natural Calamities & Disaster is experiencing extraordinary expenditure growth in first quarter of FY2009-10 because the security threat posed by militancy is far from over and still requires continued presence of security forces; their mobilization in areas beset with militancy as well as the rehabilitation of returning refugees. 3.3 Strongly positive expenditure trend witnessed in Law & Order (38.89 percent) is also linked to the circumstances ascribed towards enhanced spending in Natural Calamities & Disasters, outlined above. In addition to the security related concerns, increased expenditure in Law & Order is aligned with Government commitment of effective governance and justice, also reflected in expenditure growth in Justice Administration (13.49 percent) in Q1 FY2009-10. 3.4 Education and Health appear with positive growth; Education registering 9.16 percent increase in Q1 FY 2009-10 as compared to the corresponding period in FY2008-09 while a weakly positive expenditure trend is witnessed in Health (.76 percent). 3.5 Agriculture and Rural Development record significantly positive expenditure trends in the first quarter of FY2009-10 while Land Reclamation appears with decreased expenditure to the extent of 29.04 percent. Combined, all three allied sectors appear with a strong 28.17 percent increase in expenditure. Expenditure incurred in Land Reclamation constitute a nominal share of the total Agriculture related spending in both the years under discussion; Agriculture holds a major proportion in expenditure among all three sectors. 3.6 Social Security & Welfare shows a tremendous increase (366.00 percent) in first quarter of FY 2009-10 relative to Q1 FY 2008-09 and most of this increase is attributable to Benazir Income Support Programme (BISP). BISP dominates all other expenditure categories within Social Security& Welfare and contributes 66.07 percent of the total expenditure incurred in this sector. Social Protection Strategy of the Government envisages consolidating all related initiatives to overcome complexity and duplication of efforts in providing effective relief to the poor. Therefore, Food Support Programme (FSP) of Pakistan
1st Quarterly Progress Report FY 2009/10 Poverty Reduction Strategy Paper (PRSP)
15
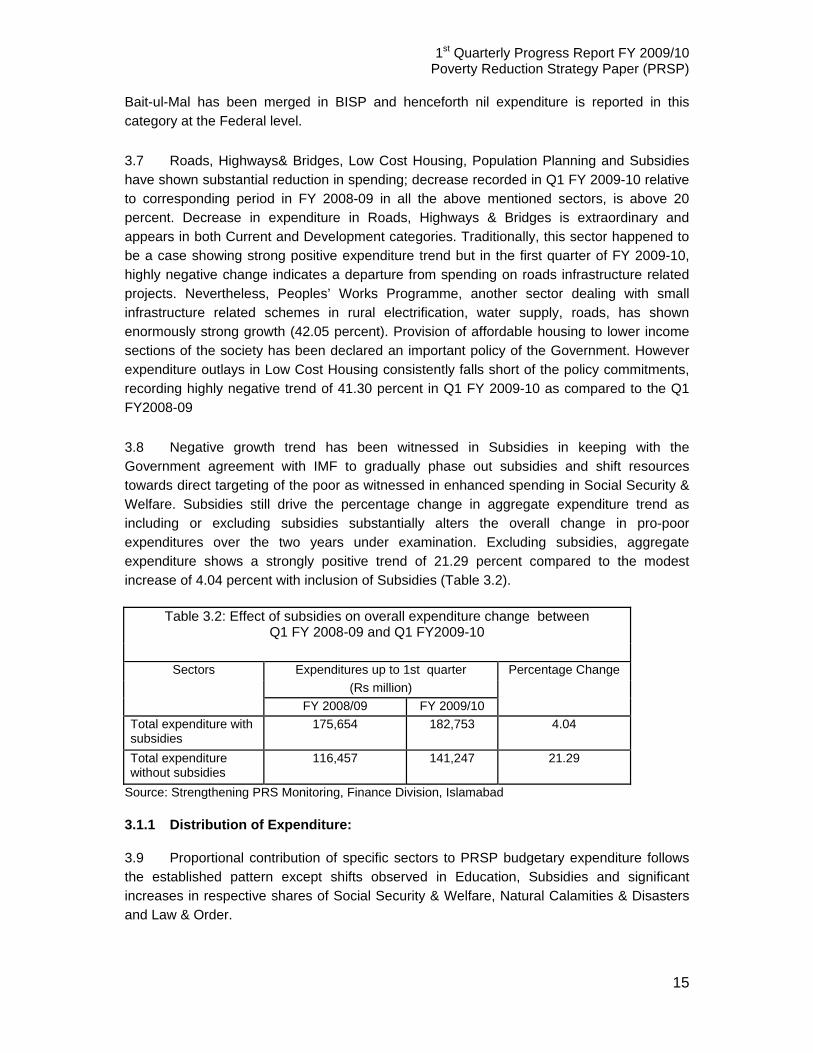
Bait-ul-Mal has been merged in BISP and henceforth nil expenditure is reported in this category at the Federal level. 3.7 Roads, Highways& Bridges, Low Cost Housing, Population Planning and Subsidies have shown substantial reduction in spending; decrease recorded in Q1 FY 2009-10 relative to corresponding period in FY 2008-09 in all the above mentioned sectors, is above 20 percent. Decrease in expenditure in Roads, Highways & Bridges is extraordinary and appears in both Current and Development categories. Traditionally, this sector happened to be a case showing strong positive expenditure trend but in the first quarter of FY 2009-10, highly negative change indicates a departure from spending on roads infrastructure related projects. Nevertheless, Peoples’ Works Programme, another sector dealing with small infrastructure related schemes in rural electrification, water supply, roads, has shown enormously strong growth (42.05 percent). Provision of affordable housing to lower income sections of the society has been declared an important policy of the Government. However expenditure outlays in Low Cost Housing consistently falls short of the policy commitments, recording highly negative trend of 41.30 percent in Q1 FY 2009-10 as compared to the Q1 FY2008-09 3.8 Negative growth trend has been witnessed in Subsidies in keeping with the Government agreement with IMF to gradually phase out subsidies and shift resources towards direct targeting of the poor as witnessed in enhanced spending in Social Security & Welfare. Subsidies still drive the percentage change in aggregate expenditure trend as including or excluding subsidies substantially alters the overall change in pro-poor expenditures over the two years under examination. Excluding subsidies, aggregate expenditure shows a strongly positive trend of 21.29 percent compared to the modest increase of 4.04 percent with inclusion of Subsidies (Table 3.2).
Table 3.2: Effect of subsidies on overall expenditure change between Q1 FY 2008-09 and Q1 FY2009-10
Sectors Expenditures up to 1st quarter Percentage Change
(Rs million) FY 2008/09 FY 2009/10
Total expenditure with subsidies
175,654 182,753 4.04
Total expenditure without subsidies
116,457 141,247 21.29
Source: Strengthening PRS Monitoring, Finance Division, Islamabad 3.1.1 Distribution of Expenditure: 3.9 Proportional contribution of specific sectors to PRSP budgetary expenditure follows the established pattern except shifts observed in Education, Subsidies and significant increases in respective shares of Social Security & Welfare, Natural Calamities & Disasters and Law & Order.
1st Quarterly Progress Report FY 2009/10 Poverty Reduction Strategy Paper (PRSP)
16
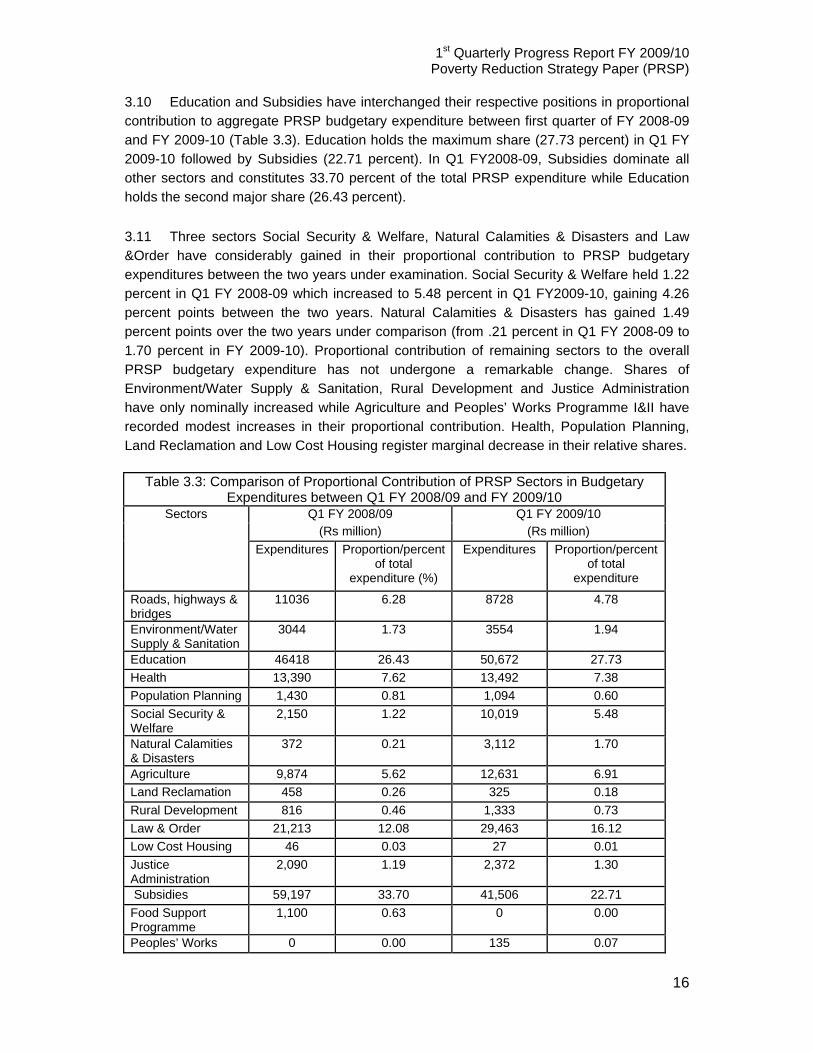
3.10 Education and Subsidies have interchanged their respective positions in proportional contribution to aggregate PRSP budgetary expenditure between first quarter of FY 2008-09 and FY 2009-10 (Table 3.3). Education holds the maximum share (27.73 percent) in Q1 FY 2009-10 followed by Subsidies (22.71 percent). In Q1 FY2008-09, Subsidies dominate all other sectors and constitutes 33.70 percent of the total PRSP expenditure while Education holds the second major share (26.43 percent). 3.11 Three sectors Social Security & Welfare, Natural Calamities & Disasters and Law &Order have considerably gained in their proportional contribution to PRSP budgetary expenditures between the two years under examination. Social Security & Welfare held 1.22 percent in Q1 FY 2008-09 which increased to 5.48 percent in Q1 FY2009-10, gaining 4.26 percent points between the two years. Natural Calamities & Disasters has gained 1.49 percent points over the two years under comparison (from .21 percent in Q1 FY 2008-09 to 1.70 percent in FY 2009-10). Proportional contribution of remaining sectors to the overall PRSP budgetary expenditure has not undergone a remarkable change. Shares of Environment/Water Supply & Sanitation, Rural Development and Justice Administration have only nominally increased while Agriculture and Peoples’ Works Programme I&II have recorded modest increases in their proportional contribution. Health, Population Planning, Land Reclamation and Low Cost Housing register marginal decrease in their relative shares.
Table 3.3: Comparison of Proportional Contribution of PRSP Sectors in Budgetary Expenditures between Q1 FY 2008/09 and FY 2009/10
Sectors Q1 FY 2008/09 Q1 FY 2009/10 (Rs million) (Rs million)
Expenditures Proportion/percent of total
expenditure (%)
Expenditures Proportion/percent of total
expenditure
Roads, highways & bridges
11036 6.28 8728 4.78
Environment/Water Supply & Sanitation
3044 1.73 3554 1.94
Education 46418 26.43 50,672 27.73 Health 13,390 7.62 13,492 7.38 Population Planning 1,430 0.81 1,094 0.60 Social Security & Welfare
2,150 1.22 10,019 5.48
Natural Calamities & Disasters
372 0.21 3,112 1.70
Agriculture 9,874 5.62 12,631 6.91 Land Reclamation 458 0.26 325 0.18 Rural Development 816 0.46 1,333 0.73 Law & Order 21,213 12.08 29,463 16.12 Low Cost Housing 46 0.03 27 0.01 Justice Administration
2,090 1.19 2,372 1.30
Subsidies 59,197 33.70 41,506 22.71 Food Support Programme
1,100 0.63 0 0.00
Peoples’ Works 0 0.00 135 0.07
1st Quarterly Progress Report FY 2009/10 Poverty Reduction Strategy Paper (PRSP)
17
Programme-I Peoples’ Works Programme-II
3,020 1.72 4,290 2.35
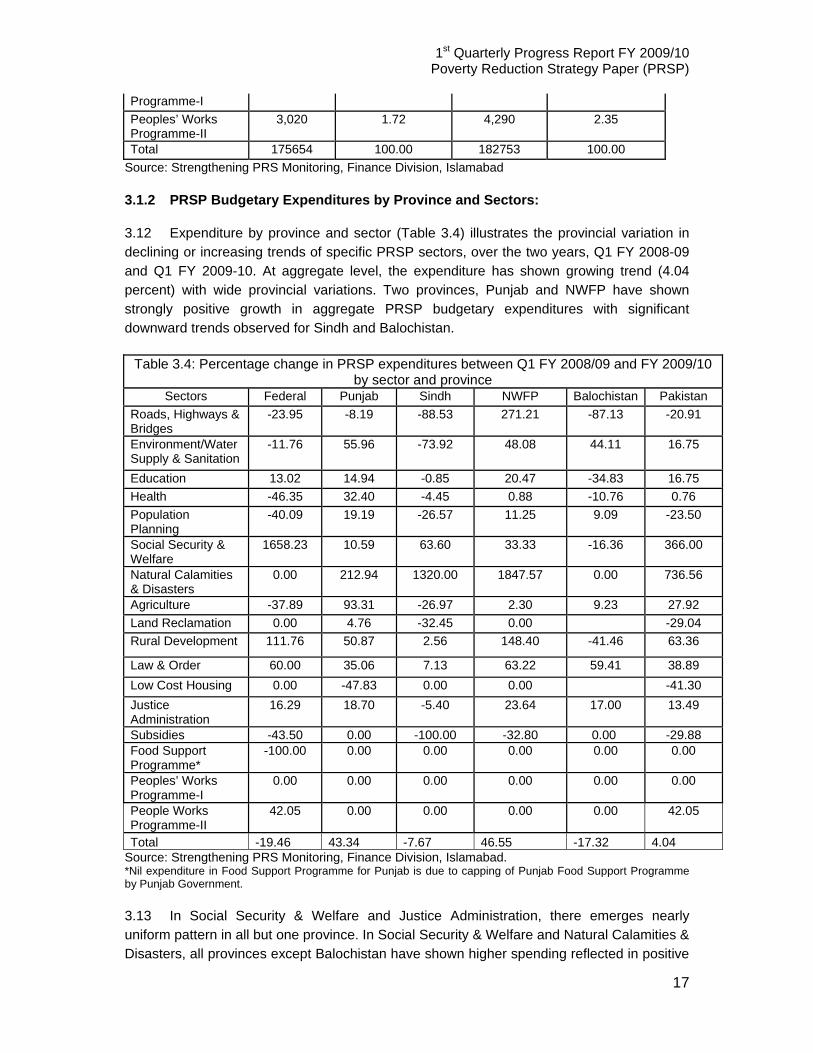
Total 175654 100.00 182753 100.00 Source: Strengthening PRS Monitoring, Finance Division, Islamabad 3.1.2 PRSP Budgetary Expenditures by Province and Sectors: 3.12 Expenditure by province and sector (Table 3.4) illustrates the provincial variation in declining or increasing trends of specific PRSP sectors, over the two years, Q1 FY 2008-09 and Q1 FY 2009-10. At aggregate level, the expenditure has shown growing trend (4.04 percent) with wide provincial variations. Two provinces, Punjab and NWFP have shown strongly positive growth in aggregate PRSP budgetary expenditures with significant downward trends observed for Sindh and Balochistan.
Table 3.4: Percentage change in PRSP expenditures between Q1 FY 2008/09 and FY 2009/10 by sector and province
Sectors Federal Punjab Sindh NWFP Balochistan Pakistan Roads, Highways & Bridges
-23.95 -8.19 -88.53 271.21 -87.13 -20.91
Environment/Water Supply & Sanitation
-11.76 55.96 -73.92 48.08 44.11 16.75
Education 13.02 14.94 -0.85 20.47 -34.83 16.75 Health -46.35 32.40 -4.45 0.88 -10.76 0.76 Population Planning
-40.09 19.19 -26.57 11.25 9.09 -23.50
Social Security & Welfare
1658.23 10.59 63.60 33.33 -16.36 366.00
Natural Calamities & Disasters
0.00 212.94 1320.00 1847.57 0.00 736.56
Agriculture -37.89 93.31 -26.97 2.30 9.23 27.92 Land Reclamation 0.00 4.76 -32.45 0.00 -29.04 Rural Development 111.76 50.87 2.56 148.40 -41.46 63.36
Law & Order 60.00 35.06 7.13 63.22 59.41 38.89 Low Cost Housing 0.00 -47.83 0.00 0.00 -41.30 Justice Administration
16.29 18.70 -5.40 23.64 17.00 13.49
Subsidies -43.50 0.00 -100.00 -32.80 0.00 -29.88 Food Support Programme*
-100.00 0.00 0.00 0.00 0.00 0.00
Peoples’ Works Programme-I
0.00 0.00 0.00 0.00 0.00 0.00
People Works Programme-II
42.05 0.00 0.00 0.00 0.00 42.05
Total -19.46 43.34 -7.67 46.55 -17.32 4.04 Source: Strengthening PRS Monitoring, Finance Division, Islamabad. *Nil expenditure in Food Support Programme for Punjab is due to capping of Punjab Food Support Programme by Punjab Government. 3.13 In Social Security & Welfare and Justice Administration, there emerges nearly uniform pattern in all but one province. In Social Security & Welfare and Natural Calamities & Disasters, all provinces except Balochistan have shown higher spending reflected in positive
1st Quarterly Progress Report FY 2009/10 Poverty Reduction Strategy Paper (PRSP)
18
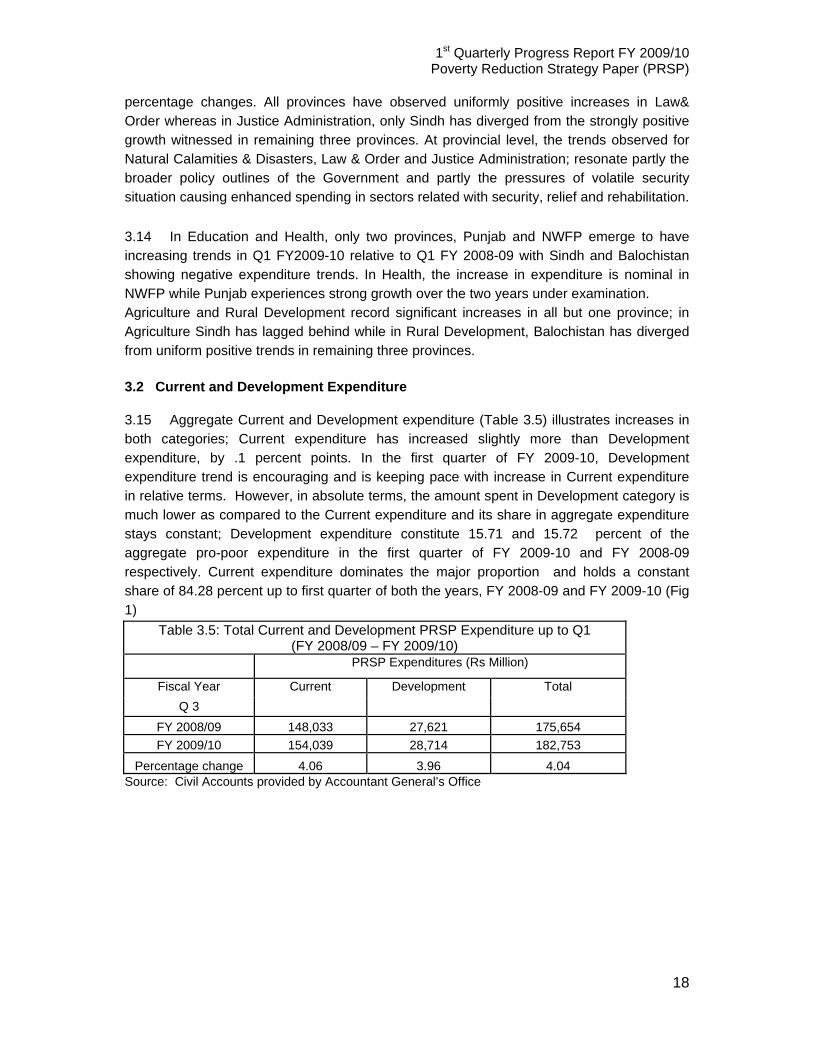
percentage changes. All provinces have observed uniformly positive increases in Law& Order whereas in Justice Administration, only Sindh has diverged from the strongly positive growth witnessed in remaining three provinces. At provincial level, the trends observed for Natural Calamities & Disasters, Law & Order and Justice Administration; resonate partly the broader policy outlines of the Government and partly the pressures of volatile security situation causing enhanced spending in sectors related with security, relief and rehabilitation. 3.14 In Education and Health, only two provinces, Punjab and NWFP emerge to have increasing trends in Q1 FY2009-10 relative to Q1 FY 2008-09 with Sindh and Balochistan showing negative expenditure trends. In Health, the increase in expenditure is nominal in NWFP while Punjab experiences strong growth over the two years under examination. Agriculture and Rural Development record significant increases in all but one province; in Agriculture Sindh has lagged behind while in Rural Development, Balochistan has diverged from uniform positive trends in remaining three provinces. 3.2 Current and Development Expenditure 3.15 Aggregate Current and Development expenditure (Table 3.5) illustrates increases in both categories; Current expenditure has increased slightly more than Development expenditure, by .1 percent points. In the first quarter of FY 2009-10, Development expenditure trend is encouraging and is keeping pace with increase in Current expenditure in relative terms. However, in absolute terms, the amount spent in Development category is much lower as compared to the Current expenditure and its share in aggregate expenditure stays constant; Development expenditure constitute 15.71 and 15.72 percent of the aggregate pro-poor expenditure in the first quarter of FY 2009-10 and FY 2008-09 respectively. Current expenditure dominates the major proportion and holds a constant share of 84.28 percent up to first quarter of both the years, FY 2008-09 and FY 2009-10 (Fig 1)
Table 3.5: Total Current and Development PRSP Expenditure up to Q1 (FY 2008/09 – FY 2009/10)
PRSP Expenditures (Rs Million)
Fiscal Year Current Development Total Q 3
FY 2008/09 148,033 27,621 175,654 FY 2009/10 154,039 28,714 182,753
Percentage change 4.06 3.96 4.04 Source: Civil Accounts provided by Accountant General’s Office

1st Quarterly Progress Report FY 2009/10 Poverty Reduction Strategy Paper (PRSP)
19
Fig. 3.1
3.16 Expenditure trends in Current and Development categories by provinces and at
federal level illustrate the provincial variation in growth of respective categories of
expenditure (Table 3.6). At provincial level, there are wide dispersions; strong growth is
observed in both Current and Development expenditures for Punjab and NWFP while Sindh
and Balochistan have shown highly negative expenditure trends for Development
expenditure. Modest expenditure growth is observed in case of Current expenditure for
Sindh; Balochistan has shown negative trends even for Current expenditure.
Table 3.6 : Percent change in Current and Development expenditure by
provinces 2009-10 (Rs. million) 2008-09 (Rs.million) Percentage change
Current Development Current Development Current Development
Federal 59,300 8,133 73,941 9,780 -19.80 -16.84
Punjab 54,851 13,146 39,383 8,054 39.28 63.22
Sindh 20,188 2,856 18,917 6,040 6.72 -52.72
NWFP 14,846 3,795 10,602 2,118 40.03 79.18
Balochistan 4,854 784 5,190 1,629 -6.47 -51.87
Source: Civil Accounts provided by Accountant General’s Office 3.17 In keeping with the observed, highly positive trends at the aggregate level for Social Security & Welfare, Natural Calamities & Disasters, Environment/Water Supply & Sanitation, Agriculture and Law & Order; both Current and Development expenditures in these sectors have recorded positive growth trends (Table 3.7). Education and Health experience positive Current expenditure trends which are offset by declining trends on the Development side, resulting in corresponding modest growth at the aggregate level for these two sectors. Development expenditure in Justice Administration is highly negative as opposed to increasing trend on Current expenditure side which has affected the overall trend for the sector. Declining trends are witnessed in both Current and Development expenditure
1st Quarterly Progress Report FY 2009/10 Poverty Reduction Strategy Paper (PRSP)
20
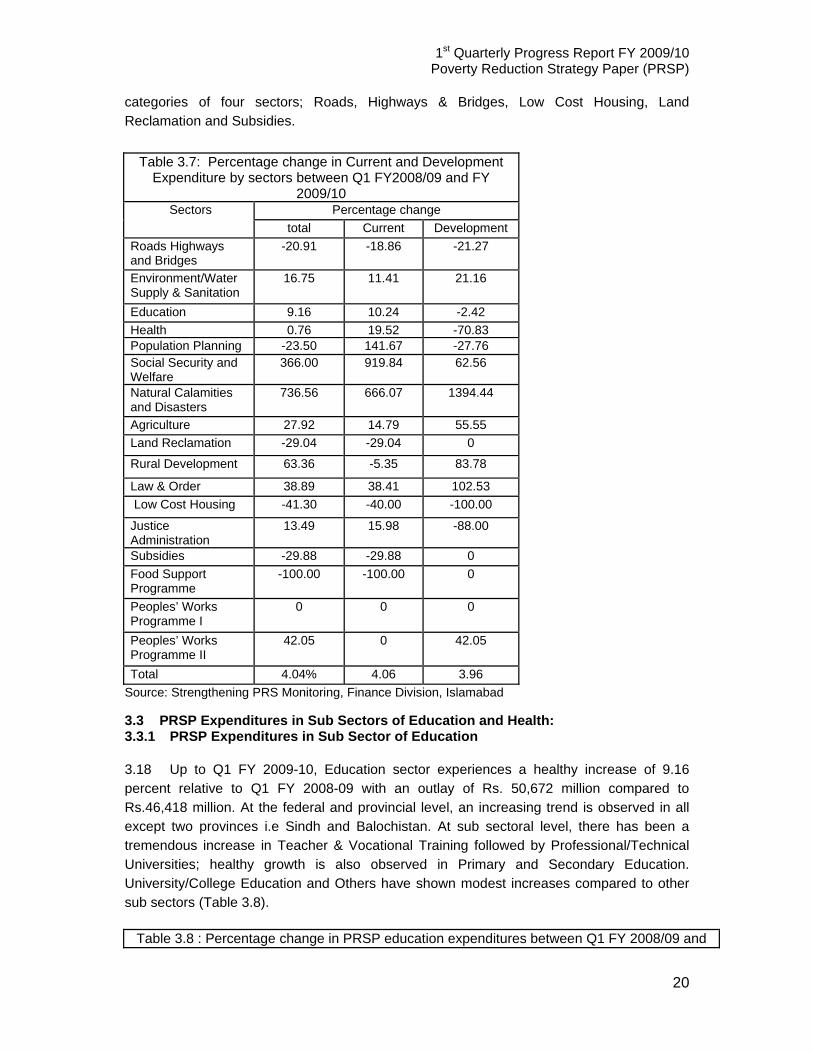
categories of four sectors; Roads, Highways & Bridges, Low Cost Housing, Land Reclamation and Subsidies.
Table 3.7: Percentage change in Current and Development Expenditure by sectors between Q1 FY2008/09 and FY
2009/10 Sectors Percentage change
total Current Development Roads Highways and Bridges
-20.91 -18.86 -21.27
Environment/Water Supply & Sanitation
16.75 11.41 21.16
Education 9.16 10.24 -2.42 Health 0.76 19.52 -70.83 Population Planning -23.50 141.67 -27.76 Social Security and Welfare
366.00 919.84 62.56
Natural Calamities and Disasters
736.56 666.07 1394.44
Agriculture 27.92 14.79 55.55 Land Reclamation -29.04 -29.04 0
Rural Development 63.36 -5.35 83.78
Law & Order 38.89 38.41 102.53 Low Cost Housing -41.30 -40.00 -100.00
Justice Administration
13.49 15.98 -88.00
Subsidies -29.88 -29.88 0 Food Support Programme
-100.00 -100.00 0
Peoples’ Works Programme I
0 0 0
Peoples’ Works Programme II
42.05 0 42.05
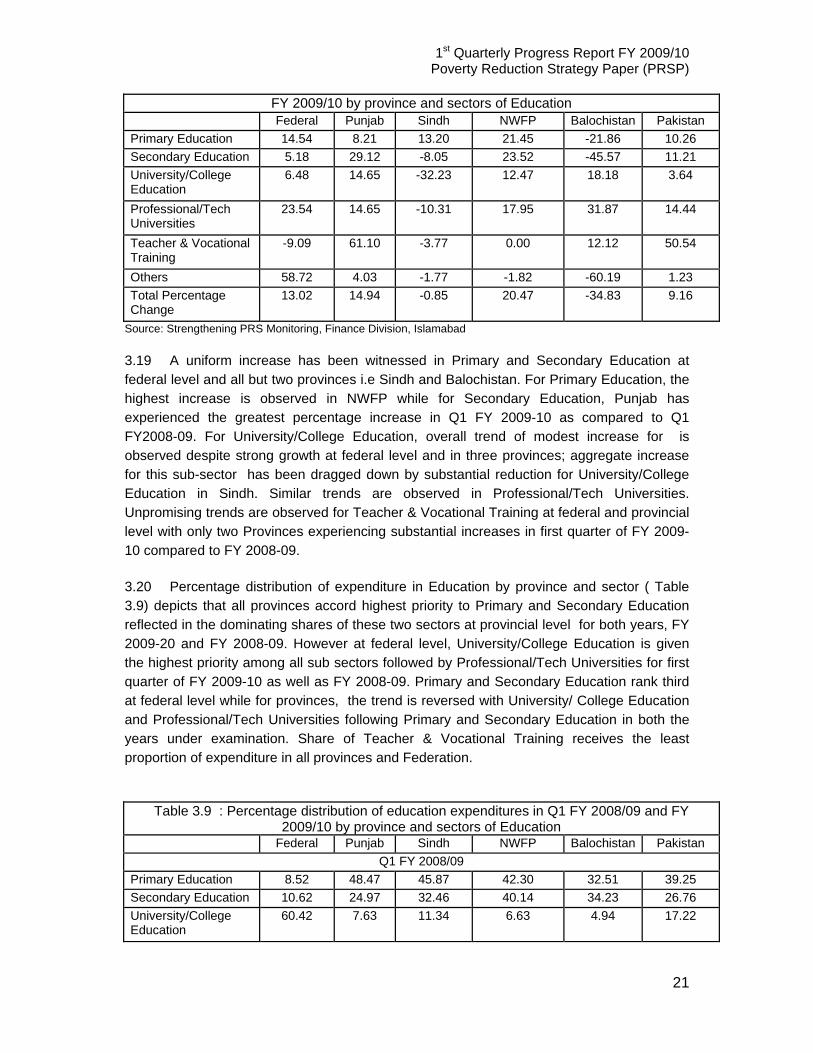
Total 4.04% 4.06 3.96 Source: Strengthening PRS Monitoring, Finance Division, Islamabad 3.3 PRSP Expenditures in Sub Sectors of Education and Health: 3.3.1 PRSP Expenditures in Sub Sector of Education 3.18 Up to Q1 FY 2009-10, Education sector experiences a healthy increase of 9.16 percent relative to Q1 FY 2008-09 with an outlay of Rs. 50,672 million compared to Rs.46,418 million. At the federal and provincial level, an increasing trend is observed in all except two provinces i.e Sindh and Balochistan. At sub sectoral level, there has been a tremendous increase in Teacher & Vocational Training followed by Professional/Technical Universities; healthy growth is also observed in Primary and Secondary Education. University/College Education and Others have shown modest increases compared to other sub sectors (Table 3.8).
Table 3.8 : Percentage change in PRSP education expenditures between Q1 FY 2008/09 and
1st Quarterly Progress Report FY 2009/10 Poverty Reduction Strategy Paper (PRSP)
21
FY 2009/10 by province and sectors of Education Federal Punjab Sindh NWFP Balochistan Pakistan
Primary Education 14.54 8.21 13.20 21.45 -21.86 10.26 Secondary Education 5.18 29.12 -8.05 23.52 -45.57 11.21 University/College Education
6.48 14.65 -32.23 12.47 18.18 3.64
Professional/Tech Universities
23.54 14.65 -10.31 17.95 31.87 14.44
Teacher & Vocational Training
-9.09 61.10 -3.77 0.00 12.12 50.54
Others 58.72 4.03 -1.77 -1.82 -60.19 1.23 Total Percentage Change
13.02 14.94 -0.85 20.47 -34.83 9.16
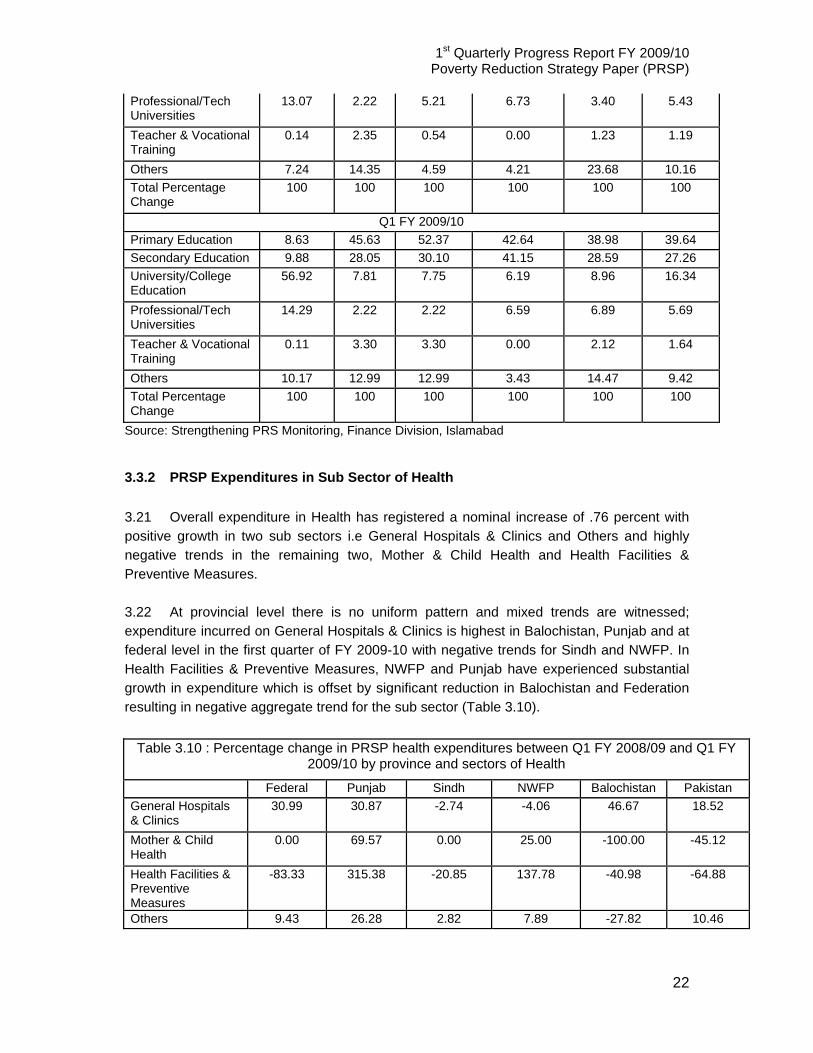
Source: Strengthening PRS Monitoring, Finance Division, Islamabad 3.19 A uniform increase has been witnessed in Primary and Secondary Education at federal level and all but two provinces i.e Sindh and Balochistan. For Primary Education, the highest increase is observed in NWFP while for Secondary Education, Punjab has experienced the greatest percentage increase in Q1 FY 2009-10 as compared to Q1 FY2008-09. For University/College Education, overall trend of modest increase for is observed despite strong growth at federal level and in three provinces; aggregate increase for this sub-sector has been dragged down by substantial reduction for University/College Education in Sindh. Similar trends are observed in Professional/Tech Universities. Unpromising trends are observed for Teacher & Vocational Training at federal and provincial level with only two Provinces experiencing substantial increases in first quarter of FY 2009-10 compared to FY 2008-09. 3.20 Percentage distribution of expenditure in Education by province and sector ( Table 3.9) depicts that all provinces accord highest priority to Primary and Secondary Education reflected in the dominating shares of these two sectors at provincial level for both years, FY 2009-20 and FY 2008-09. However at federal level, University/College Education is given the highest priority among all sub sectors followed by Professional/Tech Universities for first quarter of FY 2009-10 as well as FY 2008-09. Primary and Secondary Education rank third at federal level while for provinces, the trend is reversed with University/ College Education and Professional/Tech Universities following Primary and Secondary Education in both the years under examination. Share of Teacher & Vocational Training receives the least proportion of expenditure in all provinces and Federation.
Table 3.9 : Percentage distribution of education expenditures in Q1 FY 2008/09 and FY 2009/10 by province and sectors of Education
Federal Punjab Sindh NWFP Balochistan Pakistan Q1 FY 2008/09
Primary Education 8.52 48.47 45.87 42.30 32.51 39.25 Secondary Education 10.62 24.97 32.46 40.14 34.23 26.76 University/College Education
60.42 7.63 11.34 6.63 4.94 17.22
1st Quarterly Progress Report FY 2009/10 Poverty Reduction Strategy Paper (PRSP)
22
Professional/Tech Universities
13.07 2.22 5.21 6.73 3.40 5.43
Teacher & Vocational Training
0.14 2.35 0.54 0.00 1.23 1.19
Others 7.24 14.35 4.59 4.21 23.68 10.16 Total Percentage Change
100 100 100 100 100 100
Q1 FY 2009/10 Primary Education 8.63 45.63 52.37 42.64 38.98 39.64 Secondary Education 9.88 28.05 30.10 41.15 28.59 27.26 University/College Education
56.92 7.81 7.75 6.19 8.96 16.34
Professional/Tech Universities
14.29 2.22 2.22 6.59 6.89 5.69
Teacher & Vocational Training
0.11 3.30 3.30 0.00 2.12 1.64
Others 10.17 12.99 12.99 3.43 14.47 9.42 Total Percentage Change
100 100 100 100 100 100
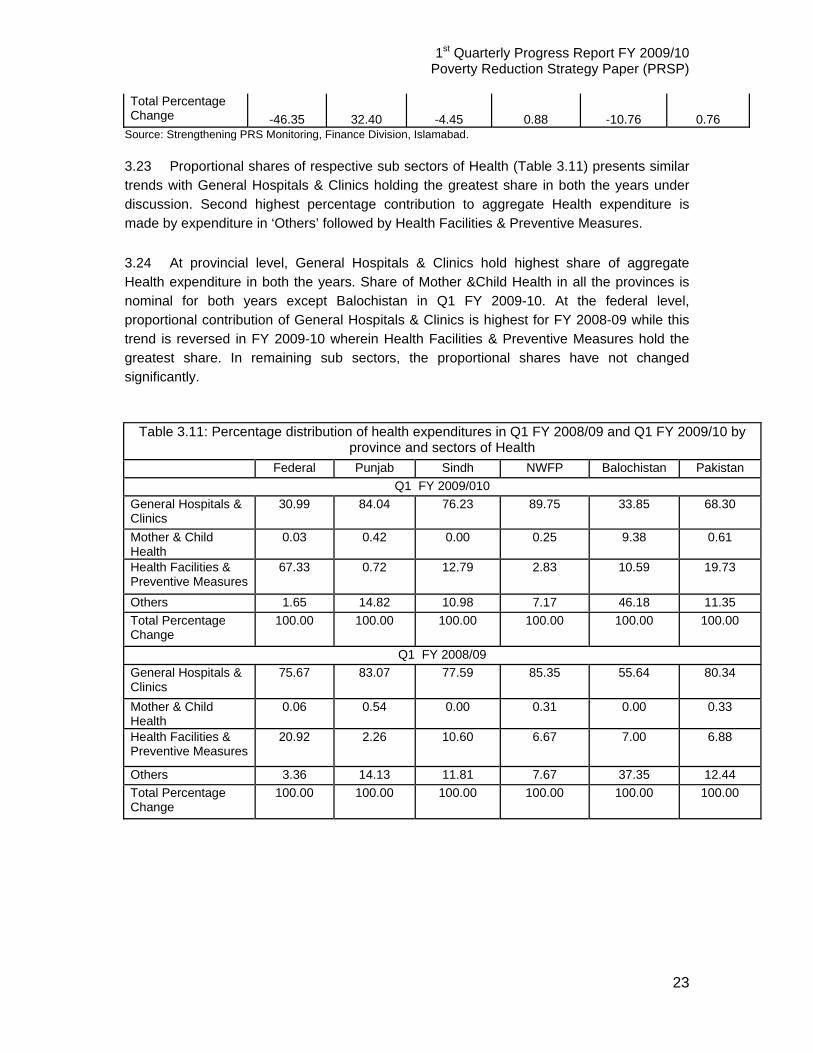
Source: Strengthening PRS Monitoring, Finance Division, Islamabad 3.3.2 PRSP Expenditures in Sub Sector of Health 3.21 Overall expenditure in Health has registered a nominal increase of .76 percent with positive growth in two sub sectors i.e General Hospitals & Clinics and Others and highly negative trends in the remaining two, Mother & Child Health and Health Facilities & Preventive Measures. 3.22 At provincial level there is no uniform pattern and mixed trends are witnessed; expenditure incurred on General Hospitals & Clinics is highest in Balochistan, Punjab and at federal level in the first quarter of FY 2009-10 with negative trends for Sindh and NWFP. In Health Facilities & Preventive Measures, NWFP and Punjab have experienced substantial growth in expenditure which is offset by significant reduction in Balochistan and Federation resulting in negative aggregate trend for the sub sector (Table 3.10).
Table 3.10 : Percentage change in PRSP health expenditures between Q1 FY 2008/09 and Q1 FY 2009/10 by province and sectors of Health
Federal Punjab Sindh NWFP Balochistan Pakistan General Hospitals & Clinics
30.99 30.87 -2.74 -4.06 46.67 18.52
Mother & Child Health
0.00 69.57 0.00 25.00 -100.00 -45.12
Health Facilities & Preventive Measures
-83.33 315.38 -20.85 137.78 -40.98 -64.88
Others 9.43 26.28 2.82 7.89 -27.82 10.46
1st Quarterly Progress Report FY 2009/10 Poverty Reduction Strategy Paper (PRSP)
23
Total Percentage Change -46.35 32.40 -4.45 0.88 -10.76 0.76
Source: Strengthening PRS Monitoring, Finance Division, Islamabad. 3.23 Proportional shares of respective sub sectors of Health (Table 3.11) presents similar trends with General Hospitals & Clinics holding the greatest share in both the years under discussion. Second highest percentage contribution to aggregate Health expenditure is made by expenditure in ‘Others’ followed by Health Facilities & Preventive Measures. 3.24 At provincial level, General Hospitals & Clinics hold highest share of aggregate Health expenditure in both the years. Share of Mother &Child Health in all the provinces is nominal for both years except Balochistan in Q1 FY 2009-10. At the federal level, proportional contribution of General Hospitals & Clinics is highest for FY 2008-09 while this trend is reversed in FY 2009-10 wherein Health Facilities & Preventive Measures hold the greatest share. In remaining sub sectors, the proportional shares have not changed significantly.
Table 3.11: Percentage distribution of health expenditures in Q1 FY 2008/09 and Q1 FY 2009/10 by province and sectors of Health
Federal Punjab Sindh NWFP Balochistan Pakistan Q1 FY 2009/010
General Hospitals & Clinics
30.99 84.04 76.23 89.75 33.85 68.30
Mother & Child Health
0.03 0.42 0.00 0.25 9.38 0.61
Health Facilities & Preventive Measures
67.33 0.72 12.79 2.83 10.59 19.73
Others 1.65 14.82 10.98 7.17 46.18 11.35 Total Percentage Change
100.00 100.00 100.00 100.00 100.00 100.00
Q1 FY 2008/09 General Hospitals & Clinics
75.67 83.07 77.59 85.35 55.64 80.34
Mother & Child Health
0.06 0.54 0.00 0.31 0.00 0.33
Health Facilities & Preventive Measures
20.92 2.26 10.60 6.67 7.00 6.88
Others 3.36 14.13 11.81 7.67 37.35 12.44 Total Percentage Change
100.00 100.00 100.00 100.00 100.00 100.00
1st Quarterly Progress Report FY 2009/10 Poverty Reduction Strategy Paper (PRSP)
24
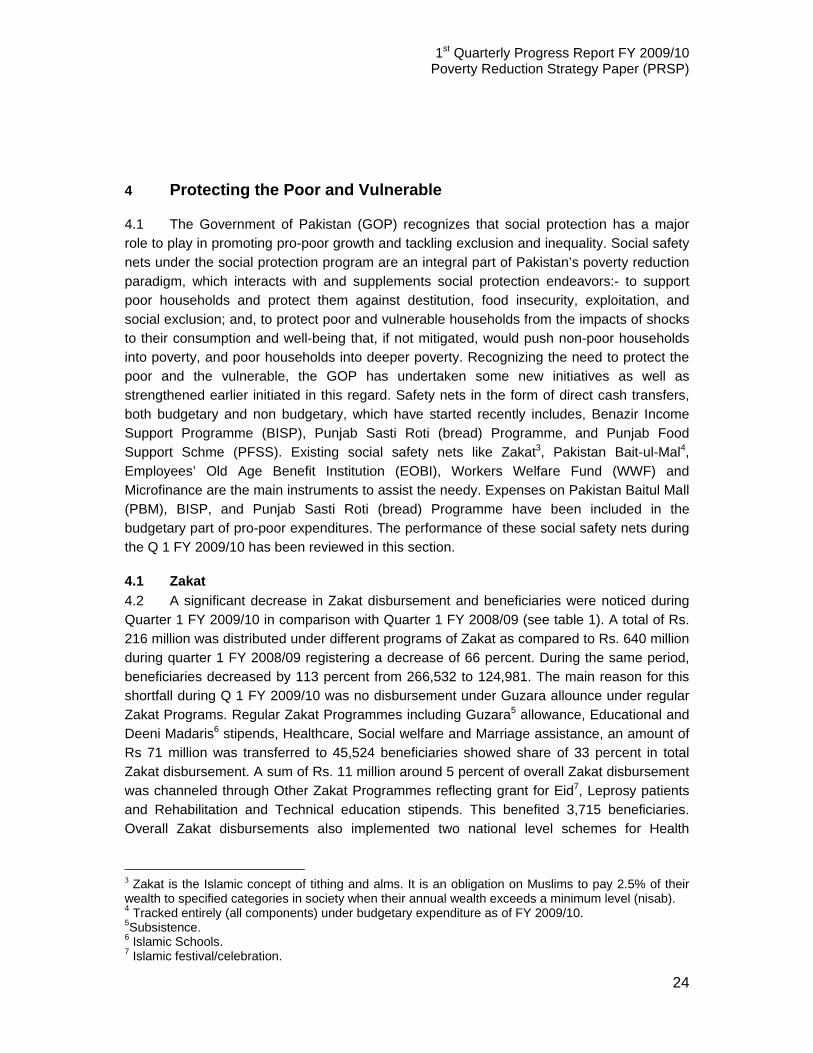
4 Protecting the Poor and Vulnerable 4.1 The Government of Pakistan (GOP) recognizes that social protection has a major role to play in promoting pro-poor growth and tackling exclusion and inequality. Social safety nets under the social protection program are an integral part of Pakistan’s poverty reduction paradigm, which interacts with and supplements social protection endeavors:- to support poor households and protect them against destitution, food insecurity, exploitation, and social exclusion; and, to protect poor and vulnerable households from the impacts of shocks to their consumption and well-being that, if not mitigated, would push non-poor households into poverty, and poor households into deeper poverty. Recognizing the need to protect the poor and the vulnerable, the GOP has undertaken some new initiatives as well as strengthened earlier initiated in this regard. Safety nets in the form of direct cash transfers, both budgetary and non budgetary, which have started recently includes, Benazir Income Support Programme (BISP), Punjab Sasti Roti (bread) Programme, and Punjab Food Support Schme (PFSS). Existing social safety nets like Zakat3, Pakistan Bait-ul-Mal4, Employees’ Old Age Benefit Institution (EOBI), Workers Welfare Fund (WWF) and Microfinance are the main instruments to assist the needy. Expenses on Pakistan Baitul Mall (PBM), BISP, and Punjab Sasti Roti (bread) Programme have been included in the budgetary part of pro-poor expenditures. The performance of these social safety nets during the Q 1 FY 2009/10 has been reviewed in this section.
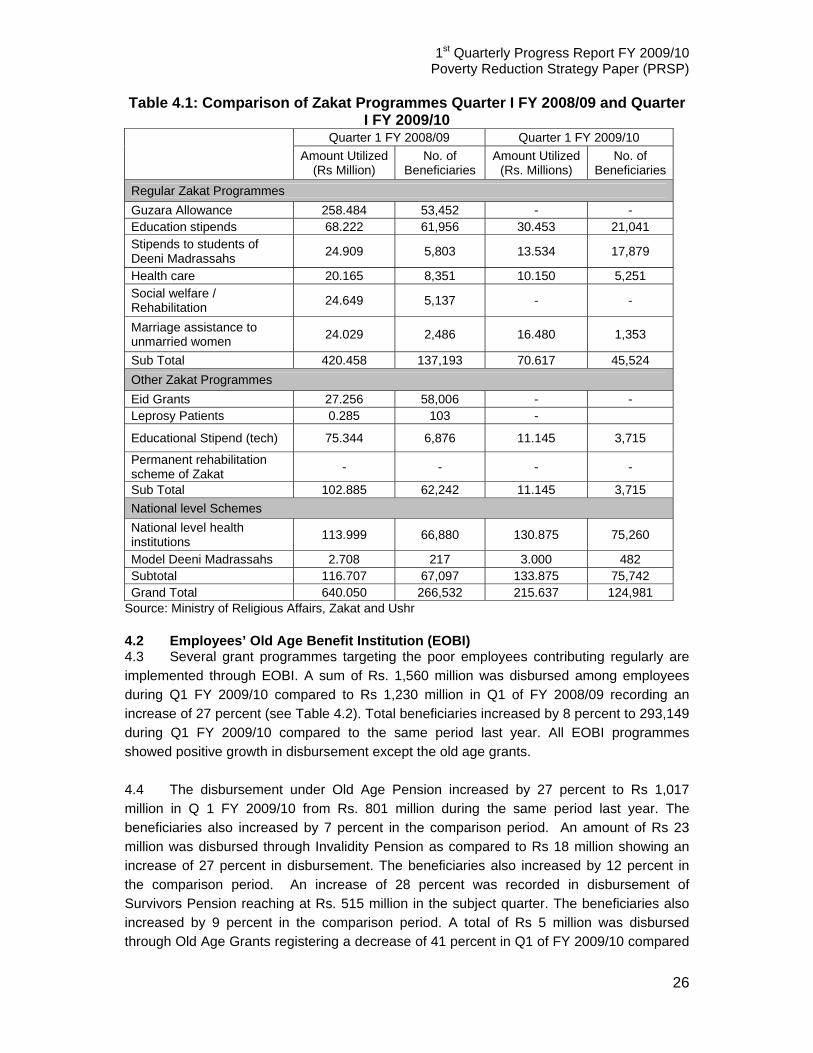
4.1 Zakat 4.2 A significant decrease in Zakat disbursement and beneficiaries were noticed during Quarter 1 FY 2009/10 in comparison with Quarter 1 FY 2008/09 (see table 1). A total of Rs. 216 million was distributed under different programs of Zakat as compared to Rs. 640 million during quarter 1 FY 2008/09 registering a decrease of 66 percent. During the same period, beneficiaries decreased by 113 percent from 266,532 to 124,981. The main reason for this shortfall during Q 1 FY 2009/10 was no disbursement under Guzara allounce under regular Zakat Programs. Regular Zakat Programmes including Guzara5 allowance, Educational and Deeni Madaris6 stipends, Healthcare, Social welfare and Marriage assistance, an amount of Rs 71 million was transferred to 45,524 beneficiaries showed share of 33 percent in total Zakat disbursement. A sum of Rs. 11 million around 5 percent of overall Zakat disbursement was channeled through Other Zakat Programmes reflecting grant for Eid7, Leprosy patients and Rehabilitation and Technical education stipends. This benefited 3,715 beneficiaries. Overall Zakat disbursements also implemented two national level schemes for Health
3 Zakat is the Islamic concept of tithing and alms. It is an obligation on Muslims to pay 2.5% of their wealth to specified categories in society when their annual wealth exceeds a minimum level (nisab). 4 Tracked entirely (all components) under budgetary expenditure as of FY 2009/10. 5Subsistence. 6 Islamic Schools. 7 Islamic festival/celebration.
1st Quarterly Progress Report FY 2009/10 Poverty Reduction Strategy Paper (PRSP)
25
institutions and Deeni madaris. A total of Rs 134 million (62 percent of total Zakat disbursement maximum of all) was distributed to 75,742 beneficiaries during Q1 FY 2009/10.
1st Quarterly Progress Report FY 2009/10 Poverty Reduction Strategy Paper (PRSP)
26
Table 4.1: Comparison of Zakat Programmes Quarter I FY 2008/09 and Quarter I FY 2009/10
Quarter 1 FY 2008/09 Quarter 1 FY 2009/10
Amount Utilized (Rs Million)
No. of Beneficiaries
Amount Utilized (Rs. Millions)
No. of Beneficiaries
Regular Zakat Programmes Guzara Allowance 258.484 53,452 - - Education stipends 68.222 61,956 30.453 21,041 Stipends to students of Deeni Madrassahs 24.909 5,803 13.534 17,879
Health care 20.165 8,351 10.150 5,251 Social welfare / Rehabilitation 24.649 5,137 - -
Marriage assistance to unmarried women 24.029 2,486 16.480 1,353
Sub Total 420.458 137,193 70.617 45,524 Other Zakat Programmes Eid Grants 27.256 58,006 - - Leprosy Patients 0.285 103 -
Educational Stipend (tech) 75.344 6,876 11.145 3,715
Permanent rehabilitation scheme of Zakat - - - -
Sub Total 102.885 62,242 11.145 3,715 National level Schemes National level health institutions 113.999 66,880 130.875 75,260
Model Deeni Madrassahs 2.708 217 3.000 482 Subtotal 116.707 67,097 133.875 75,742 Grand Total 640.050 266,532 215.637 124,981
Source: Ministry of Religious Affairs, Zakat and Ushr 4.2 Employees’ Old Age Benefit Institution (EOBI) 4.3 Several grant programmes targeting the poor employees contributing regularly are implemented through EOBI. A sum of Rs. 1,560 million was disbursed among employees during Q1 FY 2009/10 compared to Rs 1,230 million in Q1 of FY 2008/09 recording an increase of 27 percent (see Table 4.2). Total beneficiaries increased by 8 percent to 293,149 during Q1 FY 2009/10 compared to the same period last year. All EOBI programmes showed positive growth in disbursement except the old age grants. 4.4 The disbursement under Old Age Pension increased by 27 percent to Rs 1,017 million in Q 1 FY 2009/10 from Rs. 801 million during the same period last year. The beneficiaries also increased by 7 percent in the comparison period. An amount of Rs 23 million was disbursed through Invalidity Pension as compared to Rs 18 million showing an increase of 27 percent in disbursement. The beneficiaries also increased by 12 percent in the comparison period. An increase of 28 percent was recorded in disbursement of Survivors Pension reaching at Rs. 515 million in the subject quarter. The beneficiaries also increased by 9 percent in the comparison period. A total of Rs 5 million was disbursed through Old Age Grants registering a decrease of 41 percent in Q1 of FY 2009/10 compared

1st Quarterly Progress Report FY 2009/10 Poverty Reduction Strategy Paper (PRSP)
27
to Q1 FY 2008/09. However, the beneficiaries increased by 22 percent during the same period. Table 4.2: Programmes of Employees Old Age Benefits Institution (EOBI)
Grant Nature
Q 1 FY 2008/09 Q 1 FY 2009/10
Beneficiaries Disbursement (Rs. millions)
Beneficiaries Disbursement
(Rs million) Old Age Pension 175,869 801.0 188,195 1,017.118 Invalidity Pension 4,223 18.0 4,718 22.848 Survivors Pension 91,936 403.0 99,793 515.100 Old Age Grants 362 9.0 443 5.300
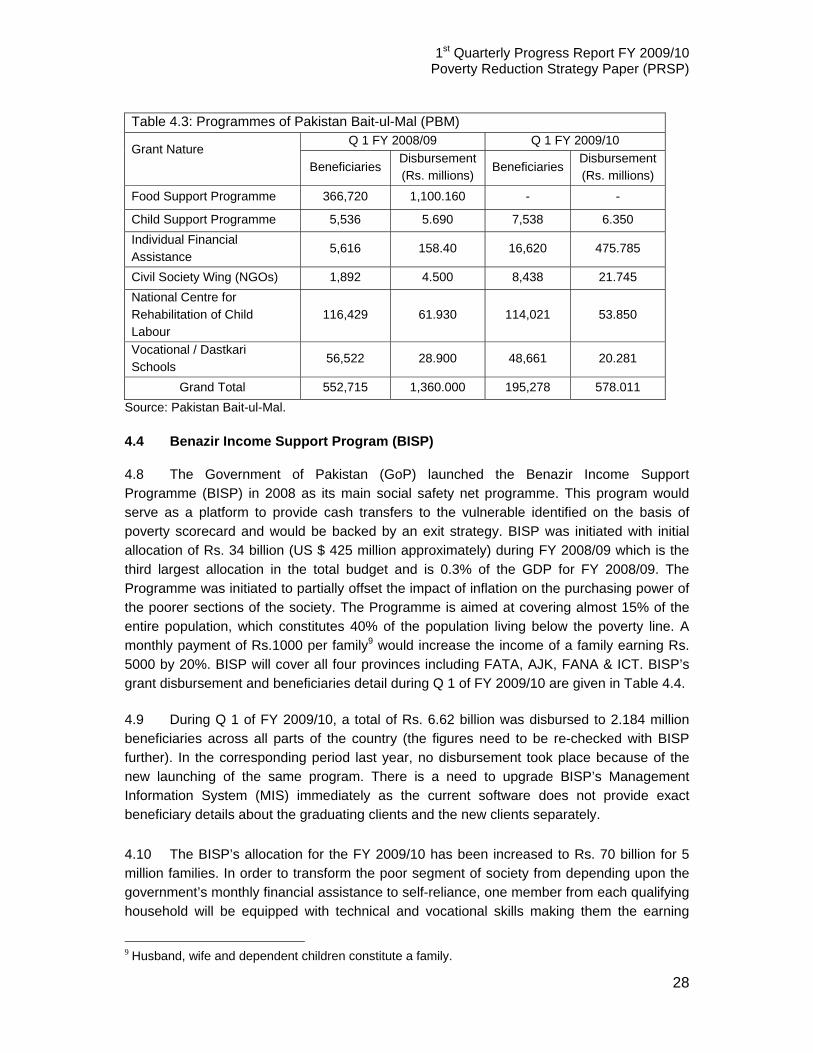
Grand Total 272,390 1,230.0 293,149 1,560.366 Source: Employees’ Old Age Benefits Institution (EOBI). 4.3 Pakistan Bait-ul-Mal (PBM) 4.5 Total disbursement through PBM stood at Rs 578 million during Q 1 FY 2009/10 as compared to Rs. 1,360 million during Q1 FY 2008/09, recorded a decline of 58 percent (see Table 4.3). The number of beneficiaries that benefited from PBM schemes during the subject period also decreased by 65 percent from 552,715 to 195, 278. 4.6 The flagship programme of PBM is the Food Support Programme (FSP), which is a part of PRSP budgetary expenditure. According to GOP notification, provision of grant under FSP would be disbursed through Benazir Income Support Program (BISP) during FY 2009/10. Hence, no disbursement and corresponding beneficiaries shown during the FY 2009/10. Child Support Program (CSP) disbursement increased by 12% to Rs. 6.350 million during Q 1 FY 2009/10 over Q 1 FY 2008/09. The beneficiaries also increased by 36 percent during the corresponding period. Similarly, Individual Financial Assistance (IFA) programme disbursement increased by 200 percent to Rs 476 million during Q1 FY 2009/10 over Q1 last fiscal year. Number of recipients of grants benefited from IFA programme also increased by 196 percent from 5,616 to 16,620. An increase of 383 percent from Rs 5 million to Rs 22 million was registered in Civil Society Wing (CSW) disbursement, which increased the beneficiaries by 346 percent during the comparison period. 4.7 However, disbursement under National Centre for Rehabilitation of Child Labour (NCRCL) decreased by 13 percent from Rs 62 million (Q1 FY 2008/09) to Rs 54 million (Q1 FY 2009/10). During this period grant recipients that benefited from this programme also decreased by 2 percent from 116,429 in Q1 FY 2008/09 to 114,021 in Q1 FY 2009/10. Similarly, Vocational/Dastakari8 Schools showed a decrease of 30 percent from Rs 29 million to Rs 20 million in disbursement during Q1 FY 2008/09 as compared to Q1 FY 2009/10. Number of recipients that benefited from this grant also decreased by 14 percent from 56,522 to 48,661 during this period. 8 Vocational/skills.
1st Quarterly Progress Report FY 2009/10 Poverty Reduction Strategy Paper (PRSP)
28
Table 4.3: Programmes of Pakistan Bait-ul-Mal (PBM)
Grant Nature
Q 1 FY 2008/09 Q 1 FY 2009/10
Beneficiaries Disbursement (Rs. millions)
BeneficiariesDisbursement (Rs. millions)
Food Support Programme 366,720 1,100.160 - -
Child Support Programme 5,536 5.690 7,538 6.350 Individual Financial Assistance
5,616 158.40 16,620 475.785
Civil Society Wing (NGOs) 1,892 4.500 8,438 21.745 National Centre for Rehabilitation of Child Labour
116,429 61.930 114,021 53.850
Vocational / Dastkari Schools
56,522 28.900 48,661 20.281
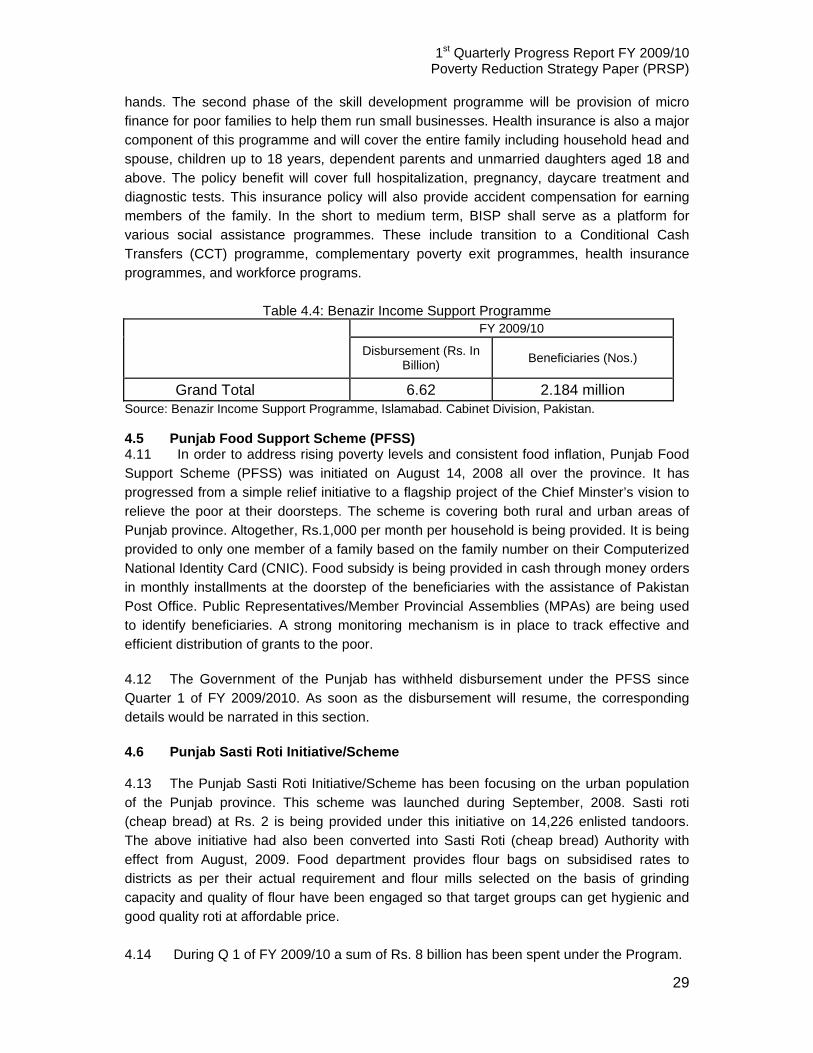
Grand Total 552,715 1,360.000 195,278 578.011 Source: Pakistan Bait-ul-Mal. 4.4 Benazir Income Support Program (BISP) 4.8 The Government of Pakistan (GoP) launched the Benazir Income Support Programme (BISP) in 2008 as its main social safety net programme. This program would serve as a platform to provide cash transfers to the vulnerable identified on the basis of poverty scorecard and would be backed by an exit strategy. BISP was initiated with initial allocation of Rs. 34 billion (US $ 425 million approximately) during FY 2008/09 which is the third largest allocation in the total budget and is 0.3% of the GDP for FY 2008/09. The Programme was initiated to partially offset the impact of inflation on the purchasing power of the poorer sections of the society. The Programme is aimed at covering almost 15% of the entire population, which constitutes 40% of the population living below the poverty line. A monthly payment of Rs.1000 per family9 would increase the income of a family earning Rs. 5000 by 20%. BISP will cover all four provinces including FATA, AJK, FANA & ICT. BISP’s grant disbursement and beneficiaries detail during Q 1 of FY 2009/10 are given in Table 4.4. 4.9 During Q 1 of FY 2009/10, a total of Rs. 6.62 billion was disbursed to 2.184 million beneficiaries across all parts of the country (the figures need to be re-checked with BISP further). In the corresponding period last year, no disbursement took place because of the new launching of the same program. There is a need to upgrade BISP’s Management Information System (MIS) immediately as the current software does not provide exact beneficiary details about the graduating clients and the new clients separately. 4.10 The BISP’s allocation for the FY 2009/10 has been increased to Rs. 70 billion for 5 million families. In order to transform the poor segment of society from depending upon the government’s monthly financial assistance to self-reliance, one member from each qualifying household will be equipped with technical and vocational skills making them the earning
9 Husband, wife and dependent children constitute a family.
1st Quarterly Progress Report FY 2009/10 Poverty Reduction Strategy Paper (PRSP)
29
hands. The second phase of the skill development programme will be provision of micro finance for poor families to help them run small businesses. Health insurance is also a major component of this programme and will cover the entire family including household head and spouse, children up to 18 years, dependent parents and unmarried daughters aged 18 and above. The policy benefit will cover full hospitalization, pregnancy, daycare treatment and diagnostic tests. This insurance policy will also provide accident compensation for earning members of the family. In the short to medium term, BISP shall serve as a platform for various social assistance programmes. These include transition to a Conditional Cash Transfers (CCT) programme, complementary poverty exit programmes, health insurance programmes, and workforce programs.
Table 4.4: Benazir Income Support Programme
FY 2009/10
Disbursement (Rs. In Billion) Beneficiaries (Nos.)
Grand Total 6.62 2.184 million Source: Benazir Income Support Programme, Islamabad. Cabinet Division, Pakistan. 4.5 Punjab Food Support Scheme (PFSS) 4.11 In order to address rising poverty levels and consistent food inflation, Punjab Food Support Scheme (PFSS) was initiated on August 14, 2008 all over the province. It has progressed from a simple relief initiative to a flagship project of the Chief Minster’s vision to relieve the poor at their doorsteps. The scheme is covering both rural and urban areas of Punjab province. Altogether, Rs.1,000 per month per household is being provided. It is being provided to only one member of a family based on the family number on their Computerized National Identity Card (CNIC). Food subsidy is being provided in cash through money orders in monthly installments at the doorstep of the beneficiaries with the assistance of Pakistan Post Office. Public Representatives/Member Provincial Assemblies (MPAs) are being used to identify beneficiaries. A strong monitoring mechanism is in place to track effective and efficient distribution of grants to the poor.
4.12 The Government of the Punjab has withheld disbursement under the PFSS since Quarter 1 of FY 2009/2010. As soon as the disbursement will resume, the corresponding details would be narrated in this section. 4.6 Punjab Sasti Roti Initiative/Scheme 4.13 The Punjab Sasti Roti Initiative/Scheme has been focusing on the urban population of the Punjab province. This scheme was launched during September, 2008. Sasti roti (cheap bread) at Rs. 2 is being provided under this initiative on 14,226 enlisted tandoors. The above initiative had also been converted into Sasti Roti (cheap bread) Authority with effect from August, 2009. Food department provides flour bags on subsidised rates to districts as per their actual requirement and flour mills selected on the basis of grinding capacity and quality of flour have been engaged so that target groups can get hygienic and good quality roti at affordable price. 4.14 During Q 1 of FY 2009/10 a sum of Rs. 8 billion has been spent under the Program.
1st Quarterly Progress Report FY 2009/10 Poverty Reduction Strategy Paper (PRSP)
30
4.7 Workers Welfare Fund (WWF) 4.15 Workers Welfare Fund (WWF) was established in 1971 under an Ordinance with a capital of Rs. 100 million provided by the Federal Government. The main objectives of WWF are:
• Financing of housing projects for the workers • Financing of other welfare measures such as; education, training, re-skilling,
apprenticeship, marriage and death grants and post matric scholarships for the welfare of workers.
A standard eligibility criterion has been developed to attain access to the benefits of the WWF projects/schemes details of which are given under;
• The industrial worker must fulfil the definition given in the Workers Welfare Fund Ordinance 1971,
• The industrial worker under the Industrial Relations Act (IRA), 2009 fulfils the definition of the labourer,
• The worker must be registered either with EOBI or with Social Security Institution, and
• The minimal employment period should not be less than 3 years (in case of death grant, this condition is not applicable).
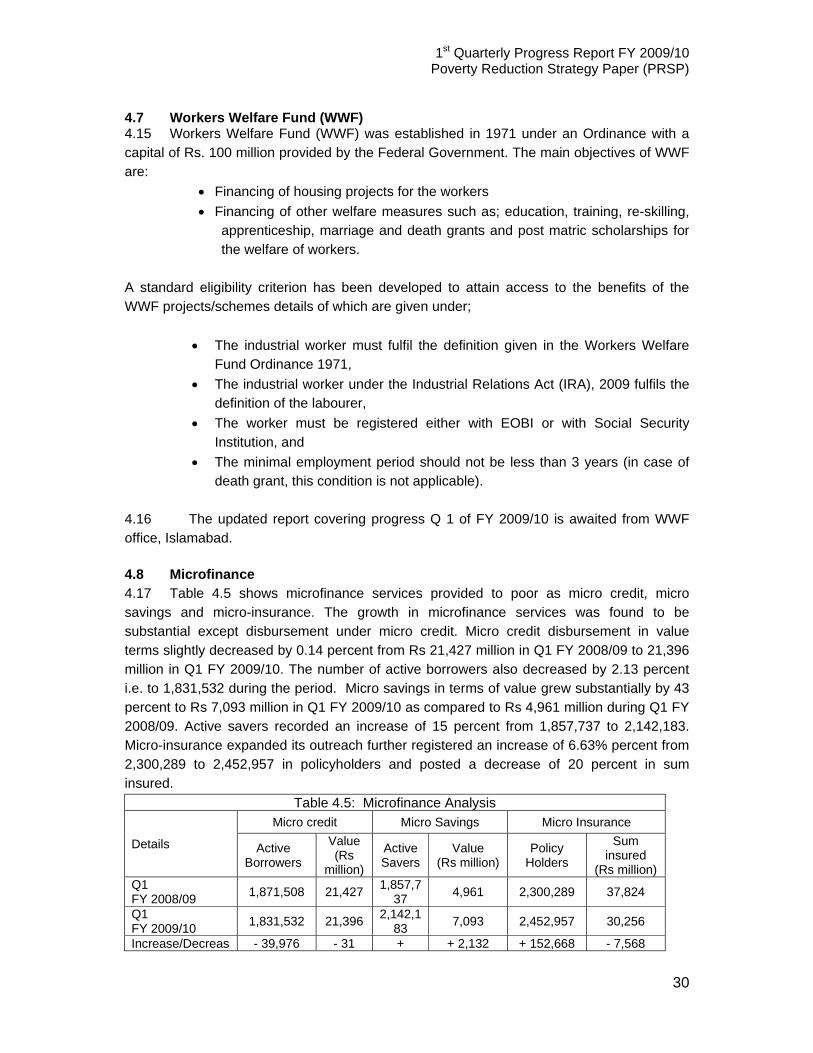
4.16 The updated report covering progress Q 1 of FY 2009/10 is awaited from WWF office, Islamabad. 4.8 Microfinance 4.17 Table 4.5 shows microfinance services provided to poor as micro credit, micro savings and micro-insurance. The growth in microfinance services was found to be substantial except disbursement under micro credit. Micro credit disbursement in value terms slightly decreased by 0.14 percent from Rs 21,427 million in Q1 FY 2008/09 to 21,396 million in Q1 FY 2009/10. The number of active borrowers also decreased by 2.13 percent i.e. to 1,831,532 during the period. Micro savings in terms of value grew substantially by 43 percent to Rs 7,093 million in Q1 FY 2009/10 as compared to Rs 4,961 million during Q1 FY 2008/09. Active savers recorded an increase of 15 percent from 1,857,737 to 2,142,183. Micro-insurance expanded its outreach further registered an increase of 6.63% percent from 2,300,289 to 2,452,957 in policyholders and posted a decrease of 20 percent in sum insured.
Table 4.5: Microfinance Analysis
Details
Micro credit Micro Savings Micro Insurance
Active Borrowers
Value (Rs
million)
Active Savers
Value (Rs million)
Policy Holders
Sum insured
(Rs million) Q1 FY 2008/09 1,871,508 21,427 1,857,7
37 4,961 2,300,289 37,824
Q1 FY 2009/10 1,831,532 21,396 2,142,1
83 7,093 2,452,957 30,256
Increase/Decreas - 39,976 - 31 + + 2,132 + 152,668 - 7,568
1st Quarterly Progress Report FY 2009/10 Poverty Reduction Strategy Paper (PRSP)
31
e (Net) 284,446
Increase/Decrease (%) - 2.13 - 0.14 + 15 + 43 + 6.63 - 20
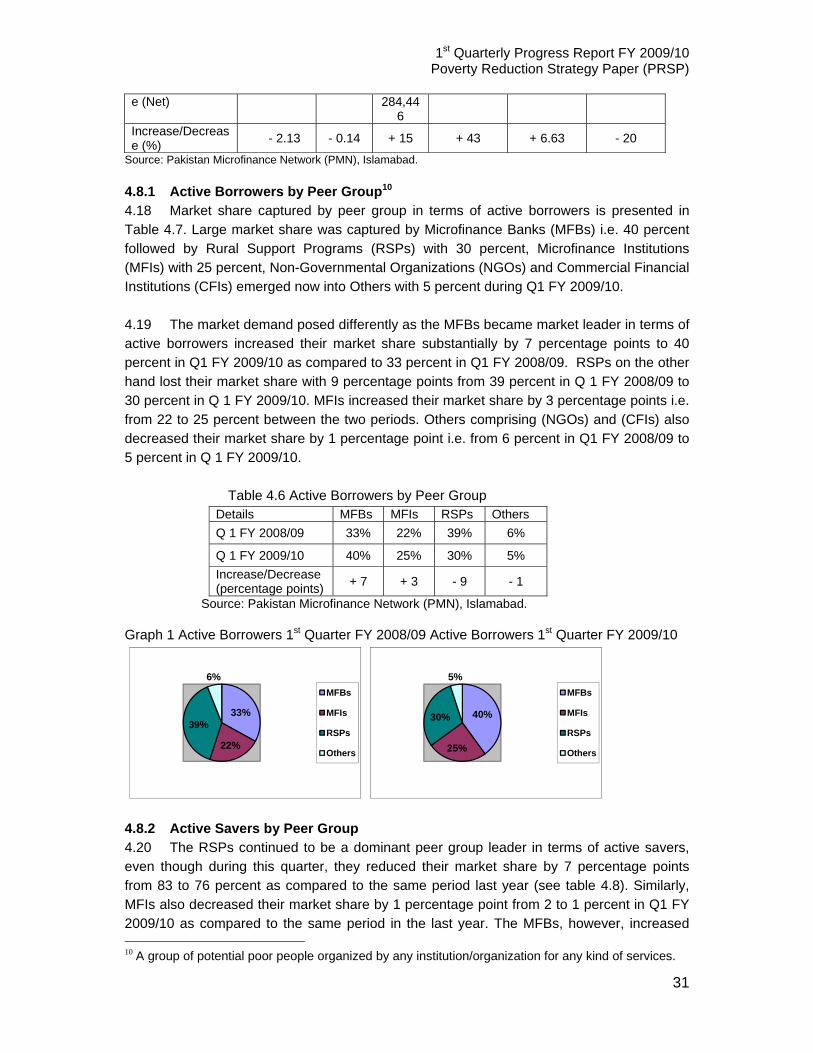
Source: Pakistan Microfinance Network (PMN), Islamabad. 4.8.1 Active Borrowers by Peer Group10 4.18 Market share captured by peer group in terms of active borrowers is presented in Table 4.7. Large market share was captured by Microfinance Banks (MFBs) i.e. 40 percent followed by Rural Support Programs (RSPs) with 30 percent, Microfinance Institutions (MFIs) with 25 percent, Non-Governmental Organizations (NGOs) and Commercial Financial Institutions (CFIs) emerged now into Others with 5 percent during Q1 FY 2009/10. 4.19 The market demand posed differently as the MFBs became market leader in terms of active borrowers increased their market share substantially by 7 percentage points to 40 percent in Q1 FY 2009/10 as compared to 33 percent in Q1 FY 2008/09. RSPs on the other hand lost their market share with 9 percentage points from 39 percent in Q 1 FY 2008/09 to 30 percent in Q 1 FY 2009/10. MFIs increased their market share by 3 percentage points i.e. from 22 to 25 percent between the two periods. Others comprising (NGOs) and (CFIs) also decreased their market share by 1 percentage point i.e. from 6 percent in Q1 FY 2008/09 to 5 percent in Q 1 FY 2009/10. Table 4.6 Active Borrowers by Peer Group
Details MFBs MFIs RSPs Others Q 1 FY 2008/09 33% 22% 39% 6%
Q 1 FY 2009/10 40% 25% 30% 5% Increase/Decrease (percentage points) + 7 + 3 - 9 - 1
Source: Pakistan Microfinance Network (PMN), Islamabad. Graph 1 Active Borrowers 1st Quarter FY 2008/09 Active Borrowers 1st Quarter FY 2009/10
33%
22%
39%
6%MFBs
MFIs
RSPs
Others
40%
25%
30%
5%MFBs
MFIs
RSPs
Others
4.8.2 Active Savers by Peer Group 4.20 The RSPs continued to be a dominant peer group leader in terms of active savers, even though during this quarter, they reduced their market share by 7 percentage points from 83 to 76 percent as compared to the same period last year (see table 4.8). Similarly, MFIs also decreased their market share by 1 percentage point from 2 to 1 percent in Q1 FY 2009/10 as compared to the same period in the last year. The MFBs, however, increased 10 A group of potential poor people organized by any institution/organization for any kind of services.
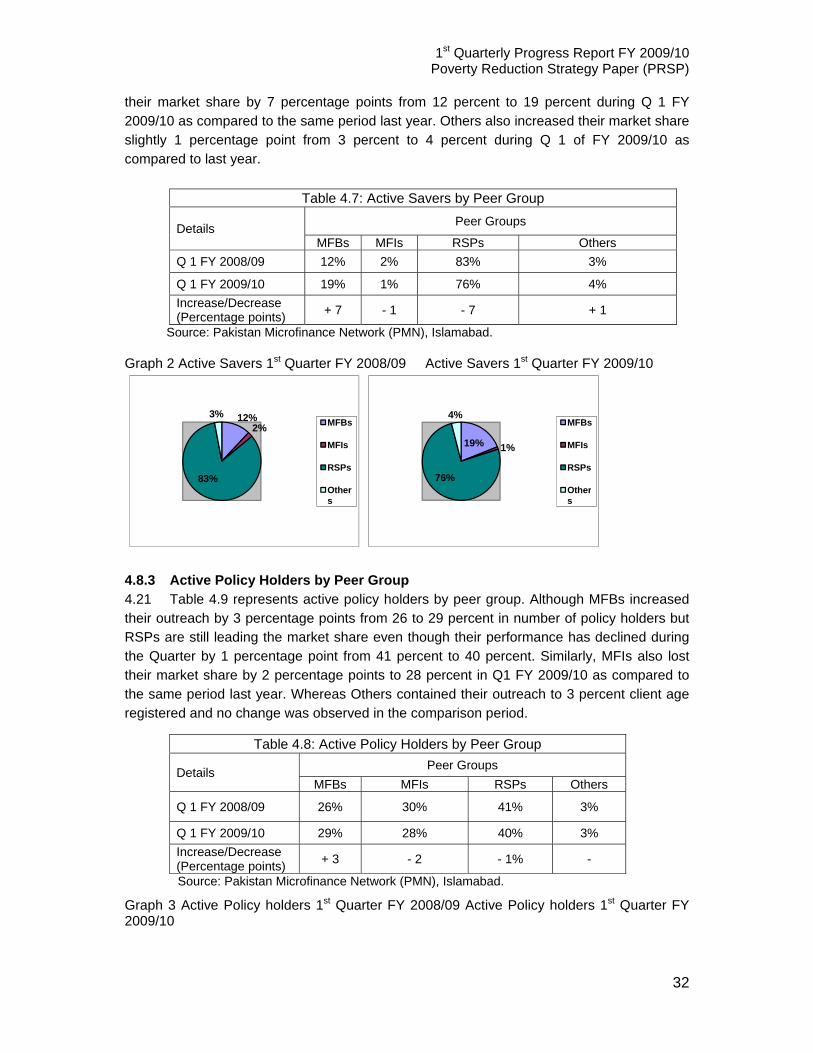
1st Quarterly Progress Report FY 2009/10 Poverty Reduction Strategy Paper (PRSP)
32
their market share by 7 percentage points from 12 percent to 19 percent during Q 1 FY 2009/10 as compared to the same period last year. Others also increased their market share slightly 1 percentage point from 3 percent to 4 percent during Q 1 of FY 2009/10 as compared to last year.
Table 4.7: Active Savers by Peer Group
Details Peer Groups
MFBs MFIs RSPs Others Q 1 FY 2008/09 12% 2% 83% 3%
Q 1 FY 2009/10 19% 1% 76% 4% Increase/Decrease (Percentage points) + 7 - 1 - 7 + 1
Source: Pakistan Microfinance Network (PMN), Islamabad. Graph 2 Active Savers 1st Quarter FY 2008/09 Active Savers 1st Quarter FY 2009/10
12%2%
83%
3%MFBs
MFIs
RSPs
Others
19% 1%
76%
4%MFBs
MFIs
RSPs
Others
4.8.3 Active Policy Holders by Peer Group 4.21 Table 4.9 represents active policy holders by peer group. Although MFBs increased their outreach by 3 percentage points from 26 to 29 percent in number of policy holders but RSPs are still leading the market share even though their performance has declined during the Quarter by 1 percentage point from 41 percent to 40 percent. Similarly, MFIs also lost their market share by 2 percentage points to 28 percent in Q1 FY 2009/10 as compared to the same period last year. Whereas Others contained their outreach to 3 percent client age registered and no change was observed in the comparison period.
Table 4.8: Active Policy Holders by Peer Group
Details Peer Groups MFBs MFIs RSPs Others
Q 1 FY 2008/09 26% 30% 41% 3%
Q 1 FY 2009/10 29% 28% 40% 3% Increase/Decrease (Percentage points) + 3 - 2 - 1% -
Source: Pakistan Microfinance Network (PMN), Islamabad.
Graph 3 Active Policy holders 1st Quarter FY 2008/09 Active Policy holders 1st Quarter FY 2009/10
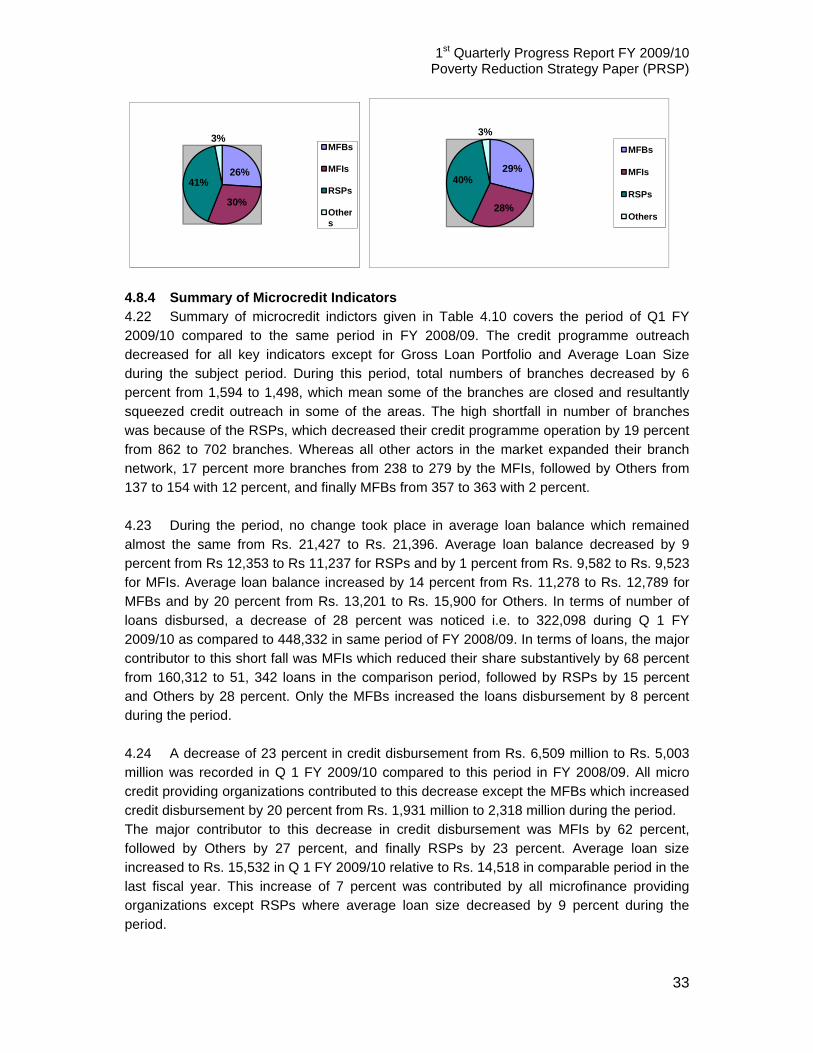
1st Quarterly Progress Report FY 2009/10 Poverty Reduction Strategy Paper (PRSP)
33
26%
30%
41%
3%MFBs
MFIs
RSPs
Others
29%
28%
40%
3%
MFBs
MFIs
RSPs
Others
4.8.4 Summary of Microcredit Indicators 4.22 Summary of microcredit indictors given in Table 4.10 covers the period of Q1 FY 2009/10 compared to the same period in FY 2008/09. The credit programme outreach decreased for all key indicators except for Gross Loan Portfolio and Average Loan Size during the subject period. During this period, total numbers of branches decreased by 6 percent from 1,594 to 1,498, which mean some of the branches are closed and resultantly squeezed credit outreach in some of the areas. The high shortfall in number of branches was because of the RSPs, which decreased their credit programme operation by 19 percent from 862 to 702 branches. Whereas all other actors in the market expanded their branch network, 17 percent more branches from 238 to 279 by the MFIs, followed by Others from 137 to 154 with 12 percent, and finally MFBs from 357 to 363 with 2 percent. 4.23 During the period, no change took place in average loan balance which remained almost the same from Rs. 21,427 to Rs. 21,396. Average loan balance decreased by 9 percent from Rs 12,353 to Rs 11,237 for RSPs and by 1 percent from Rs. 9,582 to Rs. 9,523 for MFIs. Average loan balance increased by 14 percent from Rs. 11,278 to Rs. 12,789 for MFBs and by 20 percent from Rs. 13,201 to Rs. 15,900 for Others. In terms of number of loans disbursed, a decrease of 28 percent was noticed i.e. to 322,098 during Q 1 FY 2009/10 as compared to 448,332 in same period of FY 2008/09. In terms of loans, the major contributor to this short fall was MFIs which reduced their share substantively by 68 percent from 160,312 to 51, 342 loans in the comparison period, followed by RSPs by 15 percent and Others by 28 percent. Only the MFBs increased the loans disbursement by 8 percent during the period. 4.24 A decrease of 23 percent in credit disbursement from Rs. 6,509 million to Rs. 5,003 million was recorded in Q 1 FY 2009/10 compared to this period in FY 2008/09. All micro credit providing organizations contributed to this decrease except the MFBs which increased credit disbursement by 20 percent from Rs. 1,931 million to 2,318 million during the period. The major contributor to this decrease in credit disbursement was MFIs by 62 percent, followed by Others by 27 percent, and finally RSPs by 23 percent. Average loan size increased to Rs. 15,532 in Q 1 FY 2009/10 relative to Rs. 14,518 in comparable period in the last fiscal year. This increase of 7 percent was contributed by all microfinance providing organizations except RSPs where average loan size decreased by 9 percent during the period.

1st Quarterly Progress Report FY 2009/10 Poverty Reduction Strategy Paper (PRSP)
34
Table 4.9: Summary of Microcredit Provision
Indicators Q 1 FY 2008/09
Q 1 FY 2009/10 % Change
MFBs
Number of Branches/Units 357 363 2 Gross Loan Portfolio (Rs million) 7,026 9,326 33
Average Loan Balance (Rs) 11,278 12,789 14 Number of Loans disbursed 128,712 139,336 8 Credit Disbursements (Rs million) 1,931 2,318 20
Average Loan Size (Rs) 15,000 16,634 11
MFIs
Number of branches/Units 238 279 17 Gross Loan Portfolio (Rs millions) 3,889 4,367 12
Average Loan Balance (Rs) 9,582 9,523 -1 Number of Loans disbursed 160,312 51,342 - 68 Credit Disbursements (Rs million) 2,088 788 - 62
Average Loan Size (Rs) 13,028 15,341 18
RSPs
Number of Branches/Units 862 702 -19 Gross Loan Portfolio (Rs million) 8,915 6,103 -32
Average Loan Balance (Rs) 12,353 11,237 -9 Number of Loans disbursed 126,114 107,514 -15 Credit Disbursements (Rs million) 1,964 1,516 -23
Average Loan Size (Rs) 15,572 14,098 -9
Others
Number of Branches/Units 137 154 12 Gross Loan Portfolio (Rs million) 1,597 1,600 -
Average Loan Balance (Rs) 13,201 15,900 20 Number of Loans disbursed 33,194 23,906 -28 Credit Disbursements (Rs million) 526 382 -27
Average Loan Size (Rs) 15,837 15,973 1
Total
Number of Branches/Units 1,594 1,498 -6 Gross Loan Portfolio (Rs million) 21,427 21,396 -
Average Loan Balance (Rs) 11,449 11,682 2 Number of Loans disbursed 448,332 322,098 -28 Credit Disbursements (Rs million) 6,509 5,003 -23
Average Loan Size (Rs) 14,518 15,532 7

1st Quarterly Progress Report FY 2009/10 Poverty Reduction Strategy Paper (PRSP)
35
5 Monitoring of PRSP Output (Intermediate) Indicators 5.1 This section of the report analyzes the performance of the PRSP intermediate indicators for Q 1 FY 2009/10 with the corresponding period last year. Performance of health sector data has been covered in immunization coverage and number and coverage of Lady Health Workers (LHWs). Progress in land distribution, in addition to employment level and schemes approved under People’s Works Programme-I will also be a part of this section. However, information on education sector intermediate indicators is not available as National Education Management Information System (NEMIS) provides data on an annual basis. 5.1 TT- Immunization Coverage 5.2 Table 5.1 presents data on TT-immunization coverage for pregnant women. Tetanus Toxoid-1 (TT-1) immunization coverage increased by 1 percentage points to 53 percent whereas Tetanus Toxoid-2+ (TT-2+) immunization increased by 2 percentage points to 56 percent in Q1 FY 2009/10 over Q1 FY 2008/09. Provincial and other administrative areas variations of TT-immunization coverage were very large, as TT-I immunization coverage during Q1 FY 2008/09 varies between 30 to 61 percent and TT-2 immunization coverage varies between 15 to 73 percent during the same period. Largest coverage of TT-1 and TT2 immunization took place in Punjab and FATA. There was an increase of 2 percentage points in TT-1 and 4 percentage points in TT-2 immunization coverage from 59 to 61 percent and 61 to 65 percent, respectively in Q1 FY 2009/10 relative to the same period last year in Punjab. There was an increase of 15 percentage points in TT-1 and 23 percentage points in TT-2 immunization coverage from 40 to 55 percent and 50 to 73 percent, respectively in Q1 FY 2009/10 relative to the same period last year in FATA. TT-1 immunization coverage improved by 2, 7, and 3 percentage points in AJ&K, Federally Administered Northern Areas (FANA) and CDA11 whereas it showed a decline of 1 and 5 percentage points in Sindh and ICT, respectively. The coverage remained same in NWFP and Baluchistan, However, TT-2 immunization coverage registered an increase of 1, 3 and 17 percentage points in Baluchistan, AJ&K and FANA whereas it declined by 2, 2, 4, and 3 percentage points in Sindh, NWFP, ICT and CDA, respectively in the Q1 FY 2008/09 in contrast to the same period in the last fiscal year.
Table 5.1: TT- Immunization Coverage for Pregnant Women
Q1 FY 2008/09 Q1 FY 2009/10
Province / Region
Target Population
(+4.1% Pop)
TT-1 TT2+ Target Population
(+4.1% Pop)
TT-1 TT2+
Coverage% Coverage% Coverage% Coverage%
Punjab 981,427 59 61 1,007,670 61 65 Sindh 413,524 45 50 428,094 44 48 NWFP 242,456 43 44 249,603 43 42 FATA 40,466 40 50 41,742 55 73 Balochistan 87,697 30 34 89,631 30 35 AJ&K 38,770 58 54 39,663 60 57 FANA 11,266 23 28 11,526 30 45
11 Capital Development Authority (CDA) only covers the geographical area of Islamabad city.
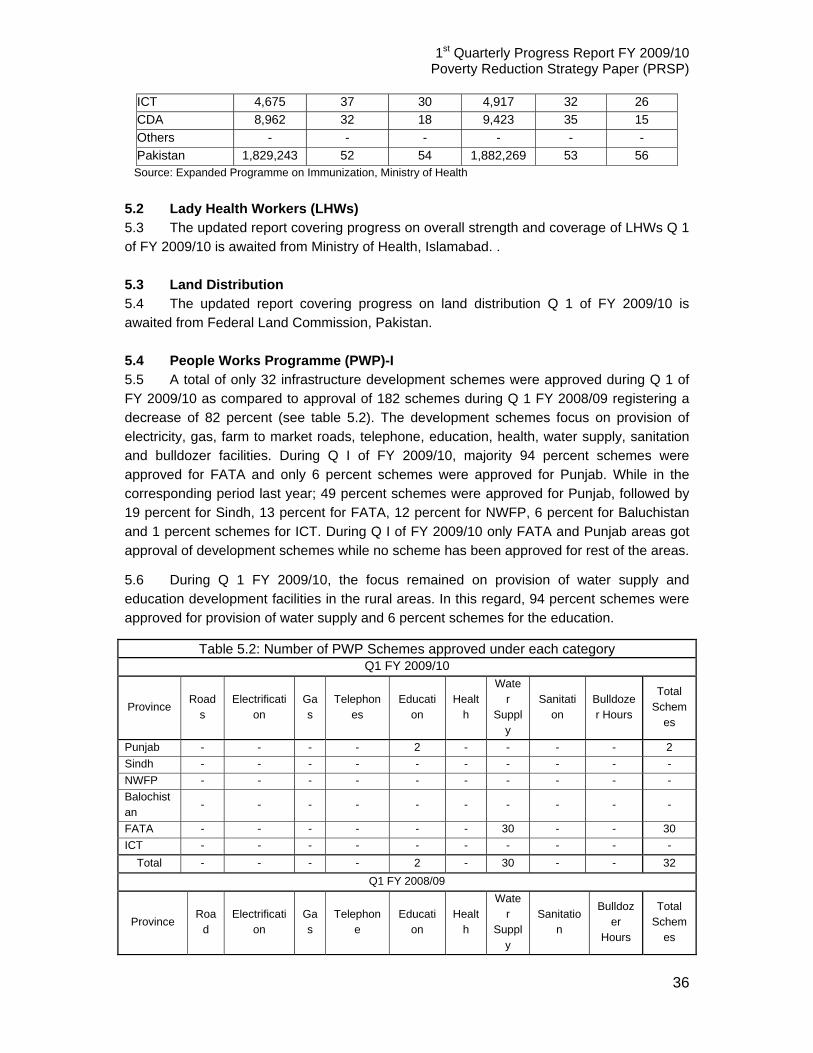
1st Quarterly Progress Report FY 2009/10 Poverty Reduction Strategy Paper (PRSP)
36
ICT 4,675 37 30 4,917 32 26 CDA 8,962 32 18 9,423 35 15 Others - - - - - - Pakistan 1,829,243 52 54 1,882,269 53 56
Source: Expanded Programme on Immunization, Ministry of Health 5.2 Lady Health Workers (LHWs) 5.3 The updated report covering progress on overall strength and coverage of LHWs Q 1 of FY 2009/10 is awaited from Ministry of Health, Islamabad. . 5.3 Land Distribution 5.4 The updated report covering progress on land distribution Q 1 of FY 2009/10 is awaited from Federal Land Commission, Pakistan. 5.4 People Works Programme (PWP)-I 5.5 A total of only 32 infrastructure development schemes were approved during Q 1 of FY 2009/10 as compared to approval of 182 schemes during Q 1 FY 2008/09 registering a decrease of 82 percent (see table 5.2). The development schemes focus on provision of electricity, gas, farm to market roads, telephone, education, health, water supply, sanitation and bulldozer facilities. During Q I of FY 2009/10, majority 94 percent schemes were approved for FATA and only 6 percent schemes were approved for Punjab. While in the corresponding period last year; 49 percent schemes were approved for Punjab, followed by 19 percent for Sindh, 13 percent for FATA, 12 percent for NWFP, 6 percent for Baluchistan and 1 percent schemes for ICT. During Q I of FY 2009/10 only FATA and Punjab areas got approval of development schemes while no scheme has been approved for rest of the areas.
5.6 During Q 1 FY 2009/10, the focus remained on provision of water supply and education development facilities in the rural areas. In this regard, 94 percent schemes were approved for provision of water supply and 6 percent schemes for the education.
Table 5.2: Number of PWP Schemes approved under each category Q1 FY 2009/10
Province Road
s Electrificati
on Gas
Telephones
Education
Health
Water
Supply
Sanitation
Bulldozer Hours
Total Schem
es
Punjab - - - - 2 - - - - 2 Sindh - - - - - - - - - - NWFP - - - - - - - - - - Balochistan
- - - - - - - - - -
FATA - - - - - - 30 - - 30 ICT - - - - - - - - - -
Total - - - - 2 - 30 - - 32 Q1 FY 2008/09
Province Roa
d Electrificati
on Gas
Telephone
Education
Health
Water
Supply
Sanitation
Bulldozer
Hours
Total Schem
es

1st Quarterly Progress Report FY 2009/10 Poverty Reduction Strategy Paper (PRSP)
37
Punjab 25 19 1 - 1 - 2 - - 48 Sindh 2 1 - - 3 3 - 6 - 15 NWFP 23 - - - - - 29 13 - 65 Balochistan
3 - - - 1 1 - - 1 6
FATA 4 - - - - - 43 - - 47 ICT - - - - - - 1 - - 1
Total 57 20 1 - 5 4 75 19 1 182 Source: Ministry of Local Government and Rural Development 5.5 Employment 5.7 The updated report covering progress on employed labour force Q 1 of FY 2009/10 is awaited from Ministry of Labour and Manpower, Pakistan.
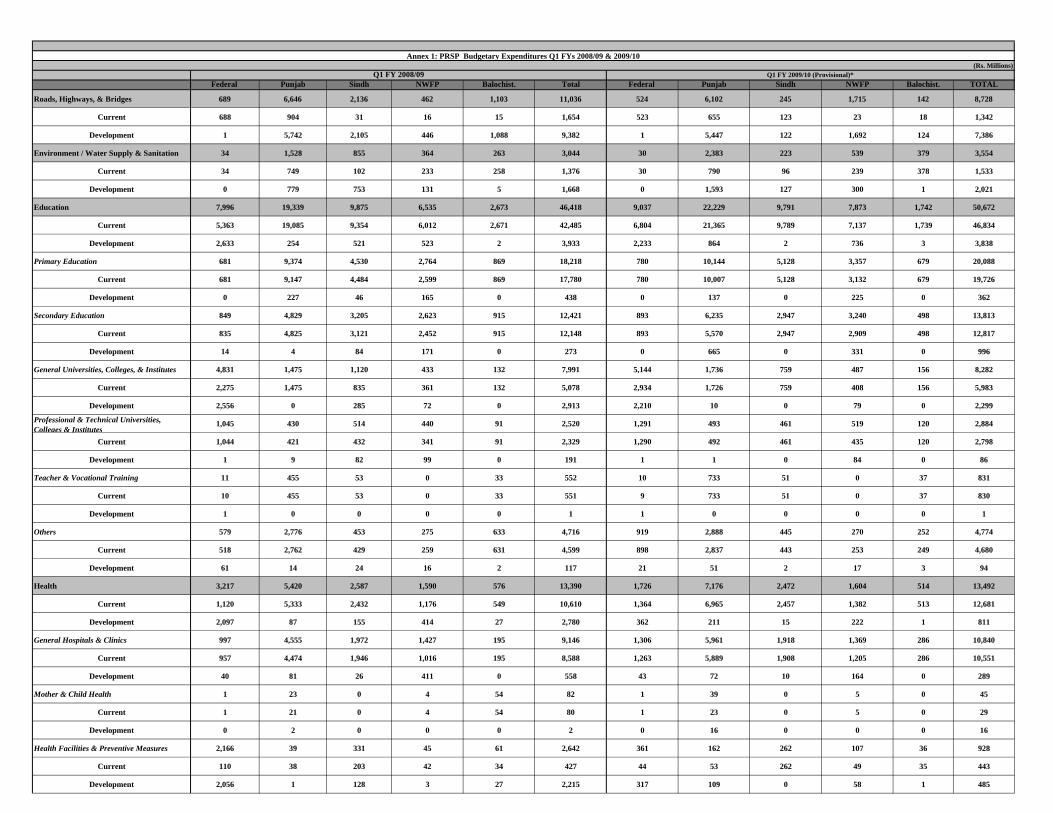
Federal Punjab Sindh NWFP Balochist. Total Federal Punjab Sindh NWFP Balochist. TOTAL
Roads, Highways, & Bridges 689 6,646 2,136 462 1,103 11,036 524 6,102 245 1,715 142 8,728
Current 688 904 31 16 15 1,654 523 655 123 23 18 1,342
Development 1 5,742 2,105 446 1,088 9,382 1 5,447 122 1,692 124 7,386
Environment / Water Supply & Sanitation 34 1,528 855 364 263 3,044 30 2,383 223 539 379 3,554
Current 34 749 102 233 258 1,376 30 790 96 239 378 1,533
Development 0 779 753 131 5 1,668 0 1,593 127 300 1 2,021
Education 7,996 19,339 9,875 6,535 2,673 46,418 9,037 22,229 9,791 7,873 1,742 50,672
Current 5,363 19,085 9,354 6,012 2,671 42,485 6,804 21,365 9,789 7,137 1,739 46,834
Development 2,633 254 521 523 2 3,933 2,233 864 2 736 3 3,838
Primary Education 681 9,374 4,530 2,764 869 18,218 780 10,144 5,128 3,357 679 20,088
Current 681 9,147 4,484 2,599 869 17,780 780 10,007 5,128 3,132 679 19,726
Development 0 227 46 165 0 438 0 137 0 225 0 362
Secondary Education 849 4,829 3,205 2,623 915 12,421 893 6,235 2,947 3,240 498 13,813
Current 835 4,825 3,121 2,452 915 12,148 893 5,570 2,947 2,909 498 12,817
Development 14 4 84 171 0 273 0 665 0 331 0 996
General Universities, Colleges, & Institutes 4,831 1,475 1,120 433 132 7,991 5,144 1,736 759 487 156 8,282
Current 2,275 1,475 835 361 132 5,078 2,934 1,726 759 408 156 5,983
Development 2,556 0 285 72 0 2,913 2,210 10 0 79 0 2,299
Professional & Technical Universities, Colleges & Institutes
1,045 430 514 440 91 2,520 1,291 493 461 519 120 2,884
Current 1,044 421 432 341 91 2,329 1,290 492 461 435 120 2,798
Development 1 9 82 99 0 191 1 1 0 84 0 86
Teacher & Vocational Training 11 455 53 0 33 552 10 733 51 0 37 831
Current 10 455 53 0 33 551 9 733 51 0 37 830
Development 1 0 0 0 0 1 1 0 0 0 0 1
Others 579 2,776 453 275 633 4,716 919 2,888 445 270 252 4,774
Current 518 2,762 429 259 631 4,599 898 2,837 443 253 249 4,680
Development 61 14 24 16 2 117 21 51 2 17 3 94
Health 3,217 5,420 2,587 1,590 576 13,390 1,726 7,176 2,472 1,604 514 13,492
Current 1,120 5,333 2,432 1,176 549 10,610 1,364 6,965 2,457 1,382 513 12,681
Development 2,097 87 155 414 27 2,780 362 211 15 222 1 811
General Hospitals & Clinics 997 4,555 1,972 1,427 195 9,146 1,306 5,961 1,918 1,369 286 10,840
Current 957 4,474 1,946 1,016 195 8,588 1,263 5,889 1,908 1,205 286 10,551
Development 40 81 26 411 0 558 43 72 10 164 0 289
Mother & Child Health 1 23 0 4 54 82 1 39 0 5 0 45
Current 1 21 0 4 54 80 1 23 0 5 0 29
Development 0 2 0 0 0 2 0 16 0 0 0 16
Health Facilities & Preventive Measures 2,166 39 331 45 61 2,642 361 162 262 107 36 928
Current 110 38 203 42 34 427 44 53 262 49 35 443
Development 2,056 1 128 3 27 2,215 317 109 0 58 1 485
Annex 1: PRSP Budgetary Expenditures Q1 FYs 2008/09 & 2009/10(Rs. Millions)
Q1 FY 2008/09 Q1 FY 2009/10 (Provisional)*
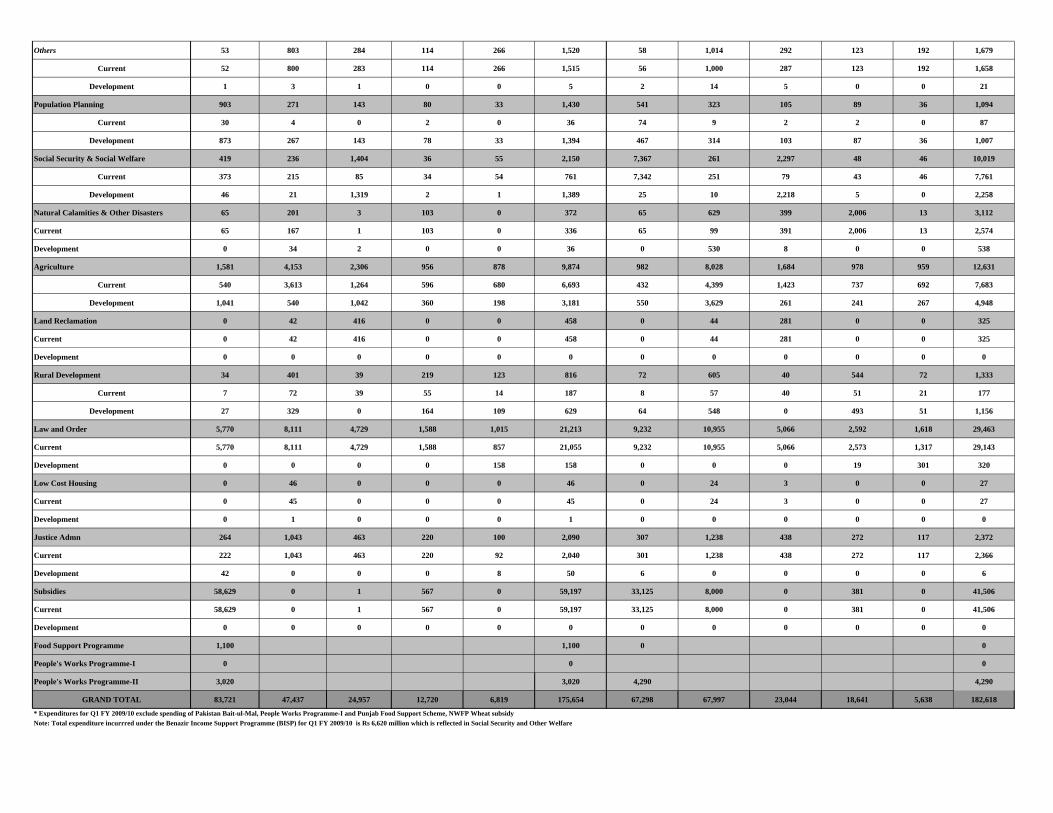
Others 53 803 284 114 266 1,520 58 1,014 292 123 192 1,679
Current 52 800 283 114 266 1,515 56 1,000 287 123 192 1,658
Development 1 3 1 0 0 5 2 14 5 0 0 21
Population Planning 903 271 143 80 33 1,430 541 323 105 89 36 1,094
Current 30 4 0 2 0 36 74 9 2 2 0 87
Development 873 267 143 78 33 1,394 467 314 103 87 36 1,007
Social Security & Social Welfare 419 236 1,404 36 55 2,150 7,367 261 2,297 48 46 10,019
Current 373 215 85 34 54 761 7,342 251 79 43 46 7,761
Development 46 21 1,319 2 1 1,389 25 10 2,218 5 0 2,258
Natural Calamities & Other Disasters 65 201 3 103 0 372 65 629 399 2,006 13 3,112
Current 65 167 1 103 0 336 65 99 391 2,006 13 2,574
Development 0 34 2 0 0 36 0 530 8 0 0 538
Agriculture 1,581 4,153 2,306 956 878 9,874 982 8,028 1,684 978 959 12,631
Current 540 3,613 1,264 596 680 6,693 432 4,399 1,423 737 692 7,683
Development 1,041 540 1,042 360 198 3,181 550 3,629 261 241 267 4,948
Land Reclamation 0 42 416 0 0 458 0 44 281 0 0 325
Current 0 42 416 0 0 458 0 44 281 0 0 325
Development 0 0 0 0 0 0 0 0 0 0 0 0
Rural Development 34 401 39 219 123 816 72 605 40 544 72 1,333
Current 7 72 39 55 14 187 8 57 40 51 21 177
Development 27 329 0 164 109 629 64 548 0 493 51 1,156
Law and Order 5,770 8,111 4,729 1,588 1,015 21,213 9,232 10,955 5,066 2,592 1,618 29,463
Current 5,770 8,111 4,729 1,588 857 21,055 9,232 10,955 5,066 2,573 1,317 29,143
Development 0 0 0 0 158 158 0 0 0 19 301 320
Low Cost Housing 0 46 0 0 0 46 0 24 3 0 0 27
Current 0 45 0 0 0 45 0 24 3 0 0 27
Development 0 1 0 0 0 1 0 0 0 0 0 0
Justice Admn 264 1,043 463 220 100 2,090 307 1,238 438 272 117 2,372
Current 222 1,043 463 220 92 2,040 301 1,238 438 272 117 2,366
Development 42 0 0 0 8 50 6 0 0 0 0 6
Subsidies 58,629 0 1 567 0 59,197 33,125 8,000 0 381 0 41,506
Current 58,629 0 1 567 0 59,197 33,125 8,000 0 381 0 41,506
Development 0 0 0 0 0 0 0 0 0 0 0 0
Food Support Programme 1,100 1,100 0 0
People's Works Programme-I 0 0 0
People's Works Programme-II 3,020 3,020 4,290 4,290
GRAND TOTAL 83,721 47,437 24,957 12,720 6,819 175,654 67,298 67,997 23,044 18,641 5,638 182,618
Note: Total expenditure incurrred under the Benazir Income Support Programme (BISP) for Q1 FY 2009/10 is Rs 6,620 million which is reflected in Social Security and Other Welfare* Expenditures for Q1 FY 2009/10 exclude spending of Pakistan Bait-ul-Mal, People Works Programme-I and Punjab Food Support Scheme, NWFP Wheat subsidy