Embed Size (px)
Citation preview
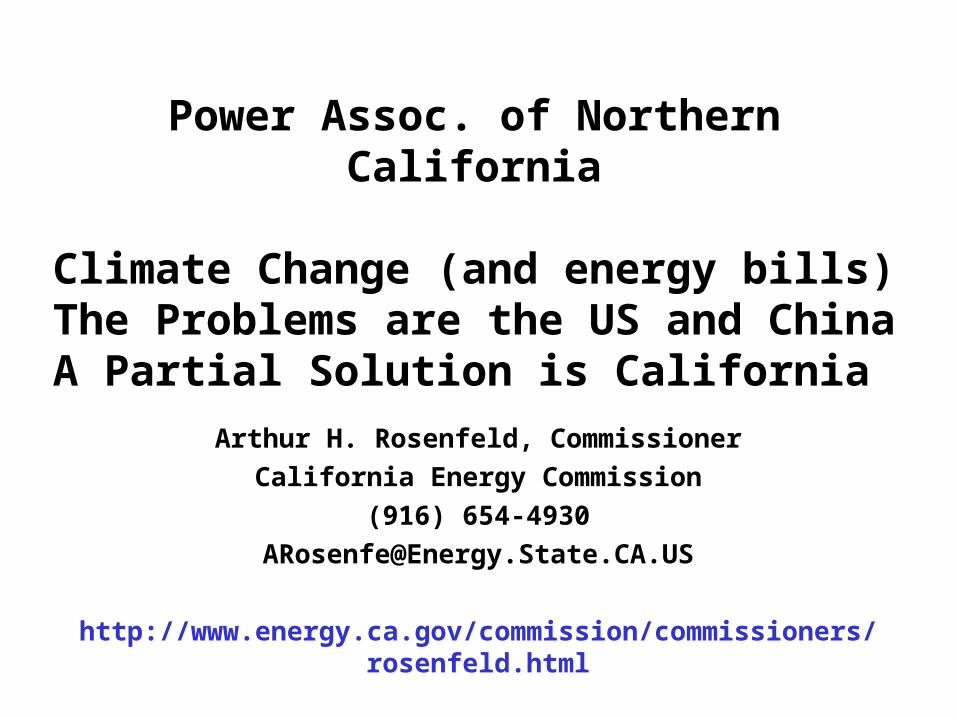
Power Assoc. of Northern California
Climate Change (and energy bills)The Problems are the US and China
A Partial Solution is California
Arthur H. Rosenfeld, Commissioner
California Energy Commission
(916) 654-4930
http://www.energy.ca.gov/commission/commissioners/rosenfeld.html
2
1949
3
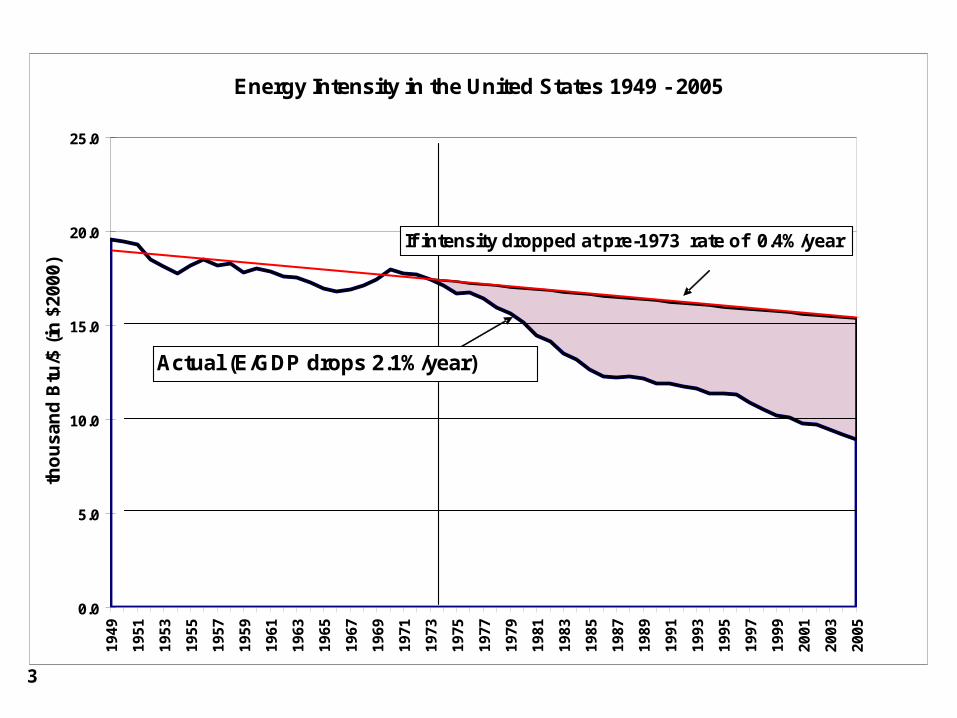
Energy Intensity in the United States 1949 - 2005
0.0
5.0
10.0
15.0
20.0
25.0
19
49
19
51
19
53
19
55
19
57
19
59
19
61
19
63
19
65
19
67
19
69
19
71
19
73
19
75
19
77
19
79
19
81
19
83
19
85
19
87
19
89
19
91
19
93
19
95
19
97
19
99
20
01
20
03
20
05
tho
us
an
d B
tu/$
(in
$2
00
0)
If intensity dropped at pre-1973 rate of 0.4%/year
Actual (E/GDP drops 2.1%/year)
4
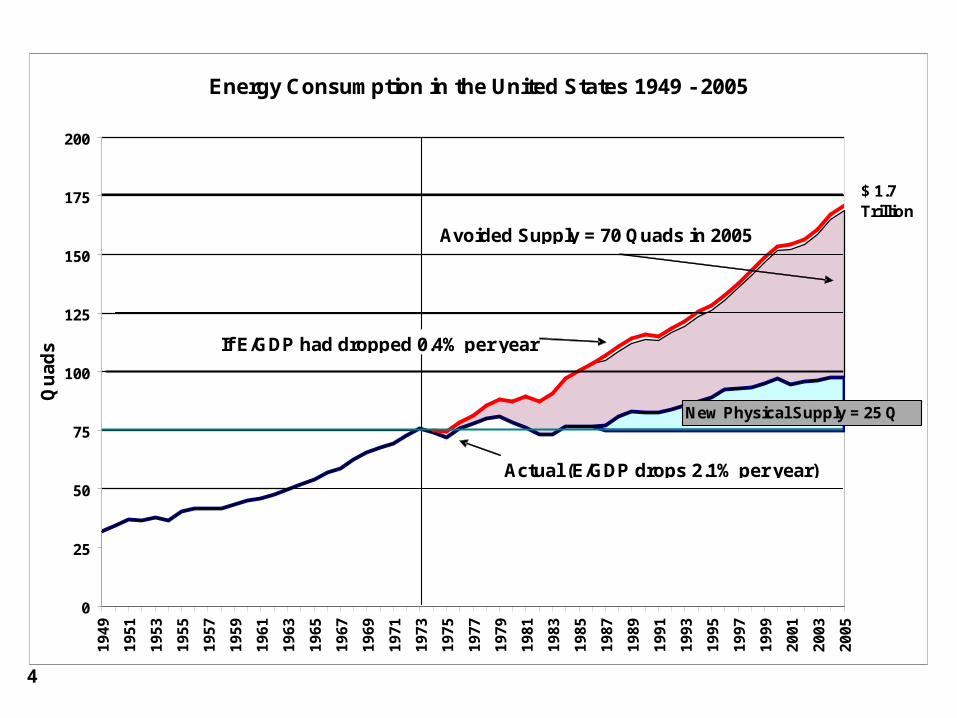
Energy Consumption in the United States 1949 - 2005
0
25
50
75
100
125
150
175
200
19
49
19
51
19
53
19
55
19
57
19
59
19
61
19
63
19
65
19
67
19
69
19
71
19
73
19
75
19
77
19
79
19
81
19
83
19
85
19
87
19
89
19
91
19
93
19
95
19
97
19
99
20
01
20
03
20
05
Qu
ad
s
$ 1.7 Trillion
$ 1.0 Trillion
New Physical Supply = 25 Q
Avoided Supply = 70 Quads in 2005
If E/GDP had dropped 0.4% per year
Actual (E/GDP drops 2.1% per year)
5
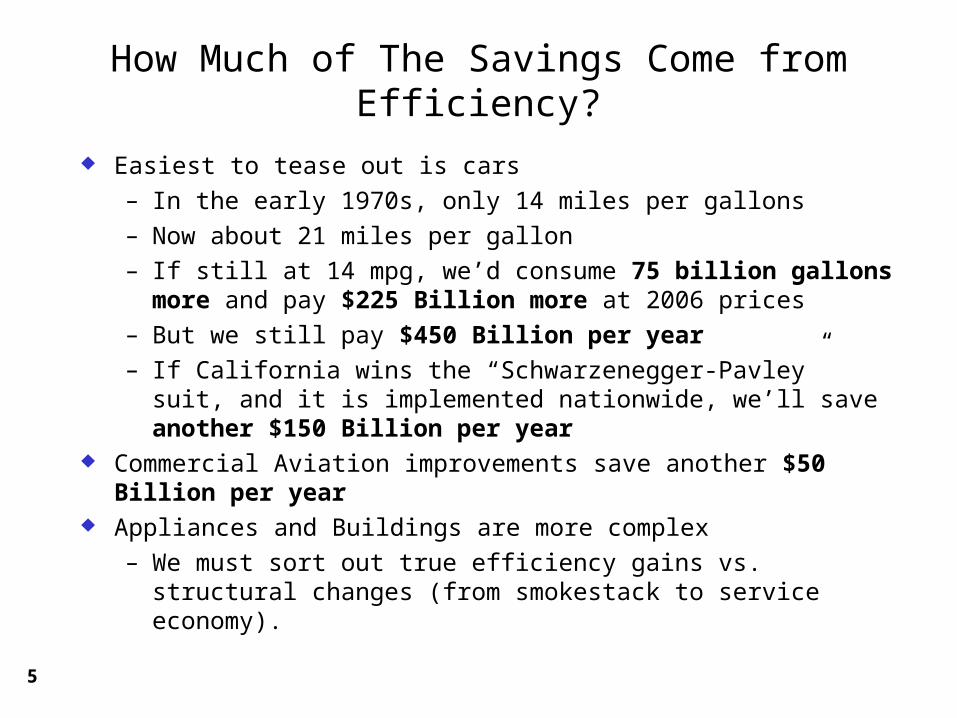
How Much of The Savings Come from Efficiency?
Easiest to tease out is cars
– In the early 1970s, only 14 miles per gallons
– Now about 21 miles per gallon
– If still at 14 mpg, we’d consume 75 billion gallons more and pay $225 Billion more at 2006 prices
– But we still pay $450 Billion per year
– If California wins the “Schwarzenegger-Pavley” suit, and it is implemented nationwide, we’ll save another $150 Billion per year
Commercial Aviation improvements save another $50 Billion per year Appliances and Buildings are more complex
– We must sort out true efficiency gains vs. structural changes (from smokestack to service economy).
6
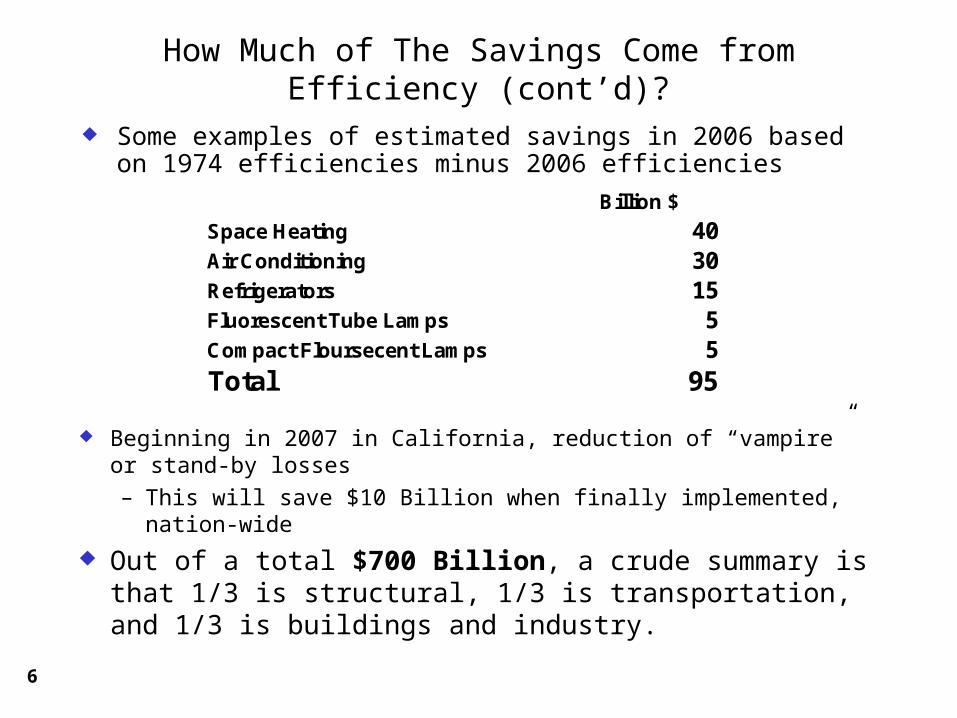
How Much of The Savings Come from Efficiency (cont’d)?
Some examples of estimated savings in 2006 based on 1974 efficiencies minus 2006 efficiencies
Beginning in 2007 in California, reduction of “vampire” or stand-by losses
– This will save $10 Billion when finally implemented, nation-wide
Out of a total $700 Billion, a crude summary is that 1/3 is structural, 1/3 is transportation, and 1/3 is buildings and industry.
Billion $
Space Heating 40Air Conditioning 30Refrigerators 15Fluorescent Tube Lamps 5Compact Floursecent Lamps 5Total 95
7
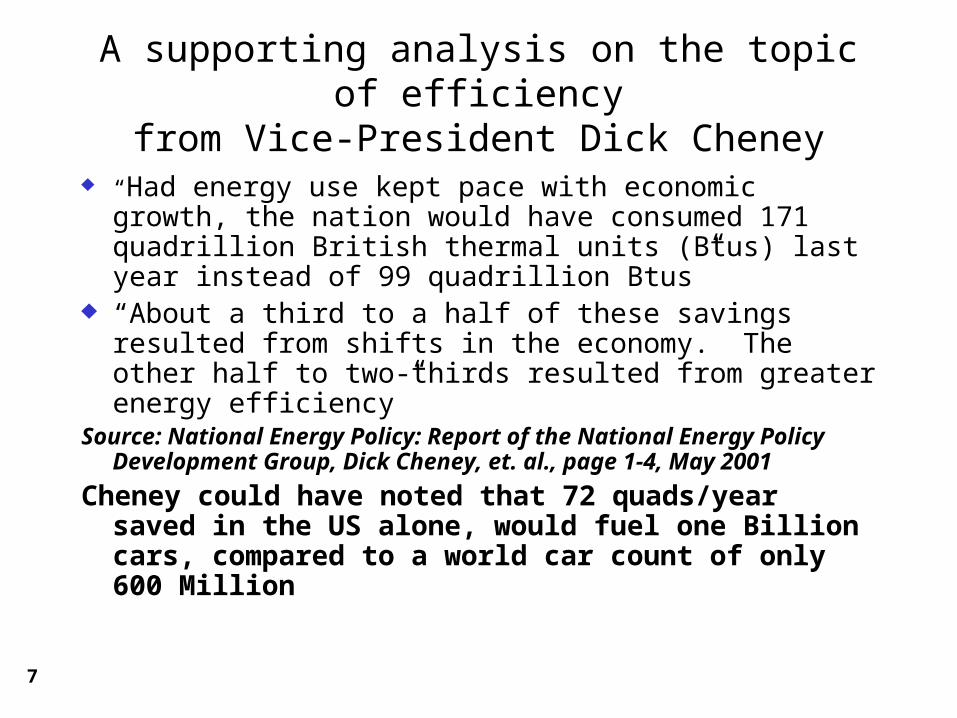
A supporting analysis on the topic of efficiencyfrom Vice-President Dick Cheney
“Had energy use kept pace with economic growth, the nation would have consumed 171 quadrillion British thermal units (Btus) last year instead of 99 quadrillion Btus”
“About a third to a half of these savings resulted from shifts in the economy. The other half to two-thirds resulted from greater energy efficiency”
Source: National Energy Policy: Report of the National Energy Policy Development Group, Dick Cheney, et. al., page 1-4, May 2001
Cheney could have noted that 72 quads/year saved in the US alone, would fuel one Billion cars, compared to a world car count of only 600 Million
8
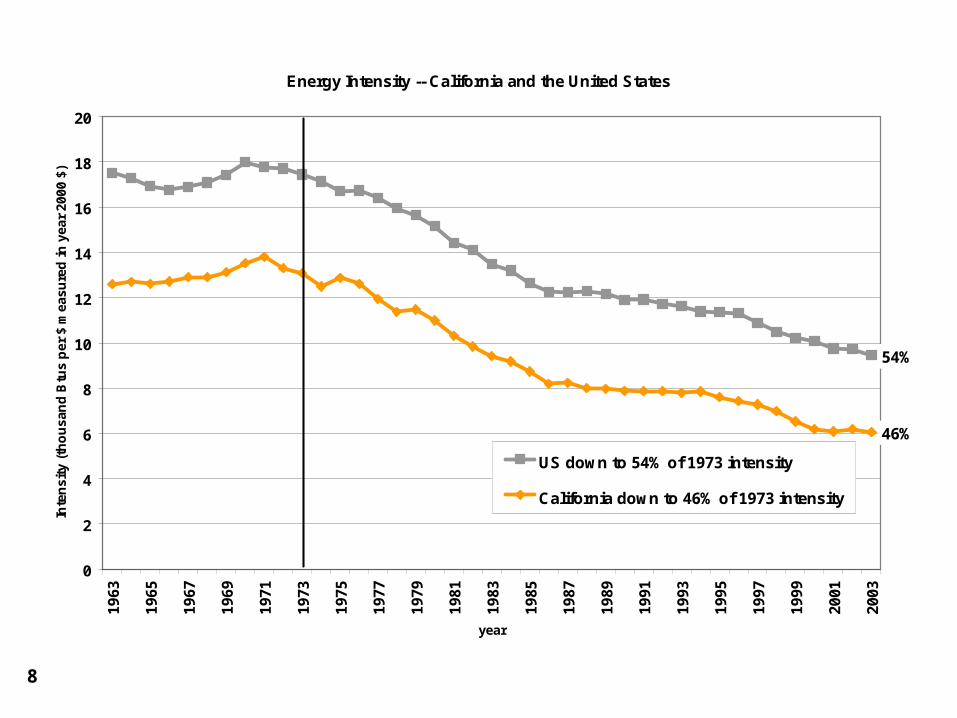
Energy Intensity -- California and the United States
0
2
4
6
8
10
12
14
16
18
2019
63
1965
1967
1969
1971
1973
1975
1977
1979
1981
1983
1985
1987
1989
1991
1993
1995
1997
1999
2001
2003
year
Inte
nsi
ty (
tho
usa
nd
Btu
s p
er $
mea
sure
d in
yea
r 20
00 $
)
US down to 54% of 1973 intensity
California down to 46% of 1973 intensity
54%
46%
9
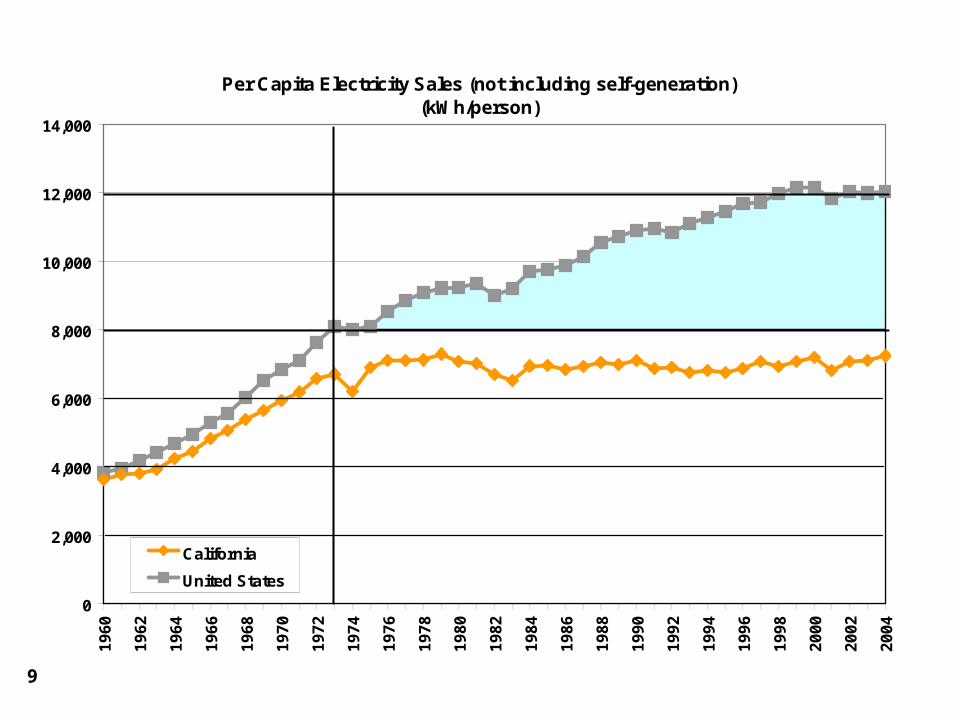
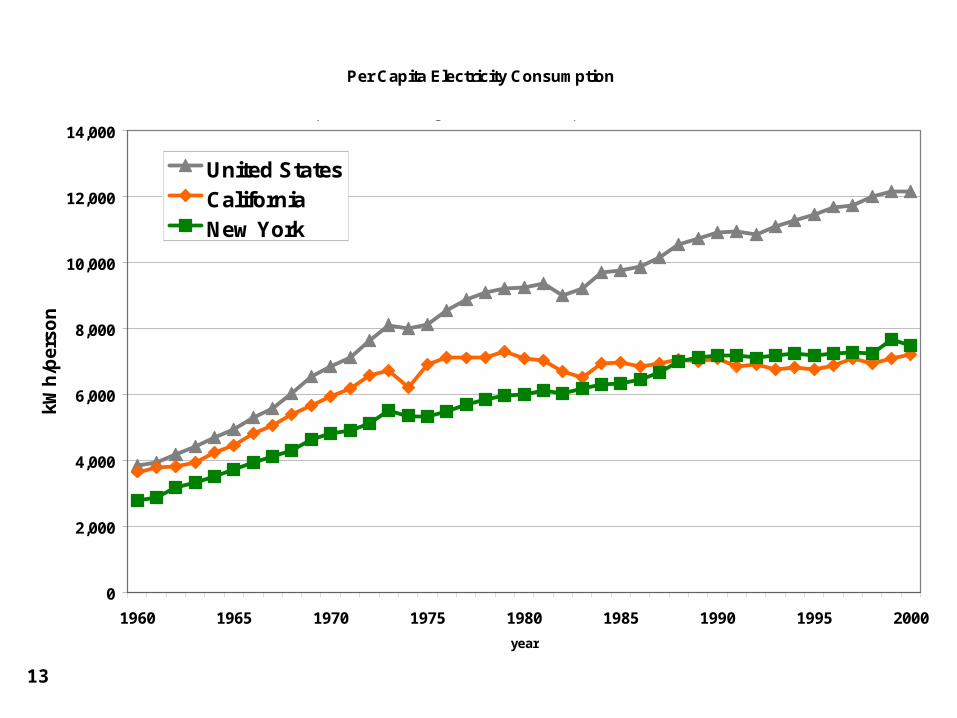
Per Capita Electricity Sales (not including self-generation)(kWh/person)
0
2,000
4,000
6,000
8,000
10,000
12,000
14,0001
96
0
19
62
19
64
19
66
19
68
19
70
19
72
19
74
19
76
19
78
19
80
19
82
19
84
19
86
19
88
19
90
19
92
19
94
19
96
19
98
20
00
20
02
20
04
California
United States
10
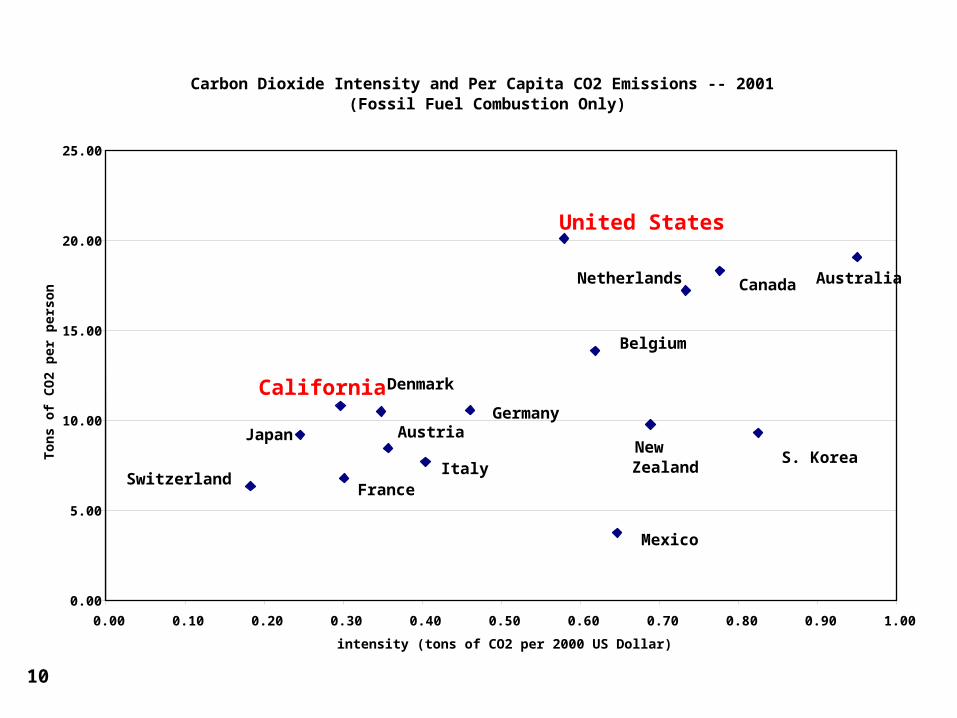
Carbon Dioxide Intensity and Per Capita CO2 Emissions -- 2001 (Fossil Fuel Combustion Only)
0.00
5.00
10.00
15.00
20.00
25.00
0.00 0.10 0.20 0.30 0.40 0.50 0.60 0.70 0.80 0.90 1.00
intensity (tons of CO2 per 2000 US Dollar)
To
ns
of
CO
2 p
er p
erso
n
Canada Australia
S. Korea
California
Mexico
United States
Austria
Belgium
Denmark
France
Germany
Italy
Netherlands
New Zealand
Switzerland
Japan
11
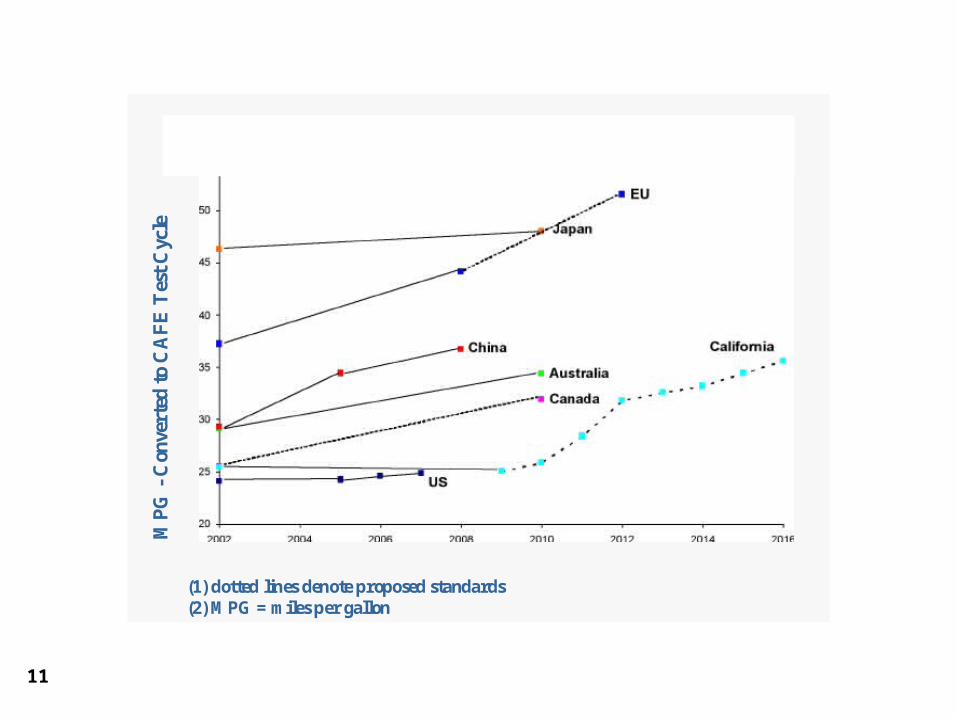
(1) dotted lines denote proposed standards(2) MPG = miles per gallon
MP
G -
Con
vert
ed t
o C
AF
E T
est
Cyc
le
12
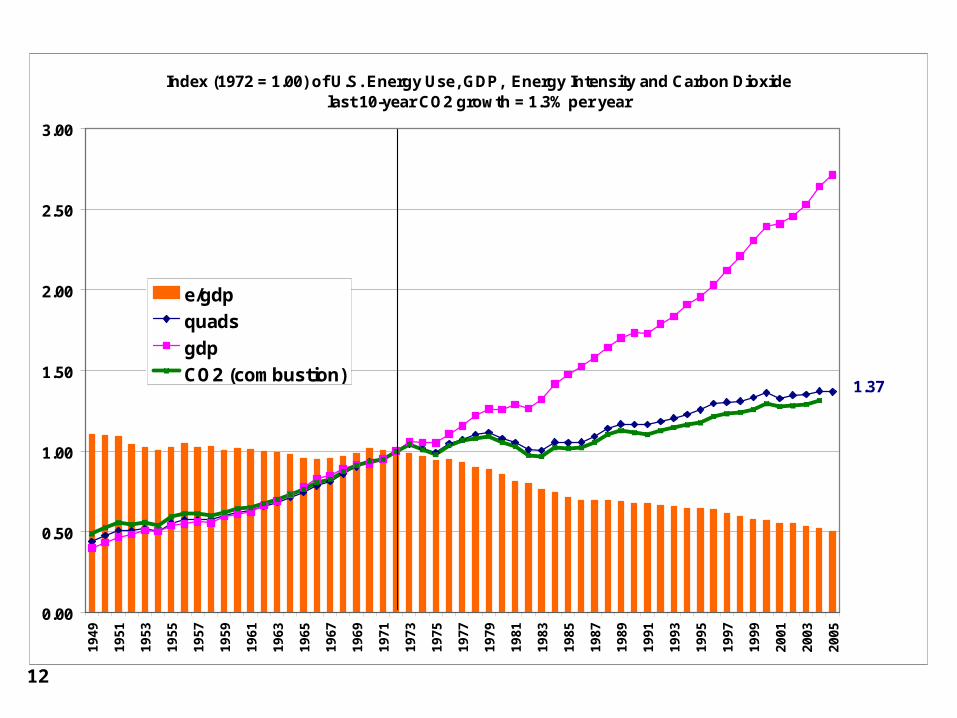
Index (1972 = 1.00) of U.S. Energy Use, GDP, Energy Intensity and Carbon Dioxidelast 10-year CO2 growth = 1.3% per year
0.00
0.50
1.00
1.50
2.00
2.50
3.00
19
49
19
51
19
53
19
55
19
57
19
59
19
61
19
63
19
65
19
67
19
69
19
71
19
73
19
75
19
77
19
79
19
81
19
83
19
85
19
87
19
89
19
91
19
93
19
95
19
97
19
99
20
01
20
03
20
05
e/gdp
quads
gdp
CO2 (combustion)1.37
2.71
1.33 (est.)
13
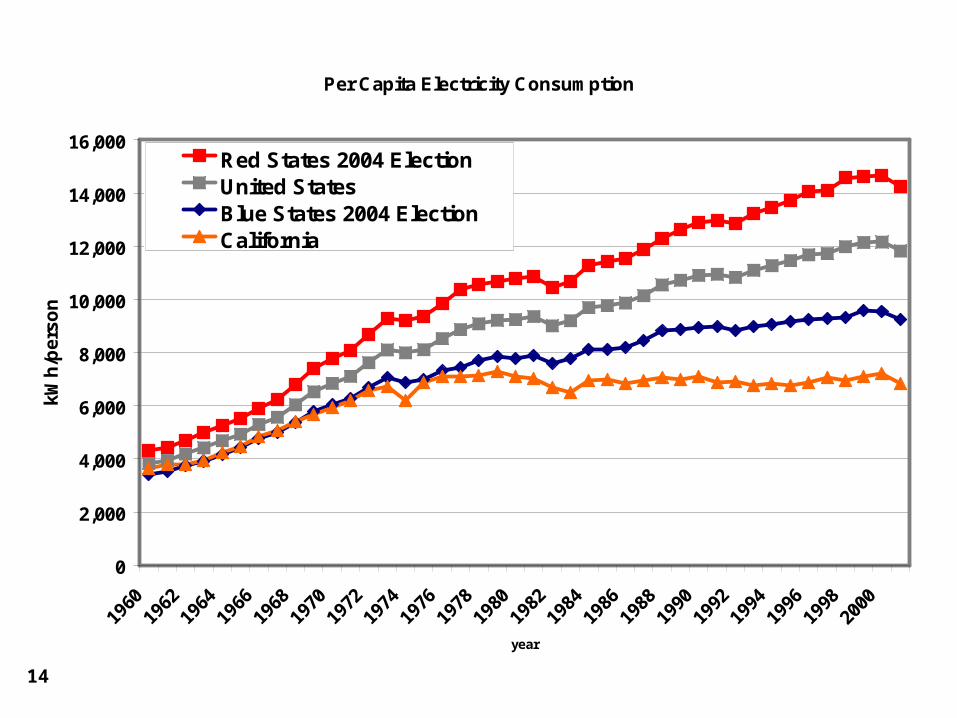
Per Capita Electricity Consumption
0
2,000
4,000
6,000
8,000
10,000
12,000
14,000
1960 1965 1970 1975 1980 1985 1990 1995 2000
year
kW
h/p
ers
on
United States
California
New York
Source: http://www.eia.doe.gov/emeu/states/sep_use/total/csv/use_csv
14
Per Capita Electricity Consumption
0
2,000
4,000
6,000
8,000
10,000
12,000
14,000
16,000
1960
1962
1964
1966
1968
1970
1972
1974
1976
1978
1980
1982
1984
1986
1988
1990
1992
1994
1996
1998
2000
year
kW
h/p
ers
on
Red States 2004 ElectionUnited StatesBlue States 2004 ElectionCalifornia
15
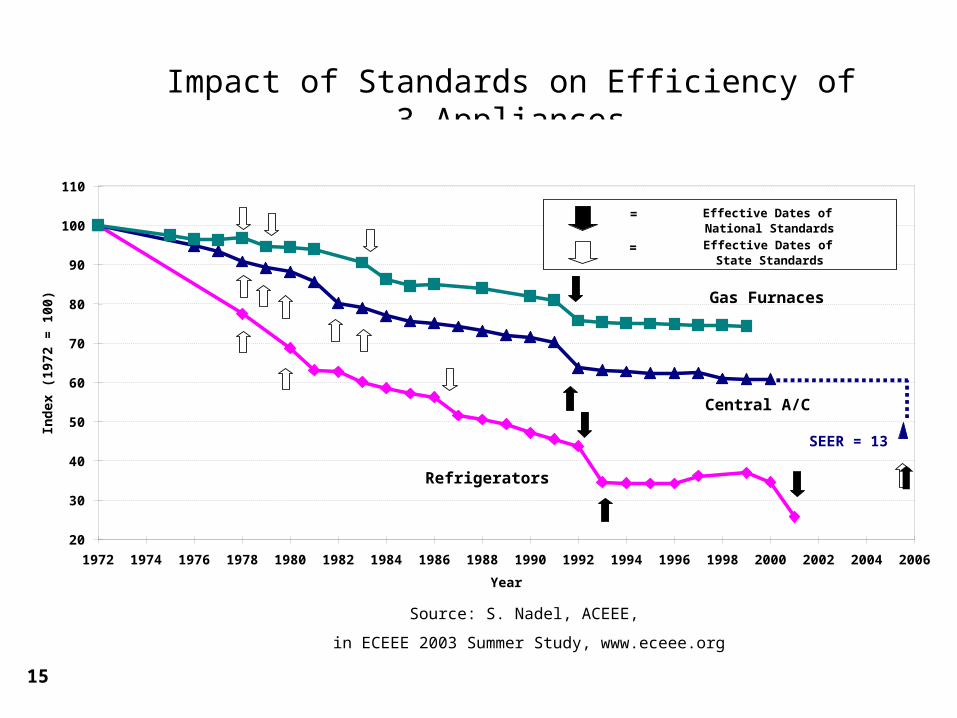
Impact of Standards on Efficiency of 3 Appliances
Source: S. Nadel, ACEEE,
in ECEEE 2003 Summer Study, www.eceee.org
75%
60%
25%20
30
40
50
60
70
80
90
100
110
1972 1974 1976 1978 1980 1982 1984 1986 1988 1990 1992 1994 1996 1998 2000 2002 2004 2006
Year
Ind
ex (
1972
= 1
00)
Effective Dates of National Standards
=
Effective Dates of State Standards
=
Refrigerators
Central A/C
Gas Furnaces
SEER = 13
16 Source: David Goldstein
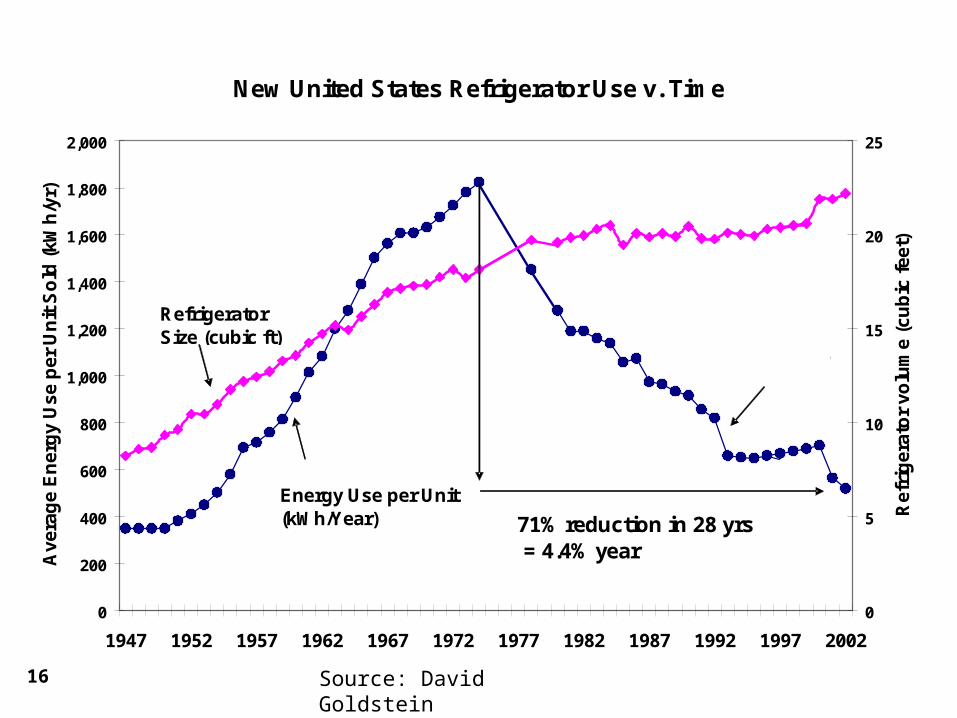
New United States Refrigerator Use v. Time
0
200
400
600
800
1,000
1,200
1,400
1,600
1,800
2,000
1947 1952 1957 1962 1967 1972 1977 1982 1987 1992 1997 2002
Av
era
ge
En
erg
y U
se
pe
r U
nit
So
ld (
kW
h/y
r)
0
5
10
15
20
25
Re
frig
era
tor
vo
lum
e (
cu
bic
fe
et)
Refrigerator Size (cubic ft)
Energy Use per Unit(kWh/Year) 71% reduction in 28 yrs
= 4.4% year
1st Federal Standard 1992
17 Source: David Goldstein
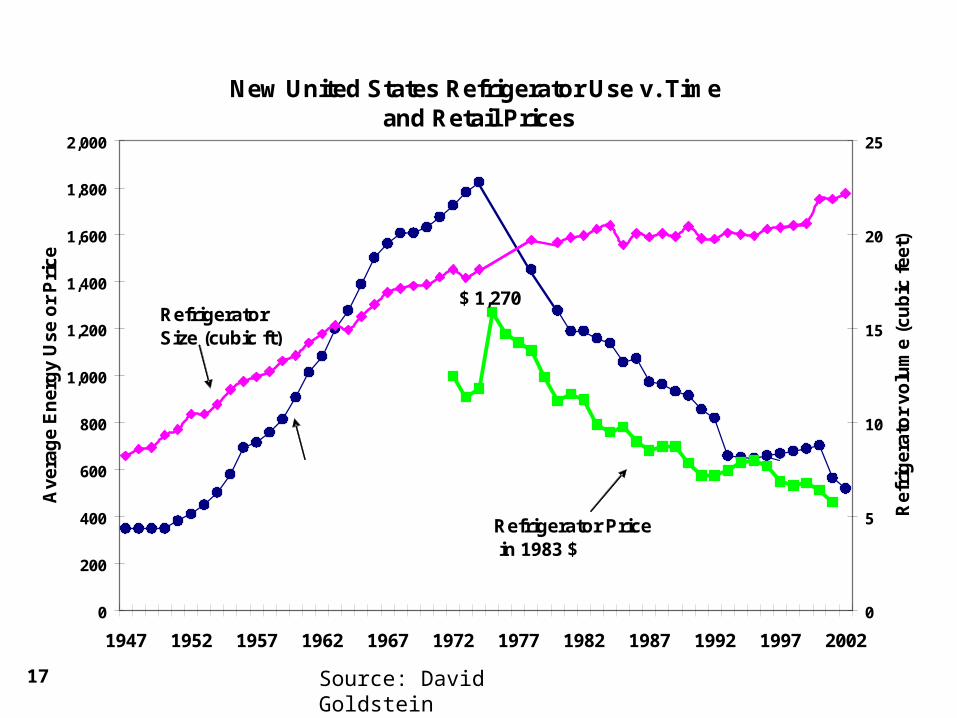
New United States Refrigerator Use v. Time and Retail Prices
0
200
400
600
800
1,000
1,200
1,400
1,600
1,800
2,000
1947 1952 1957 1962 1967 1972 1977 1982 1987 1992 1997 2002
Av
era
ge
En
erg
y U
se
or
Pri
ce
0
5
10
15
20
25
Re
frig
era
tor
vo
lum
e (
cu
bic
fe
et)
Energy Use per Unit(kWh/Year)
Refrigerator Size (cubic ft)
Refrigerator Price in 1983 $
$ 1,270
$ 462
18
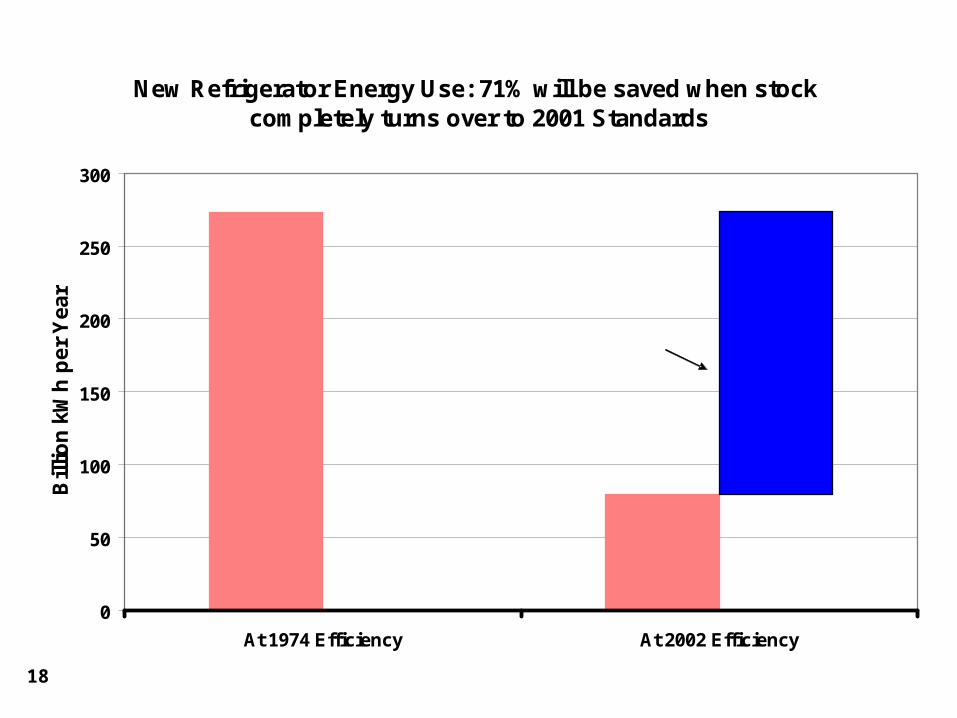
New Refrigerator Energy Use: 71% will be saved when stock completely turns over to 2001 Standards
0
50
100
150
200
250
300
At 1974 Efficiency At 2002 Efficiency
Bil
lio
n k
Wh
per
Yea
r
Energy Needed
Energy Needed
Energy Saved
19
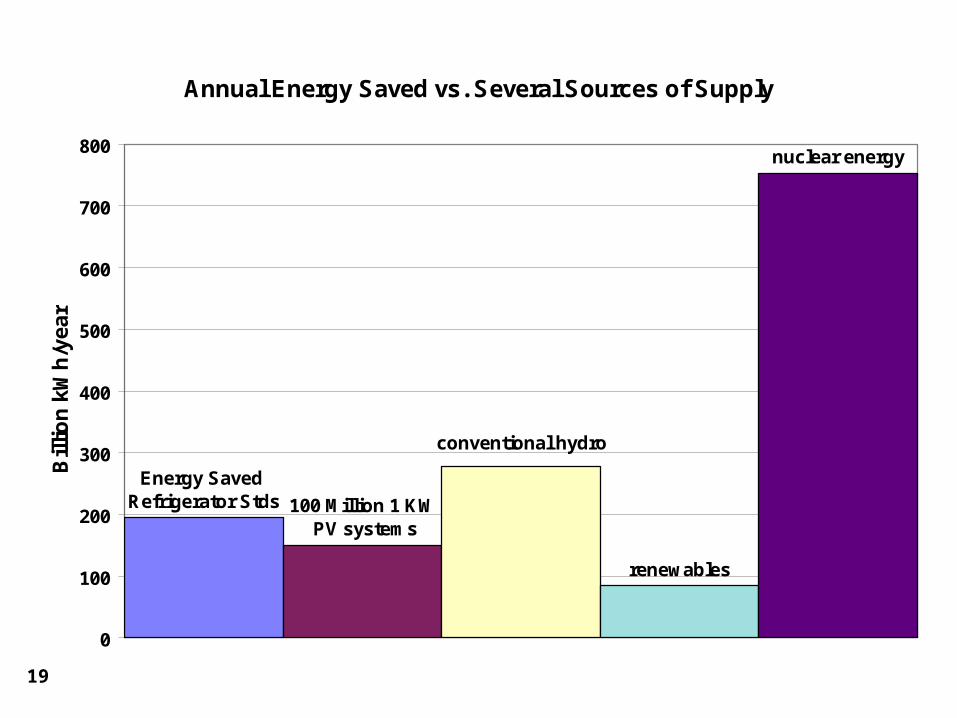
Annual Energy Saved vs. Several Sources of Supply
Energy Saved Refrigerator Stds
renewables
100 Million 1 KW PV systems
conventional hydro
nuclear energy
0
100
200
300
400
500
600
700
800
Bil
lio
n k
Wh
/yea
r
20
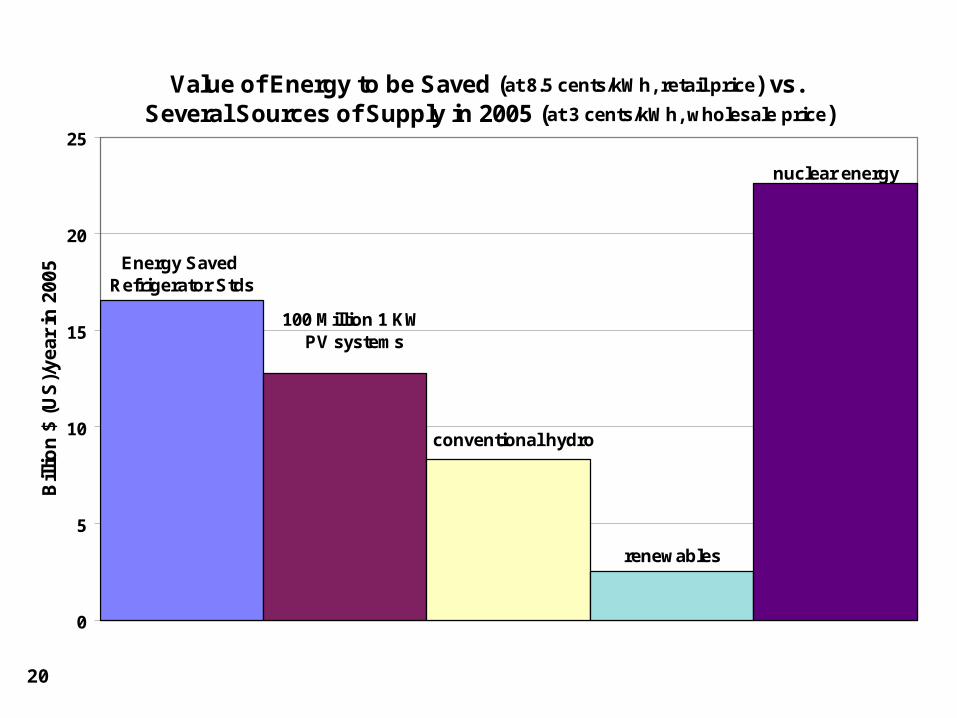
Value of Energy to be Saved (at 8.5 cents/kWh, retail price) vs. Several Sources of Supply in 2005 (at 3 cents/kWh, wholesale price)
Energy Saved Refrigerator Stds
renewables
100 Million 1 KW PV systems
conventional hydro
nuclear energy
0
5
10
15
20
25
Bill
ion
$ (
US
)/ye
ar
in 2
00
5
21
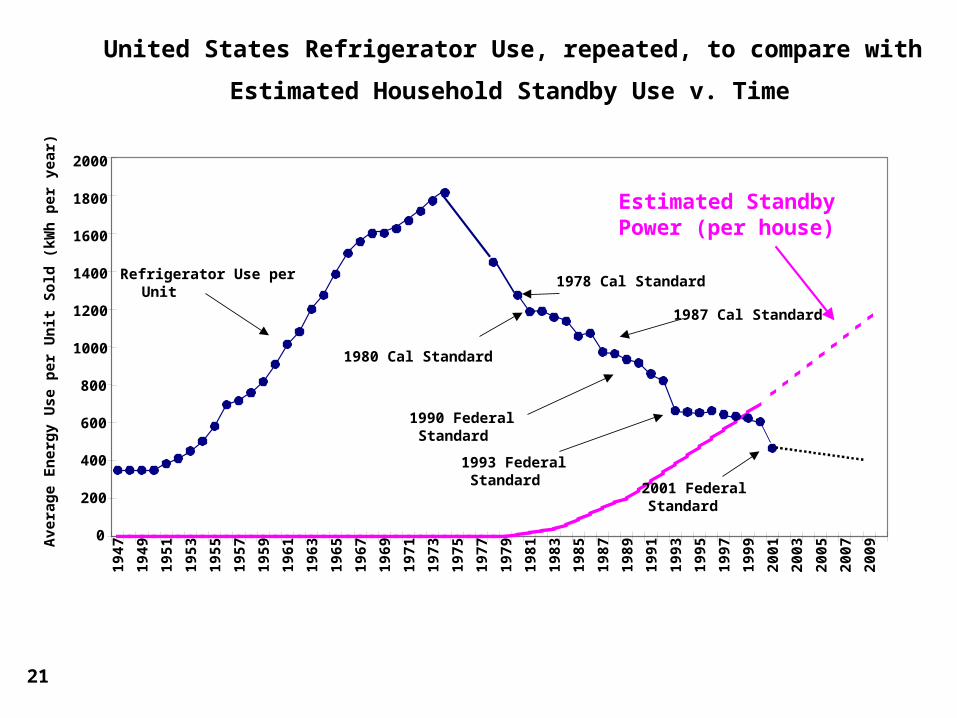
United States Refrigerator Use, repeated, to compare with
Estimated Household Standby Use v. Time
0
200
400
600
800
1000
1200
1400
1600
1800
2000
1947
1949
1951
1953
1955
1957
1959
1961
1963
1965
1967
1969
1971
1973
1975
1977
1979
1981
1983
1985
1987
1989
1991
1993
1995
1997
1999
2001
2003
2005
2007
2009
Ave
rage
En
ergy
Use
per
Un
it S
old
(k
Wh
per
yea
r)
Refrigerator Use per Unit
1978 Cal Standard
1990 Federal Standard
1987 Cal Standard
1980 Cal Standard
1993 Federal Standard 2001 Federal
Standard
Estimated Standby Power (per house)
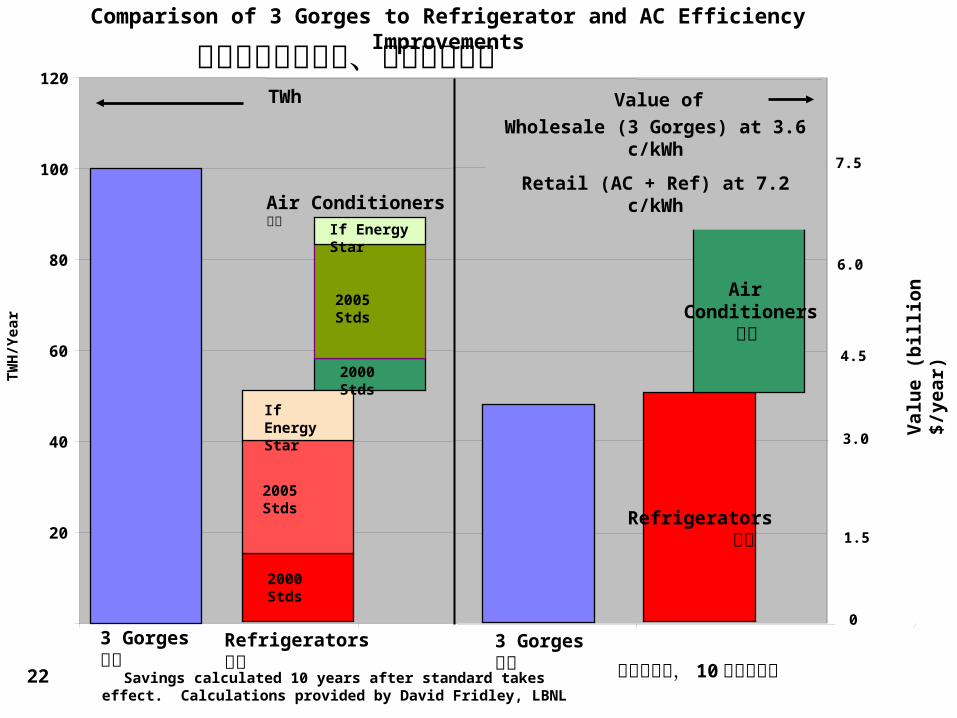
22
0
20
40
60
80
100
120
3 Gorges三峡
Refrigerators冰箱
Air Conditioners 空调
TWh
2000 Stds
2000 Stds
2005 Stds
2005 Stds
If Energy Star
If Energy Star
TW
H/Y
ear
1.5
4.5
6.0
3.0
7.5
Val
ue
(bil
lio
n $
/yea
r)
Comparison of 3 Gorges to Refrigerator and AC Efficiency Improvements
Savings calculated 10 years after standard takes effect. Calculations provided by David Fridley, LBNL
Value of TWh
3 Gorges三峡
Refrigerators 冰箱
Air Conditioners
空调
Wholesale (3 Gorges) at 3.6 c/kWh
Retail (AC + Ref) at 7.2 c/kWh
三峡电量与电冰箱、空调能效对比
标准生效后, 10 年节约电量
23
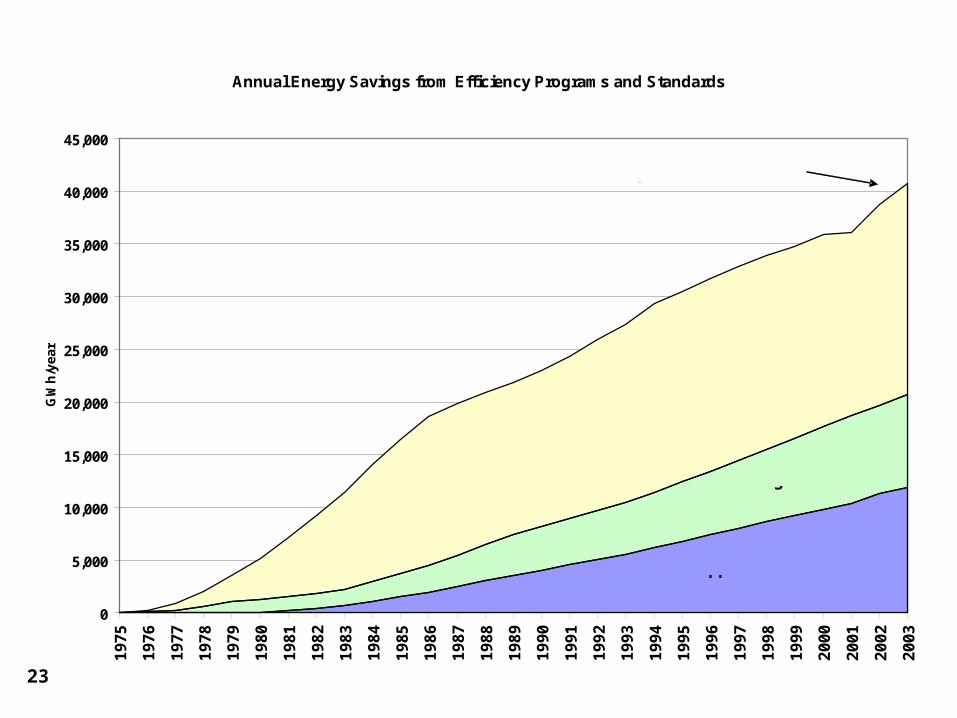
Annual Energy Savings from Efficiency Programs and Standards
0
5,000
10,000
15,000
20,000
25,000
30,000
35,000
40,000
45,00019
75
1976
1977
1978
1979
1980
1981
1982
1983
1984
1985
1986
1987
1988
1989
1990
1991
1992
1993
1994
1995
1996
1997
1998
1999
2000
2001
2002
2003
GW
h/y
ea
r
Appliance Standards
Building Standards
Utility Efficiency Programs at a cost of
~1% of electric bill
~15% of Annual Electricity Use in California in 2003
24
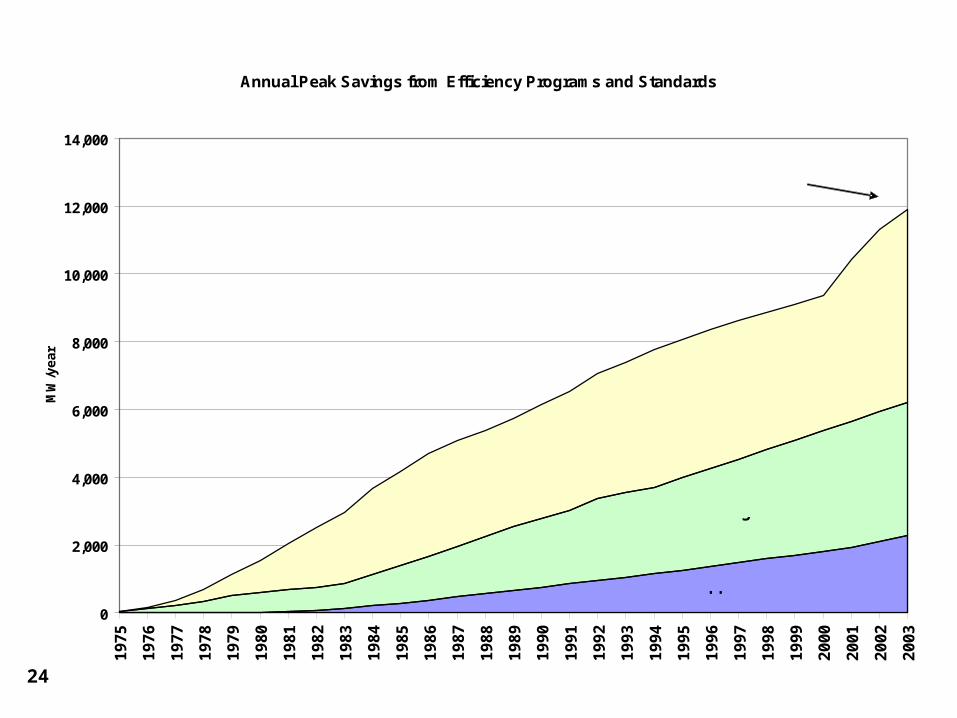
Annual Peak Savings from Efficiency Programs and Standards
0
2,000
4,000
6,000
8,000
10,000
12,000
14,00019
75
1976
1977
1978
1979
1980
1981
1982
1983
1984
1985
1986
1987
1988
1989
1990
1991
1992
1993
1994
1995
1996
1997
1998
1999
2000
2001
2002
2003
MW
/ye
ar
Appliance Standards
Building Standards
Utility Efficiency Programs at a cost of
~1% of electric bill
~ 22% of Annual Peak in California in 2003
25
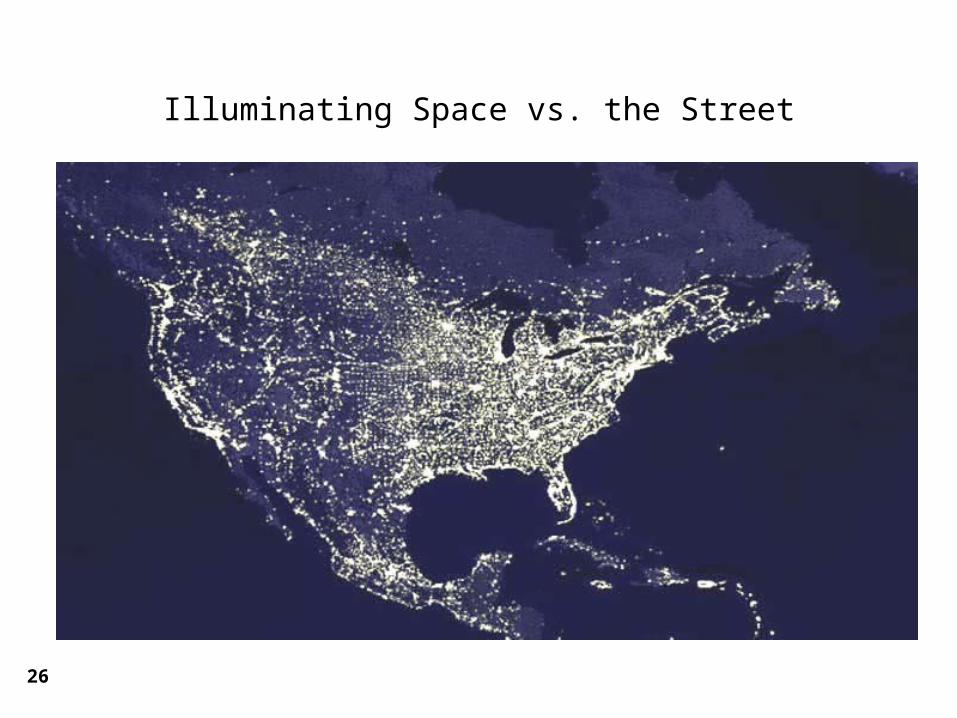
26
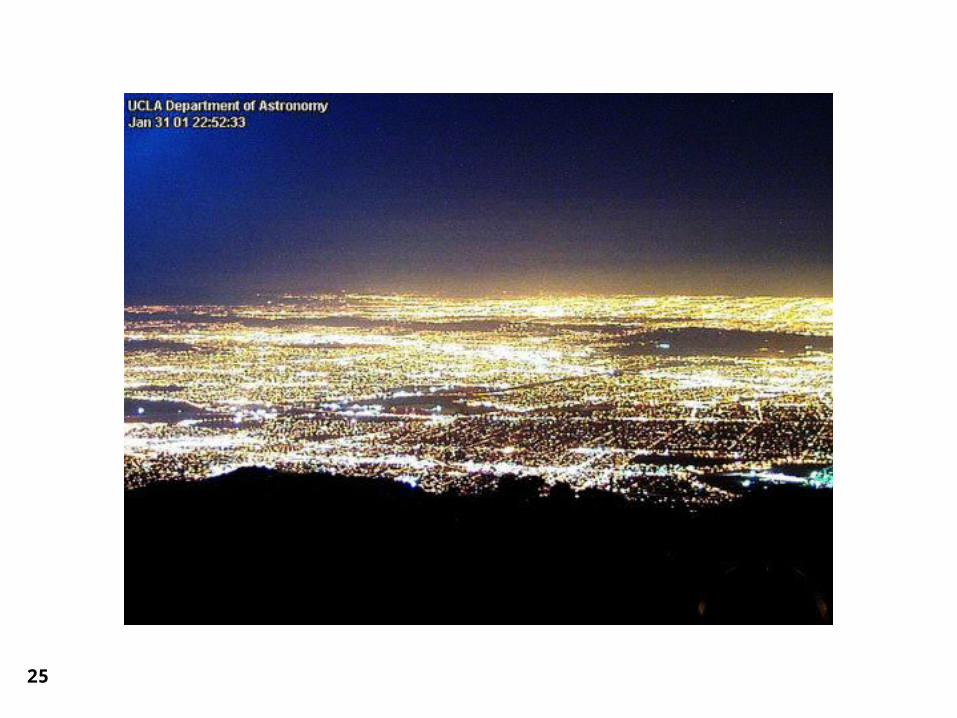
Illuminating Space vs. the Street
27
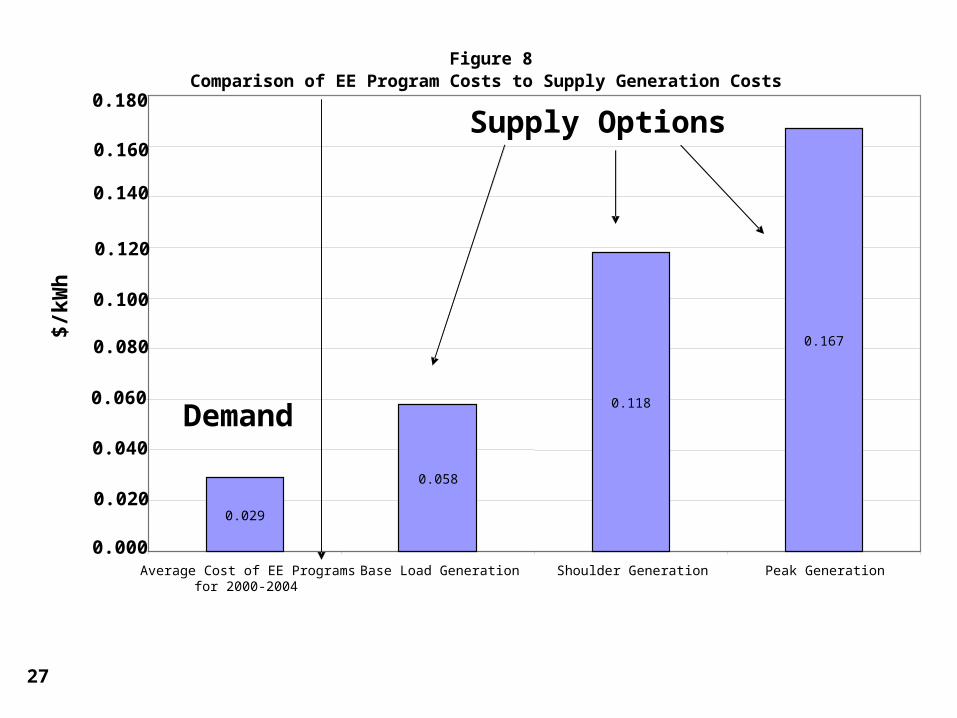
Figure 8Comparison of EE Program Costs to Supply Generation Costs
0.029
0.058
0.118
0.167
0.000
0.020
0.040
0.060
0.080
0.100
0.120
0.140
0.160
0.180
Average Cost of EE Programsfor 2000-2004
Base Load Generation Shoulder Generation Peak Generation
$/kW
h
Demand
Supply Options
28
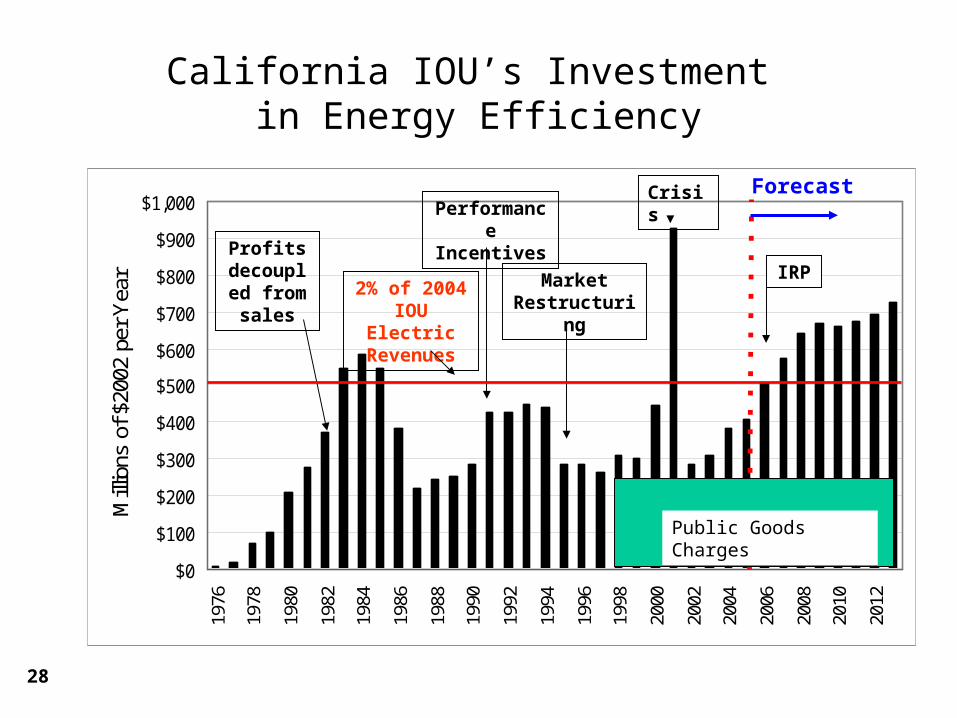
California IOU’s Investment in Energy Efficiency
$0
$100
$200
$300
$400
$500
$600
$700
$800
$900
$1,00019
76
1978
1980
1982
1984
1986
1988
1990
1992
1994
1996
1998
2000
2002
2004
2006
2008
2010
2012
Mill
ions
of
$200
2 pe
r Y
ear
Forecast
Profits decoupled from sales
Performance Incentives
Market Restructuring
Crisis
IRP2% of 2004
IOU Electric Revenues
Public Goods Charges
29
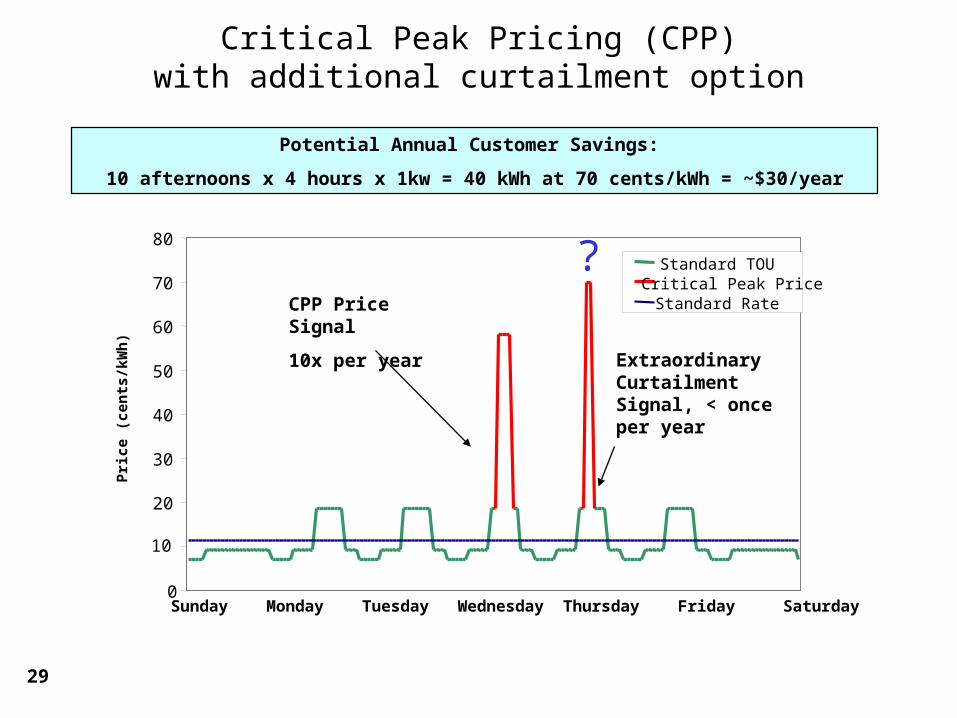
Critical Peak Pricing (CPP)with additional curtailment option
0
10
20
30
40
50
60
70
80
Pri
ce (
cen
ts/k
Wh
)
Standard TOUCritical Peak PriceStandard Rate
Sunday Monday Tuesday Wednesday Thursday Friday Saturday
Extraordinary Curtailment Signal, < once per year
CPP Price Signal
10x per year
?
Potential Annual Customer Savings:
10 afternoons x 4 hours x 1kw = 40 kWh at 70 cents/kWh = ~$30/year
30
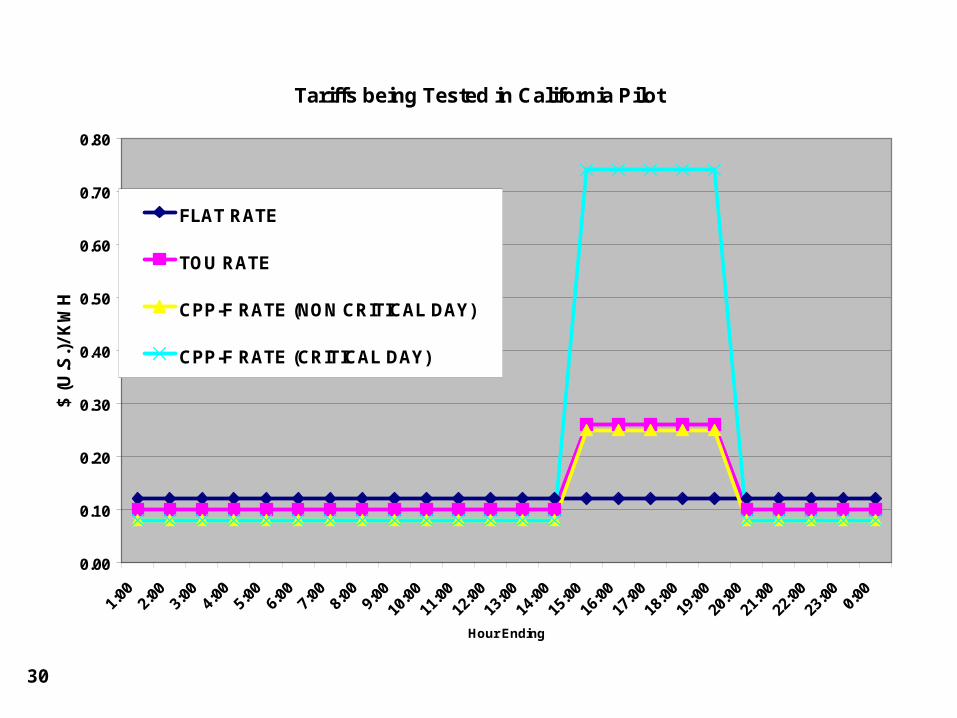
Tariffs being Tested in California Pilot
0.00
0.10
0.20
0.30
0.40
0.50
0.60
0.70
0.80
1:00
2:00
3:00
4:00
5:00
6:00
7:00
8:00
9:00
10:0
0
11:0
0
12:0
0
13:0
0
14:0
0
15:0
0
16:0
0
17:0
0
18:0
0
19:0
0
20:0
0
21:0
0
22:0
0
23:0
00:
00
Hour Ending
$ (U
.S.)
/ K
WH
FLAT RATE
TOU RATE
CPP-F RATE (NON CRITICAL DAY)
CPP-F RATE (CRITICAL DAY)
31
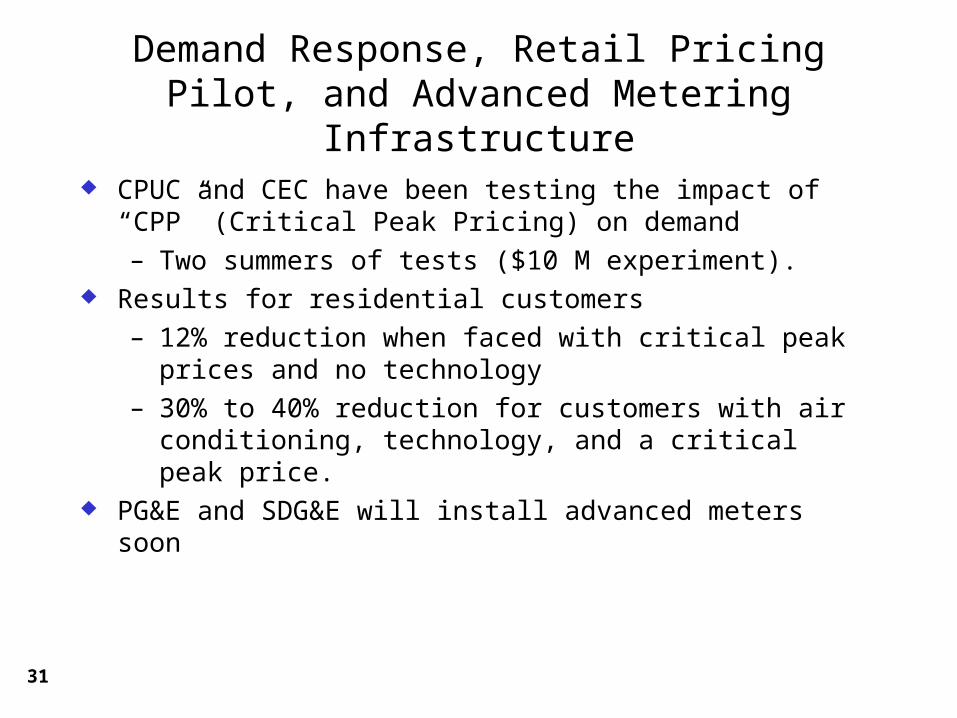
Demand Response, Retail Pricing Pilot, and Advanced Metering Infrastructure
CPUC and CEC have been testing the impact of “CPP” (Critical Peak Pricing) on demand
– Two summers of tests ($10 M experiment). Results for residential customers
– 12% reduction when faced with critical peak prices and no technology
– 30% to 40% reduction for customers with air conditioning, technology, and a critical peak price.
PG&E and SDG&E will install advanced meters soon
32
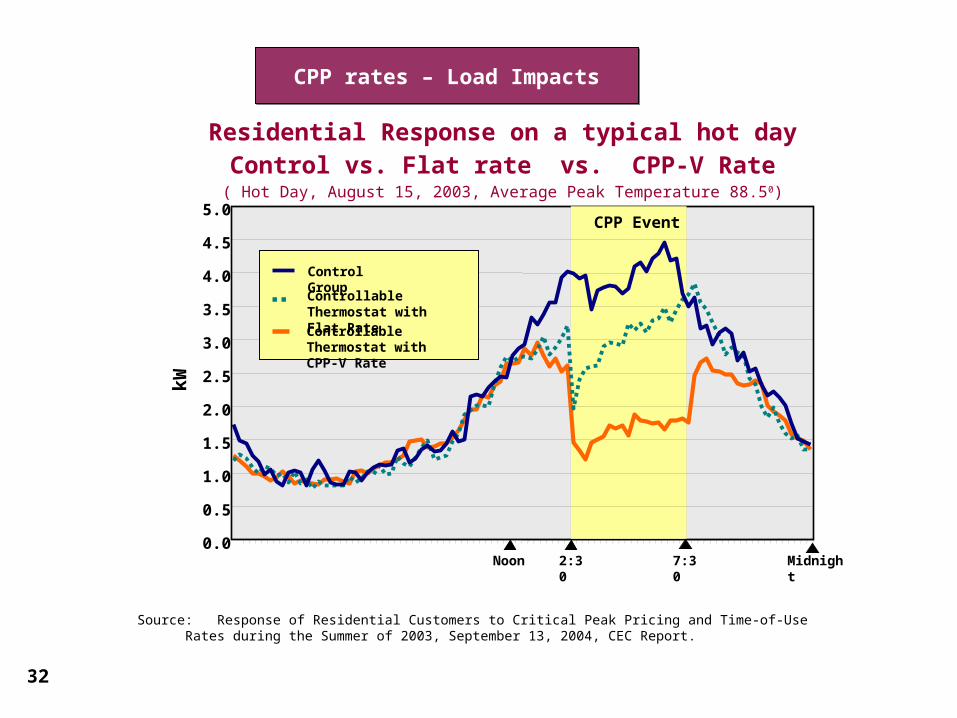
Source: Response of Residential Customers to Critical Peak Pricing and Time-of-Use Rates during the Summer of 2003, September 13, 2004, CEC Report.
Residential Response on a typical hot dayControl vs. Flat rate vs. CPP-V Rate
( Hot Day, August 15, 2003, Average Peak Temperature 88.50)kW
0.0
0.5
1.0
1.5
2.0
2.5
3.0
3.5
4.0
4.5
5.0
Noon 2:30 7:30
Controllable Thermostat with CPP-V Rate
Controllable Thermostat with Flat Rate
Control Group
Midnight
CPP Event
CPP rates – Load ImpactsCPP rates – Load Impacts
33
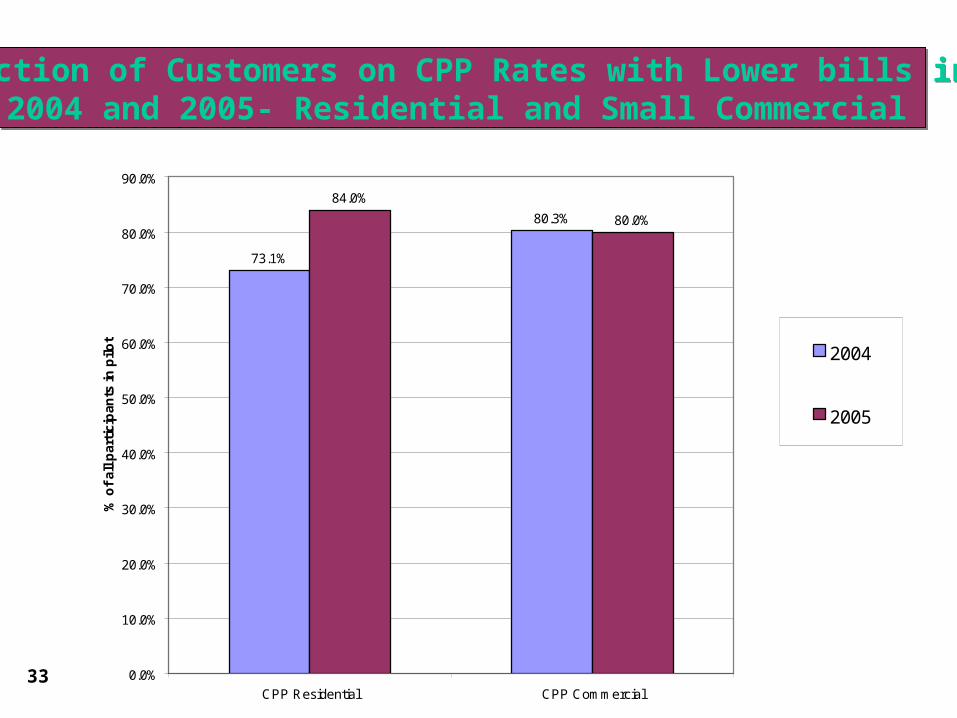
Fraction of Customers on CPP Rates with Lower bills in 2004 and 2005- Residential and Small Commercial
Fraction of Customers on CPP Rates with Lower bills in 2004 and 2005- Residential and Small Commercial
73.1%
80.3%
84.0%
80.0%
0.0%
10.0%
20.0%
30.0%
40.0%
50.0%
60.0%
70.0%
80.0%
90.0%
CPP Residential CPP Commercial
% o
f al
l par
tici
pan
ts in
pilo
t
2004
200520042004
2005 2005
Average residential savings= $38/year
Average small commercial savings-$1300/yr
34
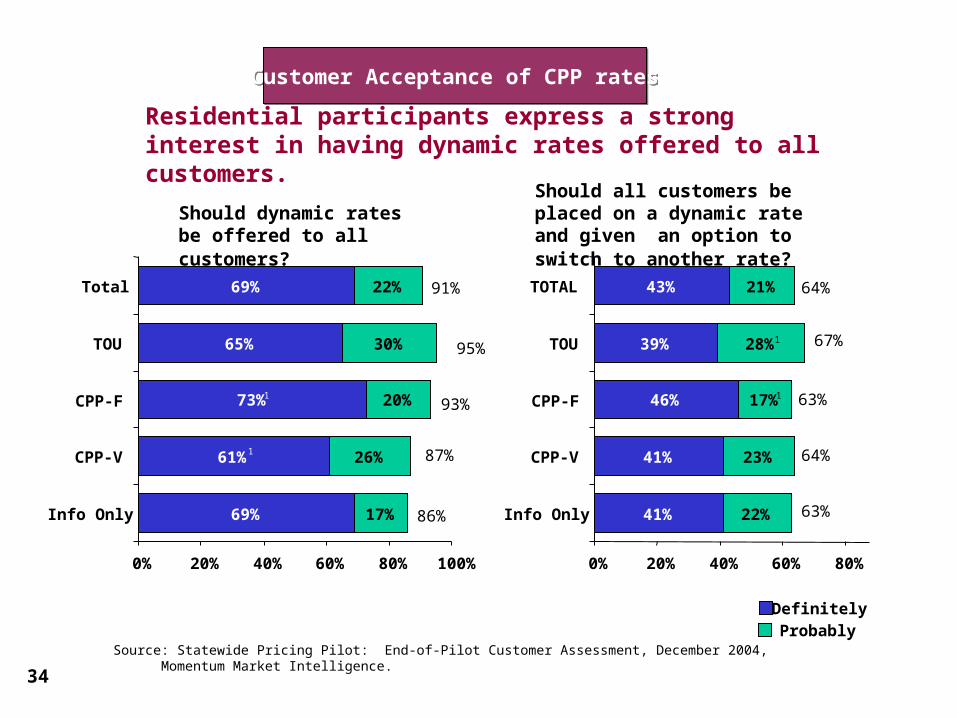
Customer Acceptance of CPP ratesCustomer Acceptance of CPP rates
Should all customers be placed on a dynamic rate and given an option to switch to another rate?
Should dynamic rates be offered to all customers?
DefinitelyProbably
95%
69%
65%
73%
61%
69%
22%
30%
20%
26%
17%
0% 20% 40% 60% 80% 100%
Total
TOU
CPP-F
CPP-V
Info Only
1
1
91%
93%
87%
86%
43%
39%
46%
41%
41%
21%
28%
17%
23%
22%
0% 20% 40% 60% 80%
TOTAL
TOU
CPP-F
CPP-V
Info Only
1
1
64%
67%
63%
64%
63%
Residential participants express a strong interest in having dynamic rates offered to all customers.
Source: Statewide Pricing Pilot: End-of-Pilot Customer Assessment, December 2004, Momentum Market Intelligence.
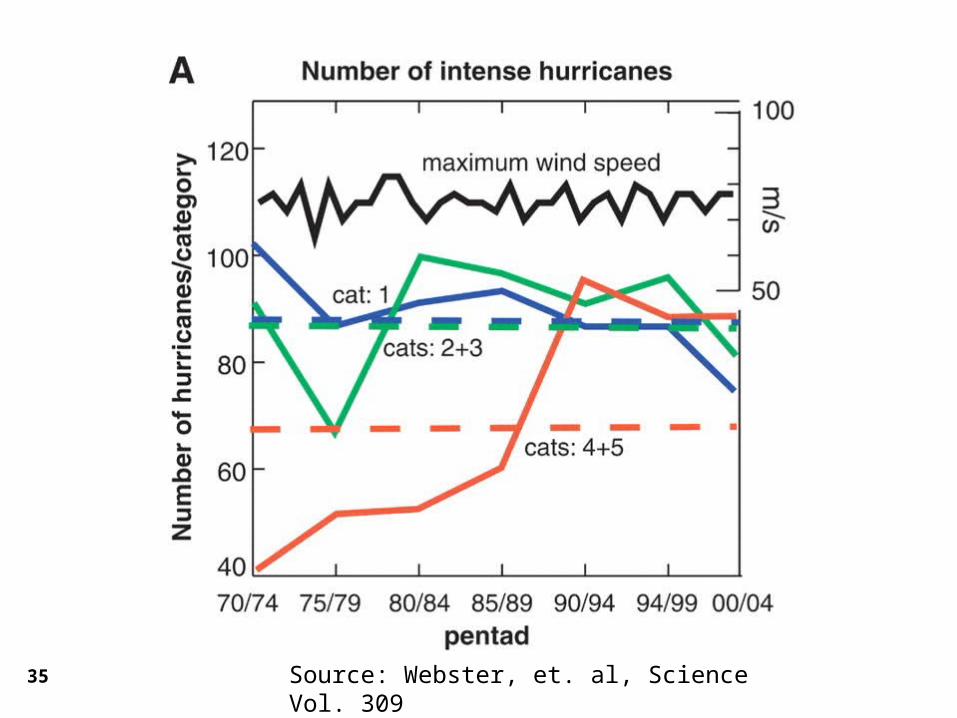
35 Source: Webster, et. al, Science Vol. 309
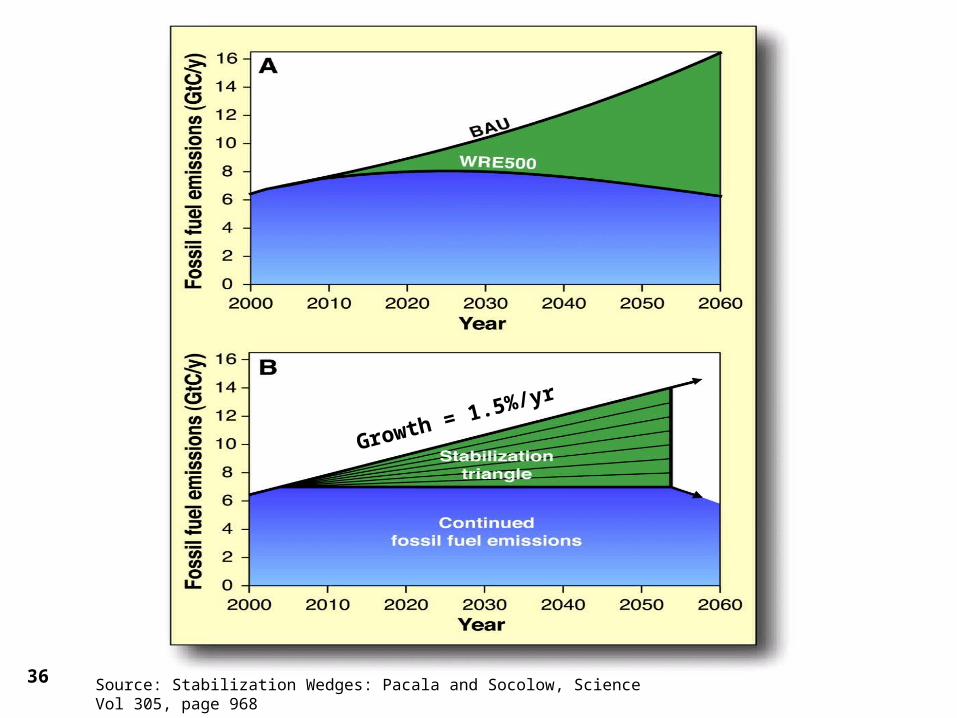
36 Source: Stabilization Wedges: Pacala and Socolow, Science Vol 305, page 968
Growth = 1.5%/yr