Embed Size (px)
Citation preview
TREND Plenary meeting
Ghent, 14-15/02/2012
Power consumption of base stations
Alberto CONTE
Alcatel-Lucent Bell Labs France
Ghent, 14/02/2012
TREND Plenary meeting
Ghent, 14-15/02/2012 2
Outline
� BS consumption... why we care?
� Functions, grouping and integration
� Power consumption figures
� Consumption vs. Cell Load
� Possible BS power models
TREND Plenary meeting
Ghent, 14-15/02/2012
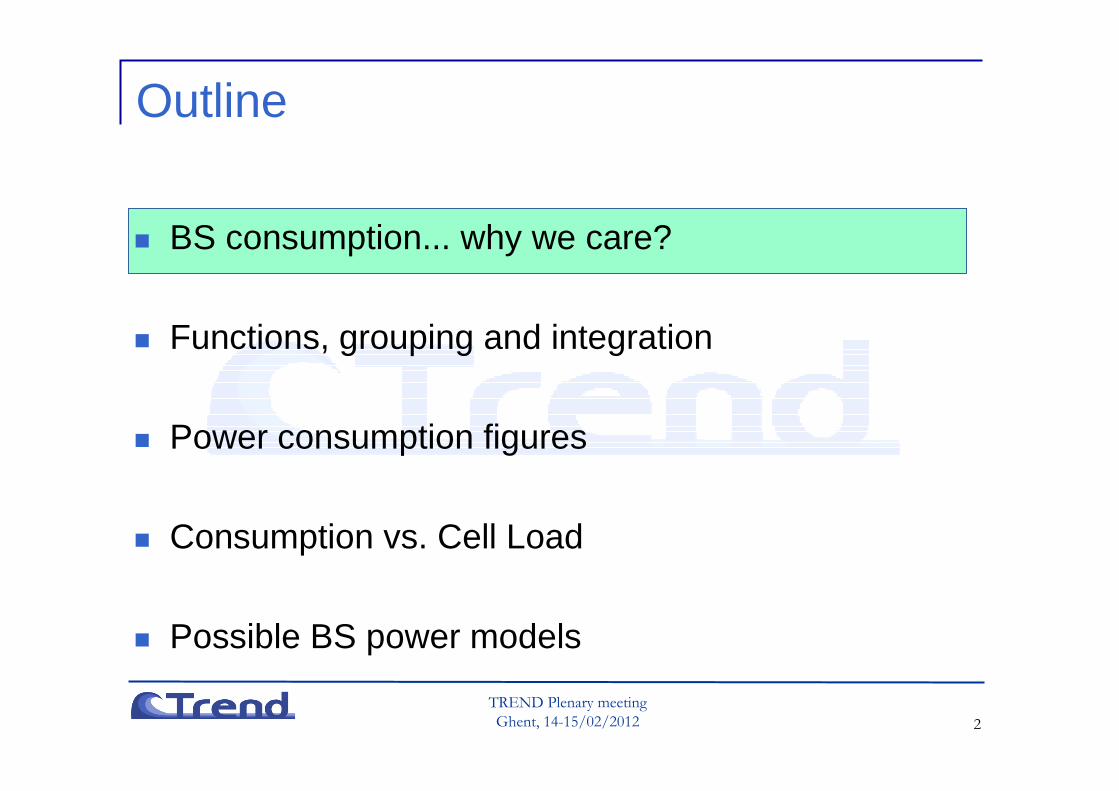
Based on: ETSI RRS05_024, NSN
60TWh/a
2TWh/a
<1TWh/a 14
TWh/a
0.1W 1kW 1kW 10kW
Mobile Communications: where is the power going ?
More than 90% is used to power the radio sites !!
TREND Plenary meeting
Ghent, 14-15/02/2012 4
Outline
� BS consumption... why we care?
� Functions, grouping and integration
� Power consumption figures
� Consumption vs. Cell Load
� Possible BS power models
TREND Plenary meeting
Ghent, 14-15/02/2012
analogue
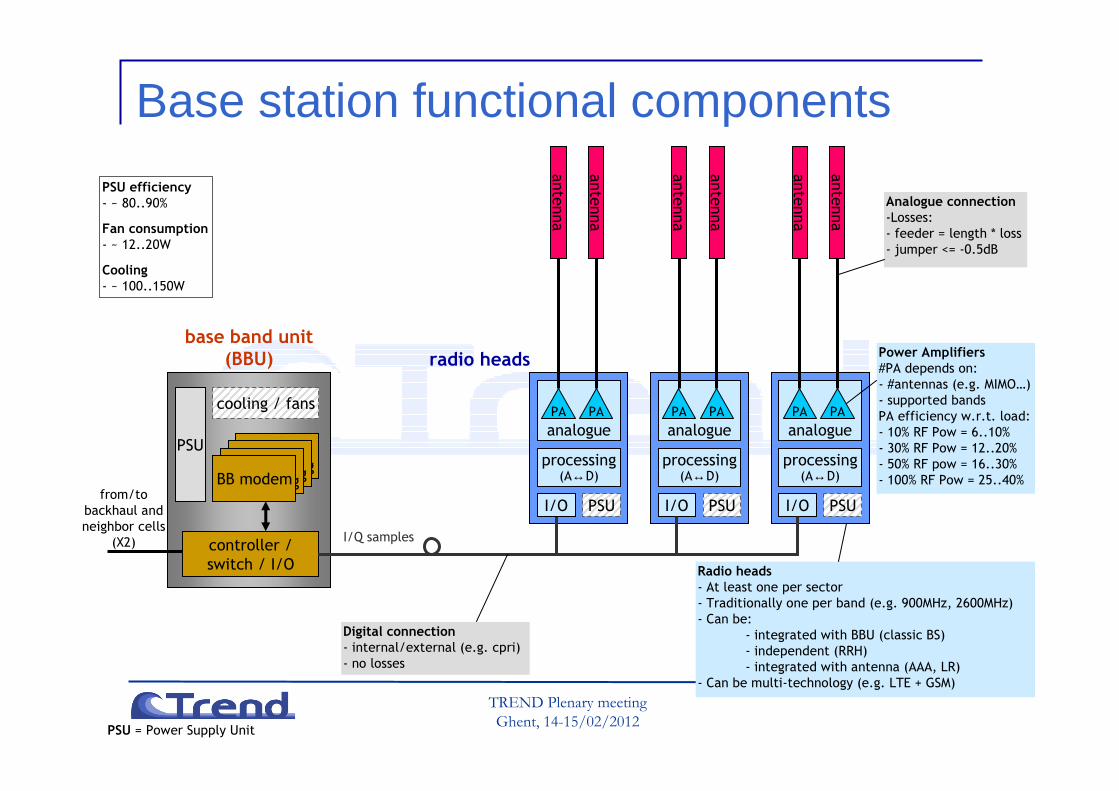
Base station functional components
cooling / fans
antenna
PSU
controller /
switch / I/O
base band unit(BBU)
antenna
antenna
antenna
antenna
antenna
Digital connection- internal/external (e.g. cpri)
- no losses
from/to
backhaul and
neighbor cells
(X2)
processing(A↔D)
PAPA
I/O PSU
analogue
processing(A↔D)
PAPA
I/O PSU
analogue
processing(A↔D)
PAPA
I/O PSU
Radio heads- At least one per sector
- Traditionally one per band (e.g. 900MHz, 2600MHz)
- Can be:
- integrated with BBU (classic BS)
- independent (RRH)
- integrated with antenna (AAA, LR)
- Can be multi-technology (e.g. LTE + GSM)
radio heads
Analogue connection-Losses:
- feeder = length * loss
- jumper <= -0.5dB
Power Amplifiers#PA depends on:
- #antennas (e.g. MIMO…)
- supported bands
PA efficiency w.r.t. load:
- 10% RF Pow = 6..10%
- 30% RF Pow = 12..20%
- 50% RF pow = 16..30%
- 100% RF Pow = 25..40%
PSU = Power Supply Unit
I/Q samples
PSU efficiency- ~ 80..90%
Fan consumption- ~ 12..20W
Cooling- ~ 100..150W
BB signal
processingBB signal
processingBB signal
processingBB modem
TREND Plenary meeting
Ghent, 14-15/02/2012
antenna
antenna
cabinet
BB
modem
cooling / fans
PSU
controller - I/O
RH
antenna
cabinet
BB
modem
cooling / fans
PSU
controller - I/O
RHRH
RH
antenna
cabinet
BB
modem
cooling / fans
PSU
controller - I/O
RH
antenna
RH
antenna
RH
antenna
AAA
AAA
BB
processingBB
processingBBU
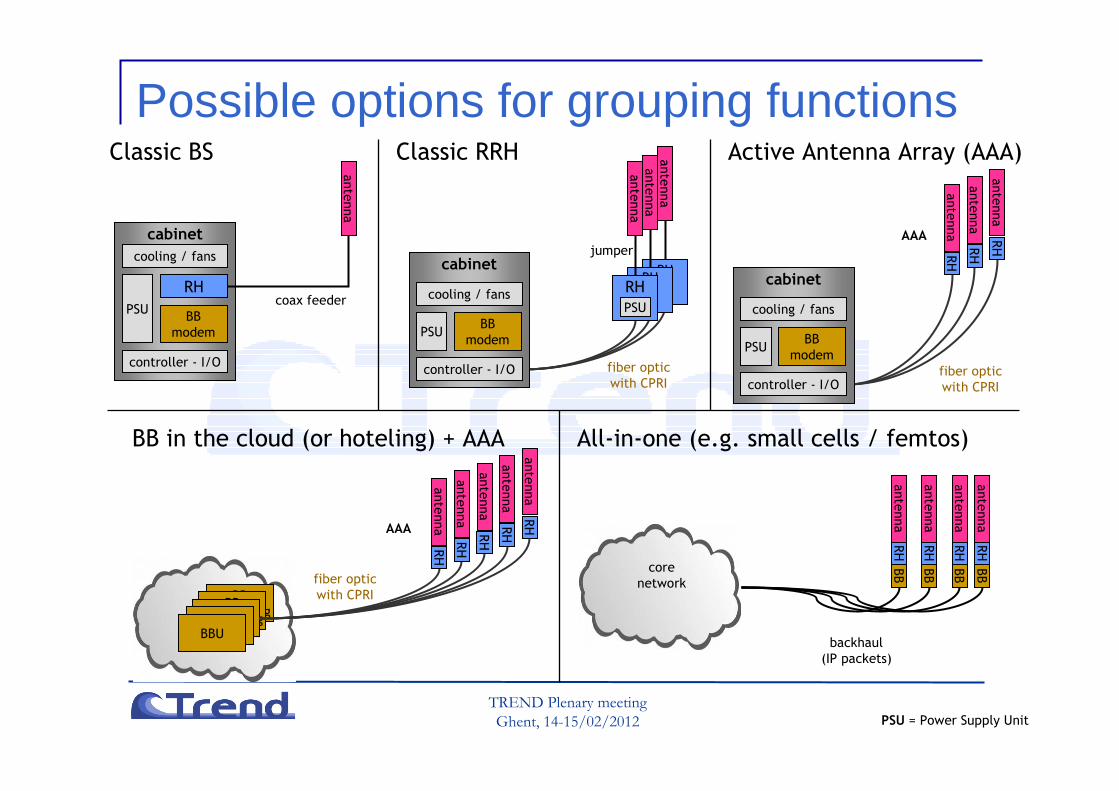
Classic BS Classic RRH Active Antenna Array (AAA)
BB in the cloud (or hoteling) + AAA
RH
antenna
RH
antenna
RH
antenna
All-in-one (e.g. small cells / femtos)
RH
antenna
BB
backhaul
(IP packets)
core
networkfiber optic
with CPRI
fiber optic
with CPRI
fiber optic
with CPRI
coax feeder
RH
antenna
BB
RH
antenna
BB
RH
antenna
BB
BBUBBU
RH
antenna
RH
antenna
jumper
Possible options for grouping functions
PSU = Power Supply Unit
PSU
TREND Plenary meeting
Ghent, 14-15/02/2012
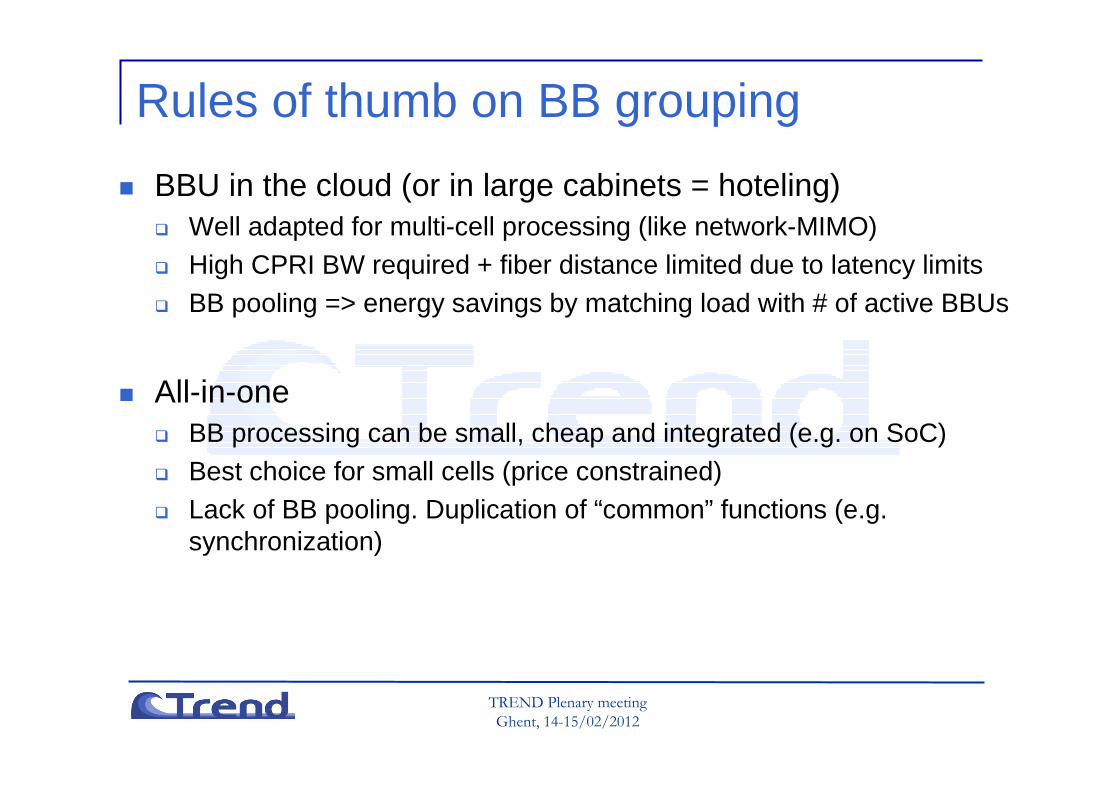
Rules of thumb on BB grouping
� BBU in the cloud (or in large cabinets = hoteling)� Well adapted for multi-cell processing (like network-MIMO)� High CPRI BW required + fiber distance limited due to latency limits� BB pooling => energy savings by matching load with # of active BBUs
� All-in-one� BB processing can be small, cheap and integrated (e.g. on SoC)� Best choice for small cells (price constrained)� Lack of BB pooling. Duplication of “common” functions (e.g.
synchronization)
TREND Plenary meeting
Ghent, 14-15/02/2012
Rough estimation of BB<-->RRH link (LTE)
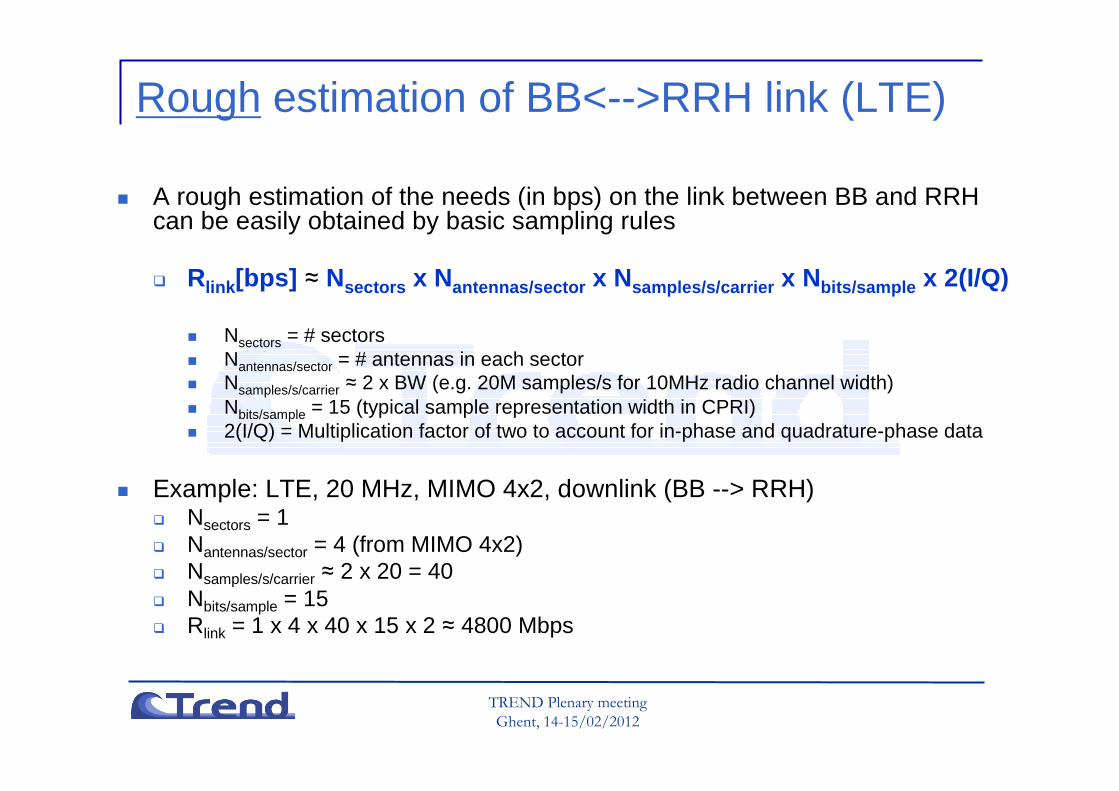
� A rough estimation of the needs (in bps) on the link between BB and RRH can be easily obtained by basic sampling rules
� Rlink[bps] ≈ Nsectors x Nantennas/sector x Nsamples/s/carrier x Nbits/sample x 2(I/Q)
� Nsectors = # sectors� Nantennas/sector = # antennas in each sector� Nsamples/s/carrier ≈ 2 x BW (e.g. 20M samples/s for 10MHz radio channel width)� Nbits/sample = 15 (typical sample representation width in CPRI)� 2(I/Q) = Multiplication factor of two to account for in-phase and quadrature-phase data
� Example: LTE, 20 MHz, MIMO 4x2, downlink (BB --> RRH)� Nsectors = 1� Nantennas/sector = 4 (from MIMO 4x2)� Nsamples/s/carrier ≈ 2 x 20 = 40� Nbits/sample = 15� Rlink = 1 x 4 x 40 x 15 x 2 ≈ 4800 Mbps
TREND Plenary meeting
Ghent, 14-15/02/2012 9
Outline
� BS consumption... why we care?
� Functions, grouping and integration
� Power consumption figures
� Consumption vs. Cell Load
� Possible BS power models
TREND Plenary meeting
Ghent, 14-15/02/2012
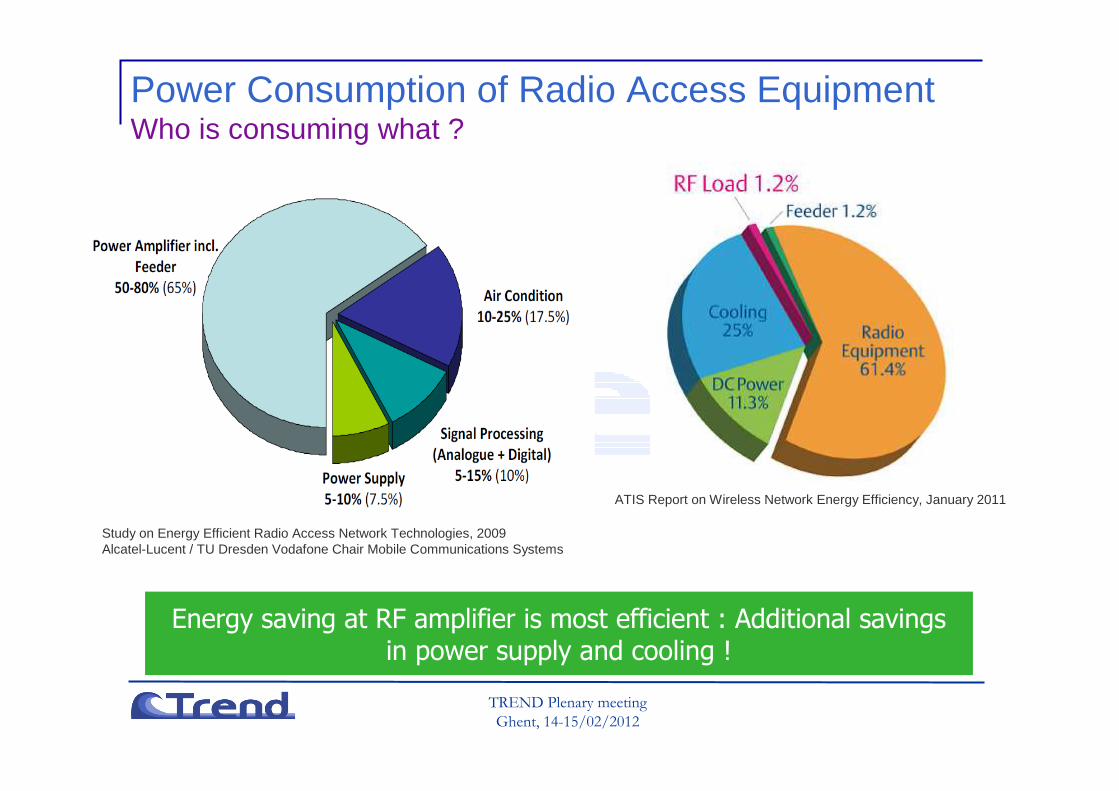
Study on Energy Efficient Radio Access Network Technologies, 2009Alcatel-Lucent / TU Dresden Vodafone Chair Mobile Communications Systems
Energy saving at RF amplifier is most efficient : Additional savings in power supply and cooling !
Power Consumption of Radio Access EquipmentWho is consuming what ?
ATIS Report on Wireless Network Energy Efficiency, January 2011
TREND Plenary meeting
Ghent, 14-15/02/2012
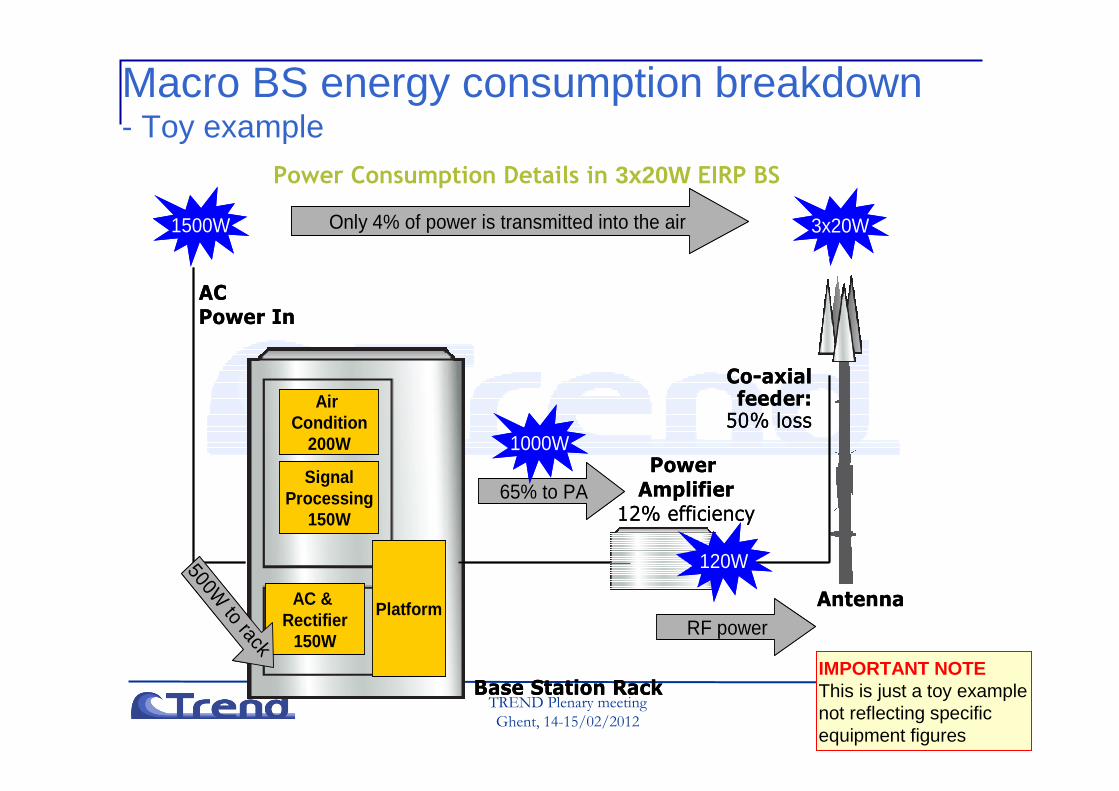
Macro BS energy consumption breakdown- Toy example
Power
Amplifier12% efficiency
Antenna
Base Station Rack
1500W
AC Power In
AC & Rectifier
150W
SignalProcessing
150W
Air Condition
200W
Platform
Only 4% of power is transmitted into the air 3x20W
3x20W
Co-axialfeeder:50% loss
65% to PA
1000W
RF power
120W500W to rack
Power
Amplifier12% efficiency
Antenna
Base Station Rack
1500W
AC Power In
AC & Rectifier
150W
SignalProcessing
150W
Air Condition
200W
Platform
Only 4% of power is transmitted into the air 3x20W
3x20W
Co-axialfeeder:50% loss
65% to PA
1000W
RF power
120W500W to rack
Power Consumption Details in 3x20W EIRP BS
IMPORTANT NOTEThis is just a toy examplenot reflecting specific equipment figures
TREND Plenary meeting
Ghent, 14-15/02/2012 12
Outline
� BS consumption... why we care?
� Functions, grouping and integration
� Power consumption figures
� Consumption vs. Cell Load
� Possible BS power models
TREND Plenary meeting
Ghent, 14-15/02/2012
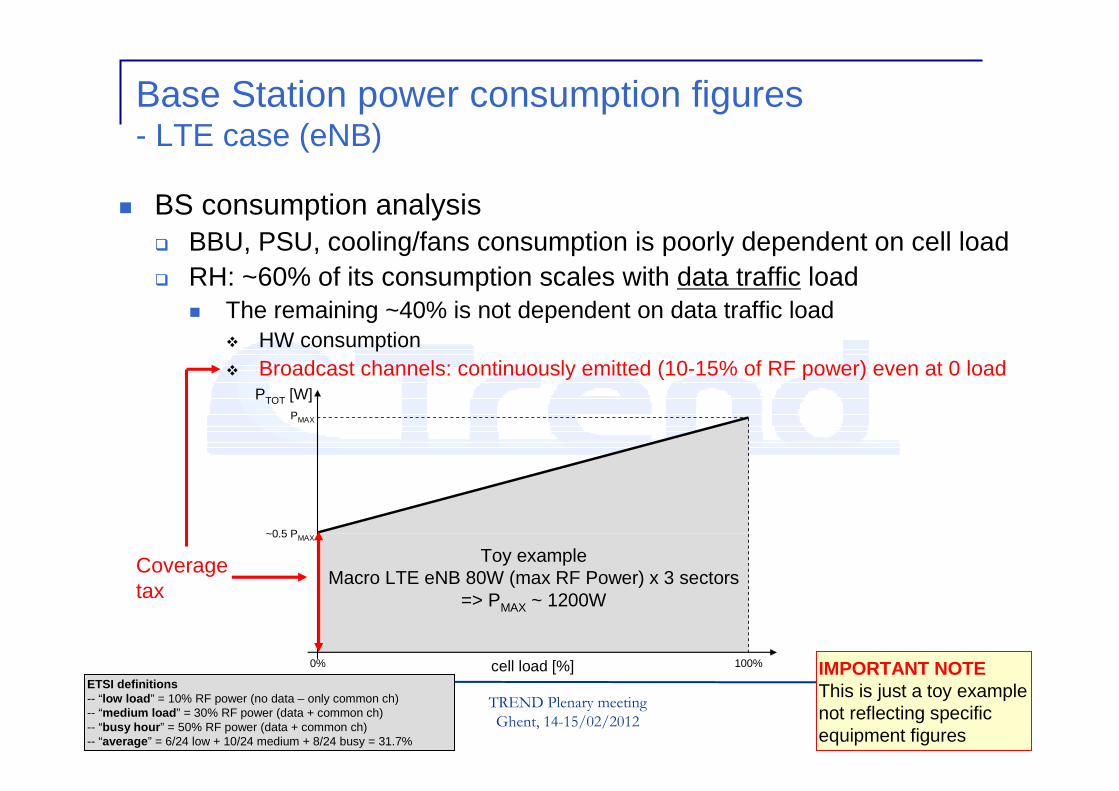
Base Station power consumption figures- LTE case (eNB)
� BS consumption analysis� BBU, PSU, cooling/fans consumption is poorly dependent on cell load� RH: ~60% of its consumption scales with data traffic load
� The remaining ~40% is not dependent on data traffic load� HW consumption � Broadcast channels: continuously emitted (10-15% of RF power) even at 0 load
ETSI definitions -- “low load” = 10% RF power (no data – only common ch)-- “medium load” = 30% RF power (data + common ch)-- “busy hour” = 50% RF power (data + common ch)-- “average” = 6/24 low + 10/24 medium + 8/24 busy = 31.7%
Coveragetax
cell load [%]
PTOT [W]
0% 100%
PMAX
~0.5 PMAX
IMPORTANT NOTEThis is just a toy examplenot reflecting specific equipment figures
Toy exampleMacro LTE eNB 80W (max RF Power) x 3 sectors
=> PMAX ~ 1200W

TREND Plenary meeting
Ghent, 14-15/02/2012
LTE frame structuref
t
……

TREND Plenary meeting
Ghent, 14-15/02/2012
Ideas on BS efficient operational behavior
� A part from hw-efficiency improvements, savings can be obtained through energy efficient operational behavior� Reduce coverage tax
� Rethink broadcast/common channels for minimal emission…� ... without impact on current quality of service
� Reduction of RF power consumed by RH � Different levels of “stand-by” mode, particularly on PAs
� Reduction of BBU consumption� BBU pooling: match load with right amount of BB processing� Turn off some BB process when load is low
� … and by densification (small cells)

TREND Plenary meeting
Ghent, 14-15/02/2012
Ideas to improve BS efficiency- Smaller cells- MIMO/beamforming flavors- Massive antennas…- Pre-coding, IC-alignment…
- Stand-by modes- BCHs “removal”
HW improvements playground
cell load
PTOT [W]

TREND Plenary meeting
Ghent, 14-15/02/2012 17
Outline
� BS consumption... why we care?
� Functions, grouping and integration
� Power consumption figures
� Consumption vs. Cell Load
� Possible BS power models

TREND Plenary meeting
Ghent, 14-15/02/2012
BS power models
� Basic model
� A bit more advanced…
)(100
loadcelltheis
PPP dataTOT
ααα
≤≤⋅+=
SectorRFSectorsBBTOT PNPP _⋅+=
SectorRFTOTSectorRFTOTSectorRF PBPAP _____ ⋅⋅+⋅= αcoverage tax data transmission
1=+ BA (e.g. A = B = 50%)