Embed Size (px)
Citation preview

12/04/2018
1
Lecture 9Survey Research & Design in Psychology
James Neill, 2018Creative Commons Attribution 4.0
Power, Effect Sizes, Confidence Intervals, &
Academic Integrity
2
1Significance testing
2 Inferential decision making
3Statistical power
4Effect size
5Confidence intervals
6Publication bias
7Academic integrity
8Statistical method guidelines
Overview
3
1. Howitt & Cramer (2014)● Ch 35: The size of effects in statistical analysis:
Do my findings matter?
● Ch 36: Meta-analysis: Combining and exploring
statistical findings from previous research
● Ch 38: Confidence intervals
● Ch 40: Statistical power
2.Wilkinson, L., & APA Task Force on Statistical
Inference. (1999). Statistical methods in
psychology journals: Guidelines and explanations. American Psychologist, 54, 594-604.
Readings

12/04/2018
2
Significance
testing
5
• Logic• History• Criticisms• Decisions• Practical significance
Significance testing:
Overview
How many heads
in a row would
I need to throw
before you'd protest
that something
“wasn't right”?
Logic of significance testing

12/04/2018
3
Based on the statistical properties of
sample data, we can extrapolate
(guesstimate) about the probability of
the observed differences or
relationships occurring in the target
population. In so doing, we are
assuming that the sample data is
representative and that the data
meets the assumptions associated
with the inferential test.
Logic of significance testing
8
• Null hypothesis (H0) usually reflects an expected effect in the target population (or no effect)
• Obtain p-value from sample data to determine the likelihood of H0 being true in the target population
• Researcher tolerates some false positives (critical α) to make a probability-based decision about H0
Logic of significance testing
9
• Developed by Ronald
Fisher (1920s-1930s)
• To determine which
agricultural methods
yielded greater output
• Were variations in output
between two plots
attributable to chance or
not?
History of significance testing

12/04/2018
4
10
• Agricultural research designs
couldn’t be fully experimental
because natural variations such
as weather and soil quality
couldn't be fully controlled.
• Therefore, it was needed to
determine whether variations in
the DV were due to the IV(s) or
to chance.
History of significance testing
11
• ST spread to other fields, including
social sciences.
• Spread was aided by the
development of computers and
training.
• ST became widely used during the
2nd half of the 20th century.
• So widely used that, in the latter 20th
century, ST attracted critique for its
over-use and misuse.
History of significance testing
12
• Critiqued as early as 1930.
• Cohen's (1980s-1990s) critique
helped a critical mass of
awareness to develop.
• Led to changes in publication
guidelines and teaching about
over-reliance on ST and alternative
and adjunct techniques.
Criticisms of significance testing

12/04/2018
5
13
1. The null hypothesis is rarely true.
2. ST provides:● a binary decision (yes or no) and
● direction of the effect
But mostly we are interested in the
size of the effect – i.e., how much
of an effect?
3.Statistical vs. practical significance
4.Sig. is a function of ES, N, and α
Criticisms of significance testing
14
• Statistical significance simply
means that the observed effect
(relationship or differences) are
unlikely to be due to sampling error
• Statistical significance can be
evident for very small (trivial)
effects if N and/or critical alpha are
large enough
Criticisms of significance testing
15
• Practical significance is about
whether the difference is large
enough to be of value in a real
world sense:–Is an effect worth being concerned
about?
–Is the effect noticeable or
worthwhile?–e.g., a 5% increase in well-being probably
starts to have practical value
Practical significance

12/04/2018
6
Ziliak, S. T. &
McCloskey, D. N.
(2008). The cult of
statistical significance:
How the standard error
cost us jobs, justice, and
lives. Ann Arbor:
University of Michigan
Press.
Criticisms of
significance testing
Kirk, R. E. (2001). Promoting good statistical practices: Some Suggestions.
Educational and Psychological Measurement, 61, 213-218. doi:
10.1177/00131640121971185
Criticisms of significance testing
Meehl, P. E. (1978). Theoretical risks and tabular asterisks: Sir Karl, Sir
Ronald, and the slow progress of soft psychology. Journal of Consulting and
Clinical Psychology, 46, 806-834.
Criticisms of significance testing

12/04/2018
7
Criticisms of Significance
Testing
Gill, J. (1999). The insignificance of null hypothesis significance testing. Political Research Quarterly, 52, 647-674.
The insignificance of NHST
20
• APA 5th edition (2001)
recommended reporting of ESs,
power, etc.
• APA 6th edition (2009) further
strengthened the requirements to
use NHST as a starting point and to
also include ESs, CIs, and power.
APA publication manual
recommendations about effect sizes, CIs and power
21
“Historically, researchers in psychology have
relied heavily on null hypothesis significance
testing (NHST) as a starting point for many (but
not all) of its analytic approaches. APA stresses
that NHST is but a starting point and that
additional reporting such as effect sizes,
confidence intervals, and extensive description are needed to convey the most
complete meaning of the results... complete
reporting of all tested hypotheses and estimates
of appropriate ESs and CIs are the minimum
expectations for all APA journals.” [my italics]
(APA Publication Manual (6th ed., 2009, p. 33))
Significance testing alternatives

12/04/2018
8
22
(Wasserstein & Lazar, 2016)
1. P-values can indicate how incompatible the data are with a
specified statistical model.
2. P-values do not measure the probability that the studied hypothesis is true, or the probability that the data were
produced by random chance alone.3. Scientific conclusions and business or policy decisions
should not be based only on whether a p-value passes a
specific threshold.4. Proper inference requires full reporting and transparency.
5. A p-value, or statistical significance, does not measure the size of an effect or the importance of a result.
6. By itself, a p-value does not provide a good measure of evidence regarding a model or hypothesis.
American Statistical Association Statement
on Significance Testing and p-Values
23
• Use traditional NHST (Fisherian
logic / inferential testing)
• Also use complementary
techniques (ESs and CIs)
• Emphasise practical significance
• Recognise merits and
shortcomings of each approach
Significance testing:
Recommendations
24
• Logic:– Examine sample data to determine p that it
represents a population with no effect (or
some effect). It's a “bet” - At what point do
you reject H0?
• History: – Developed by Fisher for agricultural
experiments in early 20th century
– During the 1980s and 1990s, ST was
increasingly criticised for over-use and
mis-application.
Significance testing: Summary

12/04/2018
9
25
• Criticisms:– Binary
– Depends on N, ES, and critical
alpha
– Need practical significance
• Recommendations: –Wherever you report a significance
test (p-level), also report an ES
–Also consider reporting power and
CIs
Significance testing: Summary
Inferential
decision
making
27
Null Hypothesis (H0): No differences / No relationship
Alternative Hypothesis (H1): Differences / Relationship
Hypotheses in inferential testing

12/04/2018
10
28
In inferential testing, a conclusion
about a target population is made
based on sample data. Either:
Do not reject H0p is not significant
(i.e., not below the critical α)
Reject H0p is significant
(i.e., below the critical α)
Inferential decisions
29
We hope to make a correct
inference based on the sample
data; i.e., either:
Do not reject H0:Correctly retain H0 (i.e., when there is no real
difference/effect in the population)
Reject H0 (Power):Correctly reject H0 (i.e., when there is a real
difference/effect in the population)
Inferential decisions:
Correct
30
However, we risk making these
errors:
Type I error:Incorrectly reject H0 (i.e., there is no difference/effect in the population)
Type II error:Incorrectly fail to reject H0 (i.e., there is a
difference/effect in the population)
Inferential decisions:
Type I and Type II errors

12/04/2018
11
Inferential decision making table
32
• Correct acceptance of H0
• Correct rejection of H0 (Power) = 1- β
• False rejection of H0 (Type I error) = α
• False acceptance of H0 (Type II error) =
β
• Traditionally, emphasis has been:
○ too much on limiting Type I errors and
○ not enough on limiting Type II error
○ balance is needed
Inferential decision making:
Summary
Statistical
power

12/04/2018
12
34
Statistical power is the:
• probability of correctly rejecting a false H0(i.e. getting a sig. result when there is a
real difference in the population)
Image source: https://commons.wikimedia.org/wiki/File:Emoji_u1f4aa.svg
Statistical power
Statistical power
36
• Desirable power > .80
• Typical power ~ .60
(in the social sciences) • Power becomes higher when any of
these increase: –Sample size (N)
–Critical alpha (α)
–Effect size (∆)
Statistical power

12/04/2018
13
37
• Ideally, calculate expected power
before conducting a study (a priori),
based on:–Estimated N,
–Critical α,
–Expected or minimum ES
(e.g., from related research)
• Report actual power (post-hoc) in
the results.
Power analysis
38
• Free, online post-hoc power
calculator for MLR• http://www.danielsoper.com/statcalc3/calc.aspx?id=9
Power analysis for MLR
39
1. Power = probability of detecting a real
effect as statistically significant
2. Increase by:–↑ N
–↑ critical α
–↑ ES
• Power– > .8 “desirable”
– ~ .6 is more typical• Can be calculated prospectively and
retrospectively
Summary: Statistical power

12/04/2018
14
Effect
sizes
41
• A measure of the strength (or
size) of a relationship or effect.
• Where p is reported, also present
an effect size.
• "reporting and interpreting effect
sizes in the context of previously
reported effects is essential to
good research"(Wilkinson & APA Task Force on Statistical
Inference, 1999, p. 599)
What is an effect size?
42
• An inferential test may be statistically
significant (i.e., the result is unlikely to
have occurred by chance), but this
doesn’t indicate how large the effect is
(the effect might be trivial).
• On the other hand, there may be non-
significant, but notable effects (esp. in
low powered tests).
• Unlike significance testing, effect sizes
are not influenced by N.
Why use an effect size?

12/04/2018
15
43
Correlational• r, r2, sr2
• R, R2
Mean differences• Standardised mean
difference e.g., Cohen’s d• Eta squared (η2),
Partial eta squared (ηp2)
Commonly used effect sizes
44
The difference between two means in
standard deviation units:
● -ve = negative difference
● 0 = no difference
● +ve = positive difference
Standardised mean difference
45
• A standardised measure of the
difference between two Ms
–d = M2 – M1 / σ
–d = M2 – M1 / pooled SD
• e.g., Cohen's d, Hedges' g
• Not readily available in SPSS;
use a separate calculator e.g.,https://www.danielsoper.com/statcalc/calculator.aspx?id=4
8
Standardised mean difference

12/04/2018
16
Group 1
Group 2
Example effect sizes
Image source: http://elderlab.yorku.ca/~elder/teaching/psyc6130/lectures/06%20Power%20and%20Effect%20Size/06%20Power%20and%20Effect%20Size.ppt
47
• No agreed standards
• Ultimately subjective
• Best approach is to compare with
other similar studies
Interpreting effect size
48
• A small ES can be impressive if, e.g., a variable is:– difficult to change
(e.g. a personality construct) and/or– very valuable
(e.g. life expectancy)
• A large ES doesn’t necessarily mean that there is any practical value e.g., if – it isn’t related to the aims of the
investigation (e.g. religious orientation)
The meaning of an effect size
depends on context

12/04/2018
17
49
• Cohen (1977): .2 = small
.5 = moderate
.8 = large
• Wolf (1986): .25 = educationally
significant
.50 = practically significant
(therapeutic)
Standardised Mean ESs are proportional,
Rules of thumb for interpreting
standardised mean differences
Standardised mean effect size -
Graphing
Standardised mean effect size -
Table

12/04/2018
18
52
Ward (2002) examined articles in 3
psych. journals to assess the use of
statistical power and effect size
measures.• Journal of Personality and Social Psychology
• Journal of Consulting and Clinical Psychology
• Journal of Abnormal Psychology
Power and effect sizes
in psychology
53
• 7% of studies estimated or discuss
statistical power.
• 30% provided ESs.
• Average ES was medium
• Current research designs typically do
not have sufficient power to detect
medium ESs.
Power and effect sizes
in psychology
54
1.ES = Standardised difference or
strength of relationship
2. Inferential tests should be
accompanied by ESs and CIs
3. Common bivariate ESs include:1. Cohen’s d
2. Correlation r
• Cohen’s d - not in SPSS - use an
effect size calculator
Summary: Effect size

12/04/2018
19
Confidence
intervals
56
• Very useful, underutilised
• Gives “range of certainty” or “area of
confidence” e.g., a population M is 95% likely to be
between -1.96 and +1.96 SD of the sample M
• Expressed as a:
–Lower-limit
–Upper-limit
Confidence intervals
57
• CIs can be reported for:–B (unstandardised regression
coefficient) in MLR
–Ms
–ESs (e.g., r, R, d)
• CIs can be examined
statistically and graphically
(e.g., error-bar graphs)
Confidence intervals
12/04/2018
20
● CIs can be presented as error bar graphs● Shows the mean and upper and lower CIs
● More informative alternative to bar graphs or line graphs
Confidence intervals
and error bar graphs
● In this example, CIs for Bs indicate that we
should not reject the possibility that the
population Bs are zero, except for
Attentiveness (we are 95% sure that the true
B for Attentiveness is between .91 and 2.16)
Confidence intervals
in MLR
60
QuestionIf a MLR predictor has a B = .5, with a 95% CI of .25 to .75, what should be concluded?a) Do not reject H0 (that B = 0)b) Reject H0 (that B = 0)
Confidence intervals:
Practice question 1

12/04/2018
21
61
QuestionIf a MLR predictor has a B = .2, with a 95% CI of -.2 to .6, what should be concluded?a) Do not reject H0 (that B = 0)b) Reject H0 (that B = 0)
Confidence intervals:
Practice question 2
62
1. Gives “range of certainty” when
generalising from a sample to a
target population
2. CIs be used for M, B, ES
3. Can be examined1. Statistically (upper and lower limits)
2. Graphically (e.g., error-bar graphs)
Summary: Confidence intervals
Publication
bias

12/04/2018
22
64
• When the likelihood of publication of
depends on their nature and direction
of results.
• Significant effects are more
likely to be published!
• Type I publication errors are
underestimated to an extent that is: “frightening, even calling into question the
scientific basis for much published literature.”
(Greenwald, 1975, p. 15)
Publication bias
Image source: https://commons.wikimedia.org/wiki/File:SMirC-shock.svg
65
• Tendency for non-significant
results to be “filed away” (hidden)
and not published.
• # of null studies which would have
to “filed away” in order for a body
of significant published effects to
be considered doubtful.
Image source: http://commons.wikimedia.org/wiki/File:Edge-drawer.png
File-drawer effect
66
Two counteracting biases in social
science research:
• Low Power:
→ under-estimation of real effects
• Publication Bias or File-drawer effect:→ over-estimation of real effects
Two counteracting biases

12/04/2018
23
67
• Scatterplot of treatment effect against
study size.
• Precision in estimating the true
treatment effect ↑s as N ↑s.
• Small N studies scatter more widely at
the bottom of the graph (less
precision).
• In the absence of publication bias the
plot should resemble a symmetrical
inverted funnel.
Funnel plots
No
evidence
of
publication
bias
Standard error
decreases as sample size
increases
Effect size
Funnel plots
Symmetrical
distribution
Publication Bias
Missing
non-sig. result
studies
Asymmetrical appearance of the funnel plot with a gap in a bottom corner of the funnel plot
As studies
become less
precise, results
should be more
variable,
scattered to both
sides of the more
precise larger
studies … unless
there is
publication bias.
Publication bias:

12/04/2018
24
70
• If there is publication bias this will cause meta-analysis to overestimate effects.
• The more pronounced the funnel plot asymmetry, the more likely it is that the amount of bias will be substantial.
Publication bias
http://www.jasnh.com
Countering the bias
http://www.jnr-eeb.org/index.php/jnr
Countering the bias

12/04/2018
25
73
1. Tendency for statistically significant
studies to be published over non-
significant studies
2. Indicated by gap in funnel plot →
file-drawer effect
3. Counteracting biases in scientific
publishing; tendency: – towards low-power studies which
underestimate effects
– to publish sig. effects over non-sig. effects
Summary: Publication bias
Academic
integrity
75
(Marsden, Carroll, & Neill, 2005)
• Students enrolled in 12
faculties of 4 Australian
universities (N = 954)
• Self-reported:–Plagiarism (81%)
–Cheating (41%)
–Falsification (25%)
Academic integrity: Students

12/04/2018
26
https://retractionwatch.com/
Retraction watch
Tracking retractions
as a window
into the scientific process
Academic integrity: Academic staff -
Examplehttp://www.abc.net.au/news/2014-04-17/research-investigations-mounting-for-embattled-professor/5397516
http://www.abc.net.au/7.30/content/2013/s3823977.htm
Academic integrity: Academic staff
12/04/2018
27
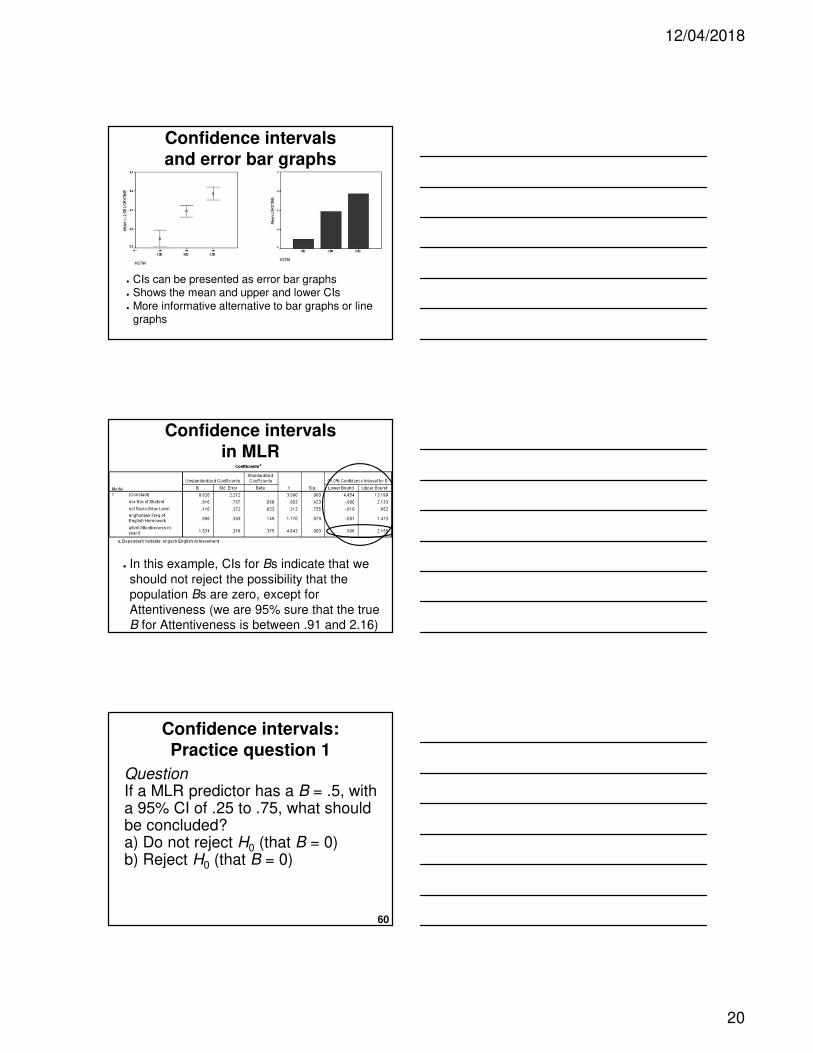
Academic Integrity: Academic staff -
Examplehttp://www.abc.net.au/news/2014-04-04/uq-research-retraction-barwood-murdoch/5368800
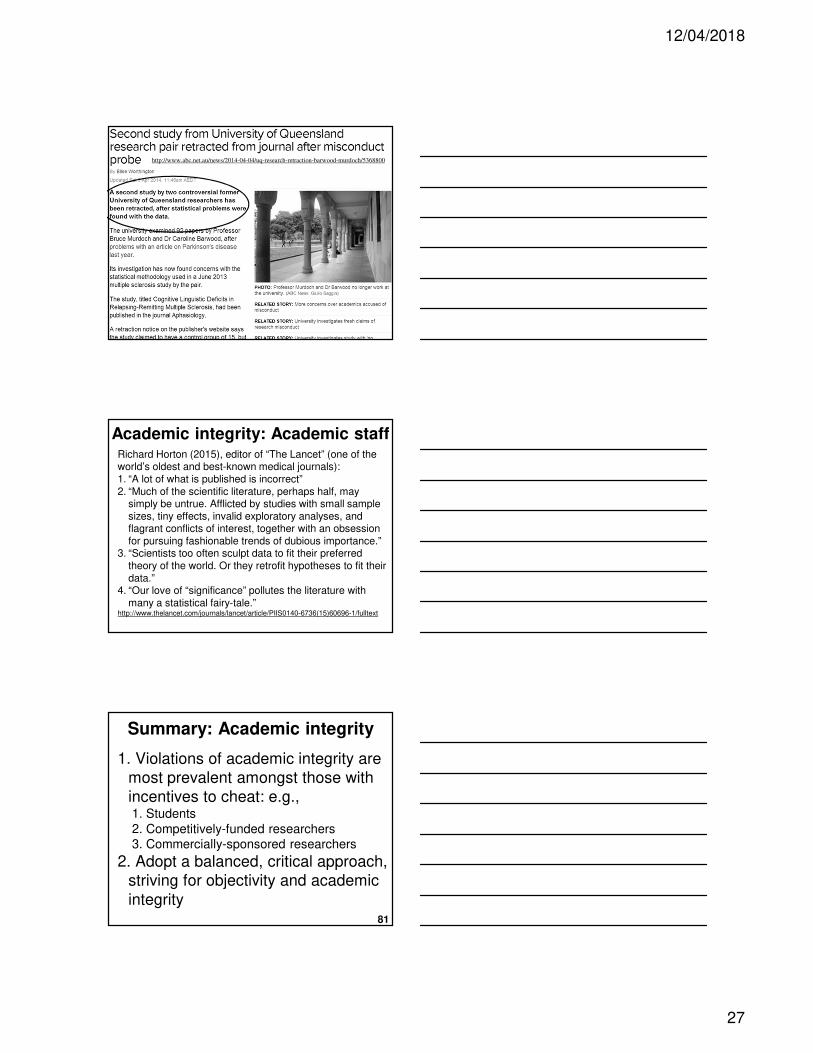
Richard Horton (2015), editor of “The Lancet” (one of the world’s oldest and best-known medical journals):
1. “A lot of what is published is incorrect”
2. “Much of the scientific literature, perhaps half, may simply be untrue. Afflicted by studies with small sample
sizes, tiny effects, invalid exploratory analyses, and flagrant conflicts of interest, together with an obsession
for pursuing fashionable trends of dubious importance.” 3. “Scientists too often sculpt data to fit their preferred
theory of the world. Or they retrofit hypotheses to fit their
data.” 4. “Our love of “significance” pollutes the literature with
many a statistical fairy-tale.”http://www.thelancet.com/journals/lancet/article/PIIS0140-6736(15)60696-1/fulltext
Academic integrity: Academic staff
81
1. Violations of academic integrity are
most prevalent amongst those with
incentives to cheat: e.g.,1. Students
2. Competitively-funded researchers
3. Commercially-sponsored researchers
2. Adopt a balanced, critical approach,
striving for objectivity and academic
integrity
Summary: Academic integrity

12/04/2018
28
(Wilkinson, 1999)
Statistical Methods in Psychology
Journals: Guidelines andExplanations
https://www.apa.org/pubs/journals/releases/amp-54-8-594.pdf
Provides useful tips for good scientific
writing e.g., for lab reports
(Wilkinson, 1999)
Method - Design
(Wilkinson, 1999)
Method - Population
12/04/2018
29
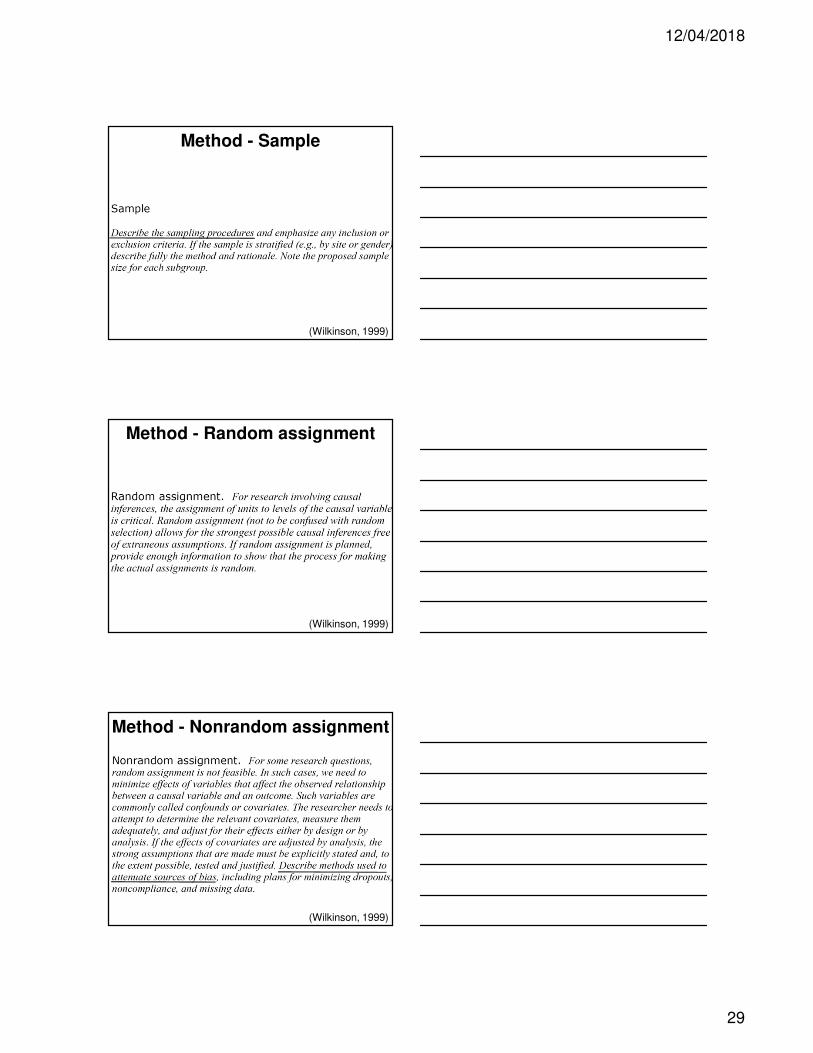
(Wilkinson, 1999)
Method - Sample
(Wilkinson, 1999)
Method - Random assignment
(Wilkinson, 1999)
Method - Nonrandom assignment

12/04/2018
30
(Wilkinson, 1999)
Method - Instruments
(Wilkinson, 1999)
Method - Variables
(Wilkinson, 1999)
Method - Procedure

12/04/2018
31
(Wilkinson, 1999)
Method - Power and sample size
(Wilkinson, 1999)
Results - Complications
(Wilkinson, 1999)
Results - Min. sufficient analysis
law of parsimony = all other things being
equal, the simplest solution is the best

12/04/2018
32
(Wilkinson, 1999)
Results - Use of software
(Wilkinson, 1999)
Results - Assumptions
(Wilkinson, 1999)
Results - Hypothesis testing
12/04/2018
33
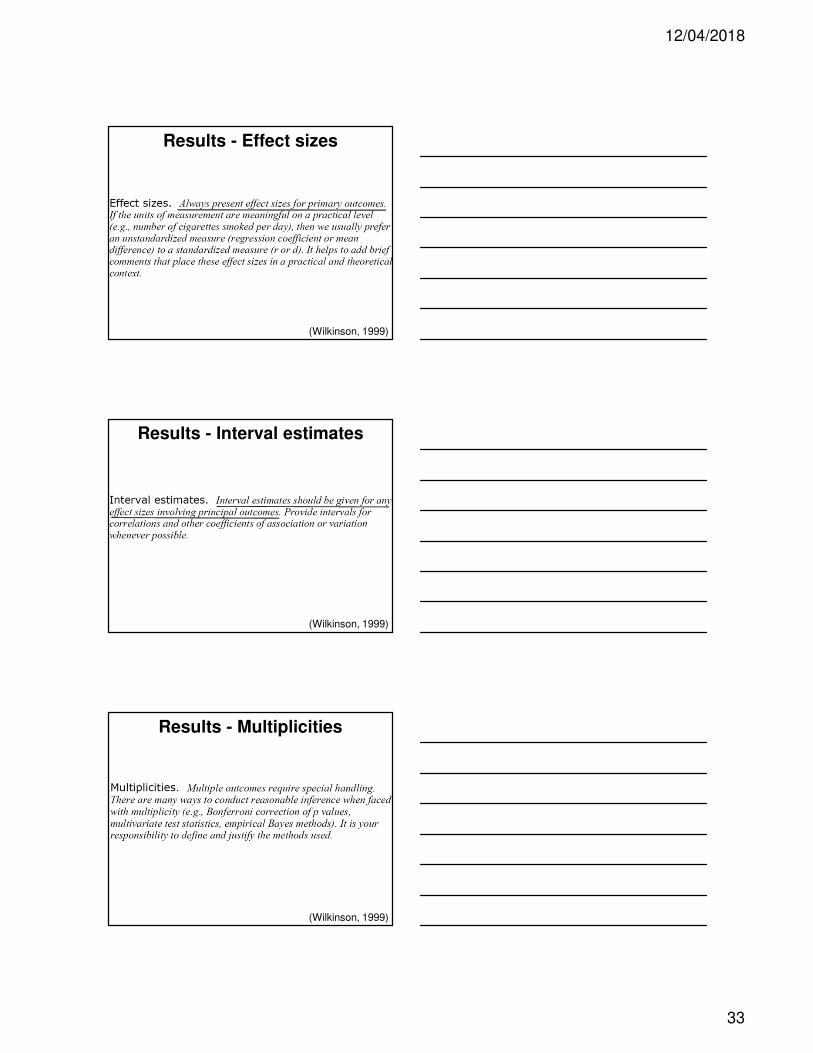
(Wilkinson, 1999)
Results - Effect sizes
(Wilkinson, 1999)
Results - Interval estimates
(Wilkinson, 1999)
Results - Multiplicities

12/04/2018
34
(Wilkinson, 1999)
Results - Causality
(Wilkinson, 1999)
Results - Tables and figures
(Wilkinson, 1999)
Discussion - Interpretation
12/04/2018
35
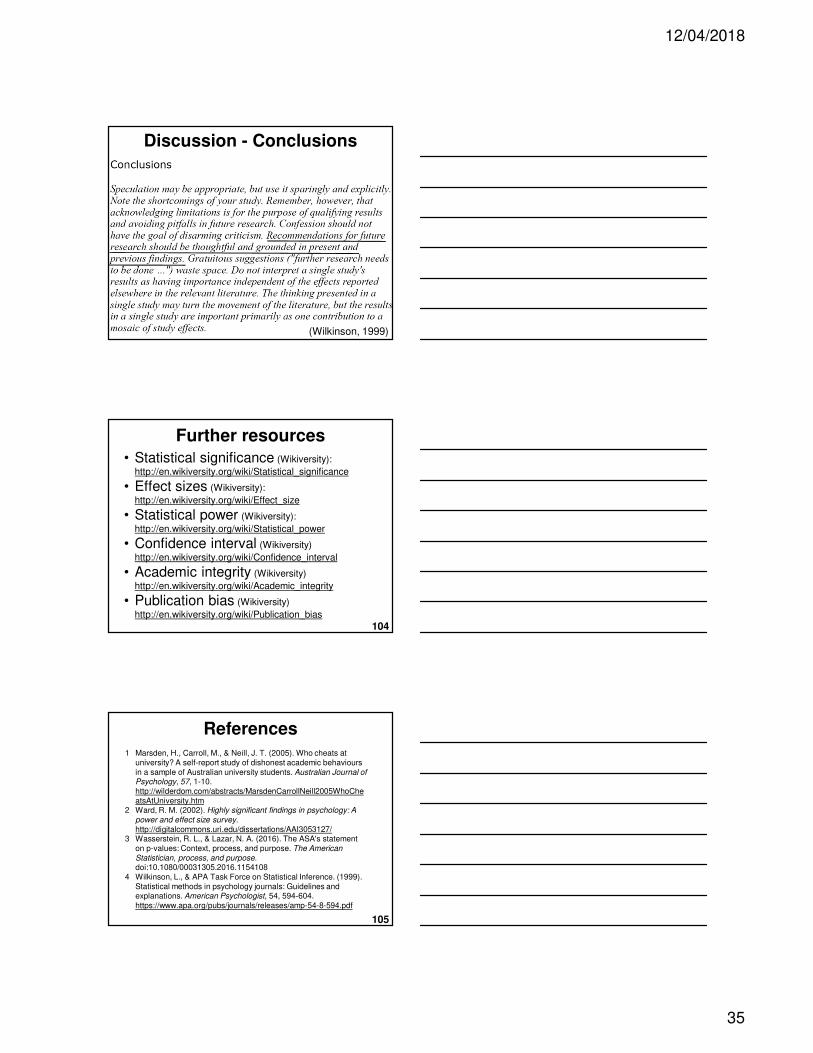
(Wilkinson, 1999)
Discussion - Conclusions
104
• Statistical significance (Wikiversity):
http://en.wikiversity.org/wiki/Statistical_significance
• Effect sizes (Wikiversity):
http://en.wikiversity.org/wiki/Effect_size
• Statistical power (Wikiversity):
http://en.wikiversity.org/wiki/Statistical_power
• Confidence interval (Wikiversity)
http://en.wikiversity.org/wiki/Confidence_interval
• Academic integrity (Wikiversity)
http://en.wikiversity.org/wiki/Academic_integrity
• Publication bias (Wikiversity)
http://en.wikiversity.org/wiki/Publication_bias
Further resources
105
1 Marsden, H., Carroll, M., & Neill, J. T. (2005). Who cheats at
university? A self-report study of dishonest academic behaviours
in a sample of Australian university students. Australian Journal of Psychology, 57, 1-10.
http://wilderdom.com/abstracts/MarsdenCarrollNeill2005WhoChe
atsAtUniversity.htm2 Ward, R. M. (2002). Highly significant findings in psychology: A
power and effect size survey.
http://digitalcommons.uri.edu/dissertations/AAI3053127/3 Wasserstein, R. L., & Lazar, N. A. (2016). The ASA's statement
on p-values: Context, process, and purpose. The American
Statistician, process, and purpose. doi:10.1080/00031305.2016.1154108
4 Wilkinson, L., & APA Task Force on Statistical Inference. (1999).
Statistical methods in psychology journals: Guidelines and explanations. American Psychologist, 54, 594-604.
https://www.apa.org/pubs/journals/releases/amp-54-8-594.pdf
References

12/04/2018
36
106
Summary and conclusion• Recap of previous 9 lectures
• Review of learning outcomes
Next lecture