Embed Size (px)
Citation preview

POWER GENERATION FROM AUTOMOBILE SHREDDER WASTE FUEL: CHARACTERIZATION
AND SYSTEM FEASIBILITY
MARC R. WOLMAN WILLIAM S. HUBBLE
IVAN G. MOST EnerGroup, Inc., Portland, Maine
ABSTRACf
Rising costs and scarcity of sites are driving ferrous scrap shredder operators to seek alternatives to landfill waste disposal. A resource recovery concept is presented, whereby the light fraction of shredder residue (fluff) is used as a fuel to generate electric power and steam for on-site use or commodity sale.
A database generated from the shredding industry includes facility processing capacities, waste generation rates and disposal costs, energy usage and costs. The waste was characterized by physical and chemical analysis, and test burn in a rotary kiln incinerator.
Several conceptual energy recovery and conversion systems are structured. Capital and operating costs are calculated for plants with varying sizes and configurations. The projected economic returns vary with scale, local disposal costs, electric power rates and availability of a steam customer.
INTRODUCfION
The steel shredding industry processes discarded cars, appliances and other predominantly steel objects to produce fragmented steel for resale as a feedstock for steel making. Shredding provides important economic and environmental benefits as an alternative to
91
STUART L. NATOF u.S. Department of Energy
Office of Industrial Programs, Conservation Washington, D.C.
other scrap processing methods. Nonetheless, shredding produces a waste stream for which no alternative to landfill disposal is practiced.
This waste stream, termed "fluff," consists mainly of the nonmetallic portion of automobiles. Excluding tires, batteries, and radiators which are customarily removed prior to shredding, fluff is generated from interior plastic trim, upholstery fabric and filler, insulation, and padding. From a distance, fluff appears to be a homogeneous mass of brown, oily fibers. Upon closer examination, it is seen to include pieces of aluminum, rubber, paper, hard plastic, vinyl, glass, and plated metals from the scrap, as well as rocks and dirt, depending on scrap handling practices.
Fluff has been shown [ 1] to be a nonhazardous waste. Many landfills are no longer accepting fluff. The possibility of de facto prohibitions on landfilling and rising disposal costs everywhere are driving shredder operators to seek alternatives.
This paper reports on an investigation funded by the United States Department of Energy, Office of Industrial Programs, Contract No. DE-AC07-84ID12551, to develop a viable process to utilize the energy content of fluff. It is estimated that this material will represent a gross potential fuel value of 0.06 quads (0.07 X 10¹⁸ J) from U.S. sources in 1995.
In evaluating the feasibility of using fluff as an energy source, the following areas are addressed:
(a) shredding industry in the u.s.: equipment, material flows, fluff disposal problem
(b) fluff as a waste fuel: physical and chemical properties; combustion technology
(c) fluff-to-energy systems: test burn, conceptual installations, cost estimates
(d) economic feasibility analysis
SHREDDING INDUSTRY
The Metal Scrap Research and Education Foundation (the research foundation of the Institute of Scrap Iron and Steel, a scrap processing trade organization) is an official participant in the project. As a result of their efforts, the authors obtained information on 50 shredding facilities, out of nearly 200 currently operating in the United States.
Until the late 1950's, there was no fluff. While a market does exist for uncleaned automotive scrap, processors are paid a premium for scrap with nonmetals and undesired metals removed. Historically, this was accomplished by open burning whole auto hulks or hand dismantling. With the advent of prohibitions on open burning of solid wastes, some processors developed incinerators with the capacity to burn the combustibles out of one or more automobiles, and direct smoke through an afterburner to complete combustion. Energy costs of the method were prohibitively high and air pollution control inadequate. The shredding process was adopted for obsolete scrap in order to remove nonmetallics automatically, without requiring combustion.
Shredding systems are used to process waste automobiles, white goods and miscellaneous "light iron" (waste objects containing sheet and light structural steel) into: (a) fragmented steel; (b) nonferrous metals and other high density material; and (c) low density material or "flufr'. The general process is described below [2].
Equipment
A crane or conveyor feeds individual waste objects to a grate-discharge hammermill-type shredder. Shaft horsepower is provided by electric motor or internal combustion engine. Shredder power requirement ranges from 1000 hp (750 kW) to 6000 hp (4470 kW) depending on processing capacity.
Following discharge from the mill, fist-sized pieces of shredded waste are conveyed through a cleaning and sorting system. Ferrous metals are collected by magnetic separation. Fluff is collected by cyclone air
92
classifiers or fluid washing. The number and sequence of separation processes varies, depending on what the particular operator wants to recover.
Energy Use
In addition to shredder shaft power requirements, shredder systems use numerous electric motors for material handling and air moving. A single pneumatic fluff cleaning station may require in excess of 200 hp (150 kW) for blower and cyclone suction fans. Combined auxiliary power requirements may be as high as 1000 hp (750 kW).
Most shredder systems are all-electric, purchasing power from the local utility. Due to the intermittent surges in shredder load coinciding with feeding car hulks, etc., to the mill, these operations incur significant demand charges. Some larger operators already spend more than half a million dollars per year on electric power.
The few operators which drive shredders with diesel or natural gas fired internal combustion engines are relatively insulated from electricity cost increases. They are not, however, immune to potential dramatic increases in fuel prices.
Material Flows
Each facility is different. Variations in raw material content (autos vs other), shredder grate spacing, and number, type, and arrangement of cleaning processes result in varied relative weight percentages (steel vs fluff vs nonferrous) and by-product compositions.
"Nonferrous," defined as the high density fraction not separated magnetically, contains between 20% and 80% by weight recoverable nonferrous metal. The remainder is a mixture of glass, rubber, dense plastics, stones, fines, ferrous metal, and "fluff" (see below).
"Fluff," defined as the low density fraction not separated magnetically, contains plastic and textile fabrics, foam and fiber insulation and padding. These combustible materials occupy most of fluWs bulk volume, but average only 47% by weight. They are mixed with fragments and fines of ferrous metal, and "nonferrous" (see above). These noncombustibles are the principal source of the ash generated by burning fluff.
Of the three major shredder feed stocks, autos have the highest weight percentage of noftmetallic content, followed by white goods, and light iron. Therefore, fluff generated per ton of shredder feed varies according to the mix of feed material processed. Shredders processing in excess of 90% by weight autos yield approx-
imately 78% ferrous metal, 2% nonferrous and heavy nonmetallic, and 20% fluff by weight.
There are nearly 200 shredding facilities in the U.S. Annual tonnages range from less than 15,000 to greater than 180,000 tons (13,600 t to 163,000 t) processed per year per site. Of 50 facilities contacted, the "median" shredder pr<'Cesses 60,000 tons (54,000 t) of scrap per year, and generates 12,000 tons (10,000 t) of fluff per year.
FJuff Disposal
Nonferrous shredder discharge is commercially recycled using a variety of gravity separation methods. The disposal problems (if any) and fuel properties of wastes from this activity are not within the scope of this paper.
Fluff is not recycled. The Department of Energy has funded research by the Plastics Institute of America, Inc. to process fluff and obtain a "wide spec" plastic molding feedstock. The commercial viability of this process has not been demonstrated [3].
Most operators landfill fluff. Some have sufficient property at their shredder or a nearby site. Others rely on public or private landfill operations.
Fluff contains lead, attributed to car batteries, exhaust systems, body repair solder, the highway environment and other sources [4]. A comprehensive study using U.S. Environmental Protection Agency (EPA) protocol [ 1] concluded, however, that representative sampling shows lead is not present in fluff at a hazardous level.
Nonetheless, some landfills have stopped accepting fluff, forcing shredder operators to stockpile it or haul it to more distant landfills. This type of de facto prohibition may become more widespread. Everywhere, disposal is getting more expensive. Dozens of industry representatives interviewed by the authors agree that many of their number will be forced out of the shredding business unless they find an alternative to landfilling.
Disposal Alternatives
It may become feasible to reduce the disposal volume and/or weight by separation and recycling, on the model of "nonferrous" recycling technology.
Several air or fluid classification and screening devices may be adaptable to separating fluff into its fabric, metal, molded plastic, fiber, and fines fractions. Magnetic separation devices may be adaptable to segre-
93
gating fines into highly ferrous and nonferrous fractions.
These types of material separation have not been applied to shredder fluff. Until recently, disposal costs were low enough that investment in separation processes was unwarranted.
Fluff volume can be reduced through baling or incineration. Some landfill operations can offer reduced disposal fees per unit weight of wastes, provided waste has been baled to allow simplified, lower cost handling, and increased structural integrity in the landfill. Whether the cost of baling is offset by reduced disposal costs must be evaluated on a case by case basis.
Efficient incineration can eliminate combustibles and significantly reduce fluff volumes. Energy recovery from incineration introduces the opportunity to sell electric power and steam, or use electric power inplant, displacing purchased power. These practices are exemplified in the forest products industry. Sawdust, bark, chips, and other wastes are used as fuel to generate steam and electric power.
FLUFF AS FUEL
Fluff samples were analyzed to assess the technical feasibility of using fluff as fuel and to determine appropriate combustion equipment.
Seventy-two 55 gal drums of fluff (six each from 12 sites) were collected to provide sufficient fuel for a 3 day test bum. Representative analysis samples were removed from each site's six-drum contribution through the coning and quartering technique. This solid waste sampling technique begins by shaping the bulk quantity into a symmetrical cone. The cone is divided into four quarters using perpendicular diameter lines. Opposite quarters are discarded and the procedure repeated with the retained quarters. The entire process is repeated until the weight or volume of the retained quarters equals the desired sample size [5].
Chemical Properties
Three to 5 lb ( 1.4-2.3 kg) of each contribution were subjected to detailed fuel analysis. This analysis determined as-received percent by weight content for moisture, ash, volatiles, fixed carbon, and specified chemical elements as well as Higher Heating Value (HHV). Average and range of analysis results for twelve samples are shown in Table 1.

TABLE 1 SHREDDER FLUFF FUEL ANALYSIS
As Received ---------------------Weight Percent---------------------------
Fixed Site l..!!221 Ash Volatiles Carbon Sulfur
1 2 25 66 7 0.5 2 14 45 41 0 0.5 3 15 31 50 4 0.3 4 5 54 40 1 0.4 5 34 41 24 1 0.3 6 2 26 60 12 0.5 7 2 72 25 1 0.2 8 5 53 42 0 0.3 9 6 48 40 6 0.3
10 4 47 49 0 0.3 11 3 35 54 8 0.4 12 23 49 25 3 0.2
High 34 72 66 12 0.5
Low 2 25 24 0 0.2
Avg. 10 44 44 3 0.4
Test Burn
Composite 11 43 43 3 0.4
Fluff has a mean HHV of 5400 Btu/lb (12,560 kJ / kg). Assuming that 200 shredders generate an average of 15,000 tons (13,600 t) per year, fluff currently represents a gross potential fuel value of 0.033 quads (0.035 X 10¹⁸ J). Due to increasing plastics content of cars [6], this total is expected to double in the next decade.
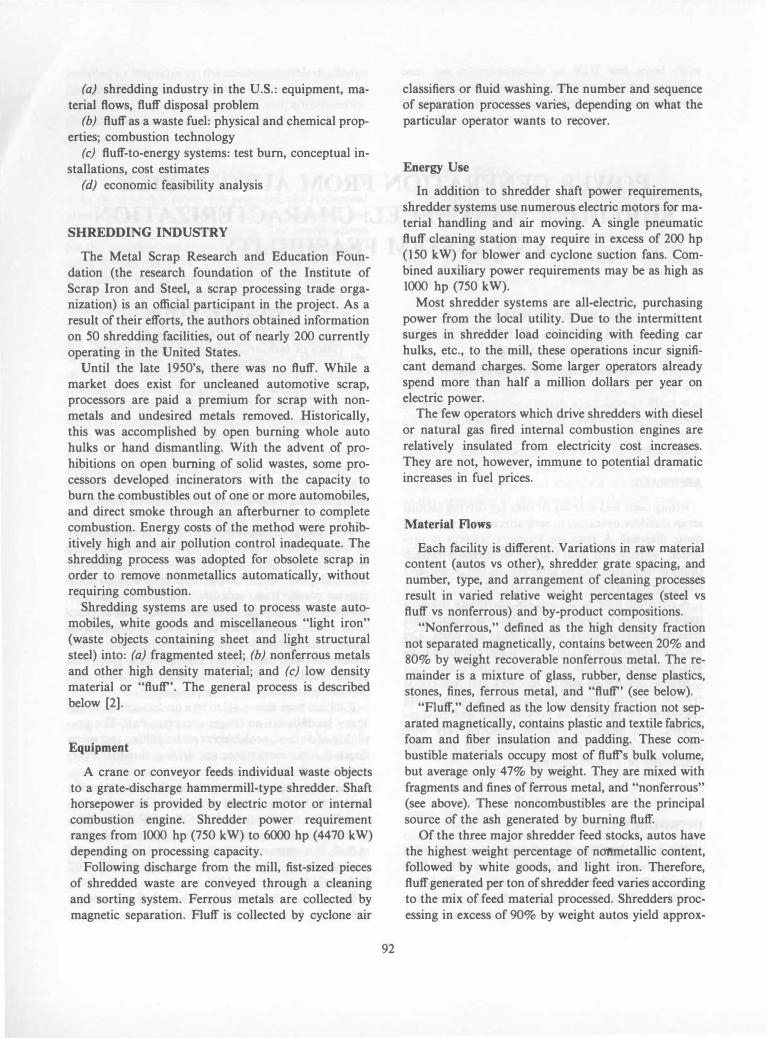
The ash and moisture contents of as-received samples vary widely. Consequentially, as-received HHV varies over a wide range: 2900 to 9260 Btu/lb (6750-21,540 kJ/kg). Moisture-and ash-free (MAF) HHV, however averages 11,600 Btu/lb (26,980 kJ /kg), and varies over a narrow range: 9930 to 12830 Btu/lb (23,100 to 29,840 kJ /kg). Apparently, the combustible fraction of fluff is similar for samples which differ widely in noncombustibles content.
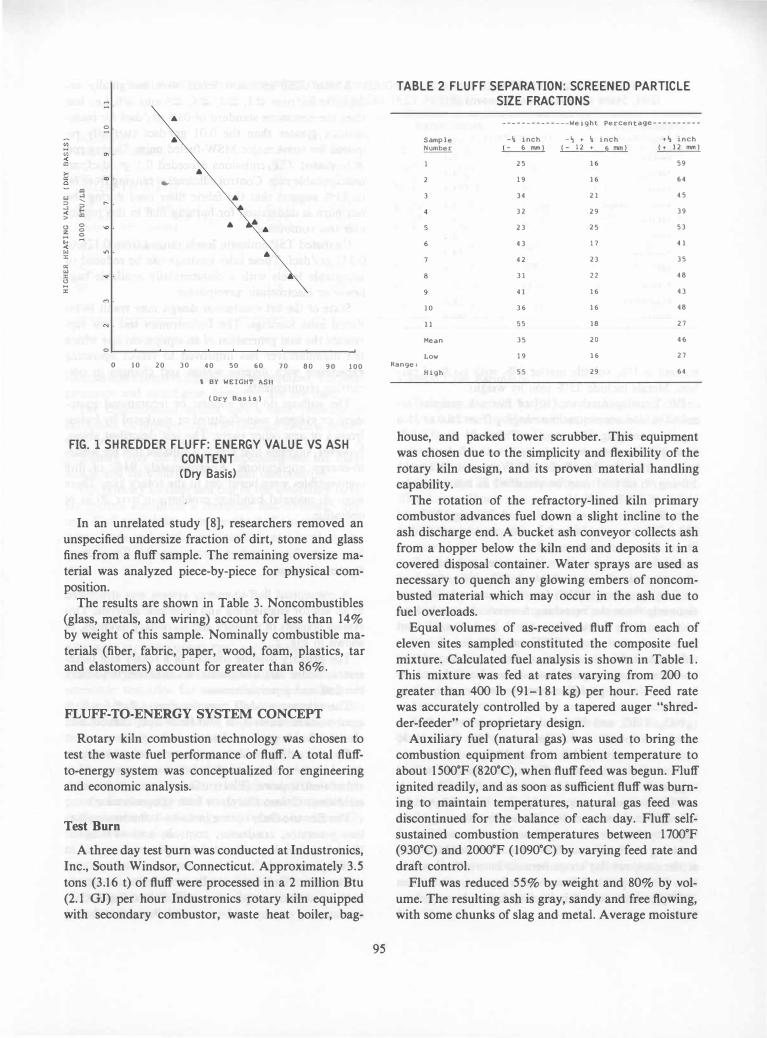
The relationship between dry basis ash content and fuel value of fluff samples is shown in Fig. 1. Depending on the shredding process, fluff contains a variable weight percentage of noncombustibles (ash). While the fuel value per pound of fluff decreases with increasing noncombustibles content, the fluff increases as a weight percentage of scrap processed. The overall available fluff energy from shredding automotive scrap is relatively constant, approximately 2.2 X 10⁶ Btu/ton of scrap (2.5 X 10⁶ kJ/t of scrap).
94
Moisture-and Ash-Free
HHV HHV Chlorine Btu/lb (kJ/kg) Btu/lb (kJ/kg)
5.2 9,260 (21 500) 12,761 (29 700 )
1.4 4,560 ( 10 600) 11,213 (26 100 ) 0.9 6,170 ( 14 400) 11,399 (26 500)
1.0 4,858 (11 300) 11,841 (27 500) 0.7 2,898 ( 6700) 11,828 (27 500 )
16.9 8,372 (19 500) 11,683 (27 200)
2.2 2,957 ( 6900) 11,11)8 (26 000)
4.6 4,901 (11 400) 12,834 (29 900) 2.9 5,859 (13 628) 12,638 (29 400)
1.9 4,898 (11 400) 9,928 (23 100)
2.6 7,079 (16 500) 11,304 (26 300) 1.0 2.993 ( 7000) 10.603 (24 700)
16.9 9,260 (2.1 500) 12,830 (29 800)
0.7 2,900 6800) 9,930 (23 100)
3.4 5,400 (12 600) 11,600 (27 000)
3.8 5,490 ( 12 800) 11,900 (27 800)
Physical Properties
During this study, fluff samples were handled and inspected extensively. Several shredding facilities were visited, and numerous operators were interviewed. The authors learned that while fluff is predominantly nonmetallic, it contains significant amounts of a wide variety of metals, plated metals, metal-plated-plastics, and some ferrous metal. Combustibles include plastics, textiles, wood and paper.
The bulk density of fluff is approximately 20 lb/ftl (320 kg/m3).
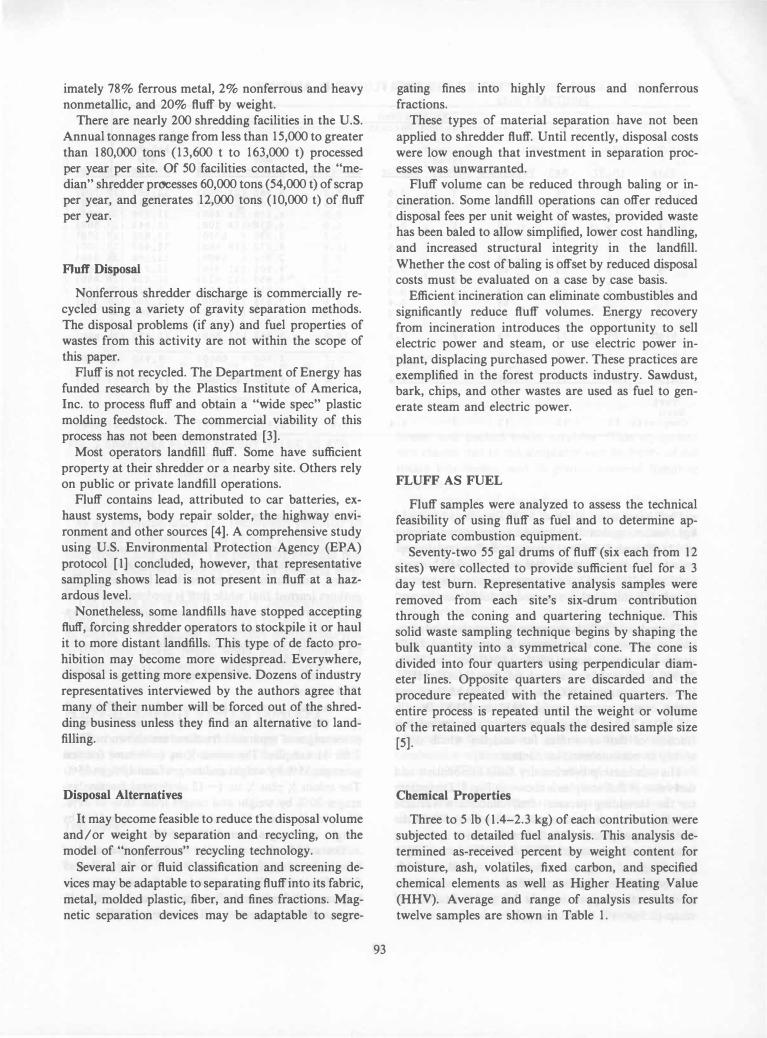
Some fines were readily removed from fluff through X in. ( 12 mm) and X in. (6 mm) screens. The weight percentages of separated fractions are shown in Table 2 for 11 samples. The minus X in. (-6 mm) fraction averages 35% by weight and ranges from 19% to 55%. The minus X plus X in. (-12 + 6 mm) fraction averages 20% by weight and ranges from 16% to 29%. The plus X in. (+ 12 mm) fraction averages 46% by weight and ranges from 27% to 64%.
The authors are currently studywg separation of noncombustibles from shredder fluff. Composition of fines fractions will be determined. Separating equipment and methods, and effects on combustion, air emissions and ash properties will be examined [7].
'" ::> ... « :> <:J � .. « '" '" a: '" '" � '"
:: ..
::: ..
.. •
'" � .. ::> .. '" 0 .. .. 0 .. :::
..
0
10 20 30 40 50 60 70 80 90 , BY WEIGHT ASfl
(Dry Basis)
FIG. 1 SHREDDER FLUFF: ENERGY VALUE VS ASH CONTENT
(Dry Basis)
100
In an unrelated study [8], researchers removed an unspecified undersize fraction of dirt, stone and glass fines from a fluff sample. The remaining oversize material was analyzed piece-by-piece for physical composition.
The results are shown in Table 3. Noncombustibles (glass, metals, and wiring) account for less than 14% by weight of this sample. Nominally combustible materials (fiber, fabric, paper, wood, foam, plastics, tar and elastomers) account for greater than 86%.
FLUFF-TO-ENERGY SYSTEM CONCEPT
Rotary kiln combustion technology was chosen to test the waste fuel performance of fluff. A total fluffto-energy system was conceptualized for engineering and economic analysis.
Test Burn
A three day test bum was conducted at Industronics, Inc., South Windsor, Connecticut. Approximately 3.5 tons (3.16 t) of fluff were processed in a 2 million Btu (2.1 OJ) per hour Industronics rotary kiln equipped with secondary combustor, waste heat boiler, bag-
95
TABLE 2 FLUFF SEPARATION: SCREENED PARTICLE
SIZE FRACTIONS
--------------Weight Percentage----------
Sample -l.;; inch -� ... la inch ... � inch Number ( - 6 mm) (- 12 • 6 mm) (. 12 mm)
25 16 59 19 16 64
34 21 45
32 29 39 23 25 53
43 17 41
42 23 35
31 22 48
41 16 43
10 36 16 48
II 55 18 27
Mean 35 20 46
Low 19 16 27 Range:
High 55 29 64
house, and packed tower scrubber. This equipment was chosen due to the simplicity and flexibility of the rotary kiln design, and its proven material handling capability.
The rotation of the refractory-lined kiln primary combustor advances fuel down a slight incline to the ash discharge end. A bucket ash conveyor collects ash from a hopper below the kiln end and deposits it in a covered disposal container. Water sprays are used as necessary to quench any glowing embers of noncombusted material which may occur in the ash due to fuel overloads.
Equal volumes of as-received fluff from each of eleven sites sampled constituted the composite fuel mixture. Calculated fuel analysis is shown in Table 1. This mixture was fed at rates varying from 200 to greater than 400 lb (91-181 kg) per hour. Feed rate was accurately controlled by a tapered auger "shredder-feeder" of proprietary design.
Auxiliary fuel (natural gas) was used to bring the combustion equipment from ambient temperature to about 1500°F (820°C), when fluff feed was begun. Fluff ignited readily, and as soon as sufficient fluff was burning to maintain temperatures, natural gas feed was discontinued for the balance of each day. Fluff selfsustained combustion temperatures between 1700°F (930°C) and 2000°F (1090°C) by varying feed rate and draft control.
Fluff was reduced 55% by weight and 80% by volume. The resulting ash is gray, sandy and free flowing, with some chunks of slag and metal. Average moisture
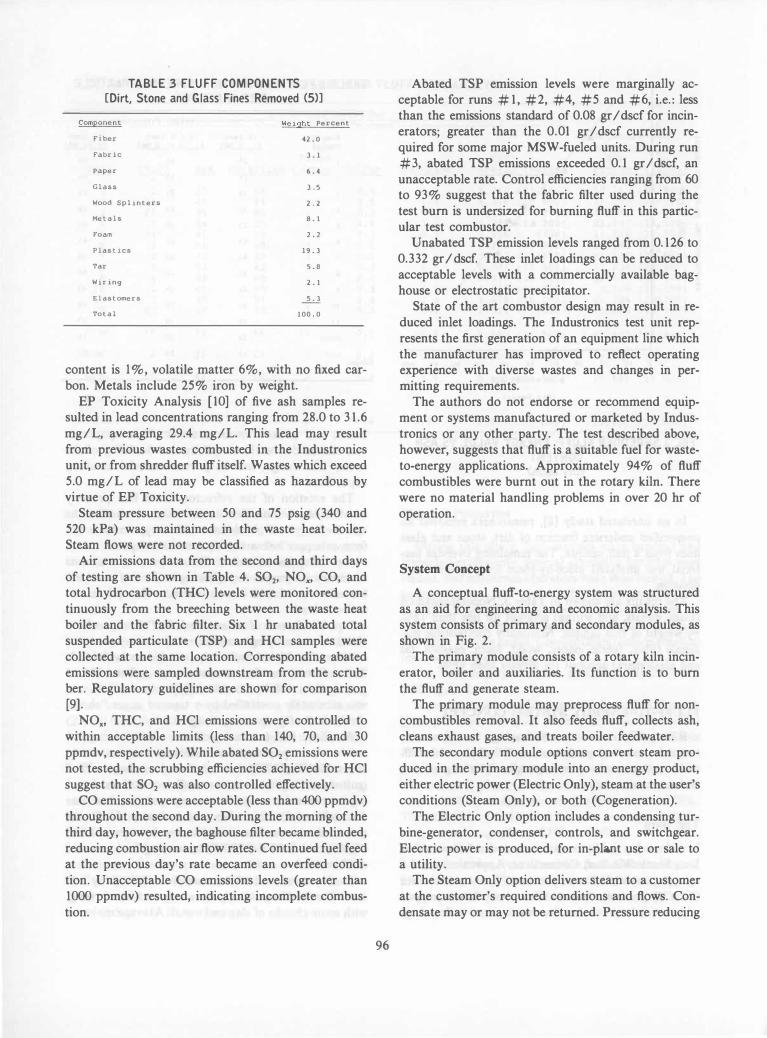
TABLE 3 FLUFF COMPONENTS [Dirt, Stone and Glass Fines Removed (5)]
Component Weight Percent
Fiber 42.0 Fabric 3.1 Paper 6.4 Glass 3.5 Wood Splinters 2.2 Metals 8.1 Foam 2.2 Plastics 19.3 Tar 5.8 Wiring 2.1 Elastomers � Total 100.0
content is 1 %, volatile matter 6%, with no fixed carbon. Metals include 25% iron by weight.
EP Toxicity Analysis [ 10] of five ash samples resulted in lead concentrations ranging from 28.0 to 3 1.6 mg/L, averaging 29.4 mg/L. This lead may result from previous wastes combusted in the Industronics unit, or from shredder fluff itself. Wastes which exceed 5.0 mg/L of lead may be classified as hazardous by virtue of EP Toxicity.
Steam pressure between 50 and 75 psig (340 and 520 kPa) was maintained in the waste heat boiler. Steam flows were not recorded.
Air emissions data from the second and third days of testing are shown in Table 4. S02' NO", CO, and total hydrocarbon (THC) levels were monitored continuously from the breeching between the waste heat boiler and the fabric filter. Six 1 hr unabated total suspended particulate (TSP) and HCl samples were collected at the same location. Corresponding abated emissions were sampled downstream from the scrubber. Regulatory guidelines are shown for comparison [9].
NO., THC, and HCl emissions were controlled to within acceptable limits (less than 140, 70, and 30 ppmdv, respectively). While abated S02 emissions were not tested, the scrubbing efficiencies achieved for HCl suggest that S02 was also controlled effectively.
CO emissions were acceptable (less than 400 ppmdv) throughout the second day. During the morning of the third day, however, the baghouse filter became blinded, reducing combustion air flow rates. Continued fuel feed at the previous day's rate became an overfeed condition. Unacceptable CO emissions levels (greater than 1000 ppmdv) resulted, indicating incomplete combustion.
96
Abated TSP emlSSlOn levels were marginally acceptable for runs # 1, #2, #4, #5 and #6, i.e.: less than the emissions standard of 0.08 gr / dscf for incinerators; greater than the 0.01 gr / dscf currently required for some major MSW -fueled units. During run #3, abated TSP emissions exceeded 0.1 gr/dscf, an unacceptable rate. Control efficiencies ranging from 60 to 93% suggest that the fabric filter used during the test bum is undersized for burning fluff in this particular test combustor.
Unabated TSP emission levels ranged from 0.126 to 0.332 gr / dscf. These inlet loadings can be reduced to acceptable levels with a commercially available baghouse or electrostatic precipitator.
State of the art combustor design may result in reduced inlet loadings. The Industronics test unit represents the first generation of an equipment line which the manufacturer has improved to reflect operating experience with diverse wastes and changes in permitting requirements.
The authors do not endorse or recommend equipment or systems manufactured or marketed by Industronics or any other party. The test described above, however, suggests that fluff is a suitable fuel for wasteto-energy applications. Approximately 94% of fluff combustibles were burnt out in the rotary kiln. There were no material handling problems in over 20 hr of operation.
System Concept
A conceptual fluff-to-energy system was structured as an aid for engineering and economic analysis. This system consists of primary and secondary modules, as shown in Fig. 2.
The primary module consists of a rotary kiln incinerator, boiler and auxiliaries. Its function is to bum the fluff and generate steam.
The primary module may preprocess fluff for noncombustibles removal. It also feeds fluff, collects ash, cleans exhaust gases, and treats boiler feedwater.
The secondary module options convert steam produced in the primary module into an energy product, either electric power (Electric Only), steam at the user's conditions (Steam Only), or both (Cogeneration).
The Electric Only option includes a condensing turbine-generator, condenser, controls, and switchgear. Electric power is produced, for in-plant use or sale to a utility.
The Steam Only option delivers steam to a customer at the customer's required conditions and flows. Condensate may or may not be returned. Pressure reducing
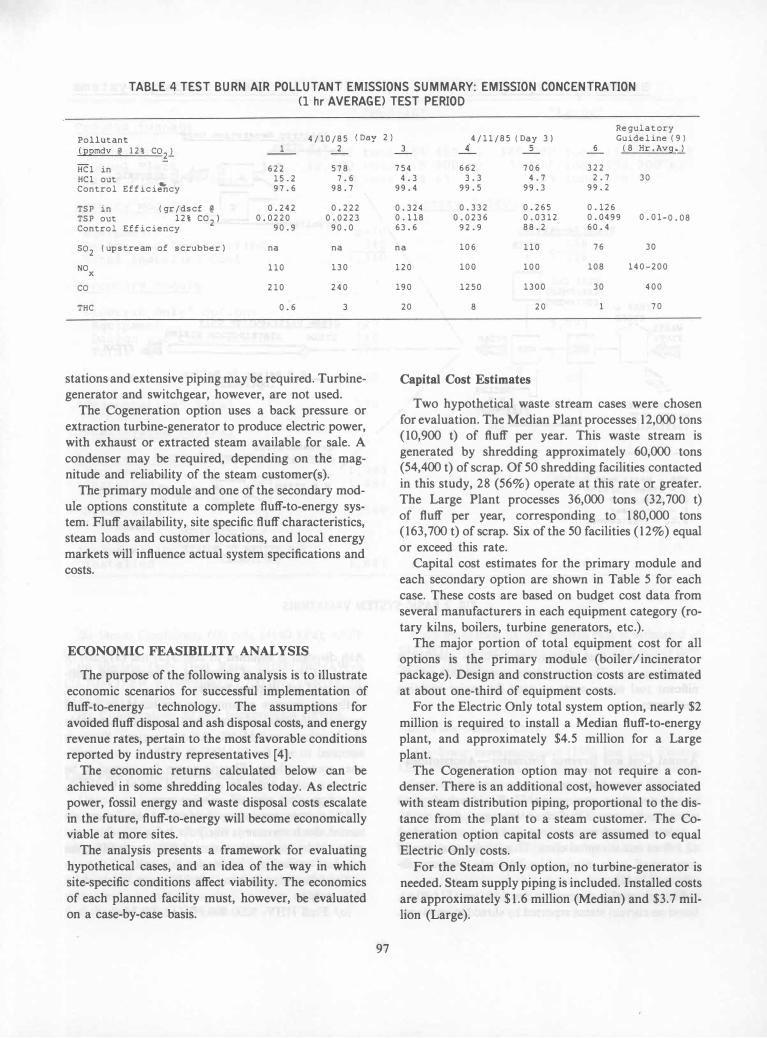
TABLE 4 TEST BURN AIR POLLUTANT EMISSIONS SUMMARY: EMISSION CONCENTRATION (l hr AVERAGE) TEST PERIOD
Pollutant 4/10/85 (Day 2)
(EEmdv @ 12% C021
HC1 in HC1 out Control Effici�cy
TSP in (gr/dscf @ TSP out 12% CO
2)
Control Efficiency
S02
(upstream of scrubber)
NO x CO
THC
1 2
622 578 15.2 7.6 97.6 98.7
0.242 0.222 0.0220 0.0223
90.9 90.0
na na
110 130
210 240
0.6
stations and extensive piping may be required. Turbinegenerator and switchgear, however, are not used.
The Cogeneration option uses a back pressure or extraction turbine-generator to produce electric power, with exhaust or extracted steam available for sale. A condenser may be required, depending on the magnitude and reliability of the steam customer(s).
The primary module and one of the secondary module options constitute a complete fluff-to-energy system. Fluff availability, site specific fluff characteristics, steam loads and customer locations, and local energy markets will influence actual system specifications and costs.
ECONOMIC FEASIBILITY ANALYSIS
The purpose of the following analysis is to illustrate economic scenarios for successful implementation of fluff-to-energy technology. The assumptions for avoided fluff disposal and ash disposal costs, and energy revenue rates, pertain to the most favorable conditions reported by industry representatives [4].
The economic returns calculated below can be achieved in some shredding locales today. As electric power, fossil energy and waste disposal costs escalate in the future, fluff-to-energy will become economically viable at more sites.
The analysis presents a framework for evaluating hypothetical cases, and an idea of the way in which site-specific conditions affect viability. The economics of each planned facility must, however, be evaluated on a case-by-case basis.
97
Regulatory 4/11/85 (Day 3) Guideline (9)
_3_ 4' _ 5_ _6 _ (8 Hr.Avg_)
754 662 706 322 4.3 3.3 4.7 2.7 30
99.4 99.5 99.3 99.2
0.324 0.332 0.265 0.126 0.118 0.0236 0.0312 0.0499 0.01-0.08 63.6 92.9 88.2 60.4
na 106 110 76 30
120 100 100 108 140-200
190 1250 1300 30 400
20 8 20 70
Capital Cost Estimates
Two hypothetical waste stream cases were chosen for evaluation. The Median Plant processes 12,000 tons (10,900 t) of fluff per year. This waste stream is generated by shredding approximately 60,000 tons (54,400 t) of scrap. Of 50 shredding facilities contacted in this study, 28 (56%) operate at this rate or greater. The Large Plant processes 36,000 tons (32,700 t) of fluff per year, corresponding to 180,000 tons (163,700 t) of scrap. Six of the 50 facilities ( 12%) equal or exceed this rate.
Capital cost estimates for the primary module and each secondary option are shown in Table 5 for each case. These costs are based on budget cost data from several manufacturers in each equipment category (rotary kilns, boilers, turbine generators, etc.).
The major portion of total equipment cost for all options is the primary module (boiler / incinerator package). Design and construction costs are estimated at about one-third of equipment costs.
For the Electric Only total system option, nearly $2 million is required to install a Median fluff-to-energy plant, and approximately $4.5 million for a Large plant.
The Cogeneration option may not require a condenser. There is an additional cost, however associated with steam distribution piping, proportional to the distance from the plant to a steam customer. The Cogeneration option capital costs are assumed to equal Electric Only costs.
For the Steam Only option, no turbine-generator is needed. Steam supply piping is included. Installed costs are approximately $1.6 million (Median) and $3.7 million (Large).

Basic Primary System
/ /
Varied Secondary Systems
Electric Generation Only E • P • Sn;AJo\
'\ �� - �� ELECTRIC
I� Steam Generation
STACIt I I /
Ero Bo� 1 e�l __ -===:=J .........
nUE: GAS 0 TRU'l'MEt.'T
PRE:P ,_ EOUIPHENT / STORE: j WASTE:�
rLUF'F U D I'STEAM � -L:j- WHB I � /
Steam Distribution Only
STEAM DISTRIBUTION PIPING
/1 L 1 -"'--- -- � ?
" -1!#��aL-
STEAM
'(--:.:J ��' �BOILER
SUPPLEMENTARY I_I H,c> _ " (Optional)
WASTE: mEL TREAnu:N'I'
(OPTIONAL) ASH
INC - Incinerator WHB - Waste Heat Boiler T - Steam Turb�ne G - Generator C - Condenser S.G. - Switchgear
� '" Co-Generation '" Electric and Steam Generation
*., ELECTRIC
P._O RETURN TO BOILER • z (OPTIONAi:"i-- --
STEAM
FIG. 2 BASIC SYSTEM VARIATIONS
It is assumed that these systems will be installed at shredding sites. Therefore, these costs include no significant real estate costs or need for major building enclosures.
Annual Cost and Revenue Estimates-Assumptions
System economics are sensitive to variations in assumed operating parameters. Fluff and ash disposal costs, electric power and steam rates vary nationwide.
Operating and maintenance costs are estimated at 12.5% of initial capital costs. This is representative of some small scale municipal-solid-waste-to-energy facilities (11, 12].
Fluff disposal is assumed to cost $ 13/ton ($ 14.30/t), based on current status reported by shredder operators.
98
Ash disposal is assumed to cost $ l2/ton ($13.20/t), based on the costs of operating an engineered, dedicated coal ash disposal facility.
Energy revenue assumptions are based on energy market conditions in some areas of the U.S., notably the Northeast and Middle Atlantic regions. Steam is assumed to sell for $9/1000 lb ($22/t), on a multiyear contract basis. Electric power is assumed to be sold to a public utility for a levelized rate of 1O¢ /kWh, on a 5 year (or greater) contract term.
No electric generating capacity payments are assumed. Such revenue is likely for a facility which operates 24 hr / day, with projected 80% availability, the assumed operating schedule for this analysis.
The following operating conditions are assumed for this analysis:
(a) Fluff HHV: 5000 Btu/lb (11,600 kJ /kg)
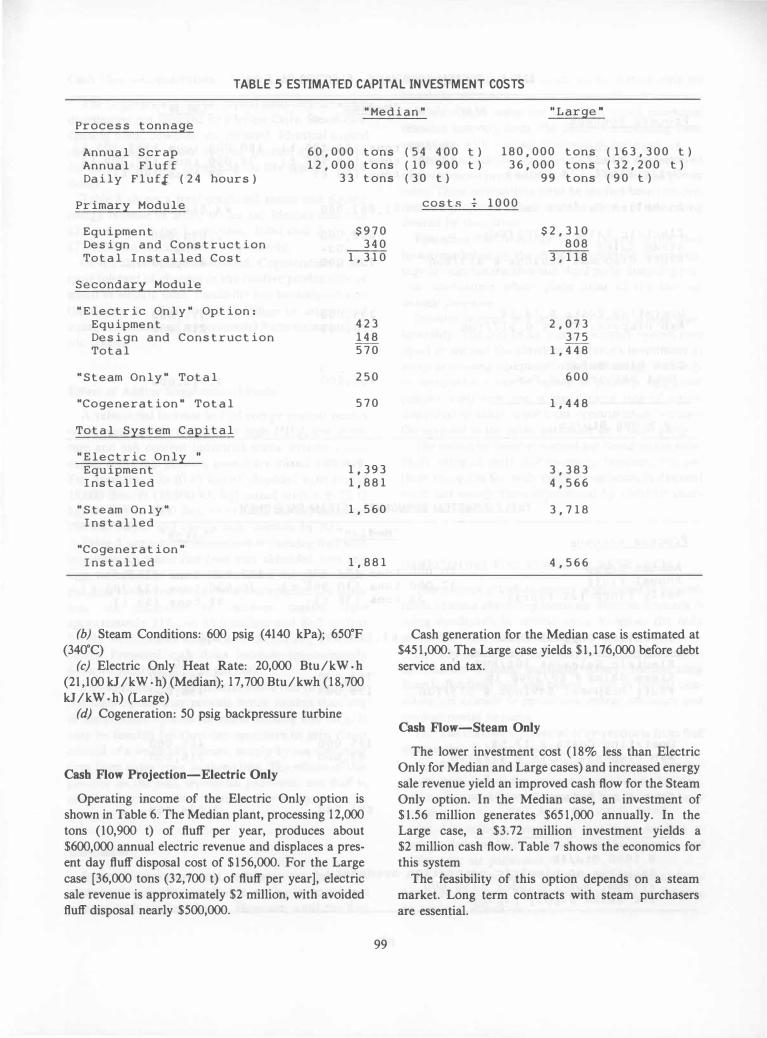
TABLE 5 ESTIMATED CAPITAL INVESTMENT COSTS
"Median" "Large" Process tonnage
Annual Scrap Annual Fluff Daily Fluft (24 hours)
60,000 tons (54 400 t) 12,000 tons (10 900 t)
33 tons (30 t)
180,000 tons (163,300 t) 36,000 tons (32,200 t)
99 tons (90 t)
Primary Module
Equipment Design and Construction Total Installed Cost
$970 340
1,310
Secondary Module
" Electric Only" Option: Equipment Design and Construction Total
423 148 570
"Steam Only" Total 250
"Cogeneration" Total 570
Total System Capital
" Electric Only " Equipment Installed
1,393 1,881
"Steam Only" Installed
1,560
"Cogeneration" Installed 1,881
(b) Steam Conditions: 600 psig (4140 kPa); 6500P (340°C)
(c) Electric Only Heat Rate: 20,000 Btu/kW.h (21,100 kJ/kW .h) (Median); 17,700 Btu/kwh (18,700 kJ/kW.h) (Large)
(d) Cogeneration: 50 psig backpressure turbine
Cash Flow Projection-Electric Only
Operating income of the Electric Only option is shown in Table 6. The Median plant, processing 12,000 tons (10,900 t) of fluff per year, produces about $600,000 annual electric revenue and displaces a present day fluff disposal cost of $156,000. Por the Large case [36,000 tons (32,700 t) of fluff per year], electric sale revenue is approximately $2 million, with avoided fluff disposal nearly $500,000.
99
costs � 1000
$2,310 808
3,118
2,073 375
1,448
600
1,448
3,383 4,566
3,718
4,566
Cash generation for the Median case is estimated at $451,000. The Large case yields $1,176,000 before debt service and tax.
Cash Flow-Steam Only
The lower investment cost ( 18% less than Electric Only for Median and Large cases) and increased energy sale revenue yield an improved cash flow for the Steam Only option. In the Median case, an investment of $1.56 million generates $651,000 annually. In the Large case, a $3.72 million investment yields a $2 million cash flow. Table 7 shows the economics for this system
The feasibility of this option depends on a steam market. Long term contracts with steam purchasers are essential.
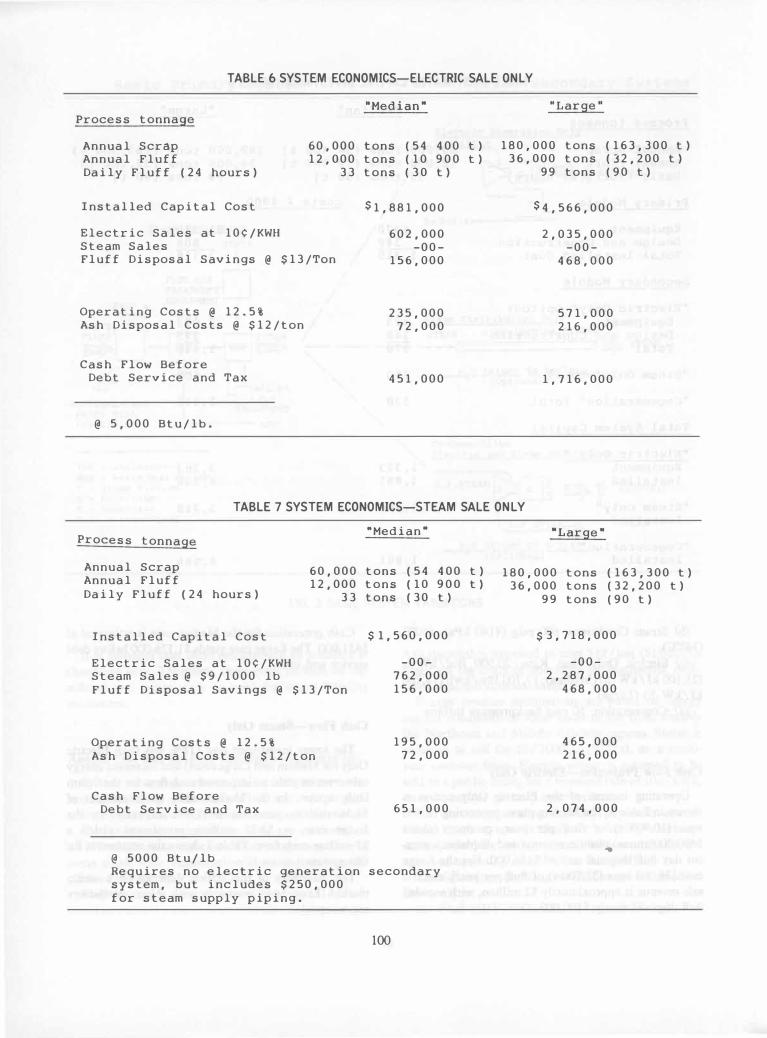
TABLE 6 SYSTEM ECONOMICS-ELECTRIC SALE ONLY
Process tonnage
Annual Scrap Annual Fluff Daily Fluff (24 hours)
Installed Capital Cost
Electric Sales at 10¢/KWH Steam Sales
60,000 tons (54 400 t) 12,000 tons (10 900 t)
33 tons (30 t)
Fluff Disposal Savings @ $13/Ton
$1,881,000
602,000 -00-
156,000
Operating Costs @ 12.5% Ash Disposal Costs @ $12/ton
Cash Flow Before Debt Service and Tax
@ 5,000 Btu/lb.
235,000 72,000
451,000
180,000 tons (163,300 t) 36,000 tons (32,200 t)
99 tons (90 t)
$4,566,000
2,035,000 -00-
468,000
571,000 216,000
1,716,000
TABLE 7 SYSTEM ECONOMICS-STEAM SALE ONLY
Process tonnage
Annual Scrap Annual Fluff Daily Fluff (24 hours)
Installed Capital Cost
Electric Sales at 10¢/KWH Steam Sales @ $9/1000 lb
"Median"
60,000 tons (54 400 t) 12,000 tons (10 900 t)
33 tons (30 t)
Fluff Disposal Savings @ $13/Ton
$ 1,560,000
-00-762,000 156,000
Operating Costs @ 12.5% Ash Disposal Costs @ $12/ton
Cash Flow Before Debt Service and Tax
@ 5000 Btu/lb
195,000 72,000
651,000
Requires no electric generation secondary system, but includes $250,000 for steam supply piping.
100
180,000 tons (163,300 t) 36,000 tons (32,200 t)
99 tons (90 t)
$ 3,718,000
-00-2,287,000
468,000
465,000 216,000
2,074,000
'.
Cash Flow-Cogeneration
The Cogeneration option capital costs include steam distribution not required by Electric Only. Steam condensing costs, however, are reduced. Identical capital costs are used for both options. (Actual system costs for all options vary depending on site specific condi-tions). ..
Table 8 shows a total combined steam and electric energy revenue of $924,000 for the Median case and $2.8 million for the Large case. Total cash flows are $773,000 and $2.5 million, respectively.
Of the three options discussed, Cogeneration is the most tolerant of changes in the relative profitability of steam vs electric sales. Flexibility can be designed into the system to allow for the addition or attrition of steam customers and consequential fluctuations in electric output.
Effect of Adding Supplemental Fuels
A substantial increase in fuel energy content occurs when small weight fractions of high HHV, low moisture and ash content industrial waste streams (tires, carpet trimming, plastics, paper) are mixed with fluff. For example, 1 lb (0.45 kg) of shredded auto tire at 15,000 Btu/lb (34,900 kJ /kg) mixed with 6 lb (2.72 kg) of fluff at 5000 Btu/lb (11,600 kJ /kg) increases thermal output and energy sale revenues by 50%.
Table 9 projects the economics of burning fluff with supplemental waste fuel (one part shredded tires and 6 parts fluft). The increased mass and energy throughput, and revised environmental controls for tire burning, are estimated to increase capital costs approximately 37%, to $2.6 million and $6.3 million for the Median and Large cases respectively (Electric Only). Projected cash flows increase approximately 44%, to $650,000 and $2,482,000.
The addition of supplemental waste fuel to the Electric Only option may provide better returns than any of the previous options discussed burning fluff only. It may be feasible for shredder operators to gain direct control of a waste tire stream, simply by not removing tires from autos prior to shredding. The effects of this practice on the mill, separation processes, and fluff vs nonferrous composition merit further study.
Discussion
System component cost estimates are based on equipment currently installed in analogous municipal systems with similar ratings. However, until the first
101
fluff-to-energy system is in operation, system costs are based on estimates.
While O&M costs are based on small municipal resource recovery costs, the effect of integrating these operations with a scrap processor is unknown.
Steam and electric power sale contracts can be keyed to government price indexes or avoided fuel and power costs. These alternatives must be studied based on current and projected values, and the degree of risk-taking desired by the owner.
Financing fluff-to-energy in the private sector may be accomplished by the shredder operator. Shared energy savings contractors and third party financing provide alternatives which place most of the risk on outside investors.
Investor interest will determine actual system marketability. The cost of an energy recovery system may equal or surpass the shredder operator's investment in scrap processing equipment. The technology will only be accepted if it can be shown to generate significant positive cash flow and a competitive rate of return compared to other investment opportunities, whether the investor is the scrap processor or a third party.
The economic cases presented are based on the most likely siting of early fluff-to-energy facilities. The authors recognize the wide range of variation in disposal costs and energy rates experienced by shredder operators nationwide.
DIRECfIONS FOR FURTHER RESEARCH
The concept of fluff-to-energy is projected to be profitable at some shredding locations. Further research is being conducted in several areas to lessen the risks associated with this technology.
(a) The authors are currently evaluating alternative combustion systems, including rotary, reciprocating hearth, fluidized bed and others. Cost vs benefit consideration extends to operations, energy efficiency and environmental impacts.
(b) The corrosion potential of by-products from fluff combustion is being studied.
(c) Air pollution control and ash disposal requirements must reflect the current state of ever-changing, regionally variable regulations and best available technology.
(d) Air pollutant emissions should be detailed to include data on high molecular weight organics, and other toxic air pollutants.
(e) The authors are investigating equipment and systems for removing noncombustibles prior to burning to establish effects on:
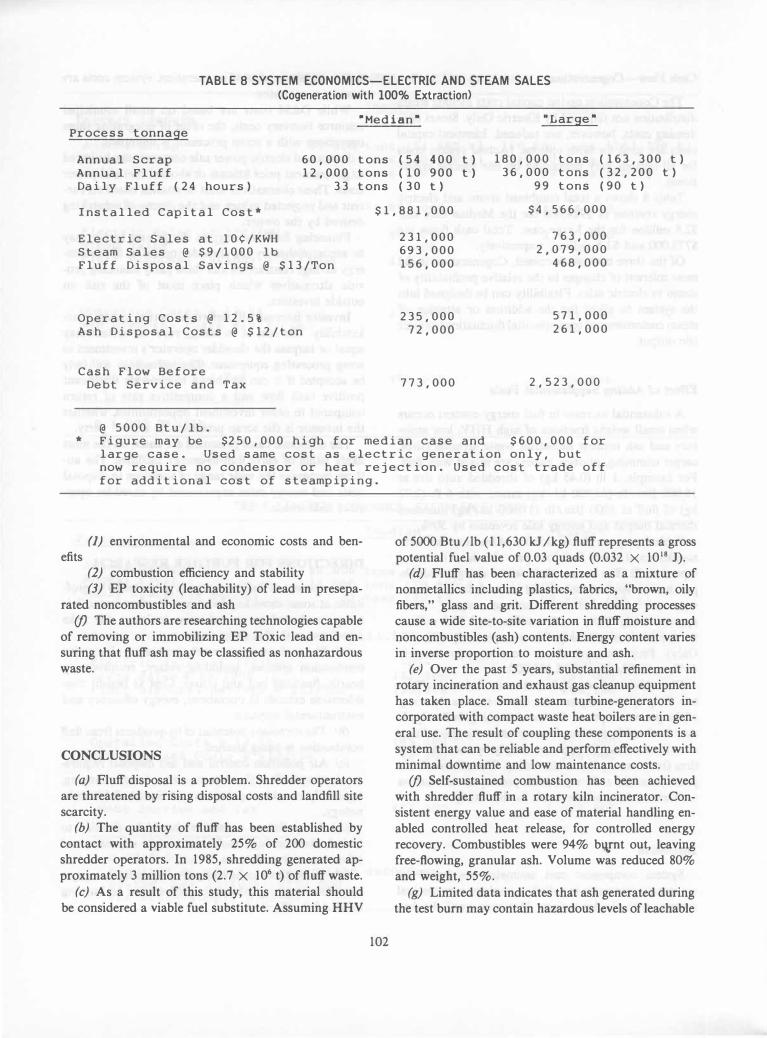
TABLE 8 SYSTEM ECONOMICS-ELECTRIC AND STEAM SALES (Cogeneration with 100% Extraction)
-Median- -Large-Process tonnage
Annual Scrap Annual Fluff Daily Fluff (24 hours)
60,000 tons (54 400 t) 12,000 tons (10 900 t)
33 tons (30 t)
180,000 tons (163,300 t) 36,000 tons (32,200 t)
99 tons (90 t)
Installed Capital Cost·
Electric Sales at 10¢/KWH Steam Sales @ $9/1000 lb Fluff Disposal Savings @ $13/Ton
Operating Costs @ 12.5% Ash Disposal Costs @ $12/ton
Cash Flow Before Debt Service and Tax
@ 5000 Btu/lb.
$1,881,000
231,000 693,000 156,000
235,000 72,000
773,000
$4,566,000
763,000 2,079,000
468,000
571,000 261,000
2,523,000
• Figure may be $250,000 high for median case and $600,000 for large case. Used same cost as electric generation only, but now require no condensor or heat rejection. Used cost trade off for additional cost of steampiping.
(1) environmental and economic costs and ben-efits
(2) combustion efficiency and stability (3) EP toxicity (leachability) of lead in presepa
rated noncombustibles and ash (j) The authors are researching technologies capable
of removing or immobilizing EP Toxic lead and ensuring that fluff ash may be classified as nonhazardous waste.
CONCLUSIONS
(a) Fluff disposal is a problem. Shredder operators are threatened by rising disposal costs and landfill site scarcity.
(b) The quantity of fluff has been established by contact with approximately 25% of 200 domestic shredder operators. In 1985, shredding generated approximately 3 million tons (2.7 X 10⁶ t) of fluff waste.
(c) As a result of this study, this material should be considered a viable fuel substitute. Assuming HHV
102
of 5000 Btu/lb (11,630 kJ /kg) fluff represents a gross potential fuel value of 0.03 quads (0.032 X 10¹⁸ J).
(d) Fluff has been characterized as a mixture of nonmetallics including plastics, fabrics, "brown, oily fibers," glass and grit. Different shredding processes cause a wide site-to-site variation in fluff moisture and noncombustibles (ash) contents. Energy content varies in inverse proportion to moisture and ash.
(e) Over the past 5 years, substantial refinement in rotary incineration and exhaust gas cleanup equipment has taken place. Small steam turbine-generators incorporated with compact waste heat boilers are in general use. The result of coupling these components is a system that can be reliable and perform effectively with minimal downtime and low maintenance costs.
(j) Self-sustained combustion has been achieved with shredder fluff in a rotary kiln incinerator. Consistent energy value and ease of material handling enabled controlled heat release, for controlled energy recovery. Combustibles were 94% b�mt out, leaving free-flowing, granular ash. Volume was reduced 80% and weight, 55%.
(g) Limited data indicates that ash generated during the test bum may contain hazardous levels of leachable
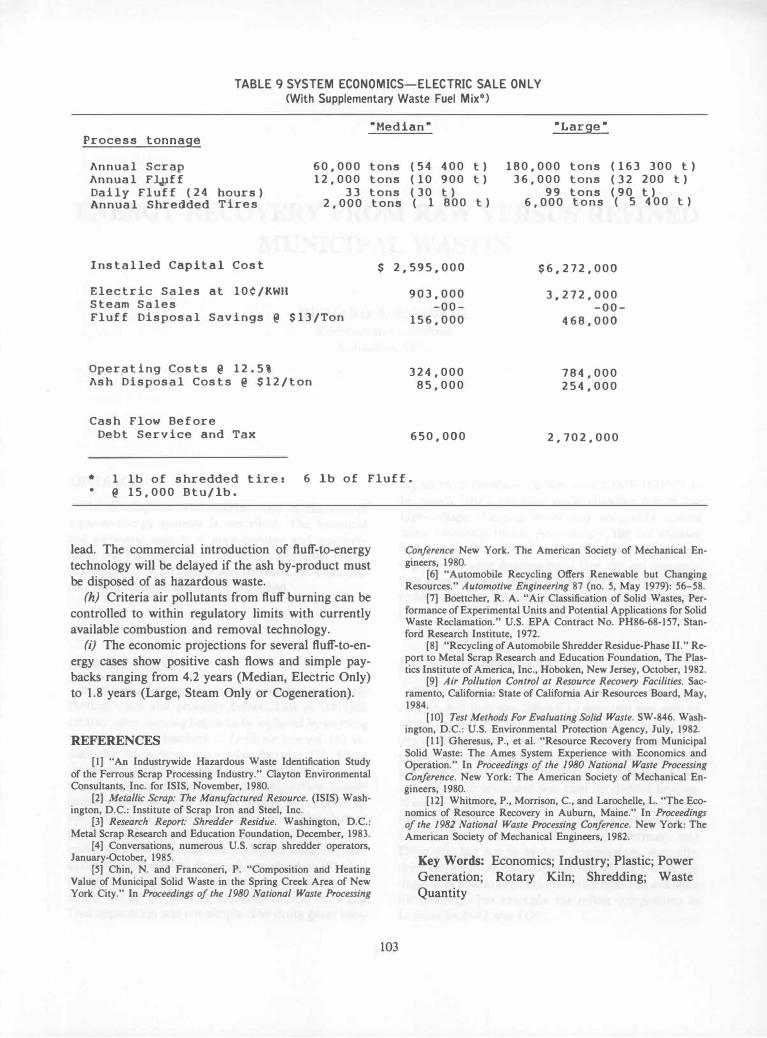
TABLE 9 SYSTEM ECONOMICS-ELECTRIC SALE ONLY (With Supplementary Waste Fuel Mix*)
"Median" "Large" Process tonnage
Annual Scrap Annual Fl,uff Daily Fluff (24 hours) Annual Shredded Tires
Installed Capital Cost
Electric Sales at 10¢/KWH Steam Sales
60,000 12,000
33 2,000
Fluff Disposal Savings @ $13/Ton
Operating Costs @ 12.5% Ash Disposal Costs @ $12/ton
Cash Flow Before Debt Service and Tax
tons (54 400 t) tons (10 900 t) tons (30 t) tons ( 1 800 t)
$ 2,595,000
903,000 -00-
156,000
324,000 85,000
650,000
180,000 tons (163 300 t) 36,000 tons (32 200 t)
99 tons (90 t) 6,000 tons ( 5 400
$6,272,000
3,272,000 -00-
468,000
784,000 254,000
2,702,000
t)
* 1 lb of shredded tire: @ 15,000 Btu/lb.
6 lb of Fluff.
lead. The commercial introduction of fluff-to-energy technology will be delayed if the ash by-product must be disposed of as hazardous waste.
(h) Criteria air pollutants from fluff burning can be controlled to within regulatory limits with currently available combustion and removal technology.
(i) The economic projections for several fluff-to-energy cases show positive cash flows and simple paybacks ranging from 4.2 years (Median, Electric Only) to 1.8 years (Large, Steam Only or Cogeneration).
REFERENCES
[I] "An Industrywide Hazardous Waste Identification Study of the Ferrous Scrap Processing Industry." Clayton Environmental Consultants, Inc. for ISIS, November, 1980.
[2] Metallic Scrap: The Manufactured Resource. (ISIS) Washington, D.C.: Institute of Scrap Iron and Steel, Inc.
[3] Research Report: Shredder Residue. Washington, D.C.: Metal Scrap Research and Education Foundation, December, 1983.
[4] Conversations, numerous U.S. scrap shredder operators, January-October, 1985.
[5] Chin, N. and Franconeri, P. "Composition and Heating Value of Municipal Solid Waste in the Spring Creek Area of New York City." In Proceedings of the 1980 National Waste Processing
103
Conference New York. The American Society of Mechanical Engineers, 1980.
[6] "Automobile Recycling Offers Renewable but Changing Resources." Automotive Engineering 87 (no. 5, May 1979): 56-58.
[7] Boettcher, R. A. "Air Classification of Solid Wastes, Performance of Experimental Units and Potential Applications for Solid Waste Reclamation." U.S. EPA Contract No. PH86-68-157, Stanford Research Institute, 1972.
[8] "Recycling of Automobile Shredder Residue-Phase II." Report to Metal Scrap Research and Education Foundation, The Plastics Institute of America, Inc., Hoboken, New Jersey, October, 1982.
[9] Air Pollution Control at Resource Recovery Facilities. Sacramento, California: State of California Air Resources Board, May, 1984.
[10] Test Methods For Evaluating Solid Waste. SW-846. Washington, D.C.: U.S. Environmental Protection Agency, July, 1982.
[II] Gheresus, P., et al. "Resource Recovery from Municipal Solid Waste: The Ames System Experience with Economics and Operation." In Proceedings of the 1980 National Waste Processing Conference. New York: The American Society of Mechanical Engineers, 1980.
[12] Whitmore, P., Morrison, C., and Larochelle, L. "The Economics of Resource Recovery in Auburn, Maine." In Proceedings of the 1982 National Waste Processing Conference. New York: The American Society of Mechanical Engineers, 1982.
Key Words: Economics; Industry; Plastic; Power Generation; Rotary Kiln; Shredding; Waste Quantity