Embed Size (px)
Citation preview

Power Production During Swim Starting
D. Gordon E. Robertson, Ph.D.
Vivian L. Stewart, M.Sc.
Biomechanics Laboratory,
School of Human Kinetics,
University of Ottawa, Ottawa, CANADA
Introduction
• theory holds that with explosive motions muscles are recruited sequentially from proximal to distal (CAC)
• vertical jumping research suggests simultaneous recruitment of leg moments (Robertson & Fleming, 1987)
• arm moments in running contribute little work to propulsion
• swim starters’ projectile angles are not optimized for maximum flight (< 10 deg)

Purpose
• determine determine whether changes in starting position increases projection angle
• determine recruitment ordering of moments
• power contributions of shoulder, elbow, hip, knee and ankle moments to swimming starts
Methods
• eight female varsity or club swimmers
• filmed at 50 frames/second
• force plate on starting platform synchronized to 50 Hz
• three starting positions:– declined platform with toes over edge
– declined platform with toes flush with top
– level platform with toes over edge
• flight phase distance calculated from fitting trajectory to least squares quadratic
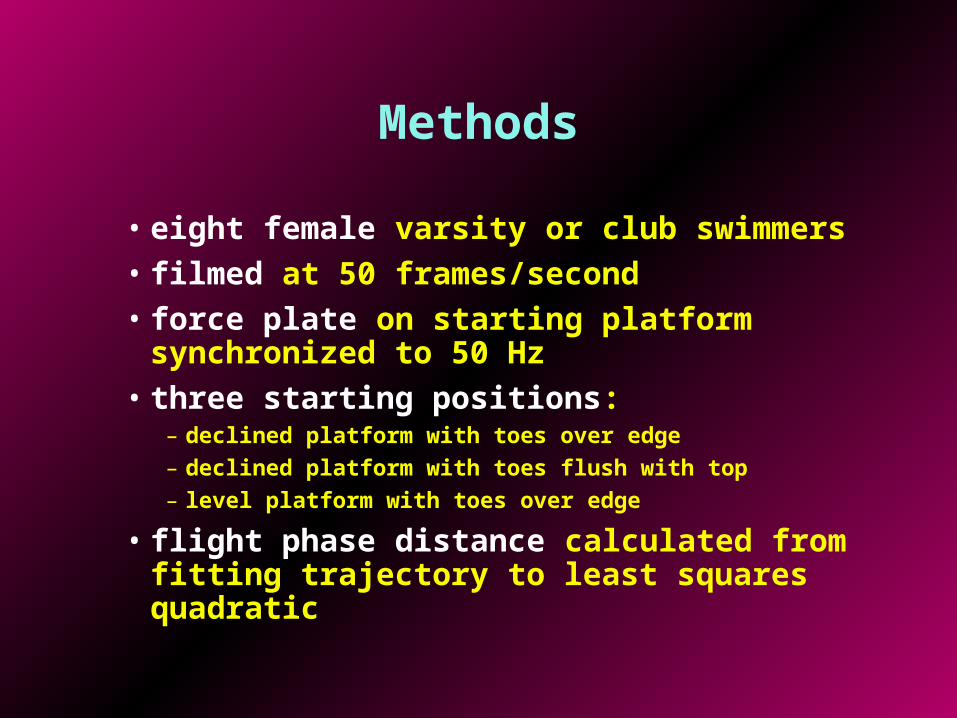
Experimental Setup
ForceForceplatformplatform
Cine-cameraCine-camera
A/DA/Dconverterconverter
A/DA/Dconverterconverter
ChargeChargeamplifieramplifierChargeCharge
amplifieramplifier
ComputerComputer
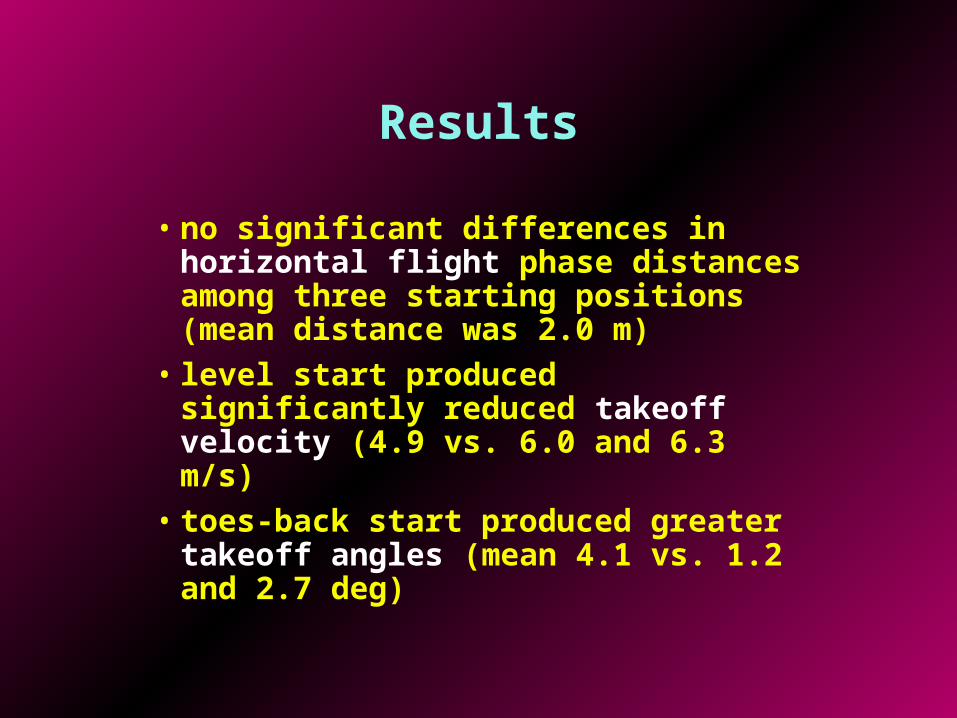
Results
• no significant differences in horizontal flight phase distances among three starting positions (mean distance was 2.0 m)
• level start produced significantly reduced takeoff velocity (4.9 vs. 6.0 and 6.3 m/s)
• toes-back start produced greater takeoff angles (mean 4.1 vs. 1.2 and 2.7 deg)

Stick-figures of Grab Start

Results - Moments
• greatest peak moments were hip extensors then hip flexors, then knee extensors and ankle plantar flexors and lastly shoulder, elbow and knee flexors
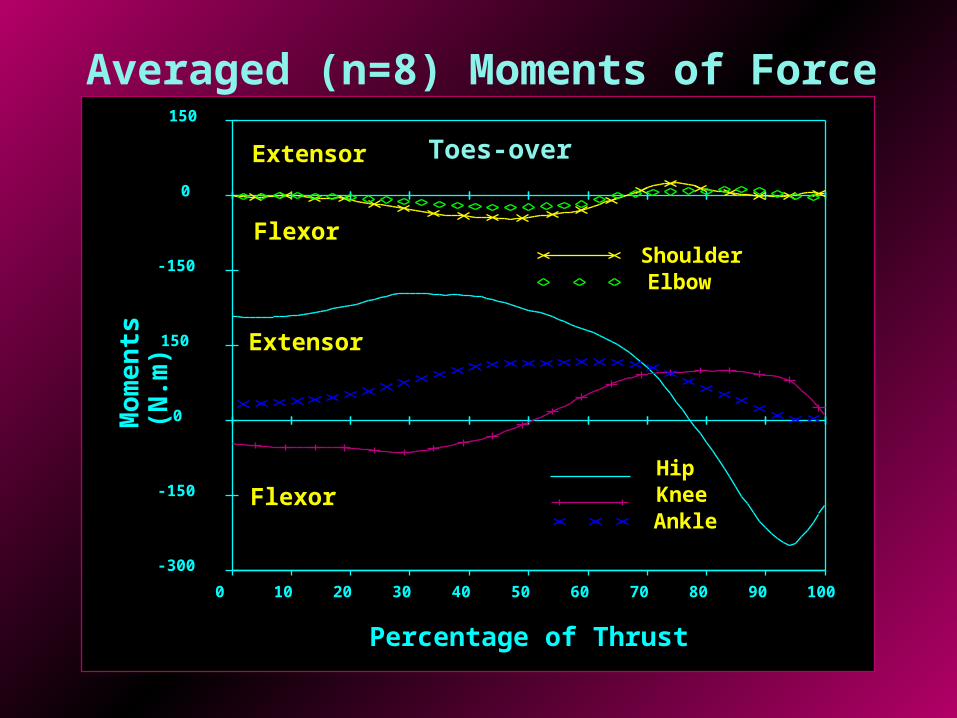
Averaged (n=8) Moments of Force
Percentage of Thrust
0 10 20 30 40 50 60 70 80 90 100
-300
-150
0
150
-150
0
150M
omen
ts
(N.m
)Toes-over
ShoulderElbow
HipKneeAnkle
Extensor
Flexor
Extensor
Flexor
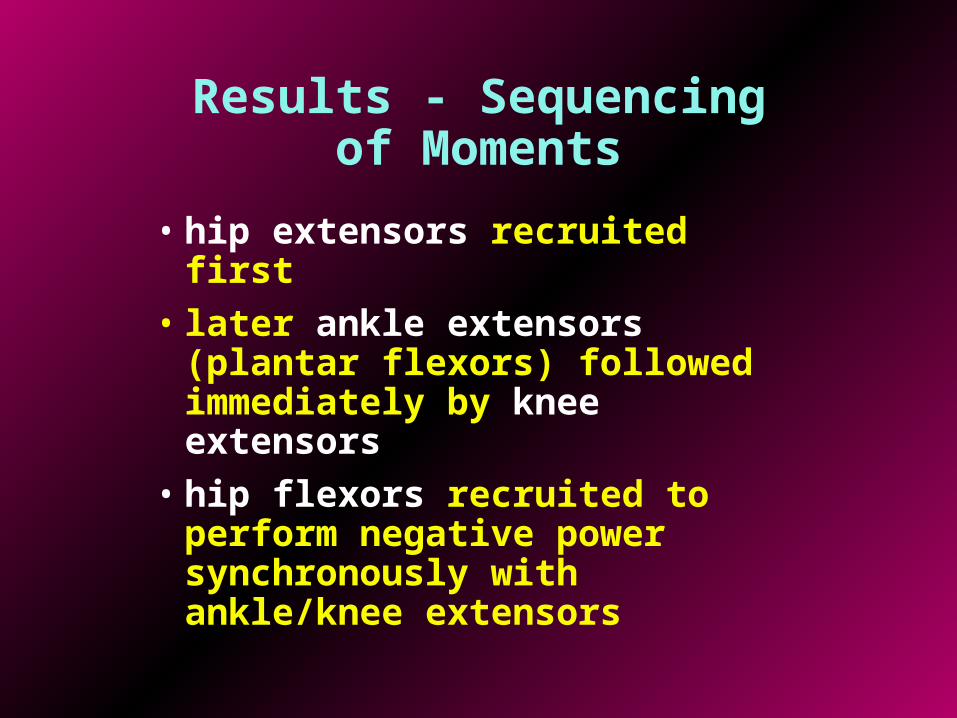
Results - Sequencing of Moments
• hip extensors recruited first
• later ankle extensors (plantar flexors) followed immediately by knee extensors
• hip flexors recruited to perform negative power synchronously with ankle/knee extensors
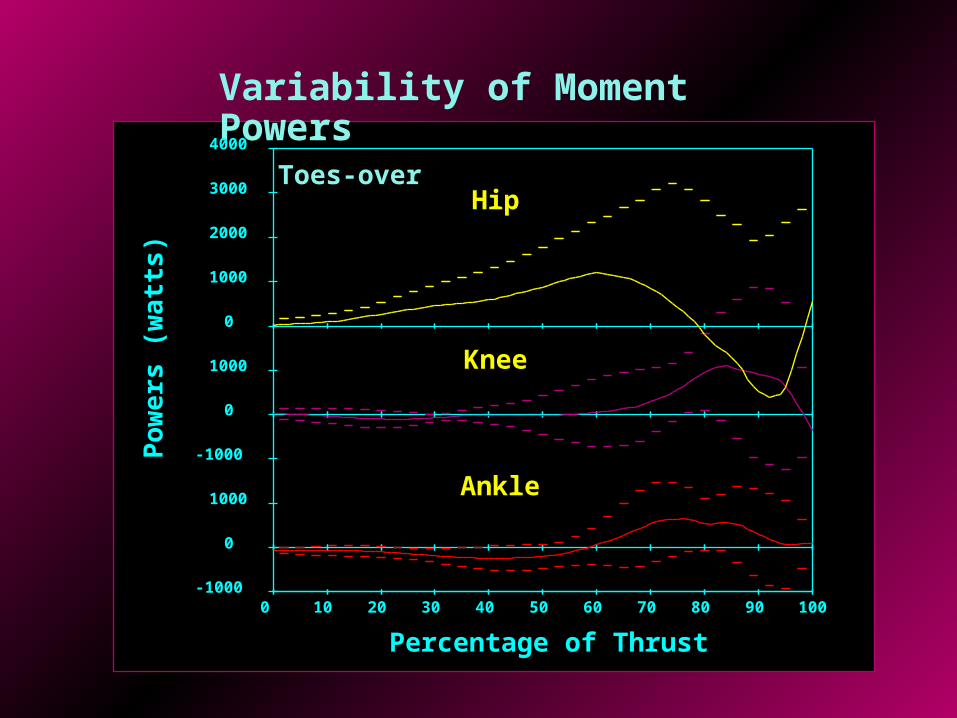
Variability of Moment Powers
0 10 20 30 40 50 60 70 80 90 100
Percentage of Thrust
-1000
0
1000
-1000
0
1000
0
1000
2000
3000
4000P
ower
s (w
atts
)Toes-over
Hip
Knee
Ankle
Results - Powers
• greatest variability with hip powers, least with ankle powers
• largest positive work by hip extensors, then knee extensors and then ankle plantar flexors
• hip flexors perform negative work prior to takeoff
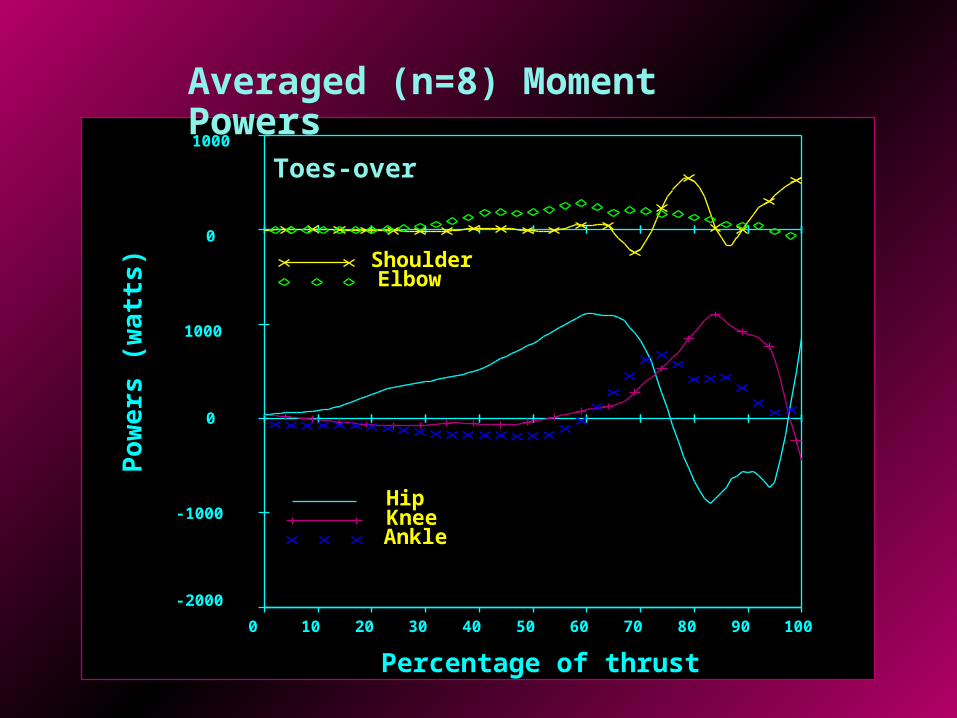
Averaged (n=8) Moment Powers
Percentage of thrust
-2000
-1000
0
1000
0
1000P
ower
s (w
atts
)
0 10 20 30 40 50 60 70 80 90 100
Toes-over
ShoulderElbow
HipKneeAnkle

Discussion
• some evidence to support proximal to distal sequencing (i.e., hips preceded knee and ankle)
• knee and ankle extensors recruited simultaneously (like vertical jumping)
• hip moments dominated thrust
• negative work by hip flexors transfer energy from upper body to whole body (transfer of momentum)