Embed Size (px)
Citation preview
1
Course
Power Quality - 3
Ljubljana, Slovenia2013/14
Prof. dr. Igor Papič[email protected]
Harmonics - design of power factor correction devices
Content
1st day 2nd day 3rd day 4th day 5th day
Session 1
Introduction to Power Quality • what is PQ • economic value • responsibilities
Harmonics – definitions • calculations • non-linear loads • harmonic
sequences
Harmonics - design of power factor correction devices • resonance points • filter design
Flicker case study • calculation of
flicker spreading in radial network
• variation of network parameters
Interruptions • definitions • reliability indices • improving
reliability
Session 2
Basic terms and definitions • voltage quality • continuity of
supply • commercial
quality
Propagation of harmonics • sources • consequences • cancellation
Flicker - basic terms • voltage variation • flicker frequency • sources • flickermeter
Voltage sags – definitions • characteristics • types • causes
Consequences of inadequate power quality • voltage quality • interruptions • costs
Session 3
PQ standards • EN 50 160 • other standards • limit values
Harmonics - resonances in network • parallel
resonance • series resonance
Flicker spreading • radial network • mashed network • simulation • examples
Propagation of voltage sags • transformer
connections • equipment
sensitivity • mitigation
Modern compensation devices • active and hybrid
compensators • series and shunt
compensators
Session 4
PQ monitoring • measurements • PQ analyzers • data analyses
Harmonics case study • calculation of
frequency impedance characteristics
Flicker mitigation • system solutions
– network enforcement
• compensation
Other voltage variations • unbalance • voltage
transients • overvoltages
Conclusions • PQ improvement
and costs • definition of
optimal solutions
Power Quality, Ljubljana, 2013/14 3
2
Design of PFC devices
• influence of impedance change– compensator impedance varies with the number of used
compensation stages (crossing of resonance points)– network impedance change has large influence on
frequency response– load impedance has minor influence on frequency
response• detuned filter
– series connection of inductor and capacitor– resonance frequency is below the characteristic harmonic
(141 Hz, 225 Hz)– good response under different operating conditions
Power Quality, Ljubljana, 2013/14 4
Influence of network impedance change
• frequency impedance characteristics– data for calculation of one supply transformer 20/0,4 kV
(two transformer in previous case)– short-circuit voltage
– rated power
– rated voltage
– ratio R/X
% 13,4=scu
kV 4,0kV; 20 == LVMV UU
4/1)/( =TRXR
MVA 63,0 x 1=nS
Power Quality, Ljubljana, 2013/14 5
Influence of network impedance change
• frequency impedance characteristics– calculation of parameters of one supply transformer
20/0,4 kV
TRTRTR
TR
TRsc
n
NNTR
TR
sc
n
LVTR
LfjRfjZXR
XRuS
UR
XRu
SUL
ππ
π
2)2(
m 54,2)/(1
)/(100
μH 4,32)/(1
1100100
2
2
2
2
+=
Ω=+
=
=+
=
Power Quality, Ljubljana, 2013/14 6
3
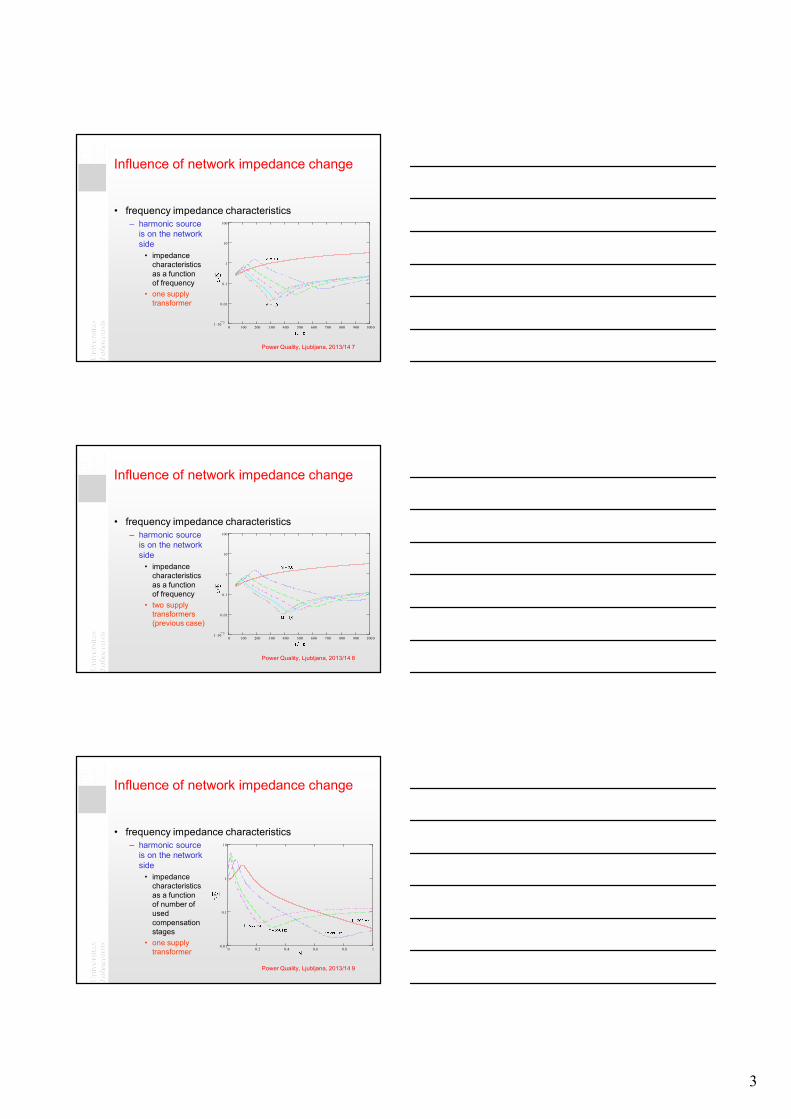
Influence of network impedance change
• frequency impedance characteristics– harmonic source
is on the network side
• impedance characteristics as a function of frequency
• one supply transformer
0 100 200 300 400 500 600 700 800 900 10001 .10 3
0.01
0.1
1
10
100
Power Quality, Ljubljana, 2013/14 7
Influence of network impedance change
• frequency impedance characteristics– harmonic source
is on the network side
• impedance characteristics as a function of frequency
• two supply transformers(previous case)
0 100 200 300 400 500 600 700 800 900 10001 .10 3
0.01
0.1
1
10
100
Power Quality, Ljubljana, 2013/14 8
Influence of network impedance change
• frequency impedance characteristics– harmonic source
is on the network side
• impedance characteristics as a function of number of used compensation stages
• one supply transformer 0 0.2 0.4 0.6 0.8 1
0.01
0.1
1
10
Power Quality, Ljubljana, 2013/14 9
4
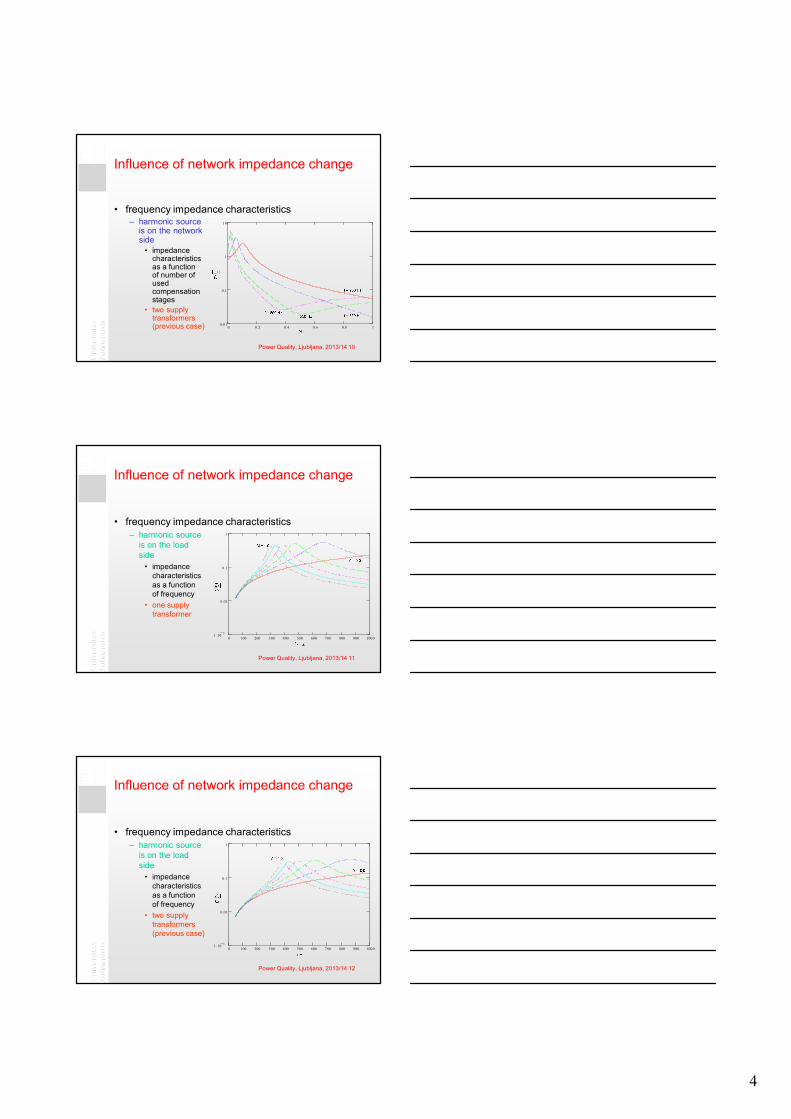
Influence of network impedance change
• frequency impedance characteristics– harmonic source
is on the network side
• impedance characteristics as a function of number of used compensation stages
• two supply transformers(previous case) 0 0.2 0.4 0.6 0.8 1
0.01
0.1
1
10
Power Quality, Ljubljana, 2013/14 10
Influence of network impedance change
• frequency impedance characteristics– harmonic source
is on the load side
• impedance characteristics as a function of frequency
• one supply transformer
0 100 200 300 400 500 600 700 800 900 10001 .10 3
0.01
0.1
1
Power Quality, Ljubljana, 2013/14 11
Influence of network impedance change
• frequency impedance characteristics– harmonic source
is on the load side
• impedance characteristics as a function of frequency
• two supply transformers(previous case)
0 100 200 300 400 500 600 700 800 900 10001 .10 3
0.01
0.1
1
Power Quality, Ljubljana, 2013/14 12

5
Influence of network impedance change
• frequency impedance characteristics– harmonic source
is on the load side
• impedance characteristics as a function of number of used compensation stages
• one supply transformer
0 0.2 0.4 0.6 0.8 10.01
0.1
1
Power Quality, Ljubljana, 2013/14 13
Influence of network impedance change
• frequency impedance characteristics– harmonic source
is on the load side
• impedance characteristics as a function of number of used compensation stages
• two supply transformers(previous case) 0 0.2 0.4 0.6 0.8 1
0.01
0.1
1
Power Quality, Ljubljana, 2013/14 14
Detuned filter
• frequency impedance characteristics– equivalent circuit with detuned filter
Power Quality, Ljubljana, 2013/14 15
6
Detuned filter
• frequency impedance characteristics– data for calculation of detuned filter
– rated voltage
– reactive power
– filter frequency
– ratio R/X of C
– ratio R/X of L
MVAr 40,0=fQ
kV 4,0=LVU
50/1)/( =fCXR
10/1)/( =fLXR
Hz) (225 Hz 141=rf
Power Quality, Ljubljana, 2013/14 16
Detuned filter
• frequency impedance characteristics– calculation of parameters of detuned filter
• detuned filter• 141 Hz, p = 12,5 %• 225 Hz, p = 5,0 %
( )( ) ( ) 125,0Hz 252;05,0Hz 141
502 2
2
2
22
==
===
ppff
CLprr
ff πωω
Power Quality, Ljubljana, 2013/14 17
Detuned filter
• frequency impedance characteristics– calculation of parameters of detuned filter
• detuned filter
( )
( ) ( )
( )( ) ( ) mH 066,0Hz 252;mH 183,0Hz 141
21
mF 57,7Hz 252;mF 96,6Hz 141100
1
2
2
==
=
==
−=
ff
frf
ff
LV
ff
LL
CfL
CCU
pQC
π
π
Power Quality, Ljubljana, 2013/14 18
7
Detuned filter
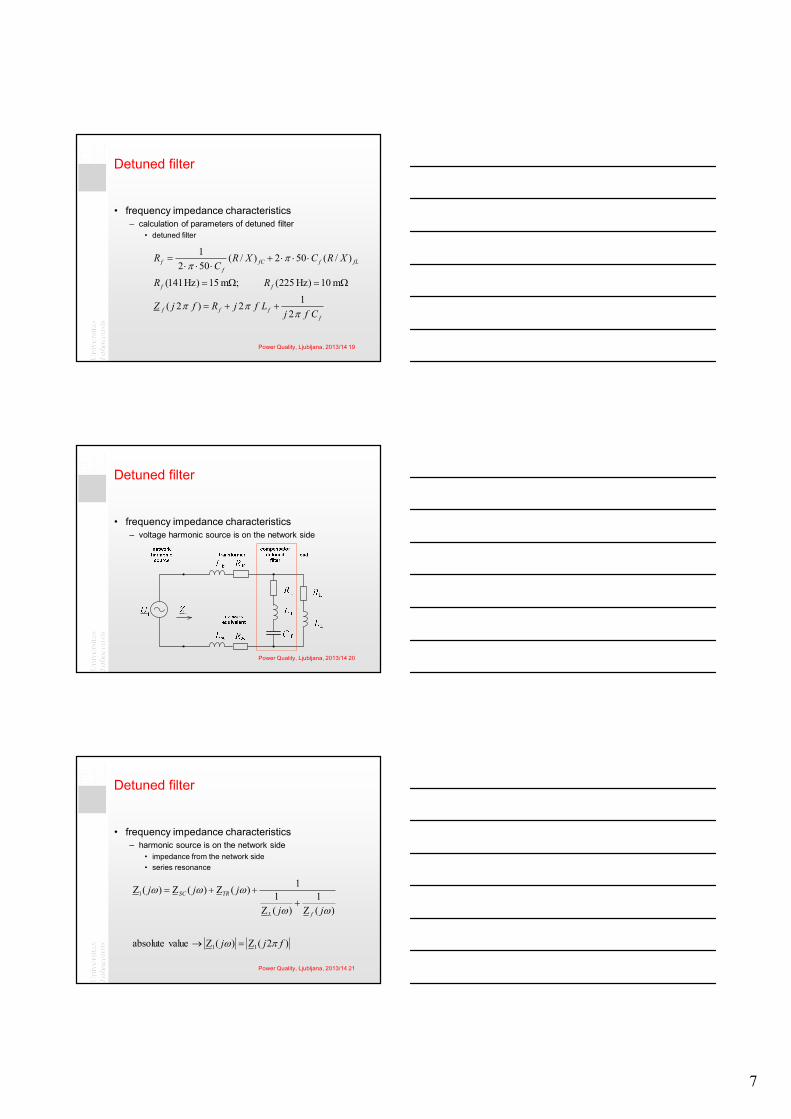
• frequency impedance characteristics– calculation of parameters of detuned filter
• detuned filter
ffff
ff
fLffCf
f
CfjLfjRfjZ
RR
XRCXRC
R
πππ
ππ
212)2(
m 10)Hz 225( ;m 15)Hz 141(
)/(502)/(5021
++=
Ω=Ω=
⋅⋅⋅+⋅⋅⋅
=
Power Quality, Ljubljana, 2013/14 19
Detuned filter
• frequency impedance characteristics– voltage harmonic source is on the network side
Power Quality, Ljubljana, 2013/14 20
Detuned filter
• frequency impedance characteristics– harmonic source is on the network side
• impedance from the network side• series resonance
)2(Z)(Z valueabsolute
)(Z1
)(Z1
1)(Z)(Z)(Z
11
1
fjj
jj
jjj
fL
TRSC
πω
ωω
ωωω
=→
+++=
Power Quality, Ljubljana, 2013/14 21
8
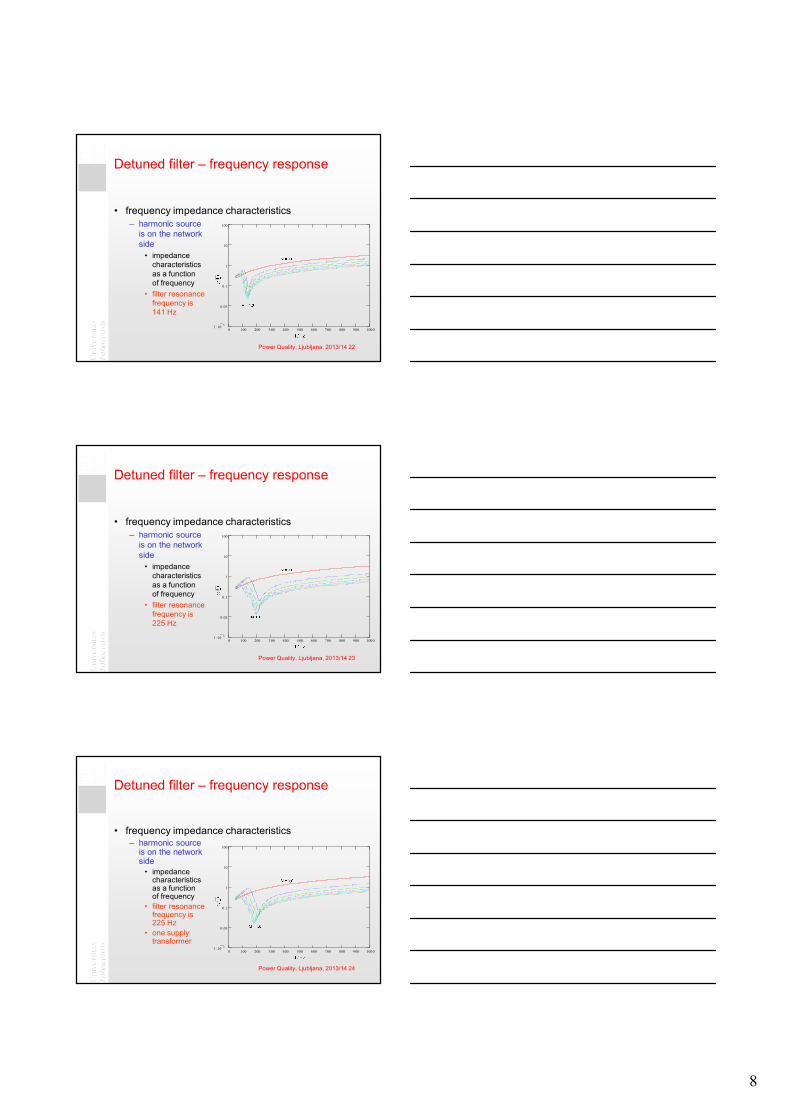
Detuned filter – frequency response
• frequency impedance characteristics– harmonic source
is on the network side
• impedance characteristics as a function of frequency
• filter resonance frequency is 141 Hz
0 100 200 300 400 500 600 700 800 900 10001 .10 3
0.01
0.1
1
10
100
Power Quality, Ljubljana, 2013/14 22
Detuned filter – frequency response
• frequency impedance characteristics– harmonic source
is on the network side
• impedance characteristics as a function of frequency
• filter resonance frequency is 225 Hz
0 100 200 300 400 500 600 700 800 900 10001 .10 3
0.01
0.1
1
10
100
Power Quality, Ljubljana, 2013/14 23
Detuned filter – frequency response
0 100 200 300 400 500 600 700 800 900 10001 .10 3
0.01
0.1
1
10
100
• frequency impedance characteristics– harmonic source
is on the network side
• impedance characteristics as a function of frequency
• filter resonance frequency is 225 Hz
• one supply transformer
Power Quality, Ljubljana, 2013/14 24
9
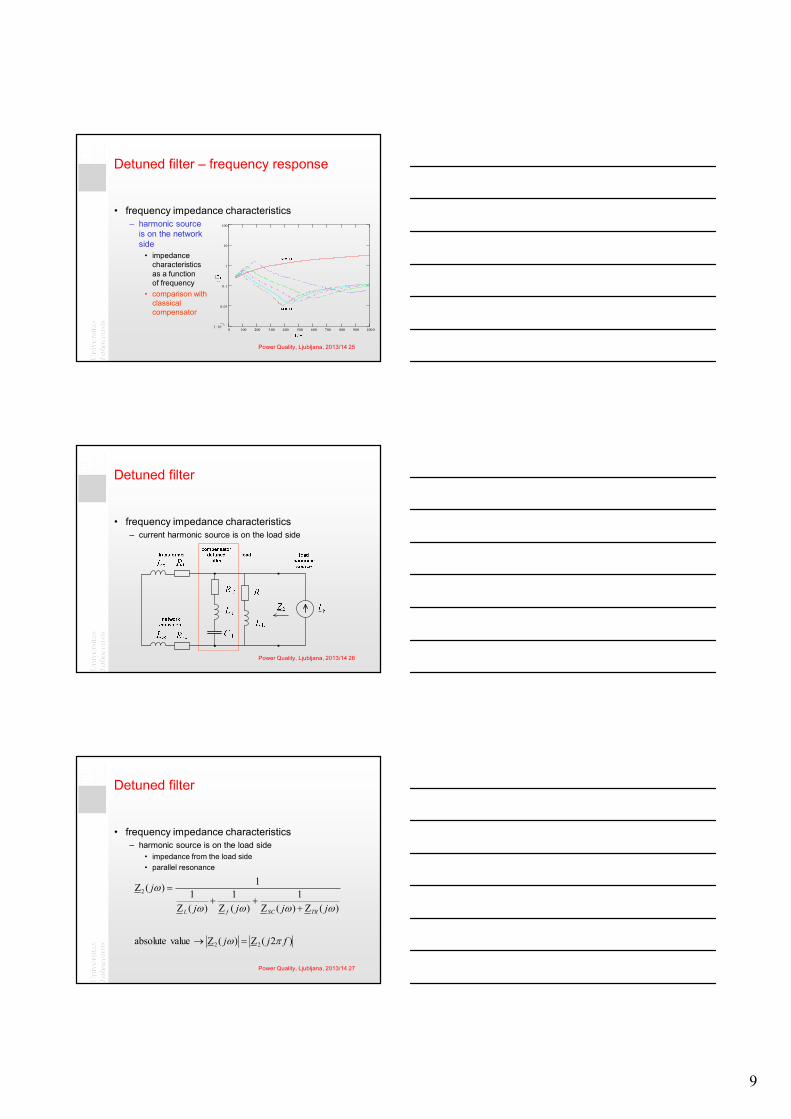
Detuned filter – frequency response
• frequency impedance characteristics– harmonic source
is on the network side
• impedance characteristics as a function of frequency
• comparison with classical compensator
0 100 200 300 400 500 600 700 800 900 10001 .10 3
0.01
0.1
1
10
100
Power Quality, Ljubljana, 2013/14 25
Detuned filter
• frequency impedance characteristics– current harmonic source is on the load side
Power Quality, Ljubljana, 2013/14 26
Detuned filter
• frequency impedance characteristics– harmonic source is on the load side
• impedance from the load side• parallel resonance
)2(Z)(Z valueabsolute
)(Z)(Z1
)(Z1
)(Z1
1)(Z
22
2
fjj
jjjj
j
TRSCfL
πω
ωωωω
ω
=→
+++
=
Power Quality, Ljubljana, 2013/14 27
10
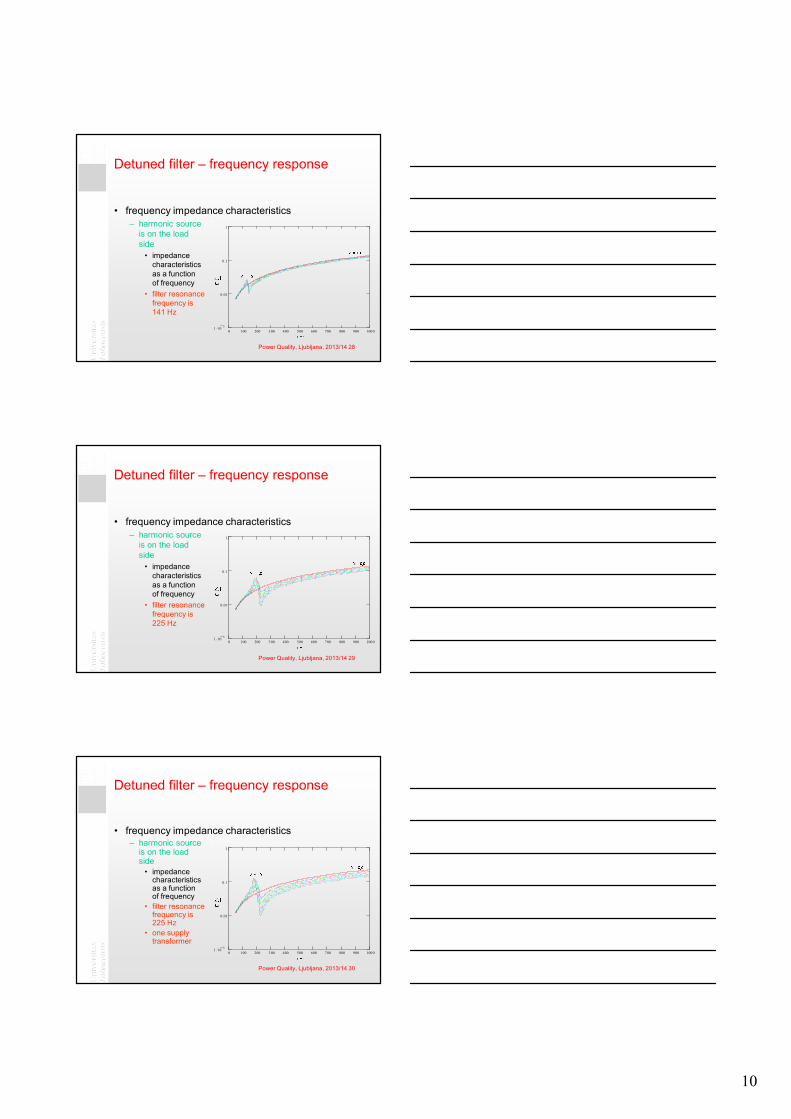
Detuned filter – frequency response
• frequency impedance characteristics– harmonic source
is on the load side
• impedance characteristics as a function of frequency
• filter resonance frequency is 141 Hz
0 100 200 300 400 500 600 700 800 900 10001 .10 3
0.01
0.1
1
Power Quality, Ljubljana, 2013/14 28
Detuned filter – frequency response
• frequency impedance characteristics– harmonic source
is on the load side
• impedance characteristics as a function of frequency
• filter resonance frequency is 225 Hz
0 100 200 300 400 500 600 700 800 900 10001 .10 3
0.01
0.1
1
Power Quality, Ljubljana, 2013/14 29
Detuned filter – frequency response
• frequency impedance characteristics– harmonic source
is on the load side
• impedance characteristics as a function of frequency
• filter resonance frequency is 225 Hz
• one supply transformer
0 100 200 300 400 500 600 700 800 900 10001 .10 3
0.01
0.1
1
Power Quality, Ljubljana, 2013/14 30
11
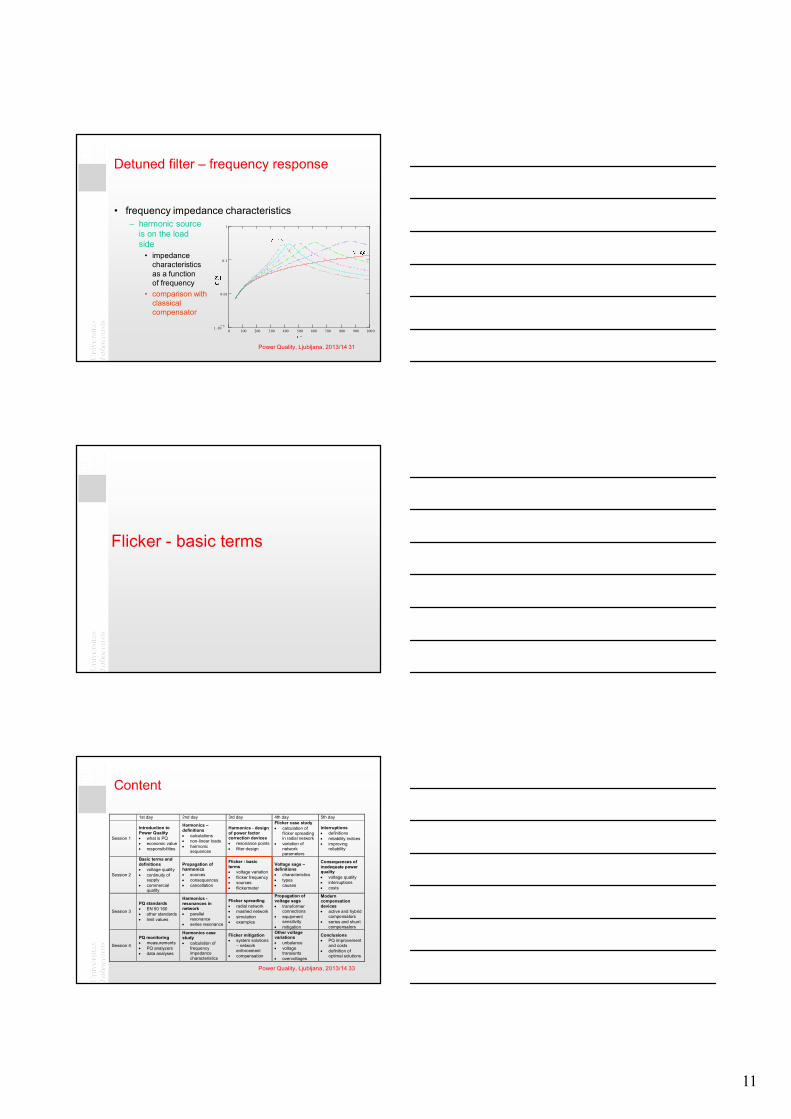
Detuned filter – frequency response
• frequency impedance characteristics– harmonic source
is on the load side
• impedance characteristics as a function of frequency
• comparison with classical compensator
0 100 200 300 400 500 600 700 800 900 10001 .10 3
0.01
0.1
1
Power Quality, Ljubljana, 2013/14 31
Flicker - basic terms
Content
1st day 2nd day 3rd day 4th day 5th day
Session 1
Introduction to Power Quality • what is PQ • economic value • responsibilities
Harmonics – definitions • calculations • non-linear loads • harmonic
sequences
Harmonics - design of power factor correction devices • resonance points • filter design
Flicker case study • calculation of
flicker spreading in radial network
• variation of network parameters
Interruptions • definitions • reliability indices • improving
reliability
Session 2
Basic terms and definitions • voltage quality • continuity of
supply • commercial
quality
Propagation of harmonics • sources • consequences • cancellation
Flicker - basic terms • voltage variation • flicker frequency • sources • flickermeter
Voltage sags – definitions • characteristics • types • causes
Consequences of inadequate power quality • voltage quality • interruptions • costs
Session 3
PQ standards • EN 50 160 • other standards • limit values
Harmonics - resonances in network • parallel
resonance • series resonance
Flicker spreading • radial network • mashed network • simulation • examples
Propagation of voltage sags • transformer
connections • equipment
sensitivity • mitigation
Modern compensation devices • active and hybrid
compensators • series and shunt
compensators
Session 4
PQ monitoring • measurements • PQ analyzers • data analyses
Harmonics case study • calculation of
frequency impedance characteristics
Flicker mitigation • system solutions
– network enforcement
• compensation
Other voltage variations • unbalance • voltage
transients • overvoltages
Conclusions • PQ improvement
and costs • definition of
optimal solutions
Power Quality, Ljubljana, 2013/14 33

12
Flicker – basic terms
• Voltage fluctuation• What is flicker?• Flicker frequency• Causes of flicker• Flicker evaluation• Flicker meter• Compatibility and planning levels
Power Quality, Ljubljana, 2013/14 34
Voltage fluctuation
• voltage fluctuation – a series of voltage changes or a cyclic variation of the voltage envelope
• voltage fluctuations (rms value) can cause perceptible (low frequency) light flicker depending on the magnitude and frequency of the variation
Power Quality, Ljubljana, 2013/14 35
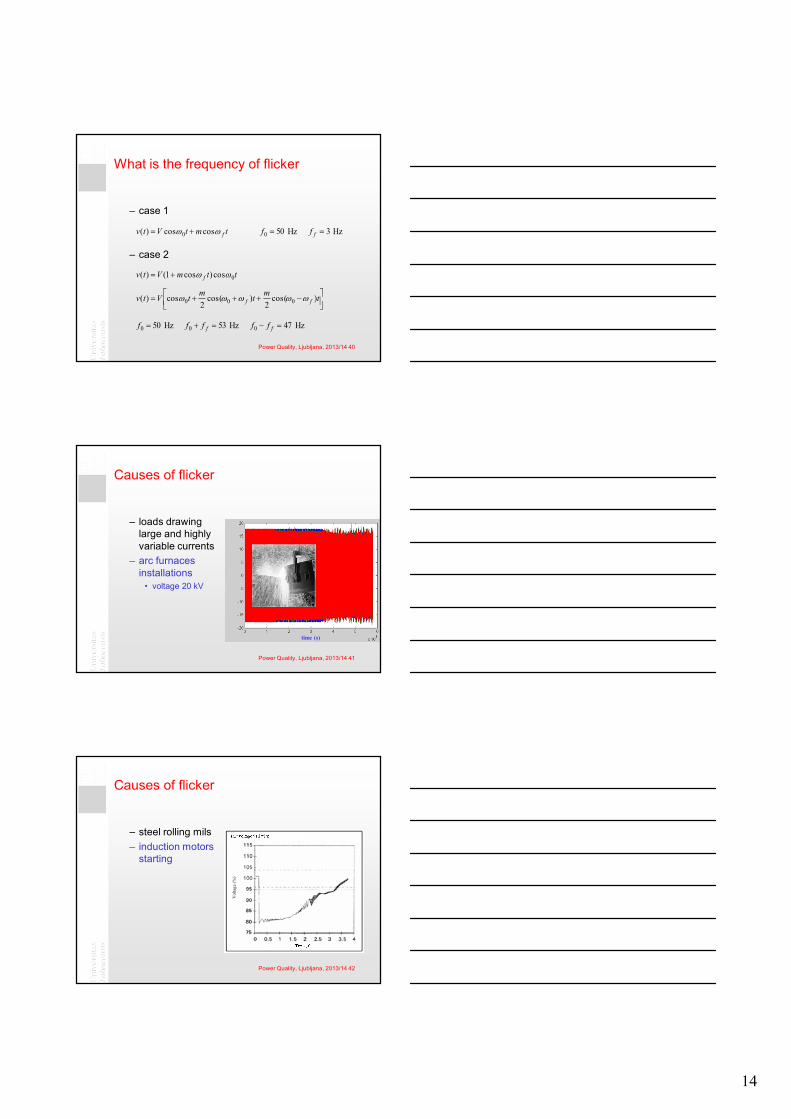
What is flicker?
• flicker – impression of unsteadiness of visual sensation induced by a light stimulus whose luminance or spectral distribution fluctuates with time
• the range of modulation frequency that causes noticeable flicker is in the 0.5-25 Hz band, voltage variations are less than 10 %
• the most annoying flicker occurs at the voltage fluctuation with the frequency 8.8 Hz.
• flicker represents one of the largest problems related to power quality in the power system of Slovenia
Power Quality, Ljubljana, 2013/14 36
13
What is flicker?
Power Quality, Ljubljana, 2013/14 37
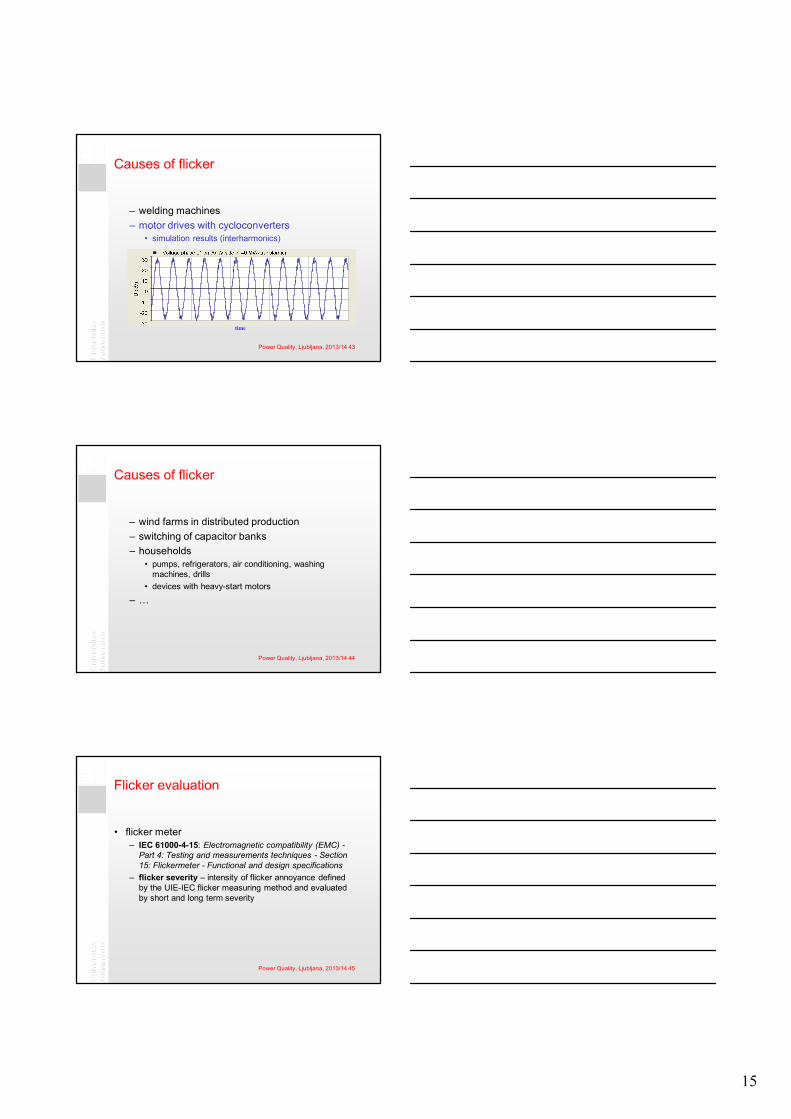
Flicker frequency – case 1
• What is the frequency of flicker?– assume sinusoidal modulation– what signal does represent flicker with frequency 3 Hz
Power Quality, Ljubljana, 2013/14 38
Flicker frequency – case 2
– or
Power Quality, Ljubljana, 2013/14 39
14
What is the frequency of flicker
– case 1
– case 2
tmtVtv fωω coscos)( 0 += Hz3 Hz500 == fff
ttmVtv f 0cos)cos1()( ωω+=
⎥⎦⎤
⎢⎣⎡ −+++= tmtmtVtv ff )cos(
2)cos(
2cos)( 000 ωωωωω
Hz47 Hz53 Hz50 000 =−=+= ff fffff
Power Quality, Ljubljana, 2013/14 40
Causes of flicker
– loads drawing large and highly variable currents
– arc furnaces installations
• voltage 20 kV
time (s)
Power Quality, Ljubljana, 2013/14 41
Causes of flicker
– steel rolling mils– induction motors
starting
Vol
tage
(%)
Power Quality, Ljubljana, 2013/14 42
15
Causes of flicker
– welding machines– motor drives with cycloconverters
• simulation results (interharmonics)
time
Power Quality, Ljubljana, 2013/14 43
Causes of flicker
– wind farms in distributed production– switching of capacitor banks – households
• pumps, refrigerators, air conditioning, washing machines, drills
• devices with heavy-start motors
– …
Power Quality, Ljubljana, 2013/14 44
Flicker evaluation
• flicker meter– IEC 61000-4-15: Electromagnetic compatibility (EMC) -
Part 4: Testing and measurements techniques - Section 15: Flickermeter - Functional and design specifications
– flicker severity – intensity of flicker annoyance defined by the UIE-IEC flicker measuring method and evaluated by short and long term severity
Power Quality, Ljubljana, 2013/14 45

16
Flicker evaluation
• flicker meter– short term severity Pst – measured over a period of 10
minutes– long term severity Plt – calculated from a sequence of
12 Pst values over a two hour interval, according to the following expression:
3
12
1
3st
lt 12
∑== i
iPP
Power Quality, Ljubljana, 2013/14 46
Flicker evaluation
– comparison between Plt and Pst
Power Quality, Ljubljana, 2013/14 47
Scheme of a flicker meter
input voltage adaptor
demodulator
weighting filter
BLOCK 1 BLOCK 2 BLOCK 3 BLOCK 4 BLOCK 5
squaring and
smoothing
dB
35
0
0,05
-3
-60
Hz
range selector
∆U / U ( % )
X2
P
Pst and Plt
calculation of
Pst and
Plt
statistical evaluation
voltage
mesurement
simulation of lamp-eye-brain response
Hz 8,8
1
0
Power Quality, Ljubljana, 2013/14 48
17
Scheme of a flicker meter
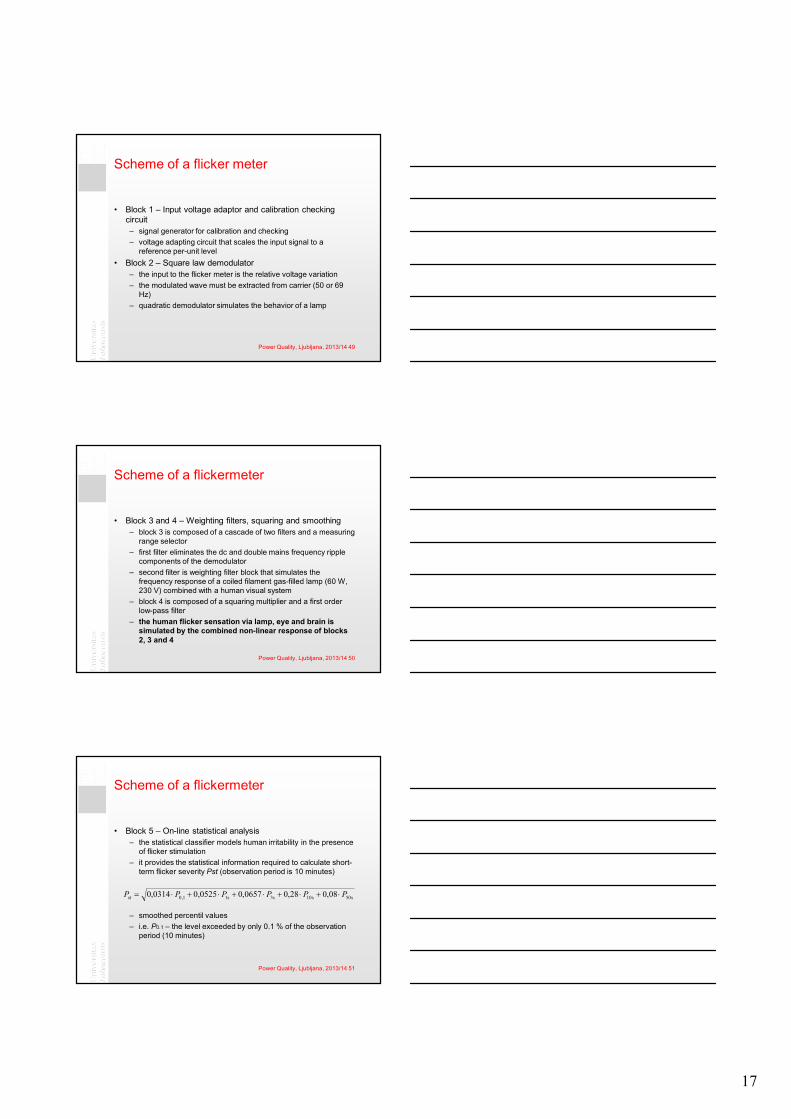
• Block 1 – Input voltage adaptor and calibration checking circuit– signal generator for calibration and checking– voltage adapting circuit that scales the input signal to a
reference per-unit level• Block 2 – Square law demodulator
– the input to the flicker meter is the relative voltage variation– the modulated wave must be extracted from carrier (50 or 69
Hz)– quadratic demodulator simulates the behavior of a lamp
Power Quality, Ljubljana, 2013/14 49
Scheme of a flickermeter
• Block 3 and 4 – Weighting filters, squaring and smoothing– block 3 is composed of a cascade of two filters and a measuring
range selector– first filter eliminates the dc and double mains frequency ripple
components of the demodulator– second filter is weighting filter block that simulates the
frequency response of a coiled filament gas-filled lamp (60 W, 230 V) combined with a human visual system
– block 4 is composed of a squaring multiplier and a first order low-pass filter
– the human flicker sensation via lamp, eye and brain is simulated by the combined non-linear response of blocks 2, 3 and 4
Power Quality, Ljubljana, 2013/14 50
Scheme of a flickermeter
• Block 5 – On-line statistical analysis– the statistical classifier models human irritability in the presence
of flicker stimulation– it provides the statistical information required to calculate short-
term flicker severity Pst (observation period is 10 minutes)
– smoothed percentil values– i.e. P0.1 – the level exceeded by only 0.1 % of the observation
period (10 minutes)
s50s10s3s11,0st 08,028,00657,00525,00314,0 PPPPPP ⋅+⋅+⋅+⋅+⋅=
Power Quality, Ljubljana, 2013/14 51
18
Flicker value
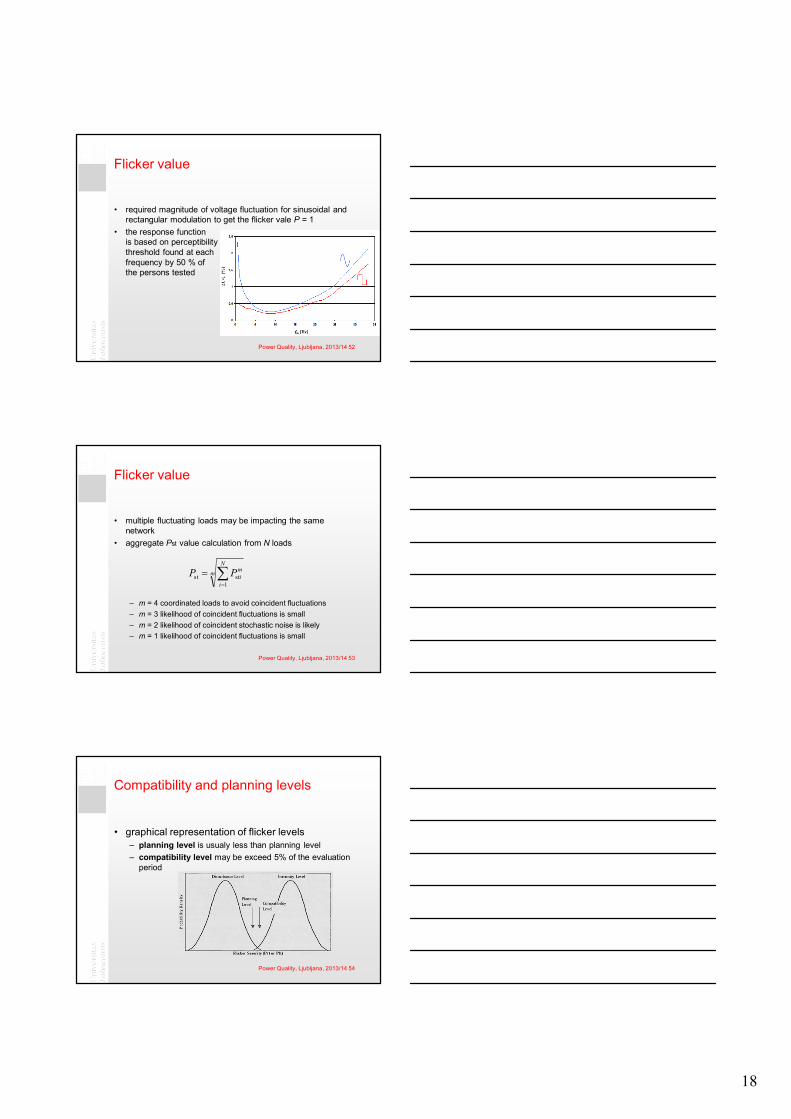
• required magnitude of voltage fluctuation for sinusoidal and rectangular modulation to get the flicker vale P = 1
• the response function is based on perceptibility threshold found at each frequency by 50 % of the persons tested
Power Quality, Ljubljana, 2013/14 52
Flicker value
• multiple fluctuating loads may be impacting the same network
• aggregate Pst value calculation from N loads
– m = 4 coordinated loads to avoid coincident fluctuations– m = 3 likelihood of coincident fluctuations is small– m = 2 likelihood of coincident stochastic noise is likely– m = 1 likelihood of coincident fluctuations is small
mN
i
miPP ∑
=
=1
stst
Power Quality, Ljubljana, 2013/14 53
Compatibility and planning levels
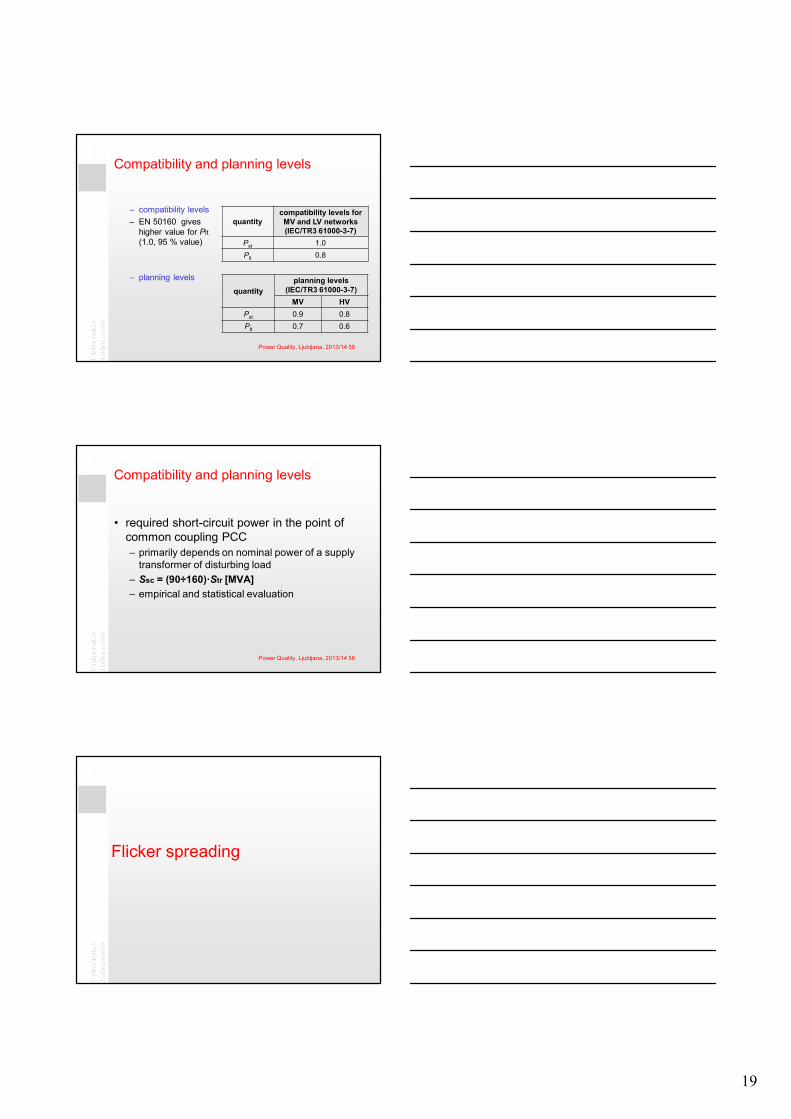
• graphical representation of flicker levels– planning level is usualy less than planning level– compatibility level may be exceed 5% of the evaluation
period
Power Quality, Ljubljana, 2013/14 54
19
Compatibility and planning levels
– compatibility levels– EN 50160 gives
higher value for Plt(1.0, 95 % value)
– planning levels
quantitycompatibility levels for MV and LV networks (IEC/TR3 61000-3-7)
Pst 1.0Plt 0.8
quantityplanning levels
(IEC/TR3 61000-3-7)MV HV
Pst 0.9 0.8Plt 0.7 0.6
Power Quality, Ljubljana, 2013/14 55
Compatibility and planning levels
• required short-circuit power in the point of common coupling PCC– primarily depends on nominal power of a supply
transformer of disturbing load– Ssc = (90÷160)·Str [MVA]– empirical and statistical evaluation
Power Quality, Ljubljana, 2013/14 56
Flicker spreading
20
Content
1st day 2nd day 3rd day 4th day 5th day
Session 1
Introduction to Power Quality • what is PQ • economic value • responsibilities
Harmonics – definitions • calculations • non-linear loads • harmonic
sequences
Harmonics - design of power factor correction devices • resonance points • filter design
Flicker case study • calculation of
flicker spreading in radial network
• variation of network parameters
Interruptions • definitions • reliability indices • improving
reliability
Session 2
Basic terms and definitions • voltage quality • continuity of
supply • commercial
quality
Propagation of harmonics • sources • consequences • cancellation
Flicker - basic terms • voltage variation • flicker frequency • sources • flickermeter
Voltage sags – definitions • characteristics • types • causes
Consequences of inadequate power quality • voltage quality • interruptions • costs
Session 3
PQ standards • EN 50 160 • other standards • limit values
Harmonics - resonances in network • parallel
resonance • series resonance
Flicker spreading • radial network • mashed network • simulation • examples
Propagation of voltage sags • transformer
connections • equipment
sensitivity • mitigation
Modern compensation devices • active and hybrid
compensators • series and shunt
compensators
Session 4
PQ monitoring • measurements • PQ analyzers • data analyses
Harmonics case study • calculation of
frequency impedance characteristics
Flicker mitigation • system solutions
– network enforcement
• compensation
Other voltage variations • unbalance • voltage
transients • overvoltages
Conclusions • PQ improvement
and costs • definition of
optimal solutions
Power Quality, Ljubljana, 2013/14 58
Flicker spreading
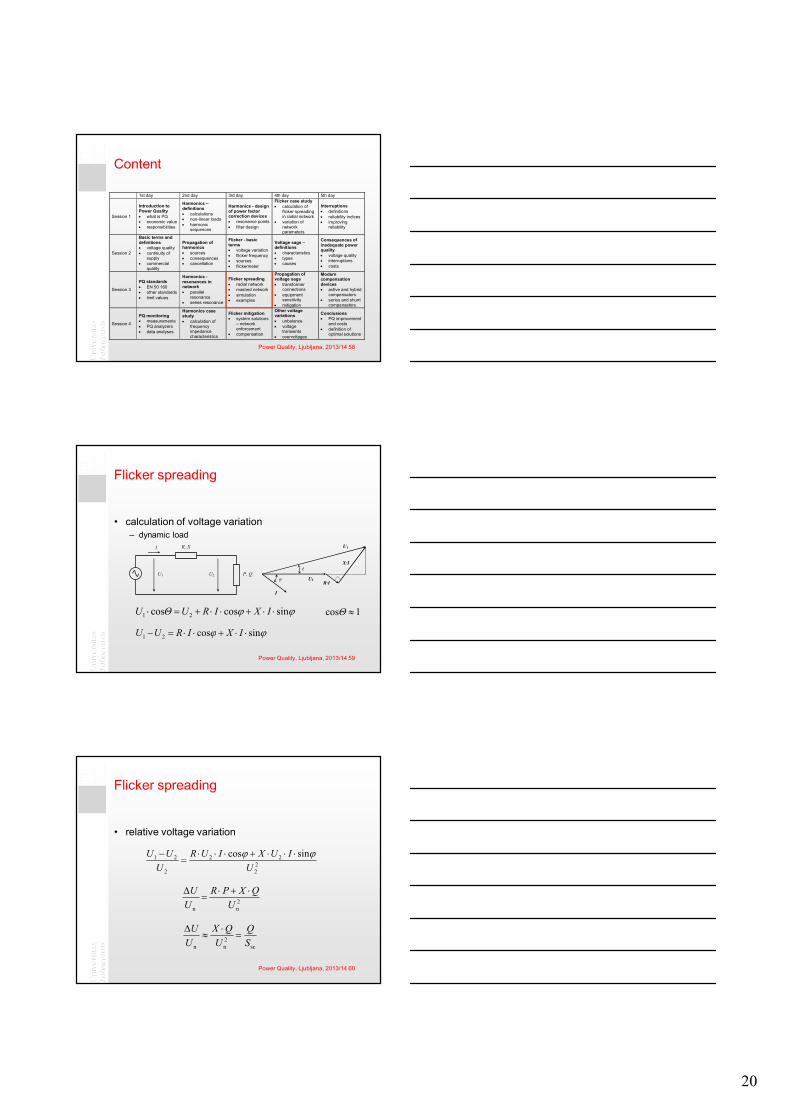
• calculation of voltage variation– dynamic load
X·I
φ
θ
R·I
U1
U2
I
I
U1 U2
R, X
P, Q
ϕϕ sincoscos 21 ⋅⋅+⋅⋅+=⋅ IXIRUΘU
ϕϕ sincos21 ⋅⋅+⋅⋅=− IXIRUU
1cos ≈Θ
Power Quality, Ljubljana, 2013/14 59
Flicker spreading
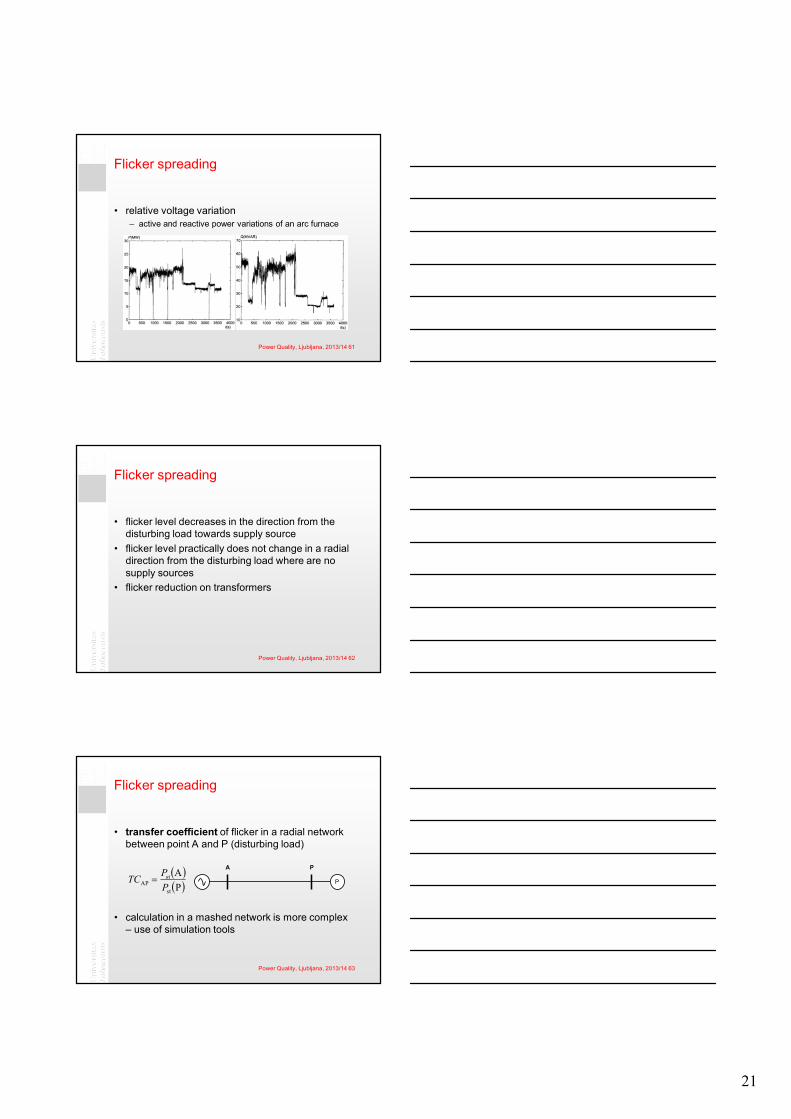
• relative voltage variation
22
22
2
21 sincosU
IUXIURU
UU ϕϕ ⋅⋅⋅+⋅⋅⋅=
−
2nn U
QXPRU
U ⋅+⋅=
Δ
sc2nn S
QU
QXU
U=
⋅≈
Δ
Power Quality, Ljubljana, 2013/14 60
21
Flicker spreading
• relative voltage variation– active and reactive power variations of an arc furnace
Power Quality, Ljubljana, 2013/14 61
Flicker spreading
• flicker level decreases in the direction from the disturbing load towards supply source
• flicker level practically does not change in a radial direction from the disturbing load where are no supply sources
• flicker reduction on transformers
Power Quality, Ljubljana, 2013/14 62
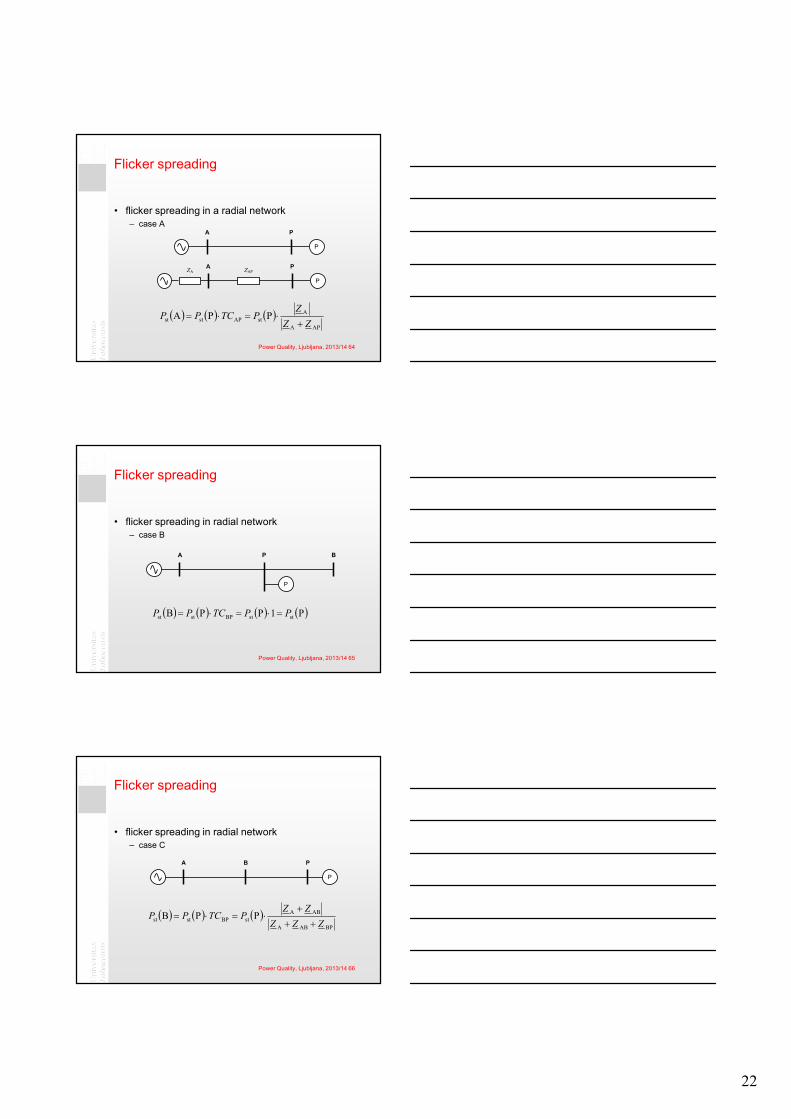
Flicker spreading
• transfer coefficient of flicker in a radial network between point A and P (disturbing load)
• calculation in a mashed network is more complex – use of simulation tools
( )( )PA
st
stAP P
PTC = A P
P
Power Quality, Ljubljana, 2013/14 63
22
Flicker spreading
• flicker spreading in a radial network– case A
A P
P
A P
P
ZA ZAP
( ) ( ) ( )APA
AstAPstst PPA
ZZZ
PTCPP+
⋅=⋅=
Power Quality, Ljubljana, 2013/14 64
Flicker spreading
• flicker spreading in radial network– case B
A P
P
B
( ) ( ) ( ) ( )P1PPB ststBPstst PPTCPP =⋅=⋅=
Power Quality, Ljubljana, 2013/14 65
Flicker spreading
• flicker spreading in radial network– case C
A B
P
P
( ) ( ) ( )BPABA
ABAstBPstst PPB
ZZZZZ
PTCPP++
+⋅=⋅=
Power Quality, Ljubljana, 2013/14 66

23
Flicker spreading
• flicker spreading in radial network– case D
A P
P B
( ) ( ) ( )( ) ( ) APstAPst
BAAPstBPstst
P1PPPB
TCPTCPTCTCPTCPP
⋅=⋅⋅==⋅⋅=⋅=
Power Quality, Ljubljana, 2013/14 67
Simulation of flicker spreading
• steady-state calculation– model of transmission system– switch on/off of the load– change of voltage magnitudes– injection of load current
• dynamic simulations– model of transmission system– model of arc furnace– model of flicker meter– Influence of generator voltage controllers – models of compensation devices
• calibration of simulation model wit measurements results• calculation of flicker levels for all buses
Power Quality, Ljubljana, 2013/14 68
Flicker spreading
• flicker spreading in mashed network– load flow method– two states of s disturbing load (0,1)– calculation of relative voltage drops– calculation of transfer coefficients
2,1,0
,1,0
xx
xx
x
xx VV
VVVVv
+
−=
Δ=Δ
j
iij v
vkvΔΔ
=
Power Quality, Ljubljana, 2013/14 69
24
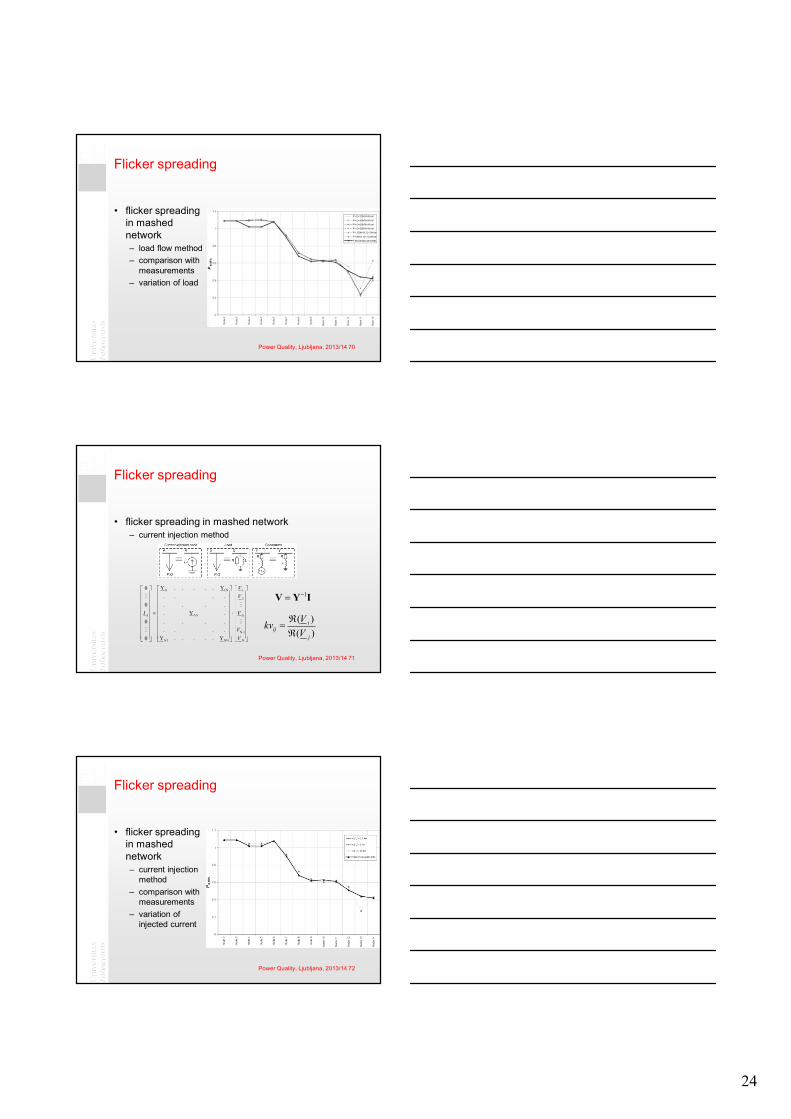
Flicker spreading
• flicker spreading in mashed network– load flow method– comparison with
measurements– variation of load
Power Quality, Ljubljana, 2013/14 70
Flicker spreading
• flicker spreading in mashed network– current injection method
11 1N 1
2
AAA A
N-1
N1 NN N
Y . . . . . Y0. . . .. . . .0. Y .. . . .0. . . .
Y . . . . . Y0
VV
VI
VV
⎡ ⎤⎡ ⎤⎡ ⎤⎢ ⎥⎢ ⎥⎢ ⎥⎢ ⎥⎢ ⎥⎢ ⎥⎢ ⎥⎢ ⎥⎢ ⎥⎢ ⎥⎢ ⎥⎢ ⎥ = ⋅ ⎢ ⎥⎢ ⎥⎢ ⎥⎢ ⎥⎢ ⎥⎢ ⎥⎢ ⎥⎢ ⎥⎢ ⎥⎢ ⎥⎢ ⎥⎢ ⎥⎢ ⎥⎢ ⎥⎢ ⎥⎣ ⎦ ⎣ ⎦ ⎣ ⎦
M
M
M
M )()(
j
iij V
Vkvℜℜ
=
IYV 1−=
Power Quality, Ljubljana, 2013/14 71
Flicker spreading
• flicker spreading in mashed network– current injection
method– comparison with
measurements– variation of
injected current
Power Quality, Ljubljana, 2013/14 72

25
Flicker spreading
• flicker spreading through transformers– in a radial direction from the disturbing load towards
lower voltage levels (first approximation is value 1)– transfer coefficient of flicker from EHV to HV level is
approximately 0.8– transfer coefficient of flicker from HV to MV level is
approximately 0.9 (worst case)– transfer coefficient of flicker from MV to LV level is
approximately 1
Power Quality, Ljubljana, 2013/14 73
Example of flicker spreading analysis
• measurement campaign in Slovenian transmission network– 31 locations– analysis of measurement results
• simulation of flicker spreading– network model– calibration of the model wit measurement results– simulation of flicker spreading in all nodes– present situation– future situation (2020)– analysis of compensation measures
Power Quality, Ljubljana, 2013/14 74
Flicker measurement locations
Power Quality, Ljubljana, 2013/14 75
26
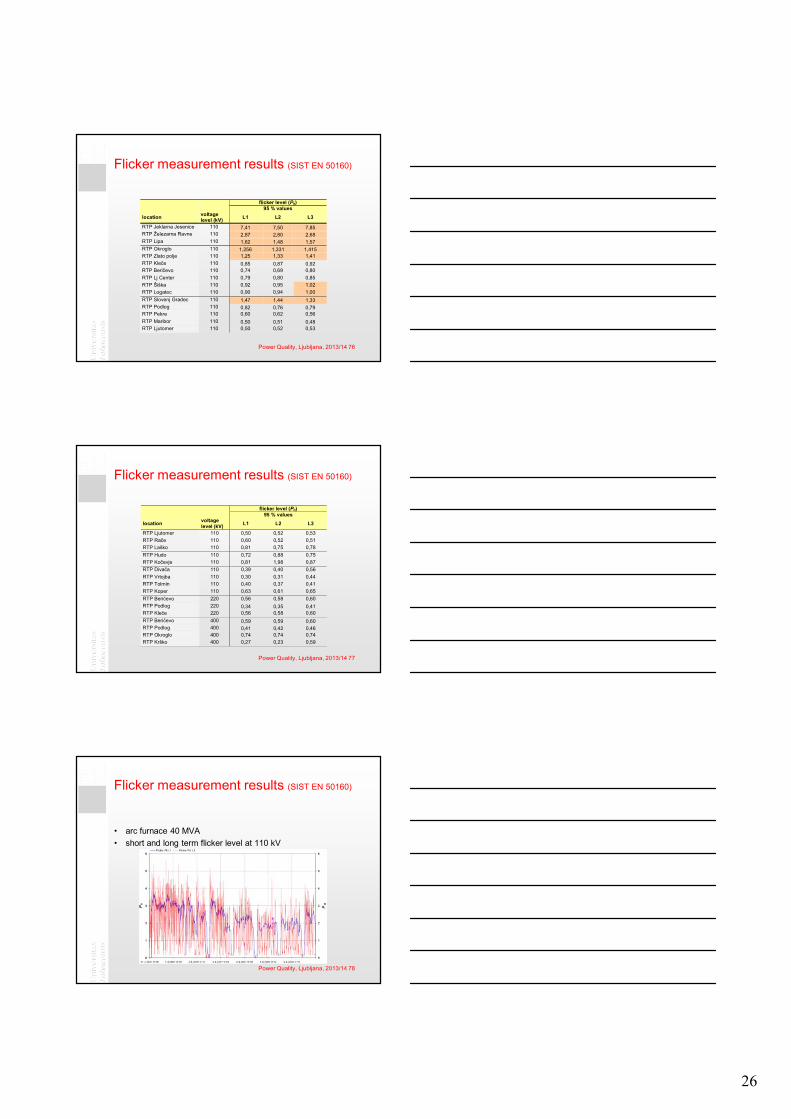
Flicker measurement results (SIST EN 50160)
flicker level (Plt) 95 % values location voltage
level (kV) L1 L2 L3
RTP Jeklarna Jesenice 110 7,41 7,50 7,85 RTP Železarna Ravne 110 2,87 2,80 2,68 RTP Lipa 110 1,62 1,48 1,57 RTP Okroglo 110 1,256 1,331 1,415 RTP Zlato polje 110 1,25 1,33 1,41 RTP Kleče 110 0,85 0,87 0,92 RTP Beričevo 110 0,74 0,69 0,80 RTP Lj Center 110 0,79 0,80 0,85 RTP Šiška 110 0,92 0,95 1,02 RTP Logatec 110 0,90 0,94 1,00 RTP Slovenj Gradec 110 1,47 1,44 1,33 RTP Podlog 110 0,82 0,76 0,79 RTP Pekre 110 0,60 0,62 0,56 RTP Maribor 110 0,50 0,51 0,48 RTP Ljutomer 110 0,50 0,52 0,53
Power Quality, Ljubljana, 2013/14 76
Flicker measurement results (SIST EN 50160)
flicker level (Plt) 95 % values location voltage
level (kV) L1 L2 L3
RTP Ljutomer 110 0,50 0,52 0,53 RTP Rače 110 0,60 0,52 0,51 RTP Laško 110 0,81 0,75 0,78 RTP Hudo 110 0,72 0,88 0,75 RTP Kočevje 110 0,81 1,98 0,87 RTP Divača 110 0,39 0,40 0,56 RTP Vrtojba 110 0,30 0,31 0,44 RTP Tolmin 110 0,40 0,37 0,41 RTP Koper 110 0,63 0,61 0,65 RTP Beričevo 220 0,56 0,58 0,60 RTP Podlog 220 0,34 0,35 0,41 RTP Kleče 220 0,56 0,58 0,60 RTP Beričevo 400 0,59 0,59 0,60 RTP Podlog 400 0,41 0,42 0,46 RTP Okroglo 400 0,74 0,74 0,74 RTP Krško 400 0,27 0,23 0,59
Power Quality, Ljubljana, 2013/14 77
Flicker measurement results (SIST EN 50160)
• arc furnace 40 MVA• short and long term flicker level at 110 kV
Power Quality, Ljubljana, 2013/14 78
27
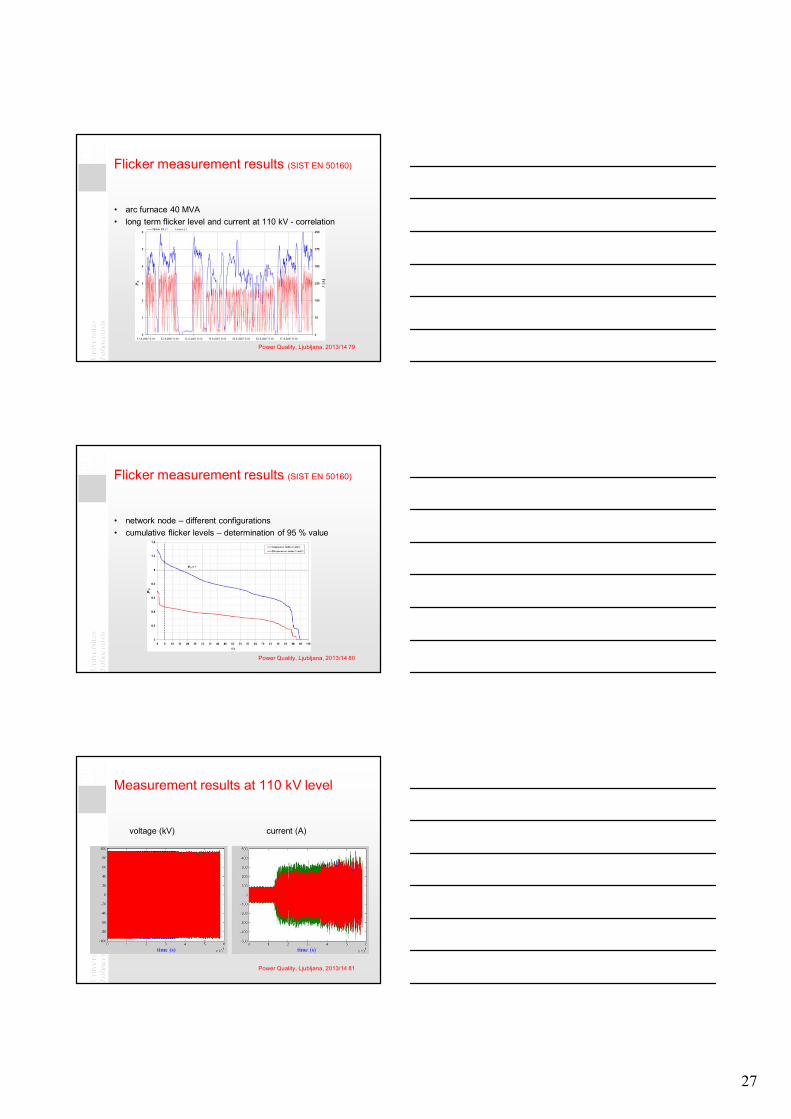
Flicker measurement results (SIST EN 50160)
• arc furnace 40 MVA• long term flicker level and current at 110 kV - correlation
Power Quality, Ljubljana, 2013/14 79
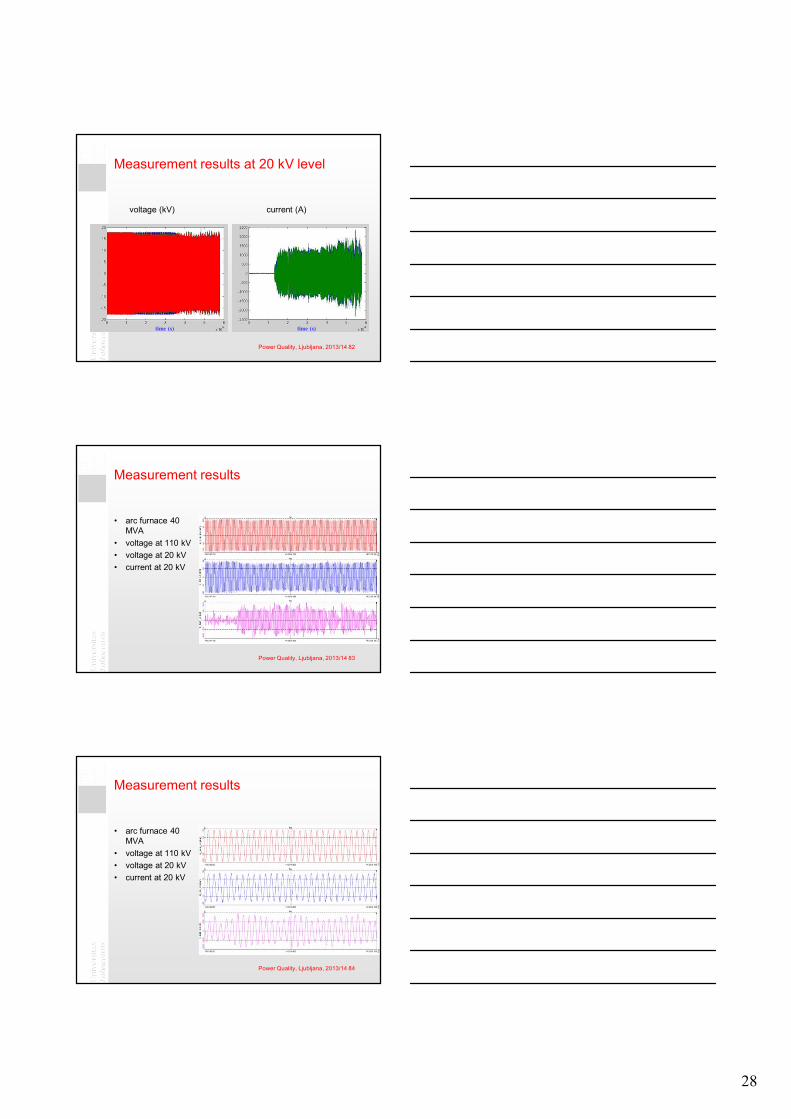
Flicker measurement results (SIST EN 50160)
• network node – different configurations• cumulative flicker levels – determination of 95 % value
Power Quality, Ljubljana, 2013/14 80
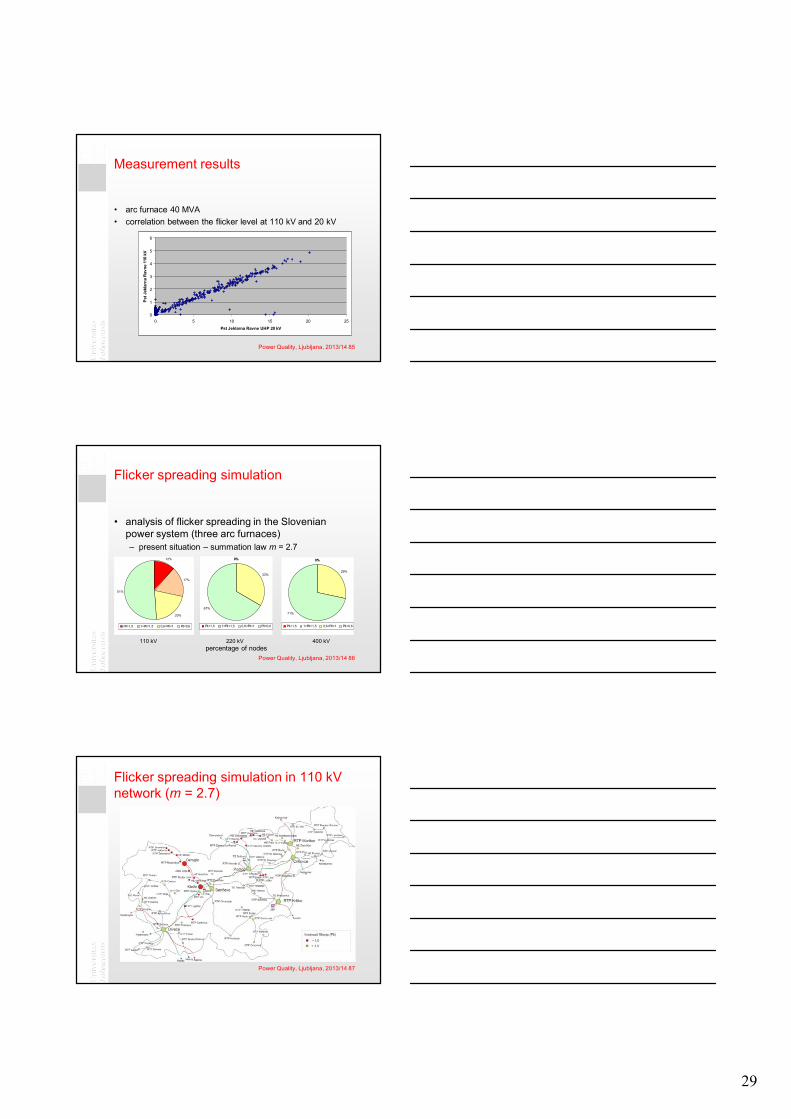
Measurement results at 110 kV level
voltage (kV) current (A)
time (s)time (s)
Power Quality, Ljubljana, 2013/14 81
28
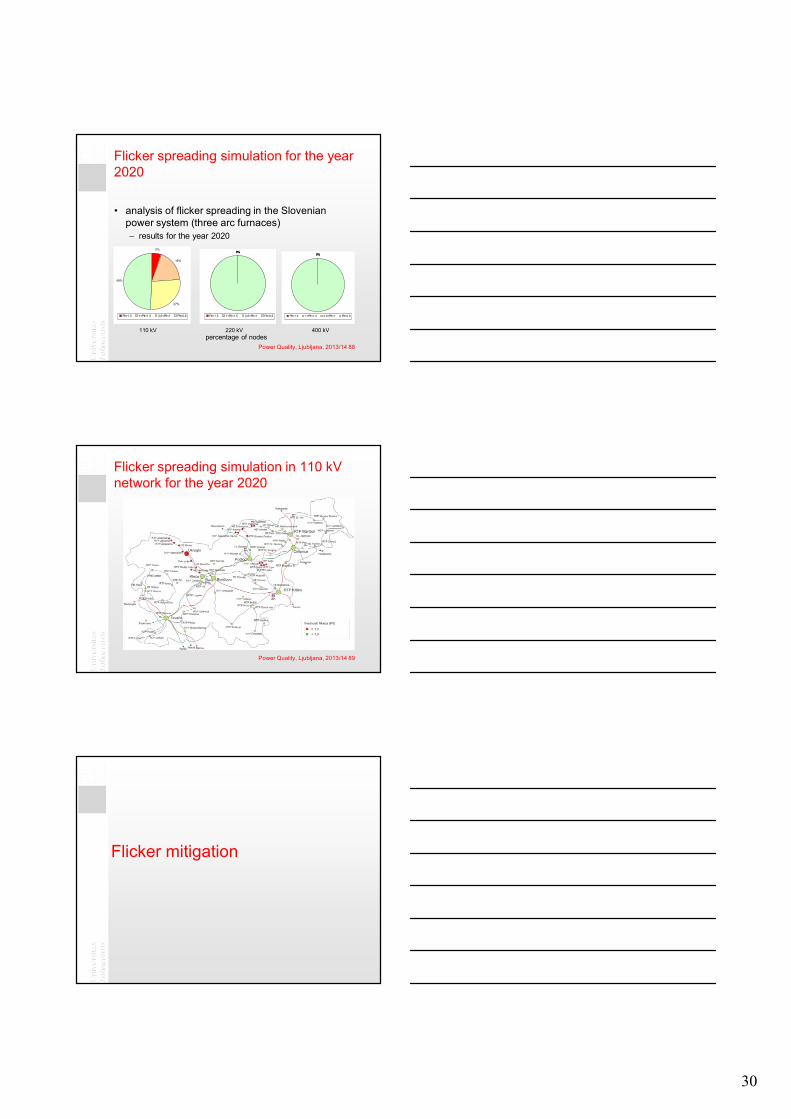
Measurement results at 20 kV level
voltage (kV) current (A)
time (s) time (s)
Power Quality, Ljubljana, 2013/14 82
Measurement results
• arc furnace 40MVA
• voltage at 110 kV• voltage at 20 kV• current at 20 kV
Power Quality, Ljubljana, 2013/14 83
Measurement results
• arc furnace 40MVA
• voltage at 110 kV• voltage at 20 kV• current at 20 kV
Power Quality, Ljubljana, 2013/14 84
29
Measurement results
• arc furnace 40 MVA• correlation between the flicker level at 110 kV and 20 kV
0
1
2
3
4
5
6
0 5 10 15 20 25
Pst Jeklarna Ravne UHP 20 kV
Pst J
ekla
rna
Rav
ne 1
10 k
V
Power Quality, Ljubljana, 2013/14 85
Flicker spreading simulation
• analysis of flicker spreading in the Slovenian power system (three arc furnaces)– present situation – summation law m = 2.7
12%
17%
20%
51%
Plt>1,5 1<Plt<1,5 0,6<Plt<1 Plt<0,6
0%0%
33%
67%
Plt>1,5 1<Plt<1,5 0,6<Plt<1 Plt>0,6
0%0%
29%
71%
Plt>1,5 1<Plt<1,5 0,6<Plt<1 Plt>0,6
110 kV 220 kV 400 kV percentage of nodes
Power Quality, Ljubljana, 2013/14 86
Flicker spreading simulation in 110 kV network (m = 2.7)
Power Quality, Ljubljana, 2013/14 87
30
Flicker spreading simulation for the year 2020
• analysis of flicker spreading in the Slovenian power system (three arc furnaces)– results for the year 2020
5%
19%
27%
49%
Plt>1,5 1<Plt<1,5 0,6<Plt<1 Plt>0,6
0%0%0%
100%Plt>1,5 1<Plt<1,5 0,6<Plt<1 Plt>0,6
0%0%0%
100%Plt>1,5 1<Plt<1,5 0,6<Plt<1 Plt>0,6
110 kV 220 kV 400 kV percentage of nodes
Power Quality, Ljubljana, 2013/14 88
Flicker spreading simulation in 110 kV network for the year 2020
Power Quality, Ljubljana, 2013/14 89
Flicker mitigation
31
Content
1st day 2nd day 3rd day 4th day 5th day
Session 1
Introduction to Power Quality • what is PQ • economic value • responsibilities
Harmonics – definitions • calculations • non-linear loads • harmonic
sequences
Harmonics - design of power factor correction devices • resonance points • filter design
Flicker case study • calculation of
flicker spreading in radial network
• variation of network parameters
Interruptions • definitions • reliability indices • improving
reliability
Session 2
Basic terms and definitions • voltage quality • continuity of
supply • commercial
quality
Propagation of harmonics • sources • consequences • cancellation
Flicker - basic terms • voltage variation • flicker frequency • sources • flickermeter
Voltage sags – definitions • characteristics • types • causes
Consequences of inadequate power quality • voltage quality • interruptions • costs
Session 3
PQ standards • EN 50 160 • other standards • limit values
Harmonics - resonances in network • parallel
resonance • series resonance
Flicker spreading • radial network • mashed network • simulation • examples
Propagation of voltage sags • transformer
connections • equipment
sensitivity • mitigation
Modern compensation devices • active and hybrid
compensators • series and shunt
compensators
Session 4
PQ monitoring • measurements • PQ analyzers • data analyses
Harmonics case study • calculation of
frequency impedance characteristics
Flicker mitigation • system solutions
– network enforcement
• compensation
Other voltage variations • unbalance • voltage
transients • overvoltages
Conclusions • PQ improvement
and costs • definition of
optimal solutions
Power Quality, Ljubljana, 2013/14 91
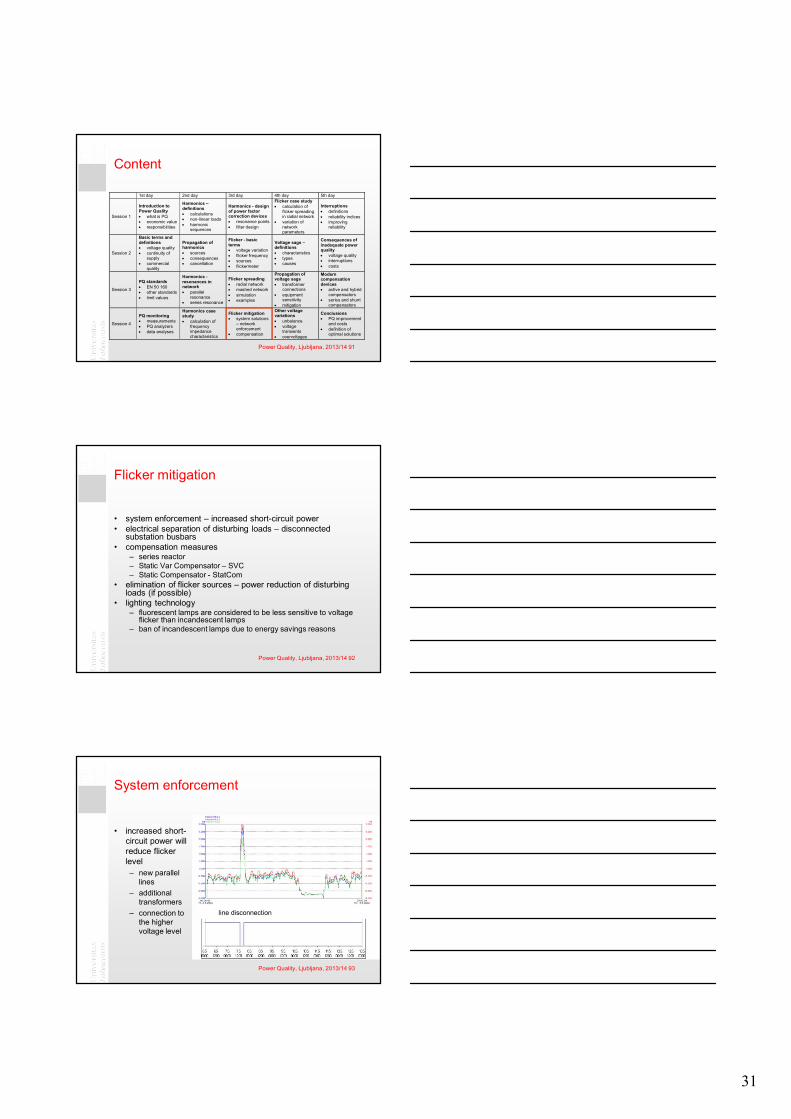
Flicker mitigation
• system enforcement – increased short-circuit power• electrical separation of disturbing loads – disconnected
substation busbars• compensation measures
– series reactor– Static Var Compensator – SVC– Static Compensator - StatCom
• elimination of flicker sources – power reduction of disturbing loads (if possible)
• lighting technology– fluorescent lamps are considered to be less sensitive to voltage
flicker than incandescent lamps– ban of incandescent lamps due to energy savings reasons
Power Quality, Ljubljana, 2013/14 92
System enforcement
• increased short-circuit power will reduce flicker level– new parallel
lines– additional
transformers– connection to
the higher voltage level
line disconnection
Power Quality, Ljubljana, 2013/14 93
32
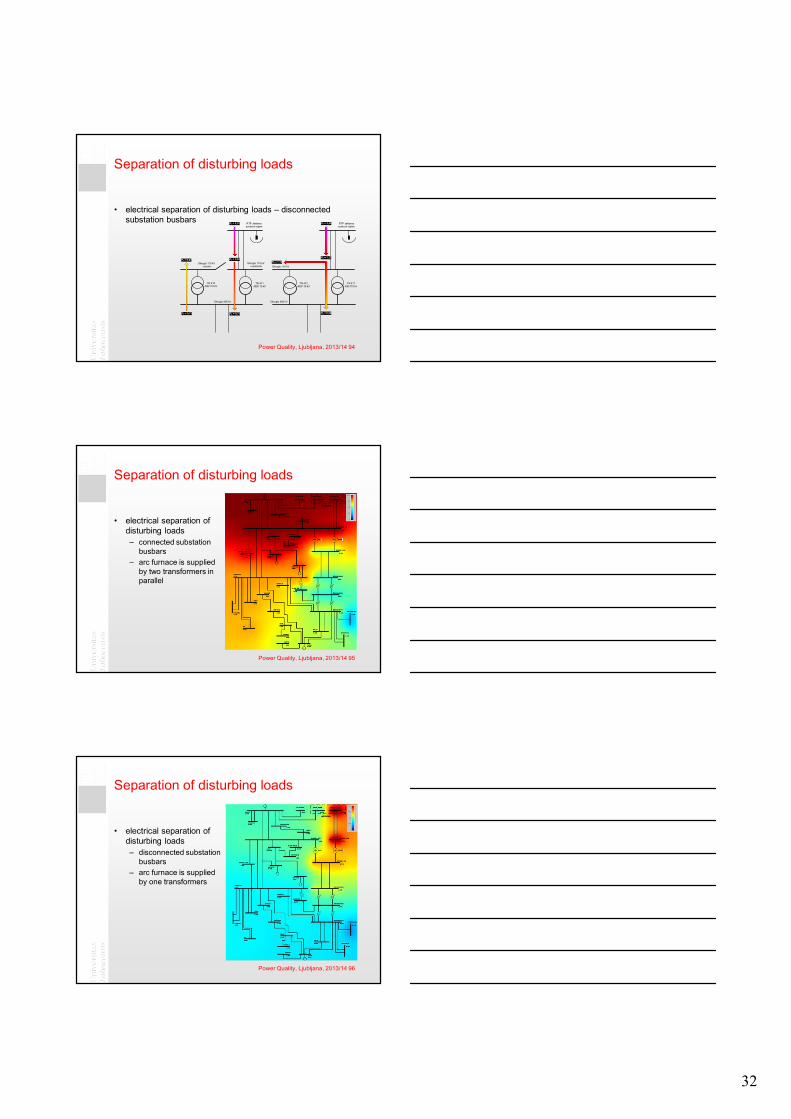
Separation of disturbing loads
• electrical separation of disturbing loads – disconnected substation busbars
Plt = 3,03Plt = 0,47
Plt = 0,71Plt = 0,71
TR 412400/110 kV
TR 411400/110 kV
Okroglo 110 kV »ostali«
Okroglo 110 kV »sunkovit«
Okroglo 400 kV
Plt = 5,31
TR 412400/110 kV
TR 411400/110 kV
Okroglo 110 kV
Okroglo 400 kV
Plt = 1,13
Plt = 3,44
Plt = 1,13
Plt = 0,52
RTP Jeklarnasunkovit odjem
RTP Jeklarnasunkovit odjem
Power Quality, Ljubljana, 2013/14 94
Separation of disturbing loads
• electrical separation of disturbing loads – connected substation
busbars– arc furnace is supplied
by two transformers in parallel
Power Quality, Ljubljana, 2013/14 95
Separation of disturbing loads
• electrical separation of disturbing loads – disconnected substation
busbars– arc furnace is supplied
by one transformers
Power Quality, Ljubljana, 2013/14 96
33
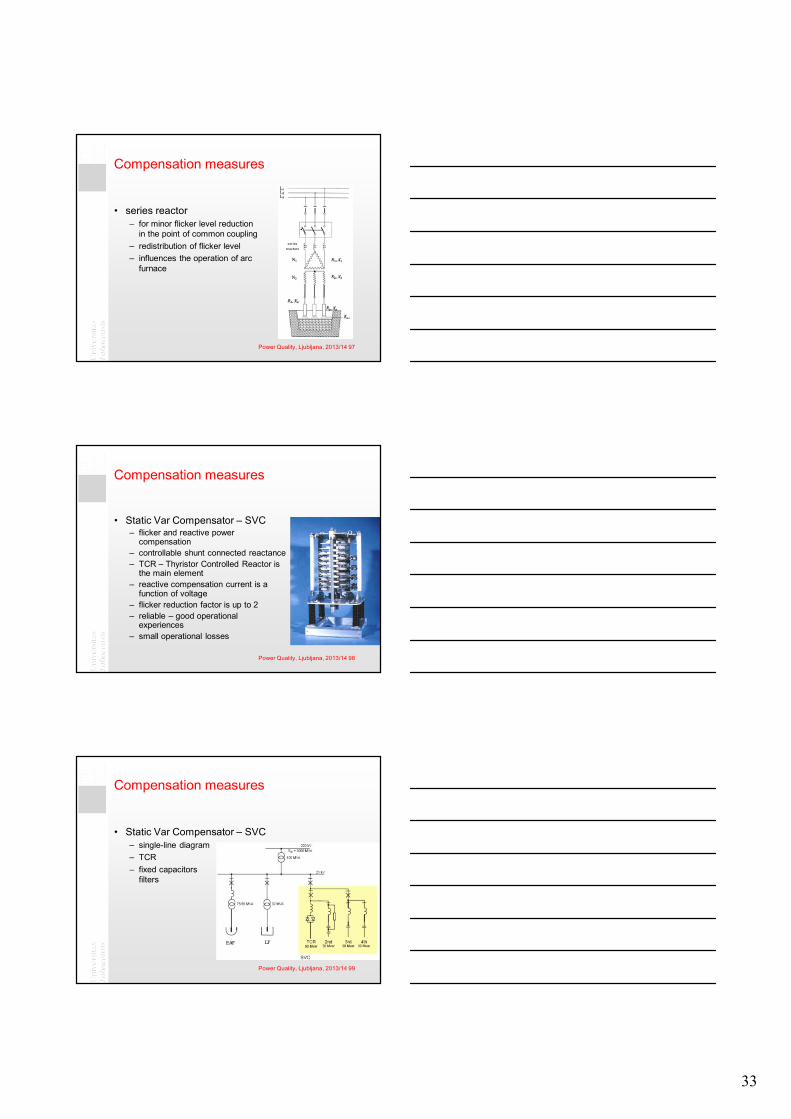
Compensation measures
• series reactor– for minor flicker level reduction
in the point of common coupling – redistribution of flicker level– influences the operation of arc
furnace
arc
seriesreactors
Power Quality, Ljubljana, 2013/14 97
Compensation measures
• Static Var Compensator – SVC– flicker and reactive power
compensation– controllable shunt connected reactance– TCR – Thyristor Controlled Reactor is
the main element– reactive compensation current is a
function of voltage– flicker reduction factor is up to 2– reliable – good operational
experiences– small operational losses
Power Quality, Ljubljana, 2013/14 98
Compensation measures
• Static Var Compensator – SVC– single-line diagram– TCR– fixed capacitors and
filters
Power Quality, Ljubljana, 2013/14 99
34
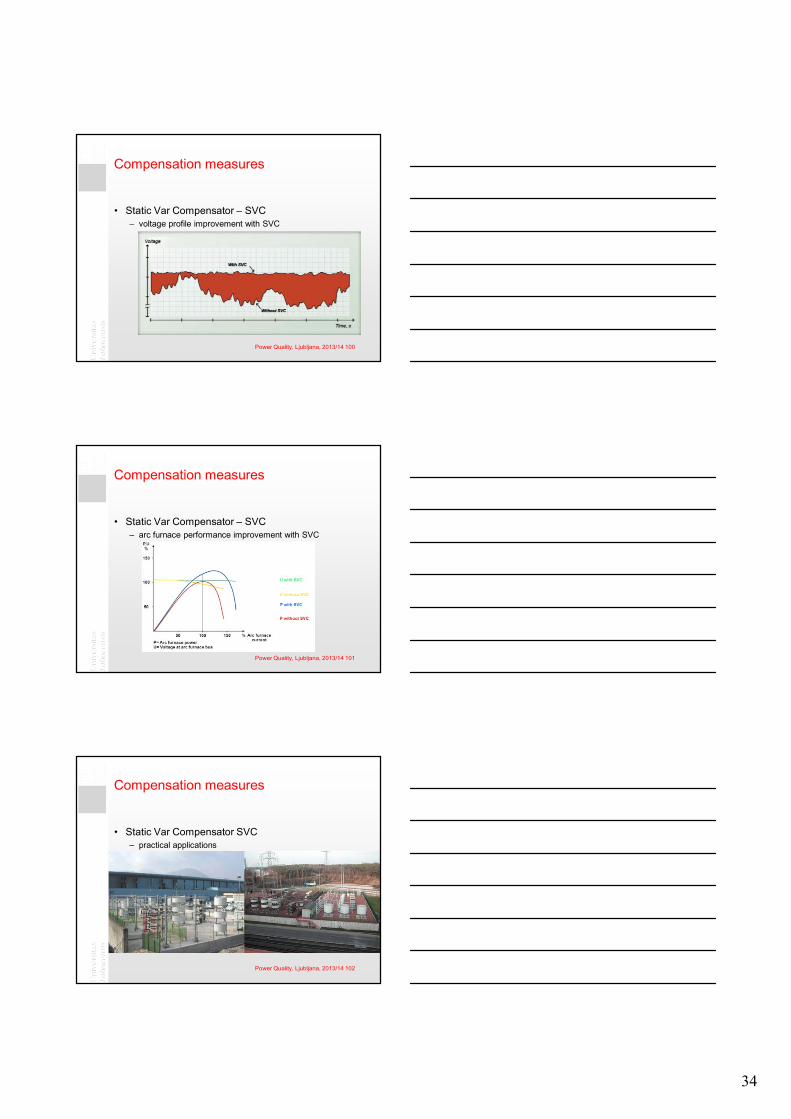
Compensation measures
• Static Var Compensator – SVC– voltage profile improvement with SVC
Power Quality, Ljubljana, 2013/14 100
Compensation measures
• Static Var Compensator – SVC– arc furnace performance improvement with SVC
Power Quality, Ljubljana, 2013/14 101
Compensation measures
• Static Var Compensator SVC– practical applications
Power Quality, Ljubljana, 2013/14 102
35
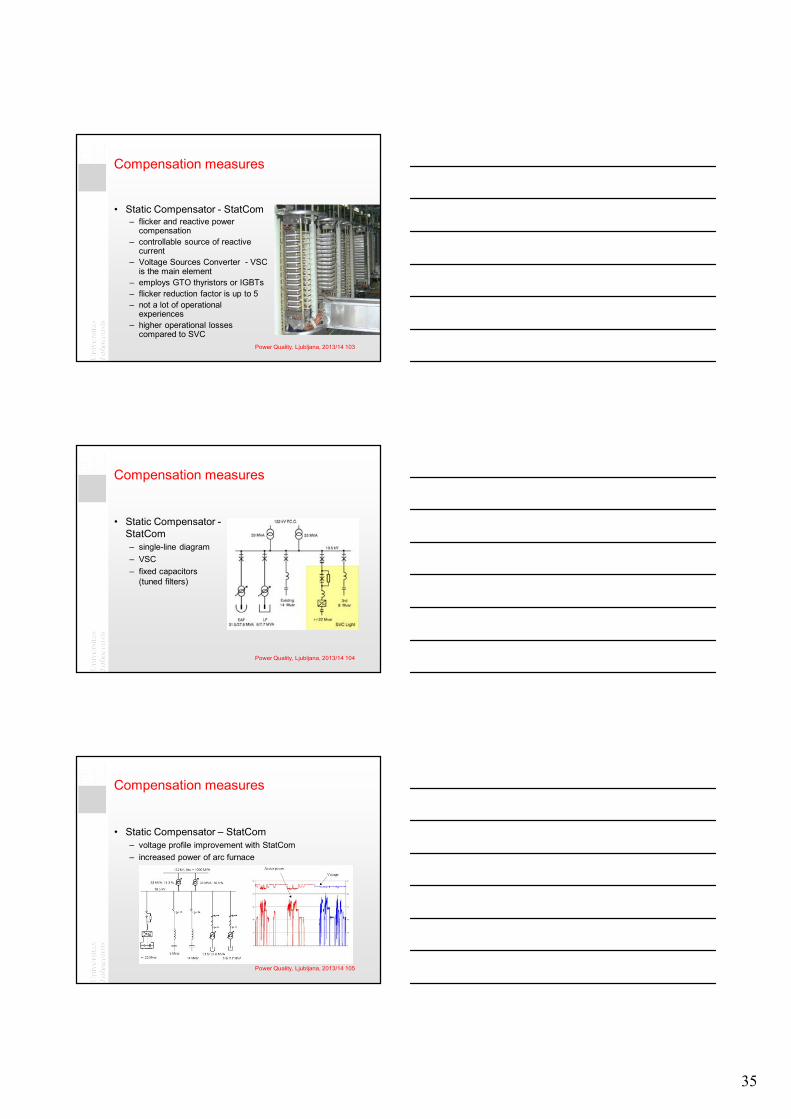
Compensation measures
• Static Compensator - StatCom– flicker and reactive power
compensation– controllable source of reactive
current – Voltage Sources Converter - VSC
is the main element– employs GTO thyristors or IGBTs– flicker reduction factor is up to 5– not a lot of operational
experiences– higher operational losses
compared to SVCPower Quality, Ljubljana, 2013/14 103
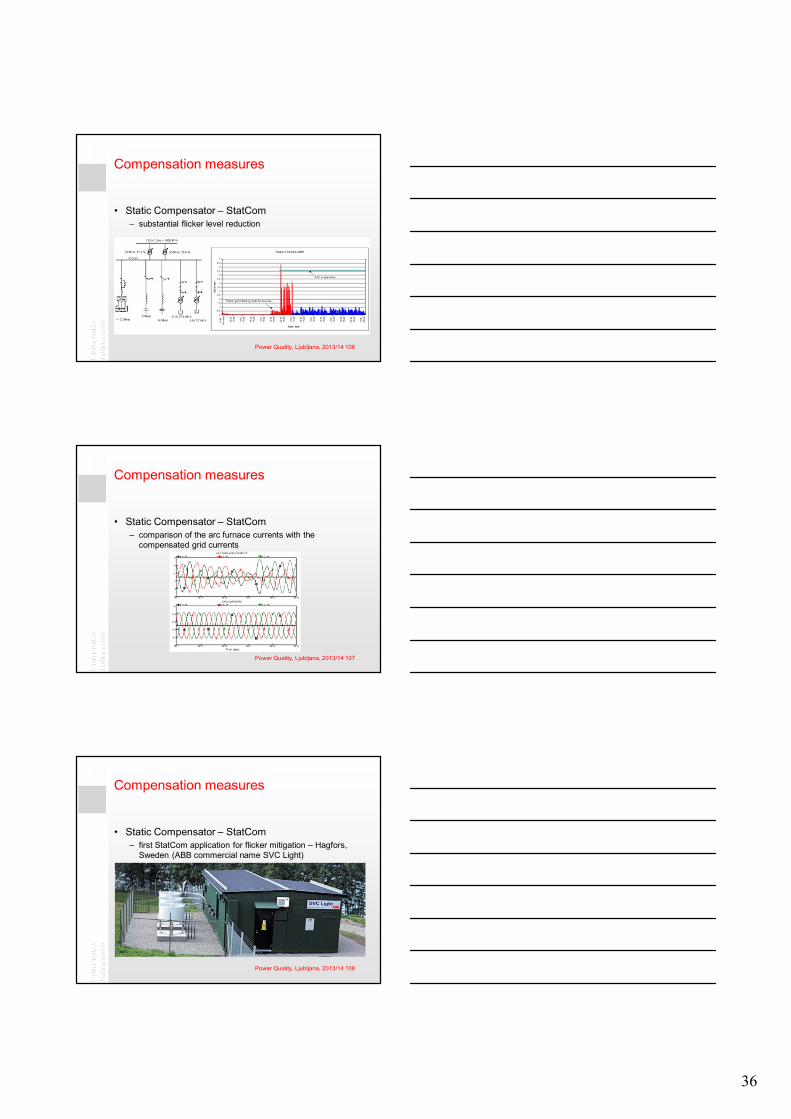
Compensation measures
• Static Compensator -StatCom– single-line diagram– VSC– fixed capacitors
(tuned filters)
Power Quality, Ljubljana, 2013/14 104
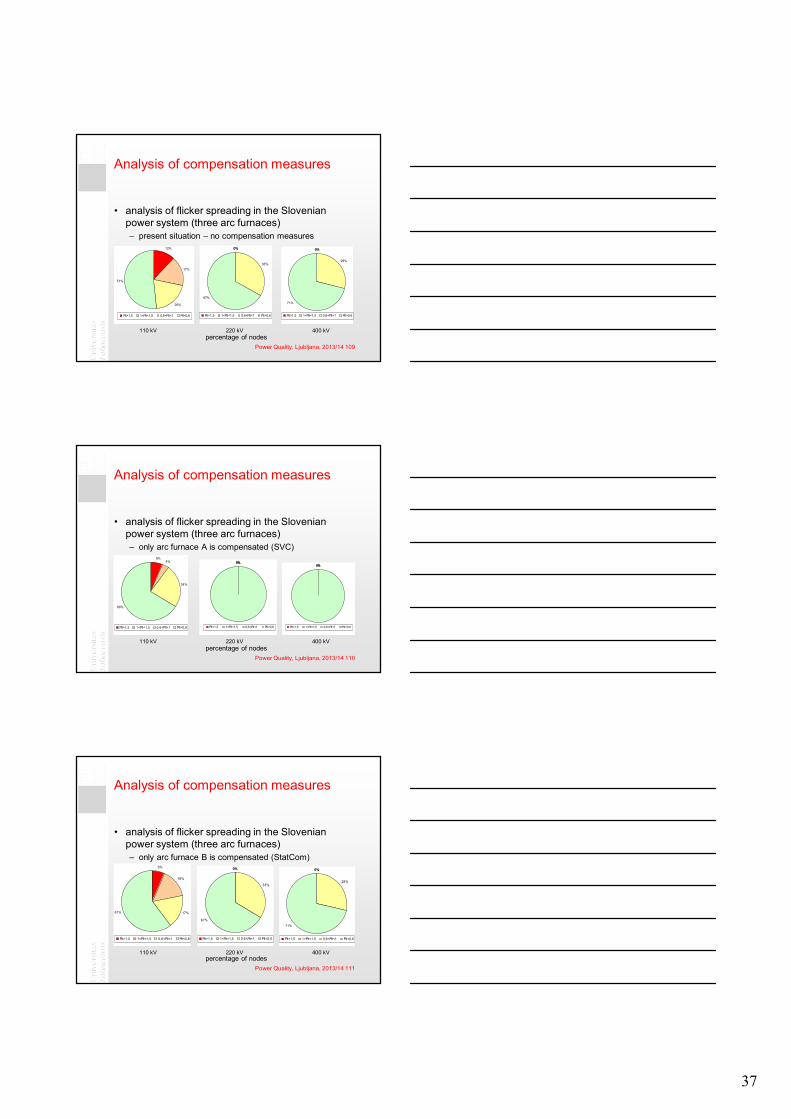
Compensation measures
• Static Compensator – StatCom– voltage profile improvement with StatCom– increased power of arc furnace
Power Quality, Ljubljana, 2013/14 105
36
Compensation measures
• Static Compensator – StatCom– substantial flicker level reduction
Power Quality, Ljubljana, 2013/14 106
Compensation measures
• Static Compensator – StatCom– comparison of the arc furnace currents with the
compensated grid currents
Power Quality, Ljubljana, 2013/14 107
Compensation measures
• Static Compensator – StatCom– first StatCom application for flicker mitigation – Hagfors,
Sweden (ABB commercial name SVC Light)
Power Quality, Ljubljana, 2013/14 108
37
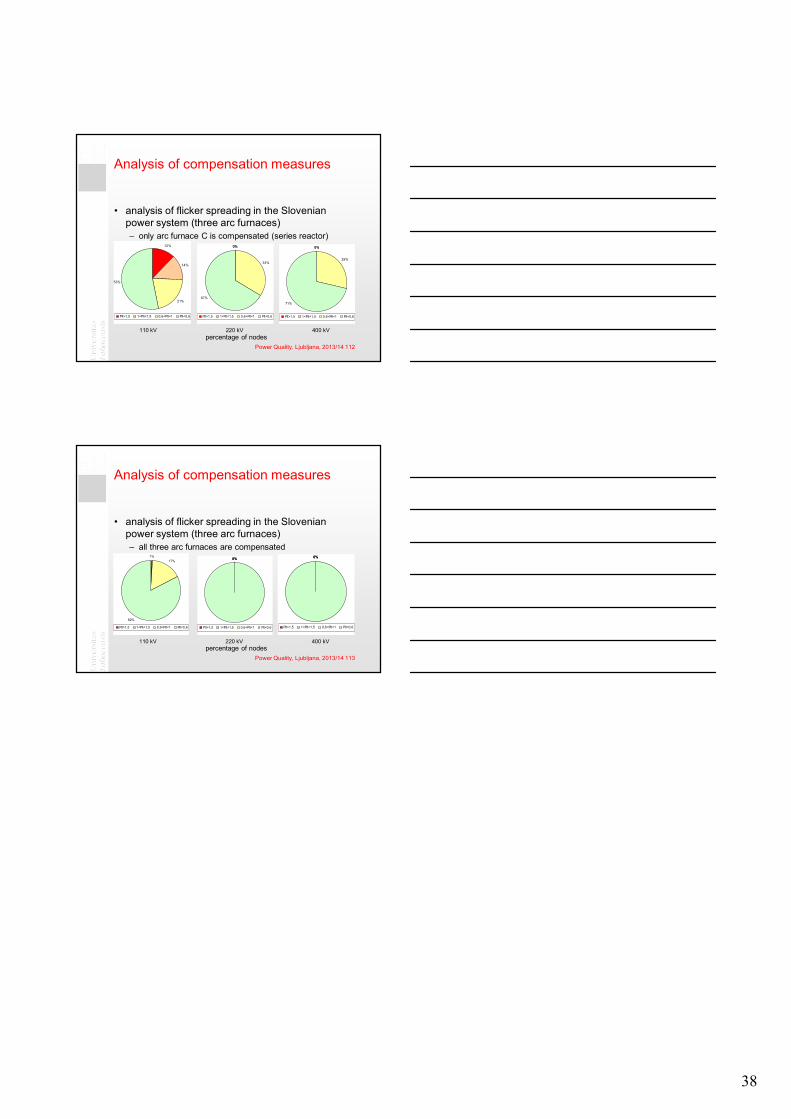
Analysis of compensation measures
• analysis of flicker spreading in the Slovenian power system (three arc furnaces)– present situation – no compensation measures
12%
17%
20%
51%
Plt>1,5 1<Plt<1,5 0,6<Plt<1 Plt<0,6
0%0%
33%
67%
Plt>1,5 1<Plt<1,5 0,6<Plt<1 Plt>0,6
0%0%
29%
71%
Plt>1,5 1<Plt<1,5 0,6<Plt<1 Plt>0,6
110 kV 220 kV 400 kV percentage of nodes
Power Quality, Ljubljana, 2013/14 109
Analysis of compensation measures
• analysis of flicker spreading in the Slovenian power system (three arc furnaces)– only arc furnace A is compensated (SVC)
6%4%
24%
66%
Plt>1,5 1<Plt<1,5 0,6<Plt<1 Plt<0,6
0%0%0%
100%Plt>1,5 1<Plt<1,5 0,6<Plt<1 Plt>0,6
0%0%0%
100%Plt>1,5 1<Plt<1,5 0,6<Plt<1 Plt>0,6
110 kV 220 kV 400 kV percentage of nodes
Power Quality, Ljubljana, 2013/14 110
Analysis of compensation measures
• analysis of flicker spreading in the Slovenian power system (three arc furnaces)– only arc furnace B is compensated (StatCom)
6%
16%
17%61%
Plt>1,5 1<Plt<1,5 0,6<Plt<1 Plt<0,6
0%0%
33%
67%
Plt>1,5 1<Plt<1,5 0,6<Plt<1 Plt<0,6
0%0%
29%
71%
Plt>1,5 1<Plt<1,5 0,6<Plt<1 Plt<0,6
110 kV 220 kV 400 kV percentage of nodes
Power Quality, Ljubljana, 2013/14 111
38
Analysis of compensation measures
• analysis of flicker spreading in the Slovenian power system (three arc furnaces)– only arc furnace C is compensated (series reactor)
12%
14%
21%
53%
Plt>1,5 1<Plt<1,5 0,6<Plt<1 Plt<0,6
0%0%
33%
67%
Plt>1,5 1<Plt<1,5 0,6<Plt<1 Plt<0,6
0%0%
29%
71%
Plt>1,5 1<Plt<1,5 0,6<Plt<1 Plt<0,6
110 kV 220 kV 400 kV percentage of nodes
Power Quality, Ljubljana, 2013/14 112
Analysis of compensation measures
• analysis of flicker spreading in the Slovenian power system (three arc furnaces)– all three arc furnaces are compensated
1%17%
82%
Plt>1,5 1<Plt<1,5 0,6<Plt<1 Plt<0,6
0%0%0%
100%Plt>1,5 1<Plt<1,5 0,6<Plt<1 Plt<0,6
0%0%0%
100%Plt>1,5 1<Plt<1,5 0,6<Plt<1 Plt<0,6
110 kV 220 kV 400 kV percentage of nodes
Power Quality, Ljubljana, 2013/14 113


![ANALISIS PEMASANGAN DETUNED REACTORDAN … · Kerusakan pada kapasitor bank ... Sumber [10] Pujiantara, Margo., “Harmonisa-Diktat Kuliah Desain Sistem Kelistrikan. Teknik Elektro](https://img.pdfslide.net/doc/110x75/5c9f84b888c99312188b815e/analisis-pemasangan-detuned-reactordan-kerusakan-pada-kapasitor-bank-sumber.jpg)