Embed Size (px)
Citation preview
1Georgia Tech
PSERC
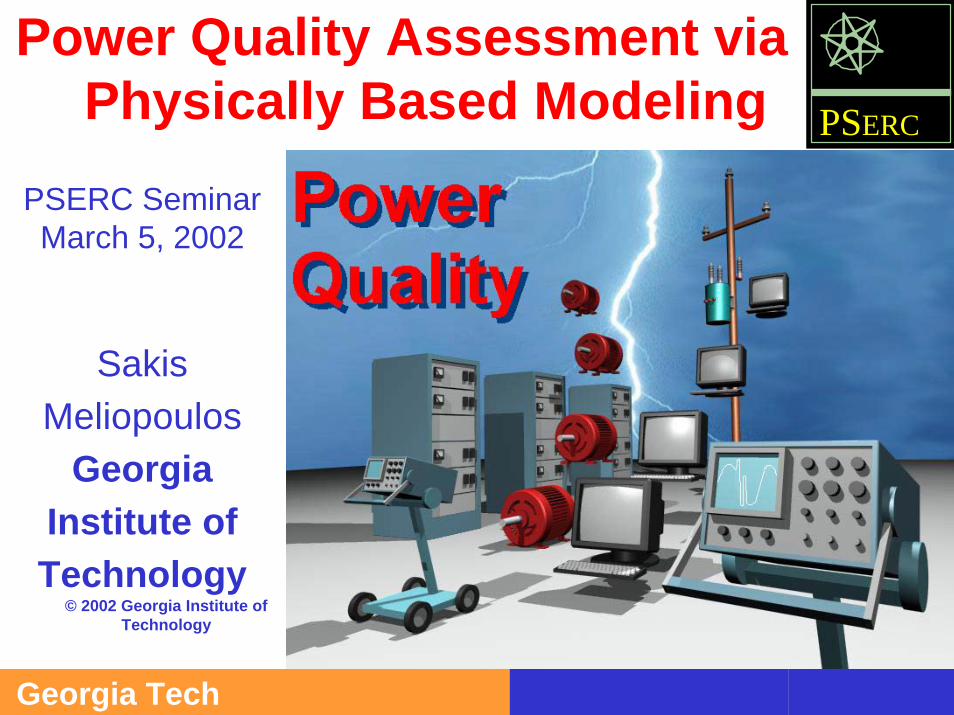
PSERC SeminarMarch 5, 2002
SakisMeliopoulos
GeorgiaInstitute ofTechnology
© 2002 Georgia Institute of Technology
Power Quality Assessment via Physically Based Modeling
2Georgia Tech
PSERC
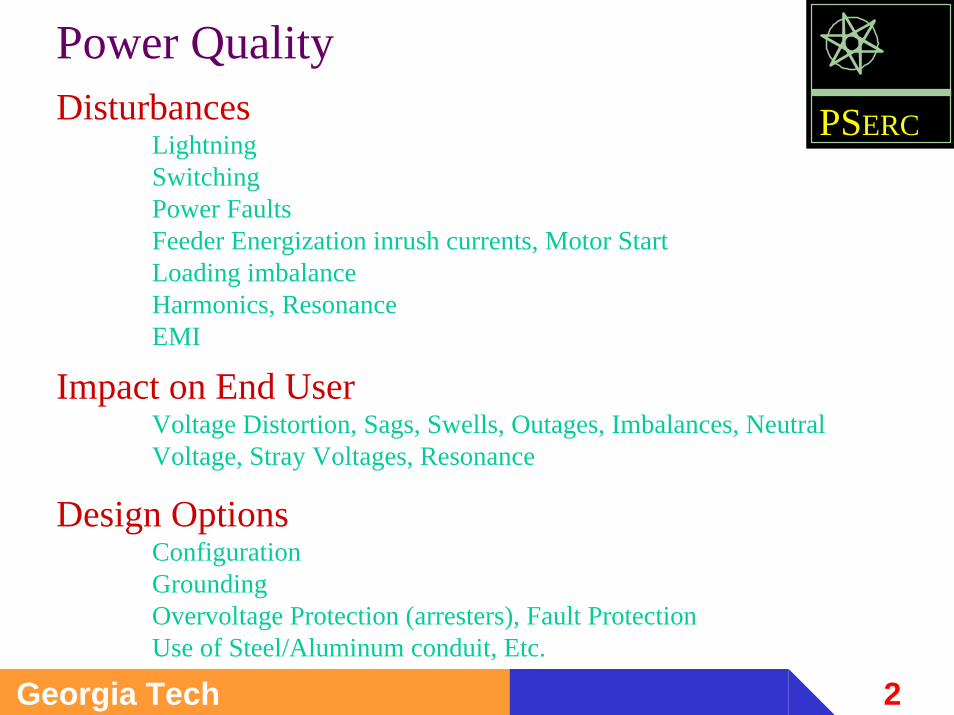
Power Quality
Design OptionsConfigurationGroundingOvervoltage Protection (arresters), Fault ProtectionUse of Steel/Aluminum conduit, Etc.
DisturbancesLightningSwitchingPower FaultsFeeder Energization inrush currents, Motor StartLoading imbalanceHarmonics, ResonanceEMI
Impact on End UserVoltage Distortion, Sags, Swells, Outages, Imbalances, Neutral Voltage, Stray Voltages, Resonance
3Georgia Tech
PSERC
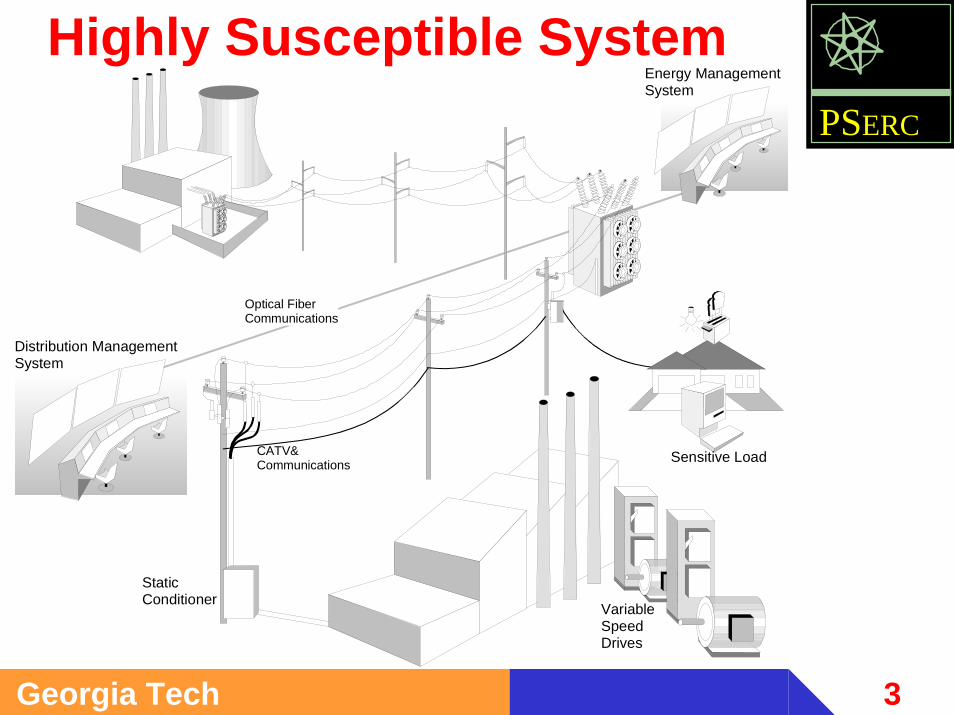
Highly Susceptible SystemEnergy ManagementSystem
Distribution ManagementSystem
VariableSpeedDrives
Sensitive Load
StaticConditioner
CATV&Communications
Optical FiberCommunications
4Georgia Tech
PSERC
AcceptablePower
0.5
Cyc
le
Rated Voltage
8.33
ms
Overvoltage Conditions
Undervoltage Conditions
0.0001 0.001 0.01 0.1 1 10 100 1000Time (seconds)
Perc
ent C
hang
e in
Bus
Vol
tage
-100
-50
0
50
100
150
200
250
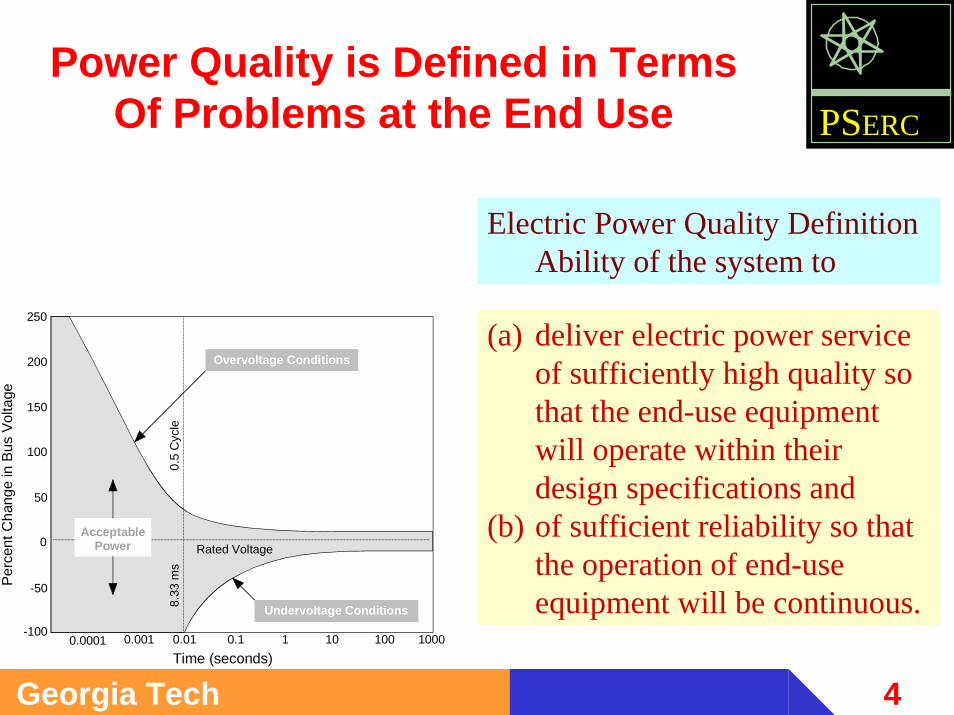
Power Quality is Defined in Terms Of Problems at the End Use
(a) deliver electric power service of sufficiently high quality so that the end-use equipment will operate within their design specifications and
(b) of sufficient reliability so that the operation of end-use equipment will be continuous.
Electric Power Quality Definition Ability of the system to
5Georgia Tech
PSERC
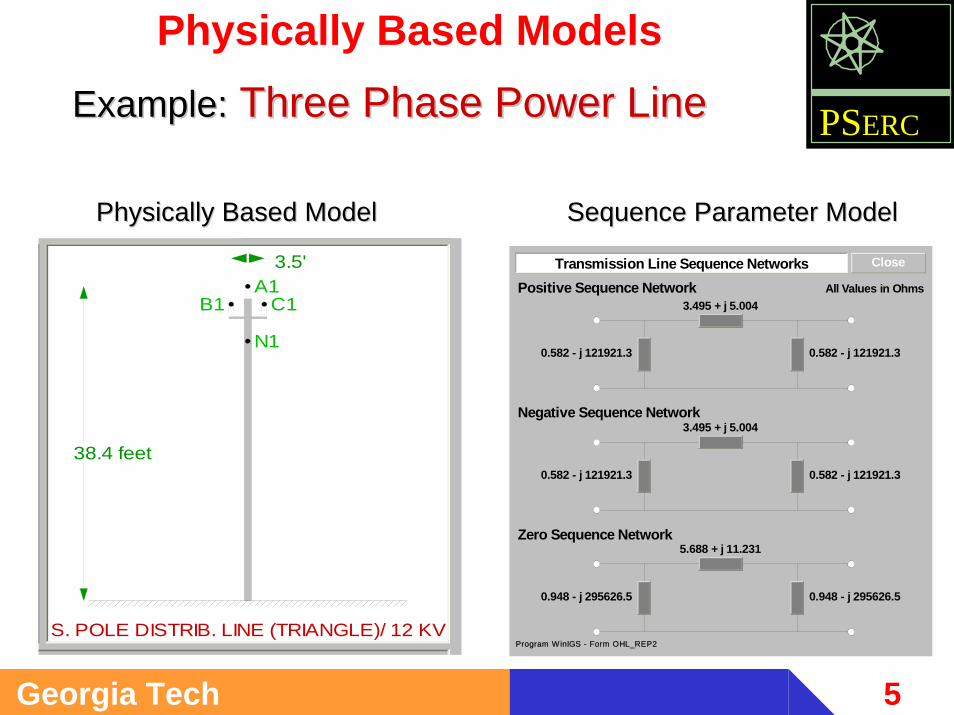
Physically Based Models Example:Example: Three Phase Power LineThree Phase Power Line
A1B1 C1
N1
38.4 feet
3.5'
S. POLE DISTRIB. LINE (TRIANGLE)/ 12 KV
Transmission Line Sequence Networks Close
3.495 + j 5.004
0.582 - j 121921.3 0.582 - j 121921.3
Positive Sequence Network
Negative Sequence Network
Zero Sequence Network
3.495 + j 5.004
0.582 - j 121921.3
5.688 + j 11.231
0.948 - j 295626.5
0.582 - j 121921.3
0.948 - j 295626.5
All Values in Ohms
Program WinIGS - Form OHL_REP2
Physically Based ModelPhysically Based Model Sequence Parameter ModelSequence Parameter Model
6Georgia Tech
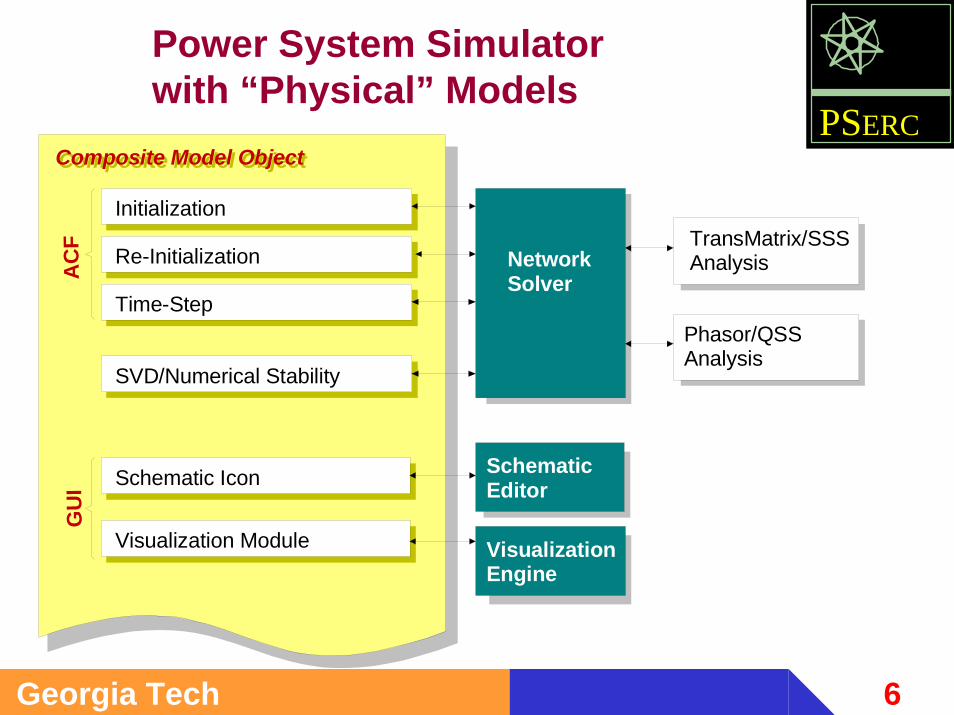
PSERCComposite Model Object
Initialization
Re-Initialization
Time-Step
SVD/Numerical Stability
Phasor/QSSAnalysis
TransMatrix/SSSAnalysis
Schematic Icon
Visualization Module
Composite Model Object
NetworkSolver
SchematicEditor
VisualizationEngine
AC
FG
UI
Power System Simulator with “Physical” Models
7Georgia Tech
PSERC
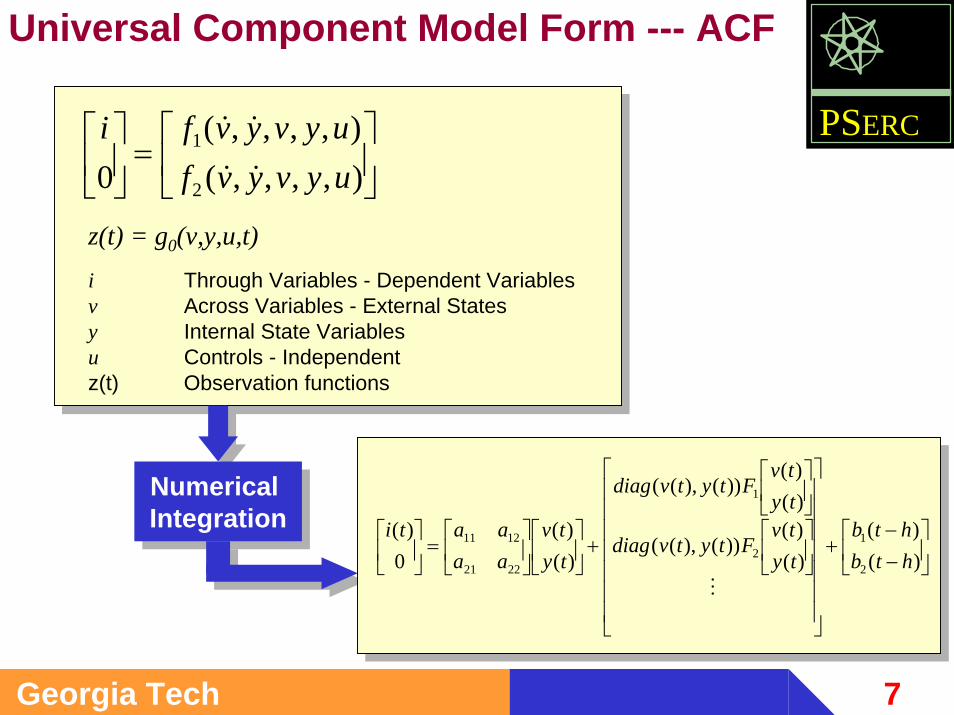
=
),,,,(),,,,(
0 2
1
uyvyvfuyvyvfi
&&
&&
i Through Variables - Dependent Variablesv Across Variables - External Statesy Internal State Variablesu Controls - Independentz(t) Observation functions
z(t) = g0(v,y,u,t)
Universal Component Model Form --- ACF
Numerical IntegrationNumerical Integration
−−
+
+
=
)()(
)()(
))(),((
)()(
))(),((
)()(
0)(
2
12
1
2221
1211
htbhtb
tytv
Ftytvdiag
tytv
Ftytvdiag
tytv
aaaati
M
8Georgia Tech
PSERC
−−
+
+
=
)()(
)()(
))(),((
)()(
))(),((
)()(
0)(
2
12
1
2221
1211
htbhtb
tytv
Ftytvdiag
tytv
Ftytvdiag
tytv
aaaati
M
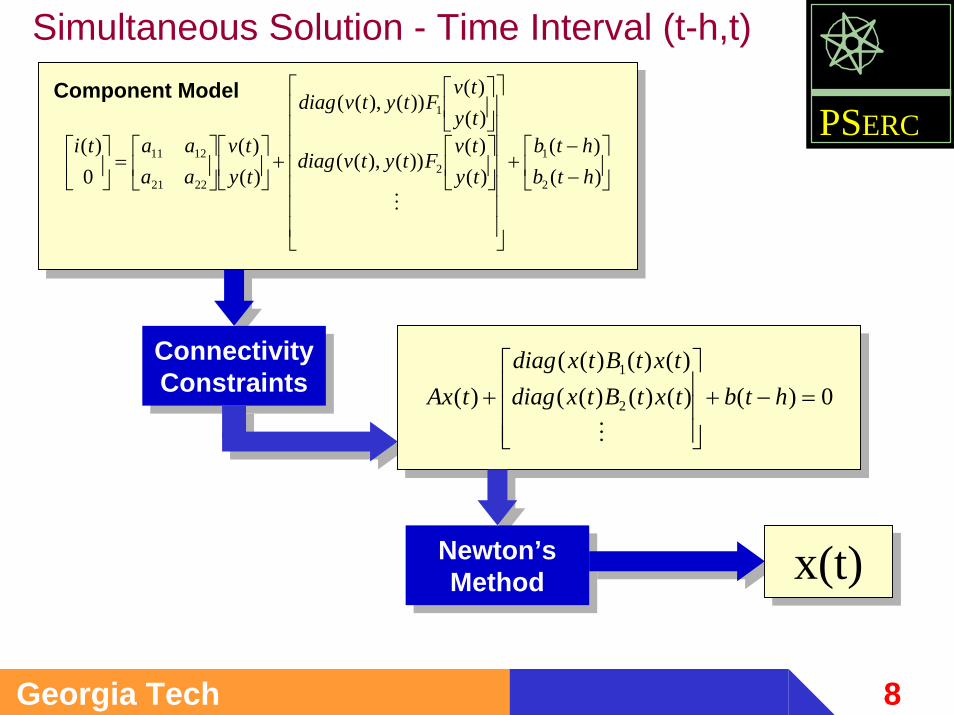
Simultaneous Solution - Time Interval (t-h,t)
ConnectivityConstraints
ConnectivityConstraints
Newton’sMethod
Newton’sMethod
0)()()()(()()()((
)( 2
1
=−+
+ htbtxtBtxdiag
txtBtxdiagtAx
M
x(t)x(t)
Component Model
9Georgia Tech
PSERC
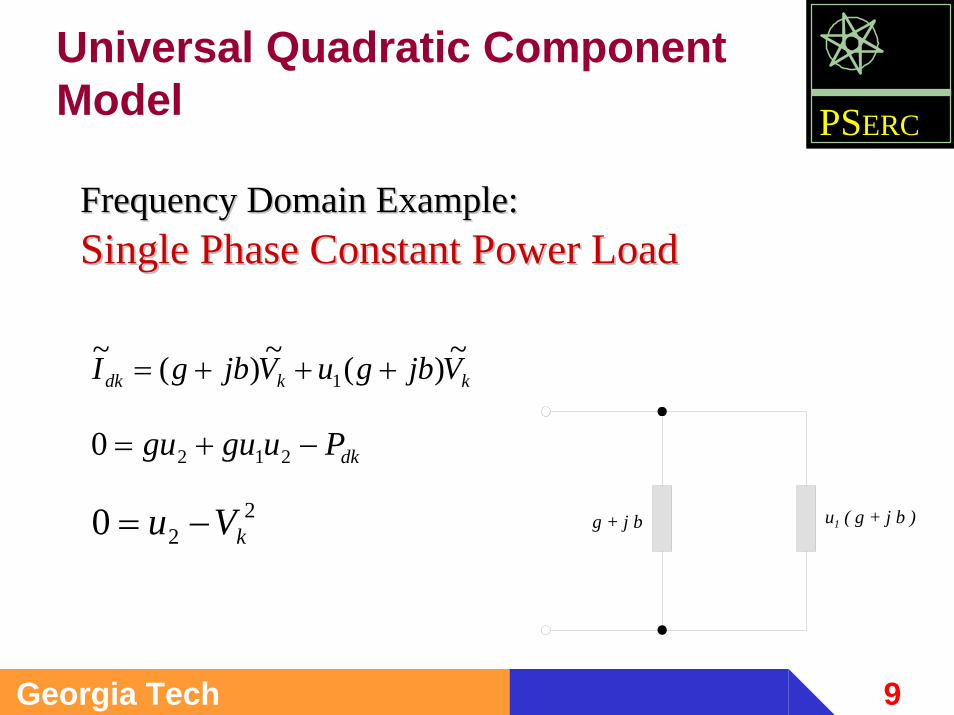
Universal Quadratic Component Model
kkdk VjbguVjbgI ~)(~)(~1 +++=
dkPugugu −+= 2120
220 kVu −=
Frequency Domain Example:Frequency Domain Example:Single Phase Constant Power LoadSingle Phase Constant Power Load
g + j b u1 ( g + j b )
10Georgia Tech
PSERC
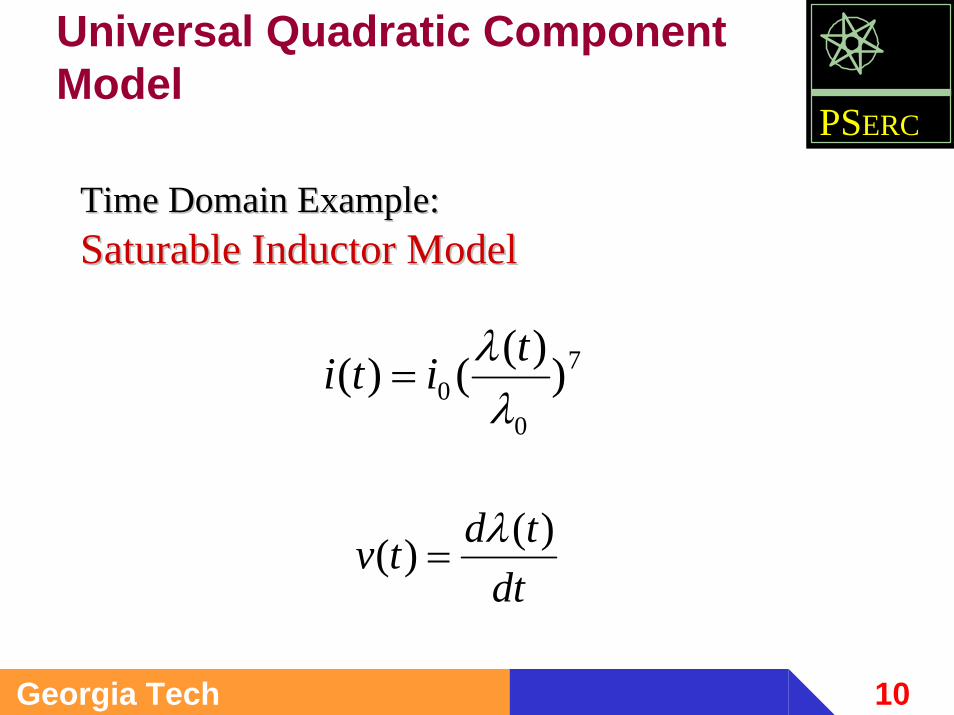
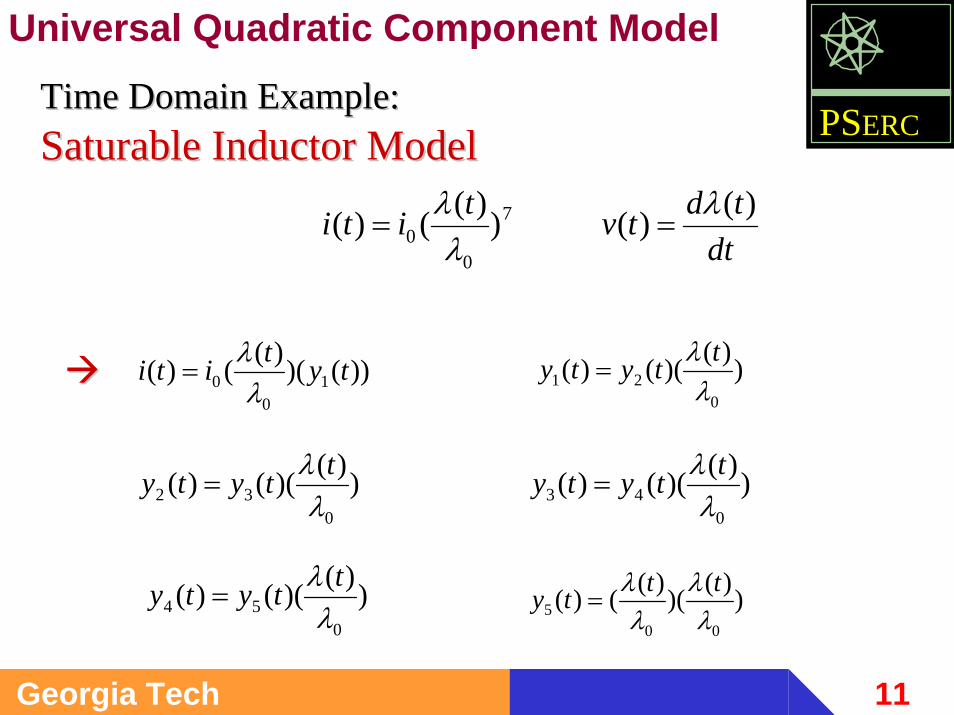
Universal Quadratic Component Model
Time Domain Example:Time Domain Example:SaturableSaturable Inductor ModelInductor Model
7
00 ))(()(
λλ titi =
dttdtv )()( λ
=
11Georgia Tech
PSERC
Universal Quadratic Component Model
7
00 ))(()(
λλ titi =
))()()(()( 10
0 tytitiλλ
= ))()(()(0
21 λλ ttyty =
))()(()(0
32 λλ ttyty =
))()()(()(00
5 λλ
λλ ttty =
))()(()(0
43 λλ ttyty =
))()(()(0
54 λλ ttyty =
dttdtv )()( λ
=
Time Domain Example:Time Domain Example:SaturableSaturable Inductor ModelInductor Model
12Georgia Tech
PSERC
B U S 10 B U S 20 B U S 30 B U S 40
G
V
V
V
A
A
A
V
V
V
A
A
A
A
A
A
A
L R
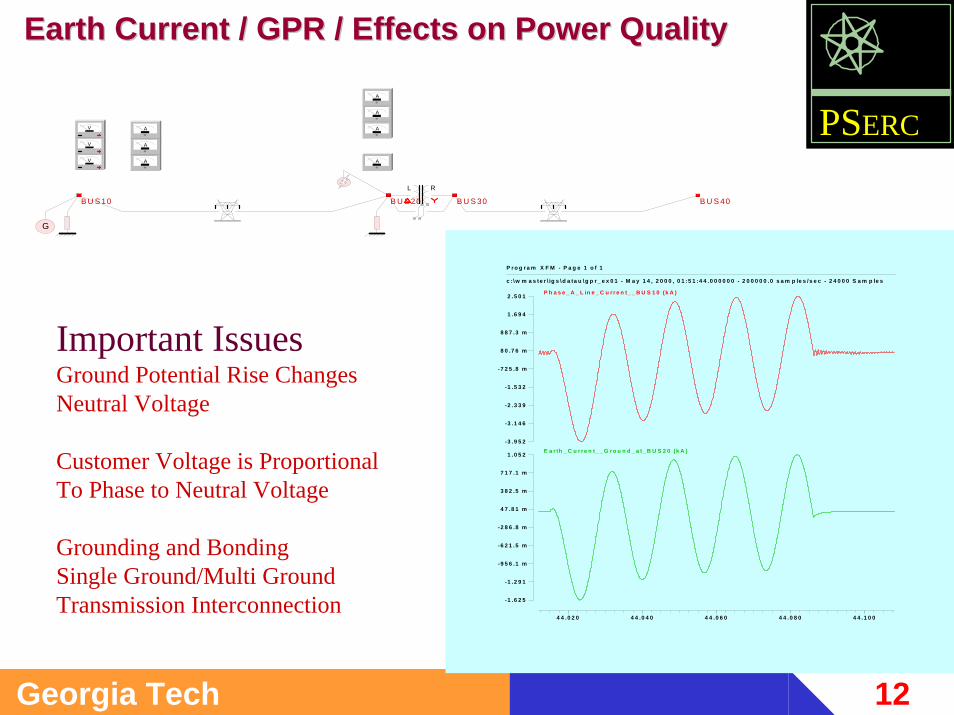
Earth Current / GPR / Effects on Power QualityEarth Current / GPR / Effects on Power Quality
P r o g r a m X F M - P a g e 1 o f 1
c : \w m a s te r \ ig s \d a ta u \g p r _ e x 0 1 - M a y 1 4 , 2 0 0 0 , 0 1 :5 1 :4 4 .0 0 0 0 0 0 - 2 0 0 0 0 0 .0 s a m p le s /s e c - 2 4 0 0 0 S a m p le s
4 4 .0 2 0 4 4 .0 4 0 4 4 .0 6 0 4 4 .0 8 0 4 4 .1 0 0
-3 .9 5 2
-3 .1 4 6
-2 .3 3 9
-1 .5 3 2
-7 2 5 .8 m
8 0 .7 6 m
8 8 7 .3 m
1 .6 9 4
2 .5 0 1 P h a s e _ A _ L in e _ C u r r e n t_ _ B U S 1 0 (k A )
-1 .6 2 5
-1 .2 9 1
-9 5 6 .1 m
-6 2 1 .5 m
-2 8 6 .8 m
4 7 .8 1 m
3 8 2 .5 m
7 1 7 .1 m
1 .0 5 2 E a r th _ C u r r e n t_ _ G r o u n d _ a t_ B U S 2 0 (k A )
Important IssuesGround Potential Rise Changes Neutral Voltage
Customer Voltage is ProportionalTo Phase to Neutral Voltage
Grounding and BondingSingle Ground/Multi GroundTransmission Interconnection
13Georgia Tech
PSERC
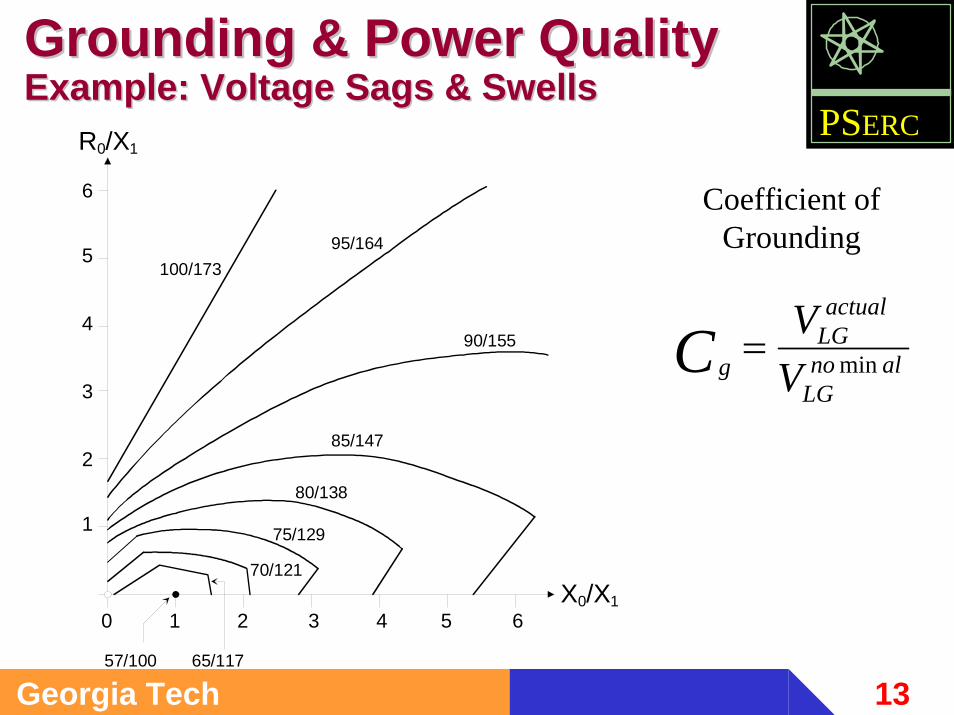
Grounding & Power QualityGrounding & Power QualityExample: Voltage Sags & SwellsExample: Voltage Sags & Swells
0 2 3 4 5 6
6
5
4
3
2
1
100/17395/164
90/155
85/147
80/138
75/129
70/121
65/11757/100
X0/X1
R0/X1
1
alnoLG
actualLG
g VVC min=
Coefficient ofGrounding
14Georgia Tech
PSERC
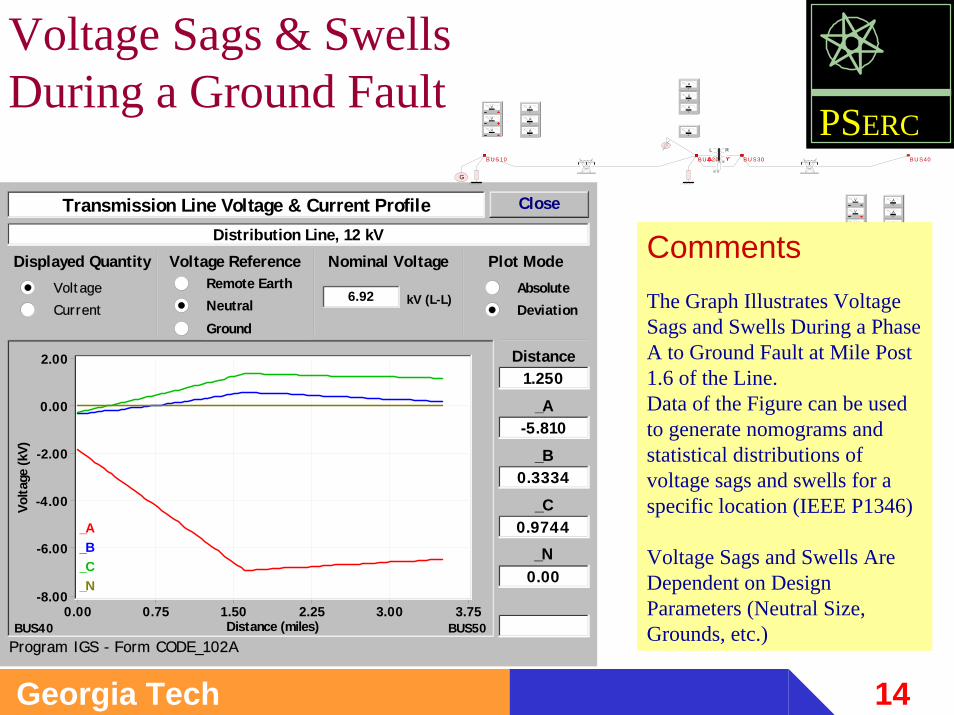
Voltage Sags & Swells During a Ground Fault
Transmission Line Voltage & Current Profile Close
0.00 0.75 1.50 2.25 3.00 3.75Distance (miles)
-8.00
-6.00
-4.00
-2.00
0.00
2.00
Volta
ge (k
V)
_A_B_C_N
Absolute Deviation
Remote Earth Neutral Ground
Voltage Reference
6.92 Volt age Current
Displayed Quantity Nominal Voltage
kV (L-L)
Plot ModeDistribution Line, 12 kV
1.250
-5.810
Distance
_A
0.3334
0.9744
_B
_C
0.00_N
BUS40 BUS50Program IGS - Form CODE_102A
B U S 10 BU S20 BU S30 BU S40
G
V
V
V
A
A
A
V
V
V
A
A
A
A
A
A
A
L R
CommentsThe Graph Illustrates Voltage Sags and Swells During a Phase A to Ground Fault at Mile Post 1.6 of the Line.Data of the Figure can be used to generate nomograms and statistical distributions of voltage sags and swells for a specific location (IEEE P1346)
Voltage Sags and Swells Are Dependent on Design Parameters (Neutral Size, Grounds, etc.)
15Georgia Tech
PSERC Close
Distribution Line, 12 kV
Update 0.00 0.040 0.080 0.12 0.16 0.20Distance from BUS40 (miles)
60.0
80.0
100
120
140
160
Coe
ffici
ent o
f Gro
undi
ng (%
)
0.00
600
1200
1800
2400
3000
GPR
(Vol
ts)
Phase BPhase C
G.P.R.Symmetric
Circuit Fault Type
0.1000
87.98
1844
Distance
Coefficent of
GPR
BUS50BUS40
L-N L-GCircuit # 1
Coefficient of Grounding
Faulted Phase A B C Nominal L-L Voltage (kV) 12.0
Definition of Unfaulted Phase Voltage L-N L-G Absolute
GroundingPhase B
125.3Phase C
Coefficent ofGrounding
83.47
Symmetric Coeff.of Grounding
Program W inIGS - Form COEF_GR
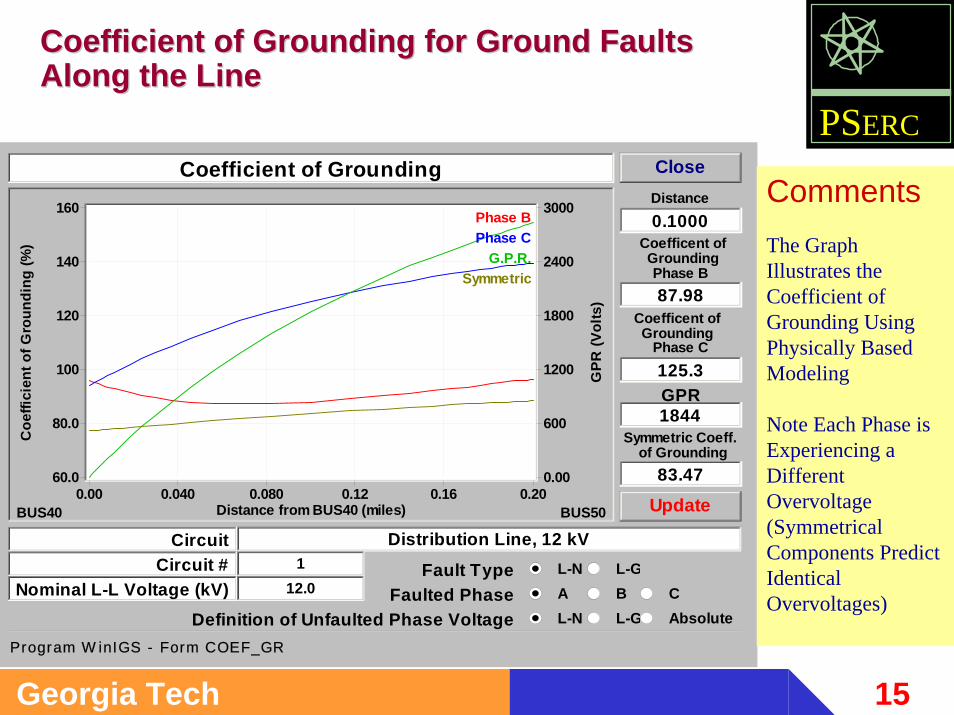
CommentsThe Graph Illustrates the Coefficient of Grounding Using Physically Based Modeling
Note Each Phase is Experiencing a Different Overvoltage(Symmetrical Components Predict Identical Overvoltages)
Coefficient of Grounding for Ground Faults Coefficient of Grounding for Ground Faults Along the LineAlong the Line
16Georgia Tech
PSERC
Stray Voltages and CurrentsSky Wire
HA
HB
HC
I sky
neutralI
Neutral
Counterpoise Ground Rod Ground Rod
I earth~
LA
LB
LC
Ground Mat
~
~
counterpoiseI~
CATV
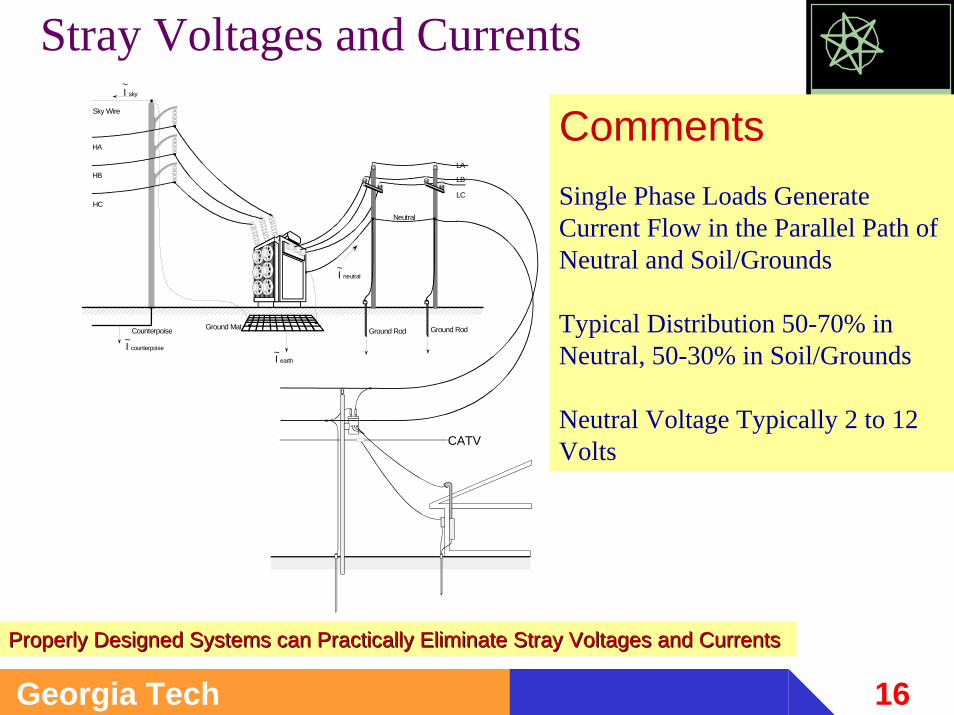
CommentsSingle Phase Loads Generate Current Flow in the Parallel Path of Neutral and Soil/Grounds
Typical Distribution 50-70% in Neutral, 50-30% in Soil/Grounds
Neutral Voltage Typically 2 to 12 Volts
Properly Designed Systems can Practically Eliminate Stray VoltagProperly Designed Systems can Practically Eliminate Stray Voltages and Currentses and Currents
17Georgia Tech
PSERC
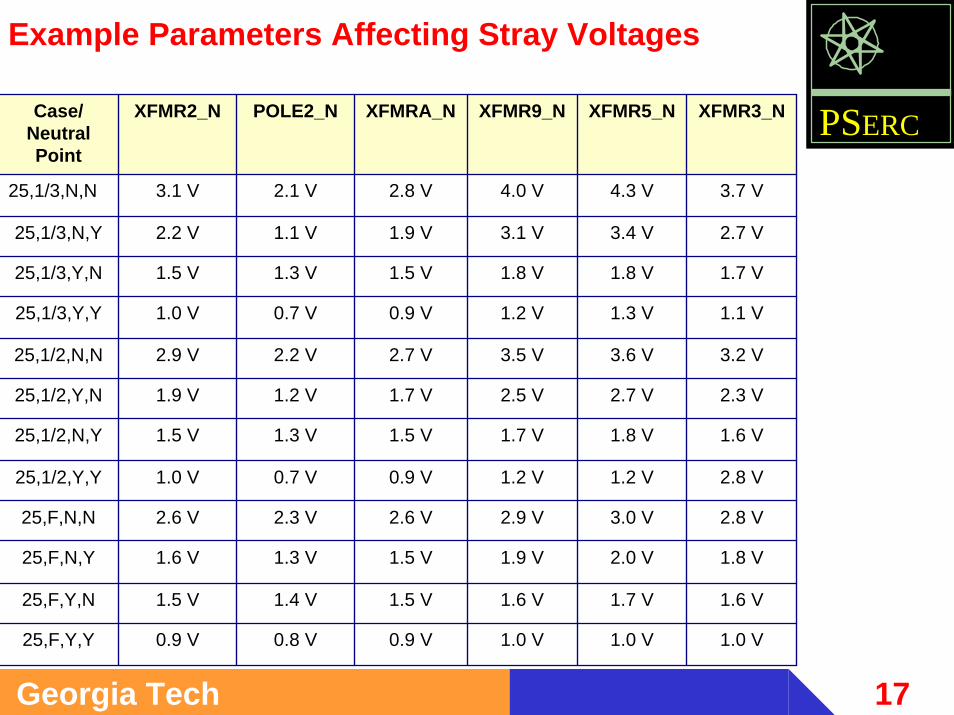
1.0 V1.0 V1.0 V0.9 V0.8 V0.9 V25,F,Y,Y
1.6 V1.7 V1.6 V1.5 V1.4 V1.5 V25,F,Y,N
1.8 V2.0 V1.9 V1.5 V1.3 V1.6 V25,F,N,Y
2.8 V3.0 V2.9 V2.6 V2.3 V2.6 V25,F,N,N
2.8 V1.2 V1.2 V0.9 V0.7 V1.0 V25,1/2,Y,Y
1.6 V1.8 V1.7 V1.5 V1.3 V1.5 V25,1/2,N,Y
2.3 V2.7 V2.5 V1.7 V1.2 V1.9 V25,1/2,Y,N
3.2 V3.6 V3.5 V2.7 V2.2 V2.9 V25,1/2,N,N
1.1 V1.3 V1.2 V0.9 V0.7 V1.0 V25,1/3,Y,Y
1.7 V1.8 V1.8 V1.5 V1.3 V1.5 V25,1/3,Y,N
2.7 V3.4 V3.1 V1.9 V1.1 V2.2 V25,1/3,N,Y
3.7 V4.3 V4.0 V2.8 V2.1 V3.1 V25,1/3,N,N
XFMR3_NXFMR5_NXFMR9_NXFMRA_NPOLE2_NXFMR2_NCase/NeutralPoint
Example Parameters Affecting Stray Voltages
18Georgia Tech
PSERC
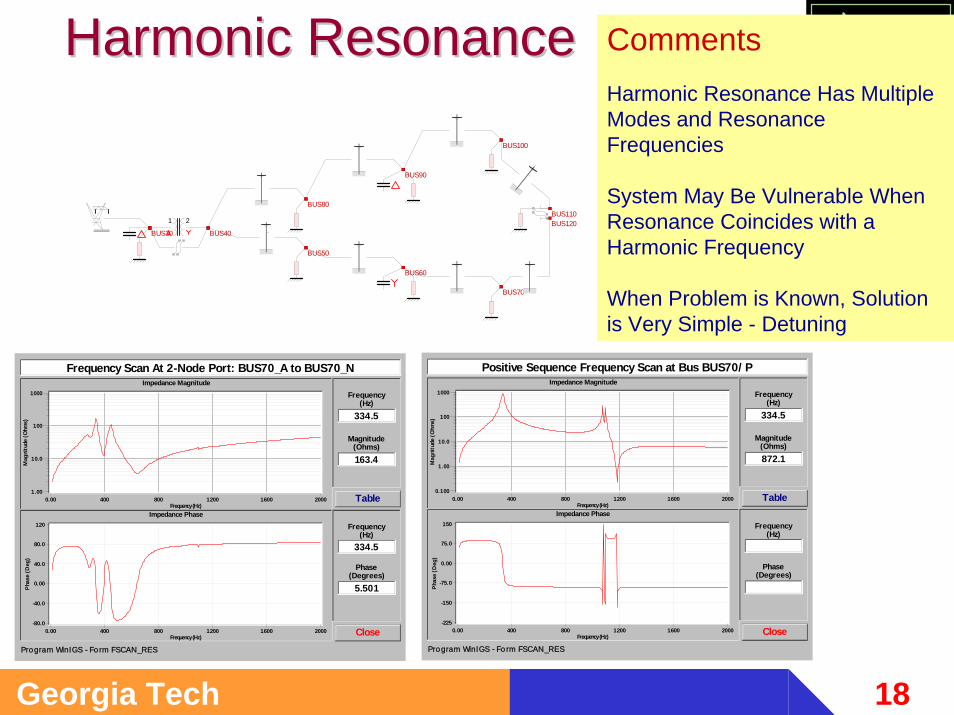
Harmonic ResonanceHarmonic Resonance CommentsHarmonic Resonance Has Multiple Modes and Resonance Frequencies
System May Be Vulnerable When Resonance Coincides with a Harmonic Frequency
When Problem is Known, Solution is Very Simple - Detuning
Close
0.00 400 800 1200 1600 2000Frequency (Hz)
0.100
1.00
10.0
100
1000
Mag
nitu
de (O
hms)
Impedance Magnitude
Positive Sequence Frequency Scan at Bus BUS70/ P
0.00 400 800 1200 1600 2000Frequency (Hz)
-225
-150
-75.0
0.00
75.0
150
Phas
e (D
eg)
Impedance Phase
Table
872.1
Magnitude(Ohms)
Phase(Degrees)
Frequency(Hz)
334.5
Frequency(Hz)
Program WinIGS - Fo rm FSCAN_RES
Close
0.00 400 800 1200 1600 2000Frequency (Hz)
1.00
10.0
100
1000
Mag
nitu
de (O
hms)
Impedance Magnitude
Frequency Scan At 2-Node Port: BUS70_A to BUS70_N
0.00 400 800 1200 1600 2000Frequency (Hz)
-80.0
-40.0
0.00
40.0
80.0
120
Phas
e (D
eg)
Impedance Phase
Table
163.4
Magnitude(Ohms)
Phase(Degrees)
Frequency(Hz)
334.5
Frequency(Hz)
5.501
334.5
Program WinIGS - Fo rm FSCAN_RES
BUS30 BUS40
BUS50
BUS60
BUS70
BUS80
BUS90
BUS100
BUS110BUS1201 2
19Georgia Tech
PSERC
Monte Carlo SimulationEffects Analysis
Select (at Random) a Set of Parameters
Perform Transient Analysis
Characterize “Power Quality” at Customer
Evaluate the Effects
Repeat Process Many-Many Times
20Georgia Tech
PSERC
NA B C
S
wf
D
S
S
dt
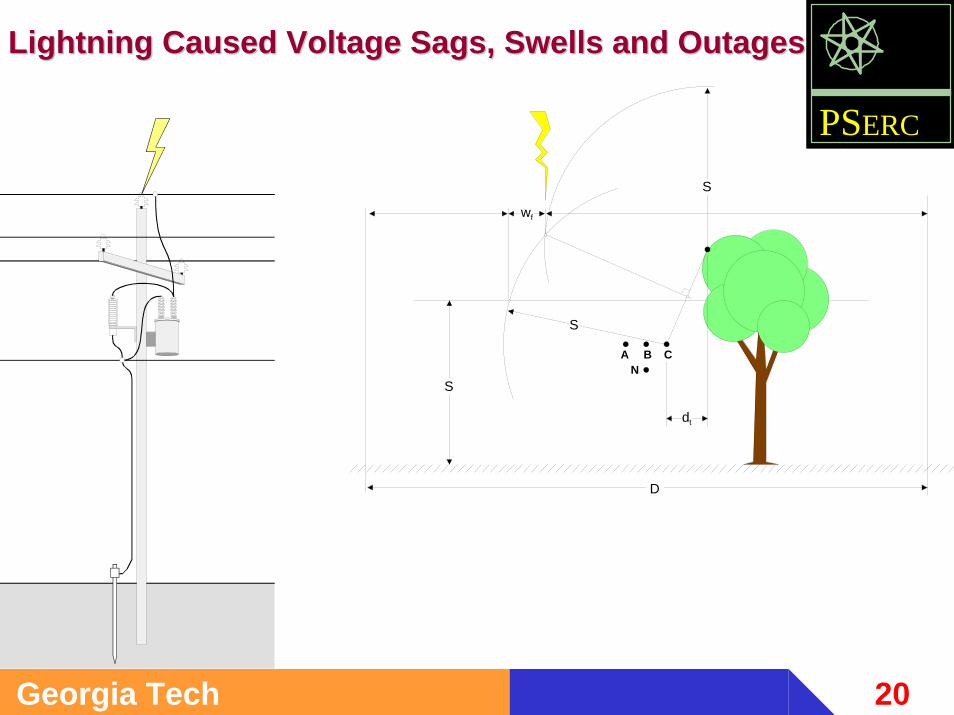
Lightning Caused Voltage Sags, Swells and OutagesLightning Caused Voltage Sags, Swells and Outages
21Georgia Tech
PSERC
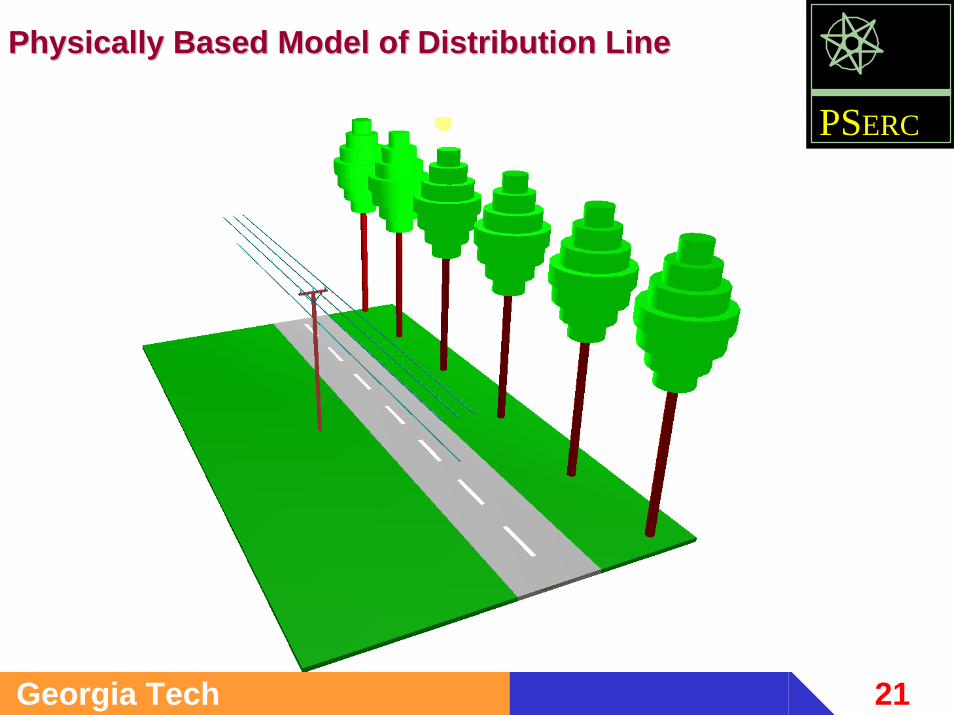
Physically Based Model of Distribution LinePhysically Based Model of Distribution Line
22Georgia Tech
PSERC
1
1
2
2
3
3
4
4
5
5
6
6
7
7
8
8
9
9
10
10
11
11
A A
B B
C C
D D
E E
F F
G G
Advanced Grounding Concepts / WinIGS
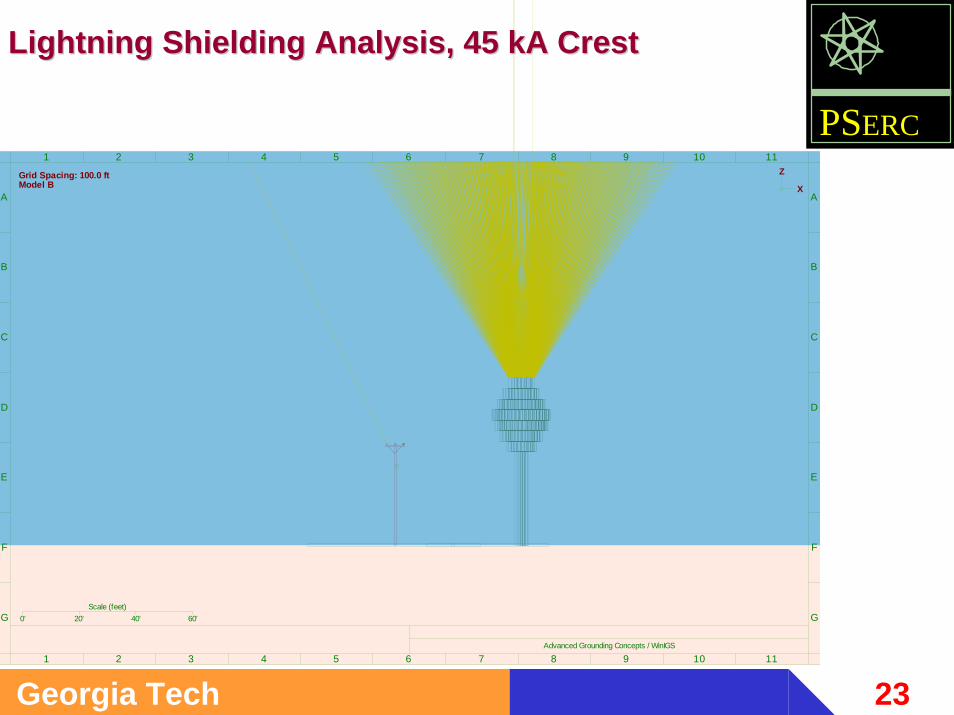
Scale (feet)0' 20' 40' 60'
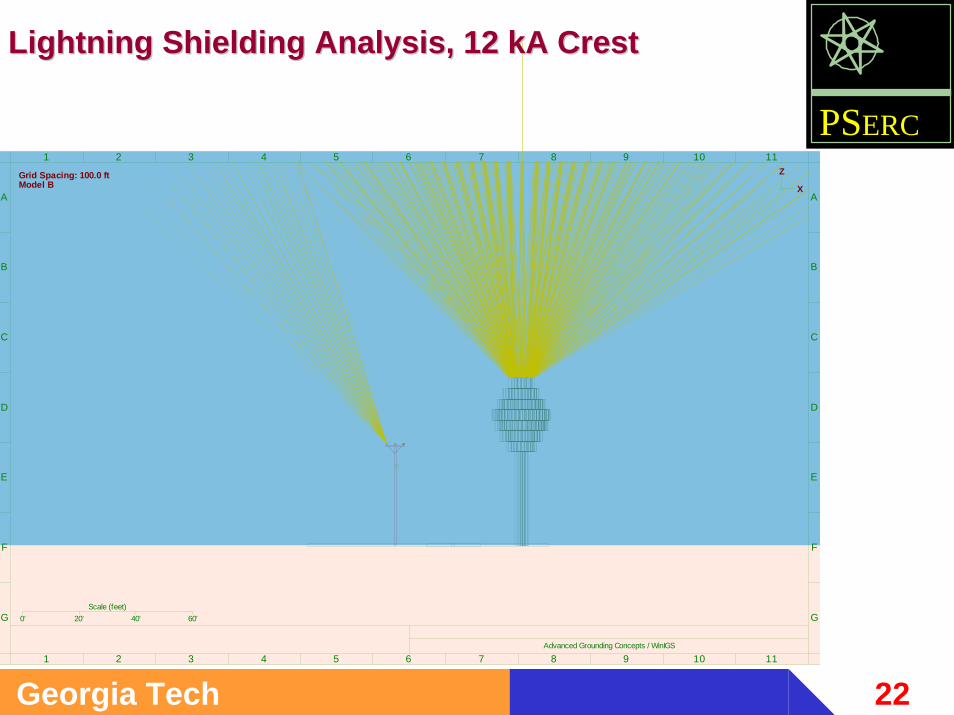
Grid Spacing: 100.0 ftModel B X
Z
Lightning Shielding Analysis, 12 kA CrestLightning Shielding Analysis, 12 kA Crest
23Georgia Tech
PSERC
1
1
2
2
3
3
4
4
5
5
6
6
7
7
8
8
9
9
10
10
11
11
A A
B B
C C
D D
E E
F F
G G
Advanced Grounding Concepts / WinIGS
Scale (feet)0' 20' 40' 60'
Grid Spacing: 100.0 ftModel B X
Z
Lightning Shielding Analysis, 45 kA CrestLightning Shielding Analysis, 45 kA Crest
24Georgia Tech
PSERC
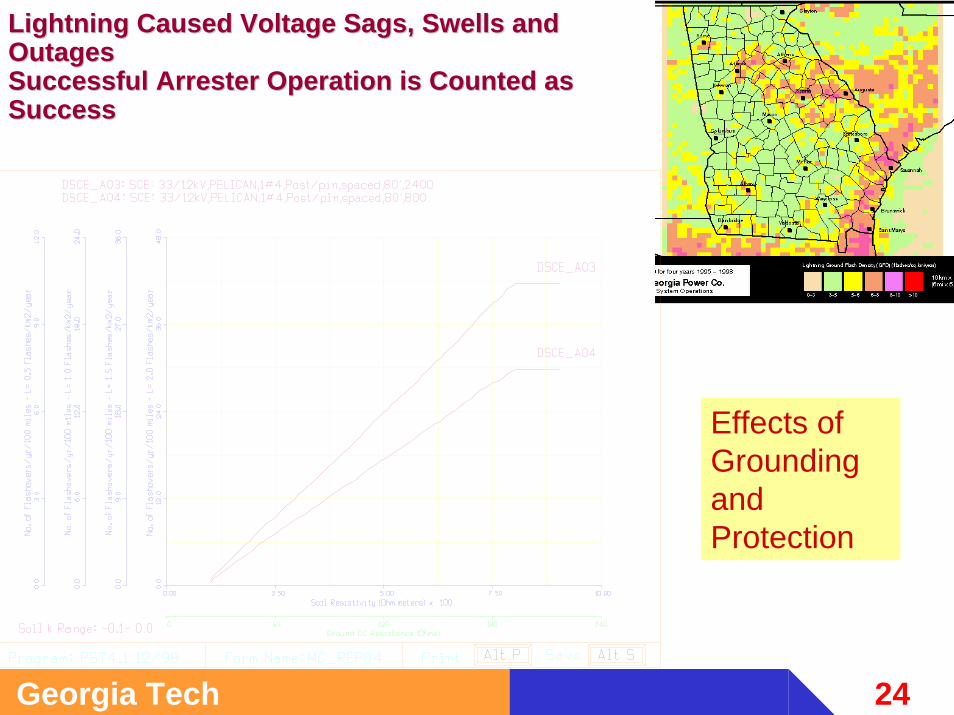
Lightning Caused Voltage Sags, Swells and Lightning Caused Voltage Sags, Swells and OutagesOutagesSuccessful Arrester Operation is Counted as Successful Arrester Operation is Counted as SuccessSuccess
Effects of Grounding and Protection
25Georgia Tech
PSERC
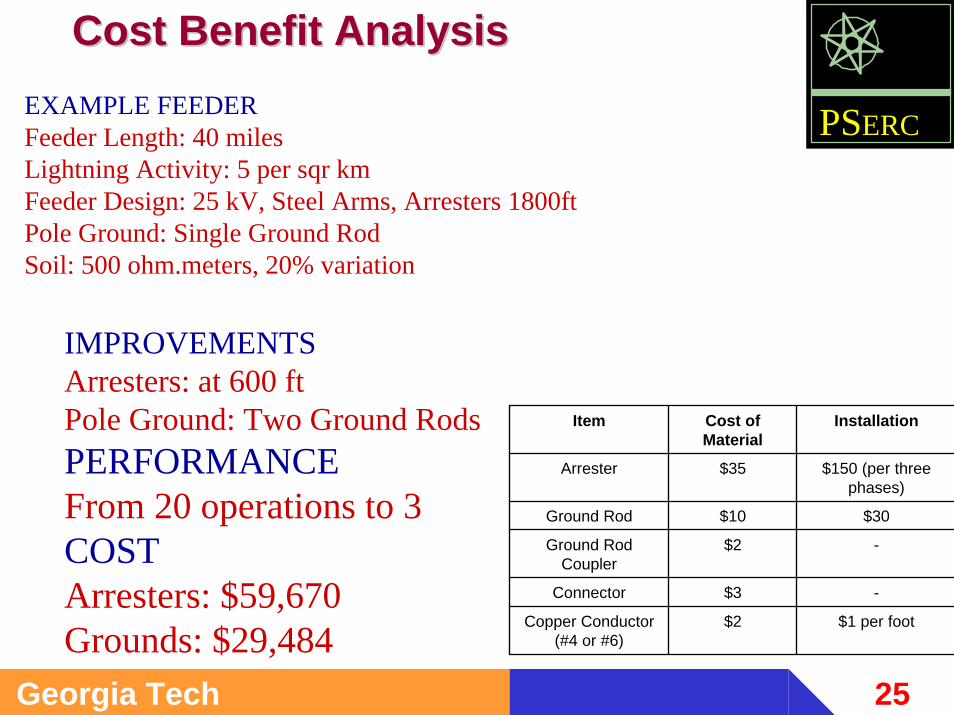
$1 per foot$2Copper Conductor(#4 or #6)
-$3Connector
-$2Ground Rod Coupler
$30$10Ground Rod
$150 (per three phases)
$35Arrester
InstallationCost of Material
Item
Cost Benefit AnalysisCost Benefit AnalysisEXAMPLE FEEDERFeeder Length: 40 milesLightning Activity: 5 per sqr kmFeeder Design: 25 kV, Steel Arms, Arresters 1800ftPole Ground: Single Ground RodSoil: 500 ohm.meters, 20% variation
IMPROVEMENTSArresters: at 600 ftPole Ground: Two Ground RodsPERFORMANCEFrom 20 operations to 3COSTArresters: $59,670Grounds: $29,484
26Georgia Tech
PSERC
L1
N
G
L1
N
G
Time or Frequency
Vol
tage
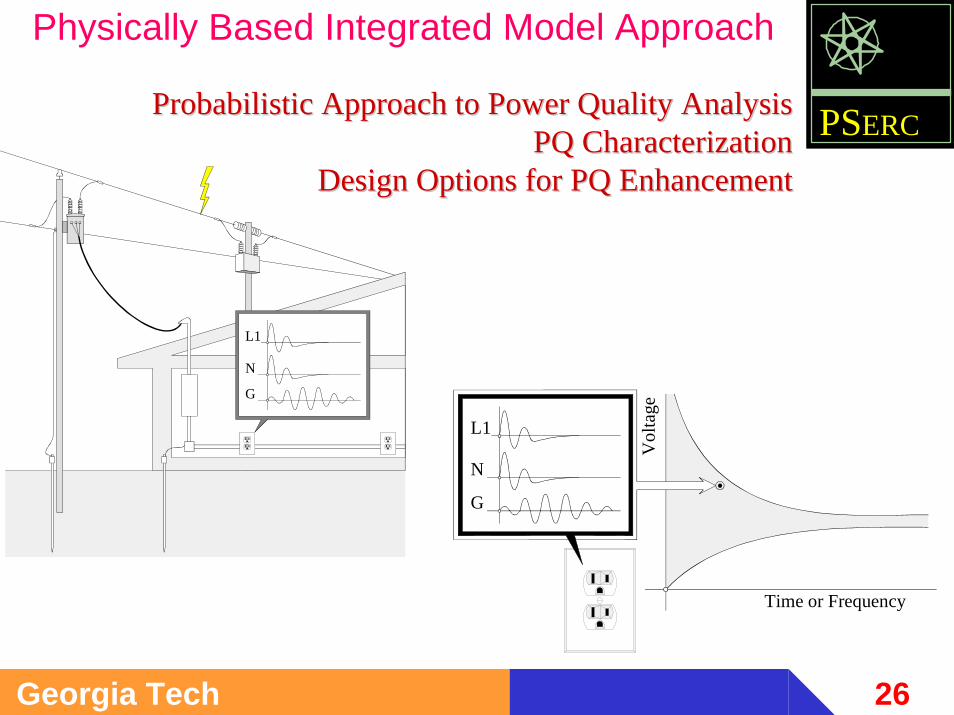
Physically Based Integrated Model Approach
Probabilistic Approach to Power Quality AnalysisProbabilistic Approach to Power Quality AnalysisPQ CharacterizationPQ Characterization
Design Options for PQ EnhancementDesign Options for PQ Enhancement
27Georgia Tech
PSERC
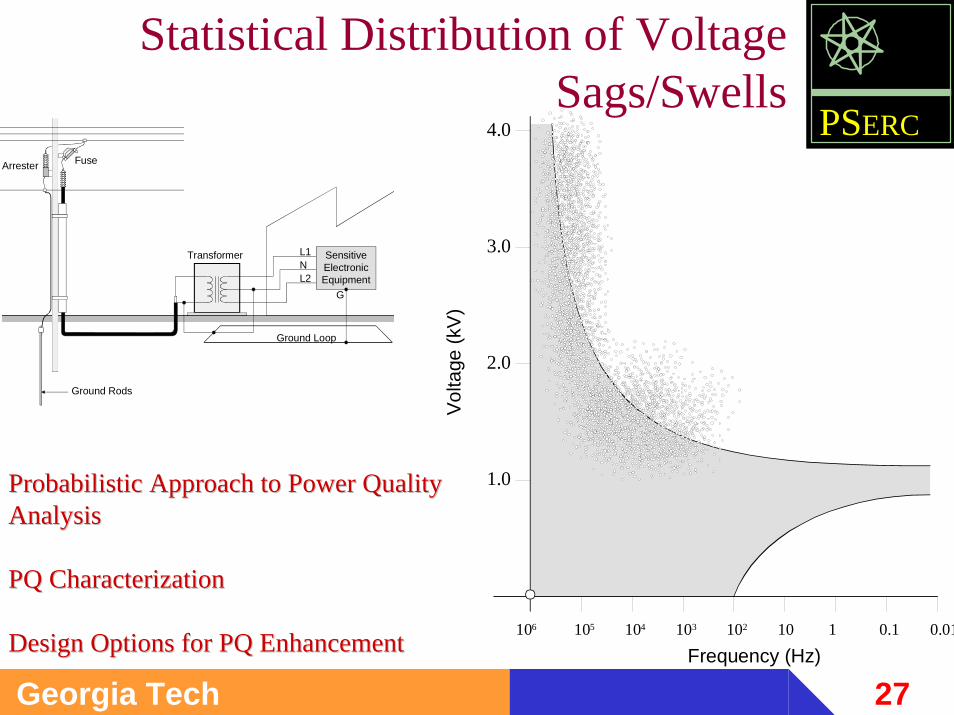
Frequency (Hz)
Volta
ge (k
V)
106 105 103104 10102 0.11 0.01
1.0
2.0
3.0
4.0
Transformer
Arrester Fuse
Ground Rods
L1
L2N
G
Ground Loop
SensitiveElectronicEquipment
Probabilistic Approach to Power Quality Probabilistic Approach to Power Quality AnalysisAnalysis
PQ CharacterizationPQ Characterization
Design Options for PQ EnhancementDesign Options for PQ Enhancement
Statistical Distribution of Voltage Sags/Swells
28Georgia Tech
PSERCConclusions
You Can Do a Lot More with Physically Based Modeling
Disadvantage: More Complex Models
Advantage: Provides the Interrelationship Between Design Parameters and Performance:
Cost-Benefit Analysis


![2] Power & Harmonics Analyzer](https://img.pdfslide.net/doc/110x75/577ce0801a28ab9e78b37845/2-power-harmonics-analyzer.jpg)