Embed Size (px)
Citation preview
B O N N E V I L L E P O W E R A D M I N I S T R A T I O N
BP-16 Rate Proceeding
Power Rates Study Documentation
BP-16-FS-BPA-01A
July 2015

2016 POWER RATES STUDY DOCUMENTATION
TABLE OF CONTENTS
Page
Commonly Used Acronyms .......................................................................................................... iv
INTRODUCTION ...........................................................................................................................1
SECTION 1: INTRODUCTION AND BACKGROUND ..............................................................4
RATES PROCESS MODELING ..............................................................................................5
Rate Development Process Chart.............................................................................................12
SECTION 2: RATESETTING METHODOLOGY AND PROCESS ..........................................14
Table 2.1.1 Disaggregated Load Input Data (RDI 01) .............................................................24
Table 2.1.2 Disaggregated Resource Input Data (RDI 02) ......................................................25
Table 2.1.3 Residential Exchange Summary (RDI 03)............................................................27
Table 2.2.1 Power Sales and Resources (EAF 01) ..................................................................28
Table 2.2.2 Aggregated Loads and Resources (EAF 02) .........................................................30
Table 2.2.3 Calculation of Energy Allocation Factors (EAF 03) ............................................32
Table 2.3.1 Disaggregated Costs and Credits (COSA 01) .......................................................34
Table 2.3.2 Cost Pool Aggregation (COSA 02) ......................................................................39
Table 2.3.3 Computation of Low Density and Irrigation Rate Discount Costs (COSA 03)....40
Table 2.3.4.1 Allocaiton of FBS Costs and LDD/IRD Costs (COSA 04-1) ............................43
Table 2.3.4.2 Allocation of New Resources Costs and Exchange Resource Costs
(COSA 04-2) ......................................................................................................................44
Table 2.3.4.3 Allocation of Conservation, BPA Program and Transmission Costs
(COSA 04-3) ......................................................................................................................45
Table 2.3.5 Allocation of Costs Summary (COSA 05) ...........................................................46
Table 2.3.6 General Revenue Credits (COSA 06) ...................................................................47
Table 2.3.7.1 Revenue Credits Allocated to FBS Costs (COSA 07-1)....................................48
Table 2.3.7.2 Allocation of Transmission Related Revenue Credits (COSA 07-2) ................49
Table 2.3.7.3 Revenue Credits Allocated to New Resource Costs (COSA 07-3) ...................50
Table 2.3.7.4 Revenue Credits Allocated to Conservation Costs (COSA 07-4) .....................51
Table 2.3.7.5 Allocation of Generation Input Related Revenue Credits (COSA 07-5) ...........52
Table 2.3.7.6 Allocation of Non-Federal RSS/RCS Related Revenue Credits (COSA 07-6) .53
Table 2.3.8 Calculation and Allocation of Secondary Revenue Credit (COSA 08) ................54
Table 2.3.9 Calculation and Allocation of FPS Revenue Deficiency Delta (COSA 09) .........55
Table 2.3.10 Calculation of Initial Allocation Power Rates (COSA 10) .................................56
Table 2.4.1 Calculation of the DSI Value of Reserves and Net Industrial Margin (RDS 01) .57
Table 2.4.2 Calculation of Annual Energy Rate Scalars for First IP-PF Link Calculation
(RDS 02) ............................................................................................................................58
Table 2.4.3 Calculation of Monthly Energy Rates Scalars for First IP-PF Link Calculation
(RDS 02) ............................................................................................................................59
Table 2.4.4 Calculation of First IP-PF Link Delta (RDS 04) ..................................................60
BP-16-FS-BPA-01A i

Table 2.4.5 Reallocation of First IP-PF Link Delta and Recalculation of Rates (RDS 05) .....61
Table 2.4.6 Calculation of the IP Floor Rates (RDS 06) .........................................................62
Table 2.4.7 IP Floor Rate Test 1 (RDS 07)..............................................................................63
Table 2.4.8 Calculation of IOU and COU Base Exchange Rates (RDS 08) ...........................64
Table 2.4.9 Calculation of IOU REP Benefits in Rates (RDS 09) ..........................................65
Table 2.4.10 Calculation of REP Base Exchange Benefits (RDS 10) .....................................66
Table 2.4.11 Calculation of Utility Specific PF Exhange Rates and REP Benefits (RDS 11) 67
Table 2.4.12 IOU Reallocation Balances (RDS 12) ................................................................68
Table 2.4.13 Allocation of the Increased PF Exhcnage Costs Due to Settlement (RDS 13) ...69
Table 2.4.14 Calculation of PF, IP and NR Contribution to Net REP Benefit Costs
(RDS 14) ............................................................................................................................70
Table 2.4.15 Reallocation of Rate Protection Provided by IP and NR Rates (RDS 15) .........71
Table 2.4.16 Calculation of Annual Energy Rate Scalars for Second IP-PF Link Rate
Calculation (RDS 16) .........................................................................................................72
Table 2.4.17 Calculations of Monthly Energy Rate Scalars for Second IP-PF Link Rate
Calculation (RDS 17) .........................................................................................................73
Table 2.4.18 IP-PF Link (RDS 18) ..........................................................................................74
Table 2.4.19 Reallocation of IP-PF Link Delta and Recalculation of Rates (RDS 19) ...........75
Table 2.4.20 REP Benefit Reconciliation (RDS 20)................................................................76
Table 2.5.1 Cost Aggregation Under Tiered Rate Methodology (DS 01) ...............................77
Table 2.5.2 Calculation of Unused RHWM (net) Credit (DS 02) ...........................................80
Table 2.5.3 Calculation of Slice Return of Network Losses Adjustment (DS03) ...................81
Table 2.5.4 Balancing Augmentation Adjustment for Change to the Equivalent Teir 1
System Firm Critical Output (DS 04) ................................................................................82
Table 2.5.5 Calculation of Load Shaping and Demand Revenues (DS 05) .............................83
Table 2.5.6 Calculation of PF Public Rates Under Tiered Rate Methodology (DS 06) ..........84
Table 2.5.7.1 Calculation of Net REP Ratemaking and Recovery Demonstration (DS 07-1) 87
Table 2.5.7.2 TRM PFp Revenues Equal to Non-TRM PFp Revenues (DS 07-2) .................88
Table 2.5.8.1 Calculation of Priority Firm Public Tier 1 Rate Equivalent Components
(DS 08-1) ...........................................................................................................................89
Table 2.5.8.2 Calculation of Priority Firm Public Melded Rate Equivalent Components
(DS 08-2) ...........................................................................................................................90
Table 2.5.8.3 Calculation of Industrial Firm Power Rate Components (DS 08-3) ..................91
Table 2.5.8.4 Calculation of New Resource Rate Components (DS 08-4)..............................92
Table 2.5.8.5 Calculation of the Load Shaping True-up Rate (DS 08-5) ................................93
Table 2.5.9.1 Allocated Costs and Unit Costs, Priority Firm Power Rates (DS 09-1) ............94
Table 2.5.9.2 Allocated Costs and Unit Costs, Industrial Firm Power (DS 09-2) ...................95
Table 2.5.9.3 Allocated Costs and Unit Costs, New Resource Firm Power (DS 09-3) ...........96
Table 2.5.9.4 Resource Cost Contribution (DS 09-4) ..............................................................97
SECTION 3: RATE DESIGN ......................................................................................................99
Table 3.1 Summary RSS Revenue Credits for Tier 1 Cost Pools ..........................................103
Table 3.2 Tier 2 Overhead Adder Inputs ...............................................................................104
Table 3.3 Load Shaping Rates ...............................................................................................105
Table 3.4 Tier 1 Demand Rates .............................................................................................106
Table 3.5 Slice Billing Adjustment ........................................................................................107
Table 3.6 Tier 2 Rate Revenues .............................................................................................108
Table 3.7 Tier 2 Rate Inputs ..................................................................................................111
BP-16-FS-BPA-01A ii
Table 3.8 Inputs to TSS Monthly Rate and Charge ...............................................................112
Table 3.9 Tier 2 Short-Term Rate Costing Table ..................................................................113
Table 3.10 Tier 2 Load Growth Rate Costing Table .............................................................114
Table 3.11 Tier 2 VRI-2014 Rate Costing Table ...................................................................115
Table 3.12 Tier 2 VRI-2016 Rate Costing Table ...................................................................116
Table 3.13 Tier 2 Purchases Made by BPA ...........................................................................117
Table 3.14 Total Remarketing Charges and Credits ..............................................................119
Table 3.15 Tier 2 Load Obligations .......................................................................................120
Table 3.16 Customers Receiving a VRI-2014 Tier 2 Remarketing Credit ............................121
Table 3.17 Customers Receiving a VRI-2016 Tier 2 Remarketing Credit ............................122
Table 3.18 Customers Receiving a FY16 Load Growth Billing Adjustment ........................123
Table 3.19 Customers Receiving a FY17 Load Growth Billing Adjustment ........................124
Table 3.20 Weighted LDD for IRD Eligible Utilities............................................................125
Table 3.21 Rates and Charges for RSS and Related Services in FY 2014 and FY 2015 ......126
Table 3.22 Customers Receiving Remarketing Credits for non-Federal Resources
with DFS ..........................................................................................................................128
Table 3.23 WECC and Peak Dues Charge Calculations........................................................129
Table 3.24 Southeast Idaho Load Service Five-Year Market Purchases ...............................130
Table 3.25 Southeast Idaho Load Service Market Purchases - Monthly Power Purchase
Segmented by Cost Pool and by Fiscal Year ...................................................................132
SECTION 4: REVENUE FORECAST .......................................................................................133
Table 4.1 Revenue at Current Rates ......................................................................................135
Table 4.2 Revenue at Proposed Rates ....................................................................................138
Table 4.3 Composite and Non-Slice Revenue – FY 2016-2017 ............................................141
Table 4.4 Load Shaping and Demand Revenue – FY 2016-2017 .........................................142
Table 4.5 Irrigation Rate Discount (IRD) – FY 2016-2017...................................................143
Table 4.6 Low Density Discount (LDD) – FY 2016-2017 ....................................................144
Table 4.7 Tier 2 Revenue – FY 2016-2017 ...........................................................................145
Table 4.8 Direct Service Industries (DSI) Revenues – FY 2016-2017 ..................................146
SECTION 5: RATE SCHEDULES .................................................................... No Documentation
SECTION 6: GENERAL RATE SCHEDULE PROVISIONS .......................... No Documentation
SECTION 7: SLICE ........................................................................................... No Documentation
SECTION 8: AVERAGE SYSTEM COSTS ..............................................................................153
Table 8.1 IOUs Residential Loads and COUs Forecast Exchange Load (MWh) ..................155
Table 8.2 Forecast Average System Costs (ASCs) ................................................................156
BP-16-FS-BPA-01A iii
COMMONLY USED ACRONYMS AND SHORT FORMS ACNR Accumulated Calibrated Net Revenue ACS Ancillary and Control Area Services AF Advance Funding aMW average megawatt(s) ANR Accumulated Net Revenues ASC Average System Cost BAA Balancing Authority Area BiOp Biological Opinion BPA Bonneville Power Administration Btu British thermal unit CDQ Contract Demand Quantity CGS Columbia Generating Station CHWM Contract High Water Mark CIR Capital Investment Review COE U.S. Army Corps of Engineers COI California-Oregon Intertie Commission Federal Energy Regulatory Commission Corps U.S. Army Corps of Engineers COSA Cost of Service Analysis COU consumer-owned utility Council Northwest Power and Conservation Council CP Coincidental Peak CRAC Cost Recovery Adjustment Clause CSP Customer System Peak CT combustion turbine CY calendar year (January through December) DDC Dividend Distribution Clause dec decrease, decrement, or decremental DERBS Dispatchable Energy Resource Balancing Service DFS Diurnal Flattening Service DNR Designated Network Resource DOE Department of Energy DOI Department of Interior DSI direct-service industrial customer or direct-service industry DSO Dispatcher Standing Order EE Energy Efficiency EIS Environmental Impact Statement EN Energy Northwest, Inc. ESA Endangered Species Act ESS Energy Shaping Service e-Tag electronic interchange transaction information FBS Federal base system FCRPS Federal Columbia River Power System FCRTS Federal Columbia River Transmission System
BP-16-FS-BPA-01A iv
FELCC firm energy load carrying capability FORS Forced Outage Reserve Service FPS Firm Power and Surplus Products and Services FPT Formula Power Transmission FY fiscal year (October through September) G&A general and administrative (costs) GARD Generation and Reserves Dispatch (computer model) GMS Grandfathered Generation Management Service GSR Generation Supplied Reactive GRSPs General Rate Schedule Provisions GTA General Transfer Agreement GWh gigawatthour HLH Heavy Load Hour(s) HOSS Hourly Operating and Scheduling Simulator (computer model) HYDSIM Hydrosystem Simulator (computer model) IE Eastern Intertie IM Montana Intertie inc increase, increment, or incremental IOU investor-owned utility IP Industrial Firm Power IPR Integrated Program Review IR Integration of Resources IRD Irrigation Rate Discount IRM Irrigation Rate Mitigation IRMP Irrigation Rate Mitigation Product IS Southern Intertie kcfs thousand cubic feet per second kW kilowatt kWh kilowatthour LDD Low Density Discount LLH Light Load Hour(s) LPP Large Project Program LPTAC Large Project Targeted Adjustment Charge Maf million acre-feet Mid-C Mid-Columbia MMBtu million British thermal units MRNR Minimum Required Net Revenue MW megawatt MWh megawatthour NCP Non-Coincidental Peak NEPA National Environmental Policy Act NERC North American Electric Reliability Corporation NFB National Marine Fisheries Service (NMFS) Federal Columbia River
Power System (FCRPS) Biological Opinion (BiOp) NIFC Northwest Infrastructure Financing Corporation NLSL New Large Single Load
BP-16-FS-BPA-01A v
NMFS National Marine Fisheries Service NOAA Fisheries National Oceanographic and Atmospheric Administration Fisheries NORM Non-Operating Risk Model (computer model) Northwest Power Act Pacific Northwest Electric Power Planning and Conservation Act NP-15 North of Path 15 NPCC Pacific Northwest Electric Power and Conservation Planning
Council NPV net present value NR New Resource Firm Power NRFS NR Resource Flattening Service NT Network Integration NTSA Non-Treaty Storage Agreement NUG non-utility generation NWPP Northwest Power Pool OATT Open Access Transmission Tariff O&M operation and maintenance OATI Open Access Technology International, Inc. OMP Oversupply Management Protocol OS Oversupply OY operating year (August through July) PDCI Pacific DC Intertie Peak Peak Reliability PF Priority Firm Power PFIA Projects Funded in Advance PFp Priority Firm Public PFx Priority Firm Exchange PNCA Pacific Northwest Coordination Agreement PNRR Planned Net Revenues for Risk PNW Pacific Northwest POD Point of Delivery POI Point of Integration or Point of Interconnection POR Point of Receipt Project Act Bonneville Project Act PRS Power Rates Study PS Power Services PSC power sales contract PSW Pacific Southwest PTP Point to Point PUD public or people’s utility district PW WECC and Peak Service RAM Rate Analysis Model (computer model) RD Regional Dialogue REC Renewable Energy Certificate Reclamation U.S. Bureau of Reclamation REP Residential Exchange Program REPSIA REP Settlement Implementation Agreement
BP-16-FS-BPA-01A vi
RevSim Revenue Simulation Model RFA Revenue Forecast Application (database) RHWM Rate Period High Water Mark ROD Record of Decision RPSA Residential Purchase and Sale Agreement RR Resource Replacement RRS Resource Remarketing Service RSC Resource Shaping Charge RSS Resource Support Services RT1SC RHWM Tier 1 System Capability SCD Scheduling, System Control, and Dispatch rate SCS Secondary Crediting Service SDD Short Distance Discount SILS Southeast Idaho Load Service Slice Slice of the System (product) T1SFCO Tier 1 System Firm Critical Output TCMS Transmission Curtailment Management Service TGT Townsend-Garrison Transmission TOCA Tier 1 Cost Allocator TPP Treasury Payment Probability TRAM Transmission Risk Analysis Model Transmission System Act Federal Columbia River Transmission System Act Treaty Columbia River Treaty TRL Total Retail Load TRM Tiered Rate Methodology TS Transmission Services TSS Transmission Scheduling Service UAI Unauthorized Increase UFT Use of Facilities Transmission UIC Unauthorized Increase Charge ULS Unanticipated Load Service USACE U.S. Army Corps of Engineers USBR U.S. Bureau of Reclamation USFWS U.S. Fish & Wildlife Service VERBS Variable Energy Resources Balancing Service VOR Value of Reserves VR1-2014 First Vintage Rate of the BP-14 rate period (PF Tier 2 rate) VR1-2016 First Vintage Rate of the BP-16 rate period (PF Tier 2 rate) WECC Western Electricity Coordinating Council WSPP Western Systems Power Pool
BP-16-FS-BPA-01A vii
DOCUMENTATION FOR THE
2016 POWER RATES STUDY
INTRODUCTION
The Documentation for the Power Rates Study (PRS) shows the details of the calculation of the
proposed Power Rates.
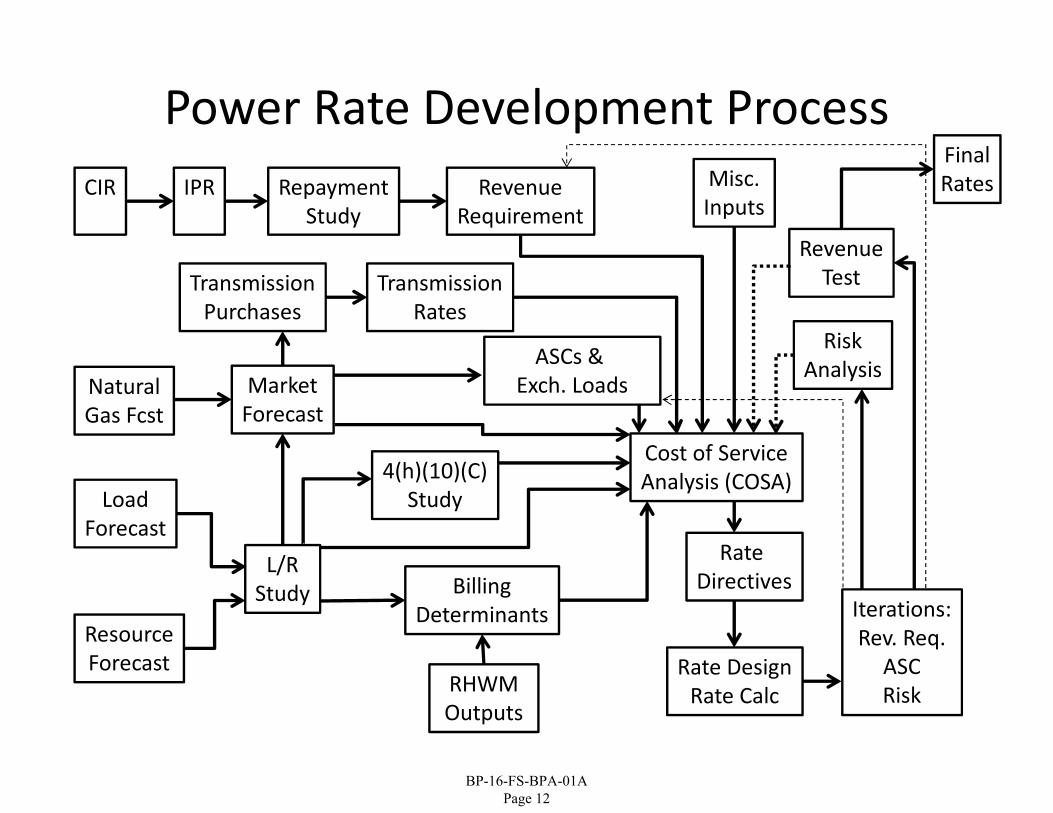
Section 1: Introduction and Background contains an overview of the various models used in the
rate development process and presents a flow chart showing the rate development process.
Section 2: Ratesetting Methodology and Process contains ratemaking tables that are the output of
the Rate Analysis Model (RAM2016). The RAM2016 is a group of computer applications that
perform most of the computations that determine BPA’s proposed power rates. This group
includes the RAM Core Excel-based model, a front-end and back-end database service, and
separate modules for the computation of (1) TRM billing determinants, (2) Tier 2 rates, and
(3) Resource Support Services (RSS) rates and revenues. The output tables of RAM2016
include billing determinants, which are based on power sales forecasts and associated outputs
from the RHWM Process, as well as revenue requirements used in the PRS cost of service
analysis (COSA). A series of tables show the initial allocation of the revenue requirement over
the billing determinants. Next, tables present the rate design steps, incorporating statutory
directives from section 7 of the Northwest Power Act. The final table shows the calculation of
the resource cost contributions that appear in GRSP II.C.
Section 3: Rate Design documents the calculations of the Demand rate and Load Shaping rates,
including the results of the Tier 2 and RSS modules of RAM. The Tier 2 module results include
the Tier 2 rates and charges, billing determinants, rate design adjustments and remarketing
associated with Tier 2, and non-Federal remarketing. The results of the RSS module include the
rate design revenue credits and adjustments associated with RSS and the Resource Shaping
Charge, which are fed into RAM Core for ratemaking purposes, as well as the associated RSS
rates and charges, including the Resource Shaping Charge, the Transmission Scheduling Service
charge, and the Grandfathered Generation Management Service charge. This section also
includes a table that shows the steps to produce the Slice Billing Adjustments by customer,
calculations for WECC and Peak assessment charges, and information on the five-year market
purchases for Southeast Idaho transfer load service.
Section 4: The Revenue Forecast documents revenue forecasts at both current and proposed rates
for the rate period, FY 2016–2017, and at current rates for the period immediately preceding the
two-year rate period, FY 2015.
Section 5: Rate Schedules No documentation
Section 6: General Rate Schedule Provisions No documentation
BP-16-FS-BPA-01A Page 1

Section 7: Slice No documentation
Section 8: Average System Costs documents monthly Residential Exchange Program loads and
forecasted Average System Costs (ASCs).
BP-16-FS-BPA-01A Page 2

This page intentionally left blank
BP-16-FS-BPA-01A Page 3
SECTION 1: INTRODUCTION AND BACKGROUND
BP-16-FS-BPA-01A Page 4
RATE PROCESS MODELING
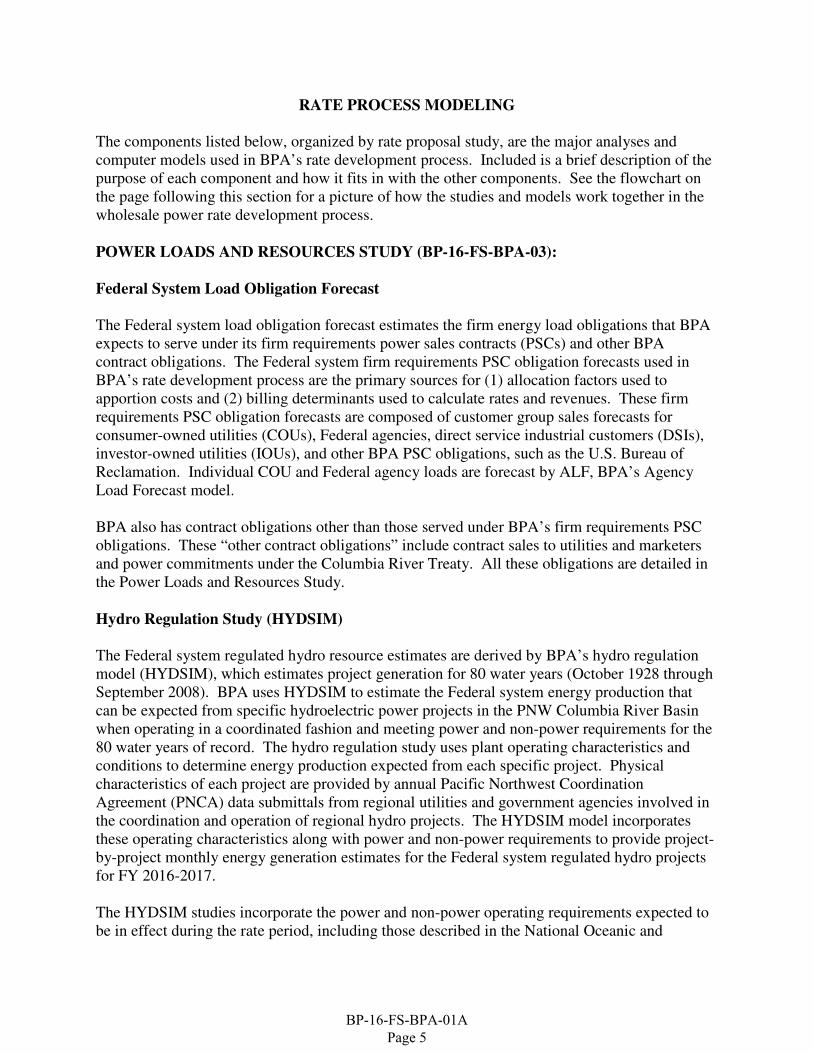
The components listed below, organized by rate proposal study, are the major analyses and
computer models used in BPA’s rate development process. Included is a brief description of the
purpose of each component and how it fits in with the other components. See the flowchart on
the page following this section for a picture of how the studies and models work together in the
wholesale power rate development process.
POWER LOADS AND RESOURCES STUDY (BP-16-FS-BPA-03):
Federal System Load Obligation Forecast
The Federal system load obligation forecast estimates the firm energy load obligations that BPA
expects to serve under its firm requirements power sales contracts (PSCs) and other BPA
contract obligations. The Federal system firm requirements PSC obligation forecasts used in
BPA’s rate development process are the primary sources for (1) allocation factors used to
apportion costs and (2) billing determinants used to calculate rates and revenues. These firm
requirements PSC obligation forecasts are composed of customer group sales forecasts for
consumer-owned utilities (COUs), Federal agencies, direct service industrial customers (DSIs),
investor-owned utilities (IOUs), and other BPA PSC obligations, such as the U.S. Bureau of
Reclamation. Individual COU and Federal agency loads are forecast by ALF, BPA’s Agency
Load Forecast model.
BPA also has contract obligations other than those served under BPA’s firm requirements PSC
obligations. These “other contract obligations” include contract sales to utilities and marketers
and power commitments under the Columbia River Treaty. All these obligations are detailed in
the Power Loads and Resources Study.
Hydro Regulation Study (HYDSIM)
The Federal system regulated hydro resource estimates are derived by BPA’s hydro regulation
model (HYDSIM), which estimates project generation for 80 water years (October 1928 through
September 2008). BPA uses HYDSIM to estimate the Federal system energy production that
can be expected from specific hydroelectric power projects in the PNW Columbia River Basin
when operating in a coordinated fashion and meeting power and non-power requirements for the
80 water years of record. The hydro regulation study uses plant operating characteristics and
conditions to determine energy production expected from each specific project. Physical
characteristics of each project are provided by annual Pacific Northwest Coordination
Agreement (PNCA) data submittals from regional utilities and government agencies involved in
the coordination and operation of regional hydro projects. The HYDSIM model incorporates
these operating characteristics along with power and non-power requirements to provide project-
by-project monthly energy generation estimates for the Federal system regulated hydro projects
for FY 2016-2017.
The HYDSIM studies incorporate the power and non-power operating requirements expected to
be in effect during the rate period, including those described in the National Oceanic and
BP-16-FS-BPA-01A Page 5
Atmospheric Administration (NOAA) Fisheries FCRPS Biological Opinion (BiOp) regarding
salmon and steelhead, published May 5, 2008; the NOAA Fisheries FCRPS Supplemental BiOp,
published May 20, 2010; the NOAA Fisheries FCRPS Supplemental BiOp, published January
17, 2014; the U.S. Fish and Wildlife Service (USFWS) FCRPS BiOp regarding bull trout,
published December 20, 2000; the USFWS Libby BiOp regarding bull trout and Kootenai River
white sturgeon, published February 18, 2006; relevant operations described in the Northwest
Power and Conservation Council’s (NPCC) Fish and Wildlife Program; and other fish mitigation
measures. Each hydro regulation study specifies particular hydroelectric project operations for
fish, such as seasonal flow objectives, minimum flow levels for fish, spill for juvenile fish
passage, reservoir target elevations and drawdown limitations, and turbine operation efficiency
requirements. Additionally, HYDSIM uses hydro plant operating characteristics in combination
with power and non-power requirements to simulate the coordinated operation of the hydro
system. The Federal system hydro generation is used in the Federal system load-resource
balance and is detailed in the Power Loads and Resources Study.
Federal System Load-Resource Balance
The Federal system load-resource balance completes BPA’s loads and resources picture by
comparing Federal system load obligations to Federal system resources. Federal system load
obligations include BPA’s firm requirements PSC obligations and other Federal contract
obligations. Federal system resources include BPA’s regulated and independent hydro resources
under 1937 water conditions, contract purchases, and other non-hydro generating projects. The
result of the Federal system resources less loads yields BPA’s estimated Federal system monthly
firm energy surplus or deficit, in average megawatts. Should the results indicate an energy
deficit in the ratemaking process, augmentation purchases must be made to ensure an annual
energy load-resource balance. The surplus/deficit calculation is performed for each year of the
rate test period and is detailed in the Power Loads and Resources Study. Results from the Power
Loads and Resources Study are used as input into the Power Risk and Market Price Study.
POWER REVENUE REQUIREMENT STUDY (BP-16-FS-BPA-02):
The Power Revenue Requirement Study develops BPA’s generation revenue requirement for the
rate test period. It uses repayment studies for the generation function to determine the schedule
of amortization payments and to project annual interest expense for bonds and appropriations
that fund the Federal investment in hydro, fish and wildlife recovery, conservation, and related
generation assets. Repayment studies are conducted for each year of the rate test period and
extend over the 50-year repayment period. The repayment studies establish a schedule of
planned amortization payments and resulting interest expense by determining the lowest
levelized debt service stream necessary to repay all generation obligations within the required
repayment period. Repayment study results are combined with forecasts of program spending to
create the revenue requirement. The Power Revenue Requirement Study then determines
whether a given set of annual revenues is sufficient to meet projected annual expenses and to
cover a given set of long-term obligations when applied in accordance with the requirements of
DOE Order RA 6120.2.
BP-16-FS-BPA-01A Page 6
POWER RISK AND MARKET PRICE FORECAST STUDY (BP-16-FS-BPA-04):
Secondary Energy Revenue Forecast
The RevSim model is used to forecast secondary energy revenues, balancing power purchase
expenses, and augmentation purchase expenses. After accounting for all loads and resources
(including augmentation purchases), RevSim computes the monthly HLH and LLH quantities of
secondary energy available to sell and power purchases needed to meet firm loads (balancing
purchases) using hydro generation available under 80 years of historical streamflow conditions
(1929-2008). Inputs are forecast loads, non-hydro resources, and hydro generation.
RevSim uses results from two hydro-regulation models, HYDSIM and the Hourly Operating and
Scheduling Simulator (HOSS), plus load forecasts, to compute the available HLH and LLH
surplus energy and deficits in the Federal hydro system under varying streamflow conditions.
RevSim applies HLH and LLH monthly spot market prices supplied by the AURORAxmp model
(see the Market Risk subsection below for a description of the AURORA model) to the sales and
purchase amounts to calculate revenues from surplus energy sales and expenses from balancing
power purchases. It also computes augmentation costs based on hydro generation data and
AURORAxmp prices under 1937 hydro conditions. The Rate Analysis Model (RAM) and the
Power Services Revenue Forecast (see Power Rates Study section below for descriptions of the
RAM and the revenue forecast) both use the surplus energy revenues and balancing and
augmentation power purchase expenses resulting from the Secondary Energy Revenue Forecast
calculated in RevSim.
RevSim computes the 4(h)(10)(C) credits BPA is allowed to credit against its annual U.S.
Treasury payment. The amount of the 4(h)(10)(C) credit is determined by summing the costs of
the operational impacts (power purchases) and the direct program expenses, Pisces computer
software costs, and capital costs, and then multiplying the total cost by 0.223 (22.3 percent). The
operational portion of the 4(h)(10)(C) credit is computed by applying the same AURORAxmp
prices used for the calculation of secondary energy revenues to replacement power purchase
amounts. The calculation of the replacement power purchases for 4(h)(10)(C) is described in the
Power Loads and Resources Study.
Risk Analysis
RevSim in conjunction with AURORAxmp and Non-Operating Risk Model (NORM) are used to
quantify BPA’s net revenue risk. RevSim estimates net revenue variability associated with
various operating risks (load, resource, and natural gas price and 4(h)(10)(C) credit variations).
NORM estimates the non-operating risks that are associated with uncertainties in the cost
projections in the revenue requirement as well as a selection of revenue uncertainties not
captured in RevSim and AURORAxmp. NORM also contains Accrual to Cash adjustments,
which translates net revenue into cash flow. The results from RevSim and NORM are inputs
into the ToolKit, which calculates the probability of BPA making all its scheduled Treasury
payments on time and in full.
BP-16-FS-BPA-01A Page 7
Risk Mitigation
The ToolKit Model is used to determine Treasury Payment Probability (TPP, the probability of
BPA making all its planned Treasury payments during the rate period) given the net revenue
risks quantified in RevSim and NORM and accounting for the impact of the risk mitigation tools.
More specifically, ToolKit is used to assess the effects of various policies and risk mitigation
measures on the level of year-end reserves available for risk that are attributable to Power
Services.
Market Price
The market price run is used in the Power Rates Study for:
(a) the prices for surplus sales and balancing purchases in RAM2016,
(b) the Load Shaping rate,
(c) the Load Shaping True-up rate,
(d) the Resource Shaping rate,
(e) Resource Support Services rates,
(f) shaping the Demand rate,
(g) the PF Tier 2 Balancing Credit,
(h) the PF Unused RHWM Credit,
(i) Tier 1 PF Equivalent Rates,
(j) Melded PF Equivalent Rates,
(k) the Balancing Augmentation Credit, and
(l) NR rate design.
It is used in the Power Risk and Market Price Study for the risk analysis.
The tool used to calculate electric energy prices is a model of the Western Electricity
Coordinating Council (WECC) power system called AURORAxmp. AURORAxmp is an
economic fundamentals-based software application that models wholesale electric energy
transactions in a competitive pricing system. AURORAxmp uses a demand forecast and supply
cost information using WECC data to find an hourly market clearing price, or equivalently, the
marginal cost of electric energy. To determine price in a given hour, AURORAxmp models the
dispatch of electric generating resources in a least-cost order to meet the load (demand) forecast.
The price in the given hour is equal to the variable cost of the marginal resource.
POWER RATES STUDY (BP-16-FS-BPA-01):
Rate Analysis Model (RAM2016)
RAM2016 is a group of computer applications that perform most of the computations that
determine BPA’s proposed power rates. RAM, a spreadsheet-based model, has three main steps
that perform the calculations necessary to develop BPA’s wholesale power rates: Cost of Service
Analysis (COSA) , Rate Directives, and Rate Design.
BP-16-FS-BPA-01A Page 8
1. Cost of Service Analysis. This step ensures that BPA’s proposed rates are consistent
with cost of service principles and comply with BPA’s statutory rate directives. The
COSA Step determines the costs associated with the three resource pools (Federal
base system (FBS), residential exchange, and new resources) used to serve sales load
and then allocates those costs to the rate pools (Priority Firm Power (PF), Industrial
Firm Power (IP), New Resource Firm Power (NR), and Firm Power Products and
Services (FPS)). In addition, the COSA allocates the costs of conservation and other
BPA programs to the rate pools.
2. Rate Directives. The Northwest Power Act requires that some rate adjustments be
made after the initial allocation of costs to ensure that the rate levels for the individual
rate pools (PF Preference, PF Exchange, IP, NR, and FPS) have the proper
relationship to each other. The primary rate adjustments are described in
sections 7(b) and 7(c) of the Northwest Power Act. The Rate Directives Step of
RAM2016 performs these rate adjustments. The amount of PF Public rate protection
and the levels of the IP and NR rate are set assuming a settlement of the legal issues
associated with the Residential Exchange Program.
3. Rate Design. In the COSA and Rate Directive steps, costs are allocated to the various
rate pools; upon completion of these steps, a certain amount of costs have been
allocated to the PF Preference pool. Section 7(e) affords BPA wide latitude in the
design of rates to collect the costs allocated to each rate pool. The Tiered Rate
Methodology (TRM) specifies a cost allocation methodology to PF Preference costs
allocated in the COSA and Rate Directives steps. RAM2016 accomplishes this
separate cost allocation through a process of mapping costs (including net residential
exchange costs) and revenue credits (including IP and NR revenues, if any) to either
the Tier 1 Composite, Non-Slice, Slice, or Tier 2 costs pools, and demonstrating by
“proof” that cost allocations under the TRM and COSA/Rate Directives are
equivalent in terms of aggregate costs recovered from PF Preference, PF Exchange,
IP, and NR. To provide a crosswalk between the differences between COSA
allocations and TRM allocations, the mapping for each is shown in RAM2016 using
unique database keys.
RAM2016 develops three rate designs: (1) a tiered rate design for the PFp rate, in
which the Tier 1 rates are designed using customer charges and demand and energy
rates; (2) a traditional demand and energy design for the PFp Melded rate, the IP rate,
and the NR rate; and (3) a constant annual energy rate for each PFp Tier 2 rate and
the PFx rates. RAM2016 designs rates for each rate pool. For the PFp Melded rate,
the PFx rate, the IP rate, and the NR rate, the rate design can be applied without
further processing.
Resource Support Services Module of RAM
The Resource Support Services (RSS) module of RAM, a spreadsheet-based model, calculates
the charges and rates applied to resources receiving RSS and related services. These services
include Diurnal Flattening Service (DFS), Secondary Crediting Service (SCS), Forced Outage
BP-16-FS-BPA-01A Page 9
Reserve (FORS), and grandfathered Generation Management Service (GMS). The RSS module
of RAM will also calculate, as applicable, each customer’s Resource Shaping Charge (RSC),
Transmission Scheduling Service (TSS) and the Transmission Curtailment Management Service
(TCMS) component of TSS (although the TCMS functionality in the RSS module is not
currently implemented), the aggregate RSS and RSC revenue credits used in RAM Core (an
Excel-based model, one of the computer applications in RAM), and the capacity obligations that
will inform BPA generation planning and the Slice model. The RSS module is also the source of
operating minimums, planned amounts, and FORS energy limits that are defined in the customer
contracts. The RSS model calculates the above for non-Federal resources as well as Federal
resources used as augmentation and Federal resources used to support the Tier 2 rate.
Tier 2 Module of RAM
The Tier 2 module of RAM, a spreadsheet-based model, calculates Tier 2 rates and the
applicable Tier 2 revenue credits and adjustments used in RAM Core that are not already
accounted for in the RSS module of RAM. This module also calculates customer remarketing
credits for amounts of Tier 2 service, non-Federal resource DFS, and Resource Remarketing
Service. It produces the aggregate revenue and cost data associated with remarketing between
the Tier 2 cost pools used in the RAM Core calculation.
Revenue and Power Purchase Expense Forecast
The Revenue Forecast, section 4 of the Power Rates Study, presents BPA’s expected level of
revenue and power purchase expense for FY 2015-2017. FY 2015 revenues are forecast to
estimate the level of reserves at the beginning of the rate period. Selected power purchase
expenses, which affect the sales of surplus energy, are also included. The revenue forecast
documents the revenues at both current and proposed rates by applying rates (PF, IP, and NR, if
applicable) to projected billing determinants. These two revenue forecasts, one with current
rates and the other with proposed rates, are used to demonstrate whether current rates will
recover BPA’s revenue requirement, and if not, whether proposed rates will recover the revenue
requirement. The revenue test is described in the Power Revenue Requirement Study. The
Revenue Forecast uses outputs from a number of sources to determine total revenues expected,
to obtain short-term marketing revenues, balancing power purchase expenses, augmentation
power purchase expenses, and 4(h)(10)(C) credits.
FY 2016-2017 Average System Cost (ASC) Forecasts
ASCs are used in determining the forecast of Residential Exchange Program (REP) benefits that
exchanging utilities are entitled to during the rate period. For purposes of the BP-16 rates, BPA
is using the ASC Reports published by BPA on July 23, 2015.
GENERATION INPUTS
Generation and Reserves Dispatch (GARD) Model
The variable costs associated with providing a quantity of reserves are assessed in the Generation
BP-16-FS-BPA-01A Page 10
and Reserves Dispatch (GARD) Model using inputs from the HYDSIM model, actual system
data, and a pre-processing spreadsheet. The purpose of the GARD model is to calculate the
variable costs incurred as a result of operating the FCRPS with the necessary reserves to
maintain reliability and deploying those reserves to maintain load-resource balance within the
BPA Balancing Authority Area. The GARD model analyzes variable costs in two general
categories. The first category is the “stand ready” costs, those costs associated with making a
project capable of providing reserves. The other includes “deployment costs,” those costs
incurred when the system uses its reserve capability to actually deliver in response to a reserve
need. The GARD model produces the following costs associated with standing ready: (1) energy
shift, (2) efficiency change, (3) cycling losses, and (4) spill losses. GARD also calculates the
following costs associated with deploying reserves: (1) response losses, (2) deployment cycling
losses, and (3) deployment spill losses. After the GARD model is run, the megawatthour values
for each month and HLH and LLH period of the 80 water year set are used by RevSim.
BP-16-FS-BPA-01A Page 11
Power Rate Development Process
CIR IPR Repayment
Study
Revenue
Requirement
Natural
Gas Fcst
Market
Forecast
Load
Forecast
Resource
Forecast
L/R
Study
4(h)(10)(C)
Study
RHWM
Outputs
Billing
Determinants
Transmission
Purchases
Transmission
Rates
ASCs &
Exch. Loads
Cost of Service
Analysis (COSA)
Rate
Directives
Rate Design
Rate Calc
Risk
Analysis
Revenue
Test
Final
Rates
Iterations:
Rev. Req.
ASC
Risk
Misc.
Inputs
BP-16-FS-BPA-01A Page 12

This page intentionally left blank
BP-16-FS-BPA-01A Page 13

SECTION 2: RATESETTING METHODOLOGY AND PROCESS
BP-16-FS-BPA-01A Page 14
Description of Ratemaking Tables
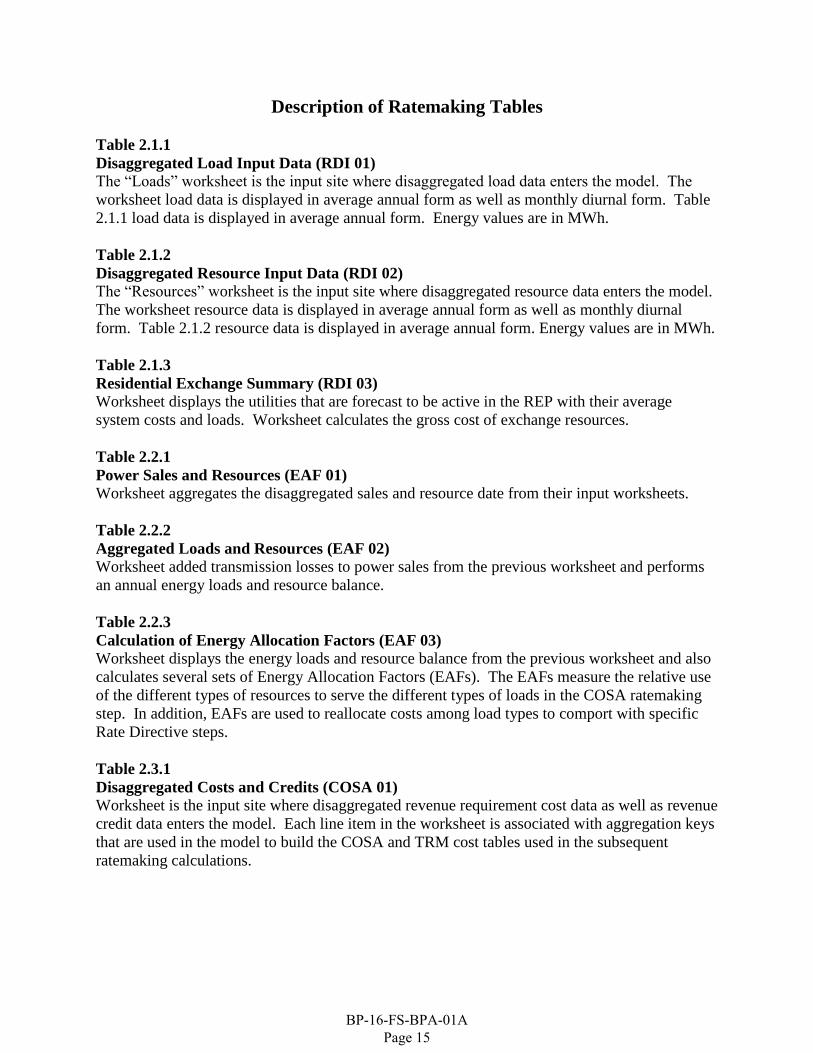
Table 2.1.1
Disaggregated Load Input Data (RDI 01)
The “Loads” worksheet is the input site where disaggregated load data enters the model. The
worksheet load data is displayed in average annual form as well as monthly diurnal form. Table
2.1.1 load data is displayed in average annual form. Energy values are in MWh.
Table 2.1.2
Disaggregated Resource Input Data (RDI 02)
The “Resources” worksheet is the input site where disaggregated resource data enters the model.
The worksheet resource data is displayed in average annual form as well as monthly diurnal
form. Table 2.1.2 resource data is displayed in average annual form. Energy values are in MWh.
Table 2.1.3
Residential Exchange Summary (RDI 03)
Worksheet displays the utilities that are forecast to be active in the REP with their average
system costs and loads. Worksheet calculates the gross cost of exchange resources.
Table 2.2.1
Power Sales and Resources (EAF 01)
Worksheet aggregates the disaggregated sales and resource date from their input worksheets.
Table 2.2.2
Aggregated Loads and Resources (EAF 02) Worksheet added transmission losses to power sales from the previous worksheet and performs
an annual energy loads and resource balance.
Table 2.2.3
Calculation of Energy Allocation Factors (EAF 03) Worksheet displays the energy loads and resource balance from the previous worksheet and also
calculates several sets of Energy Allocation Factors (EAFs). The EAFs measure the relative use
of the different types of resources to serve the different types of loads in the COSA ratemaking
step. In addition, EAFs are used to reallocate costs among load types to comport with specific
Rate Directive steps.
Table 2.3.1
Disaggregated Costs and Credits (COSA 01) Worksheet is the input site where disaggregated revenue requirement cost data as well as revenue
credit data enters the model. Each line item in the worksheet is associated with aggregation keys
that are used in the model to build the COSA and TRM cost tables used in the subsequent
ratemaking calculations.
BP-16-FS-BPA-01A Page 15
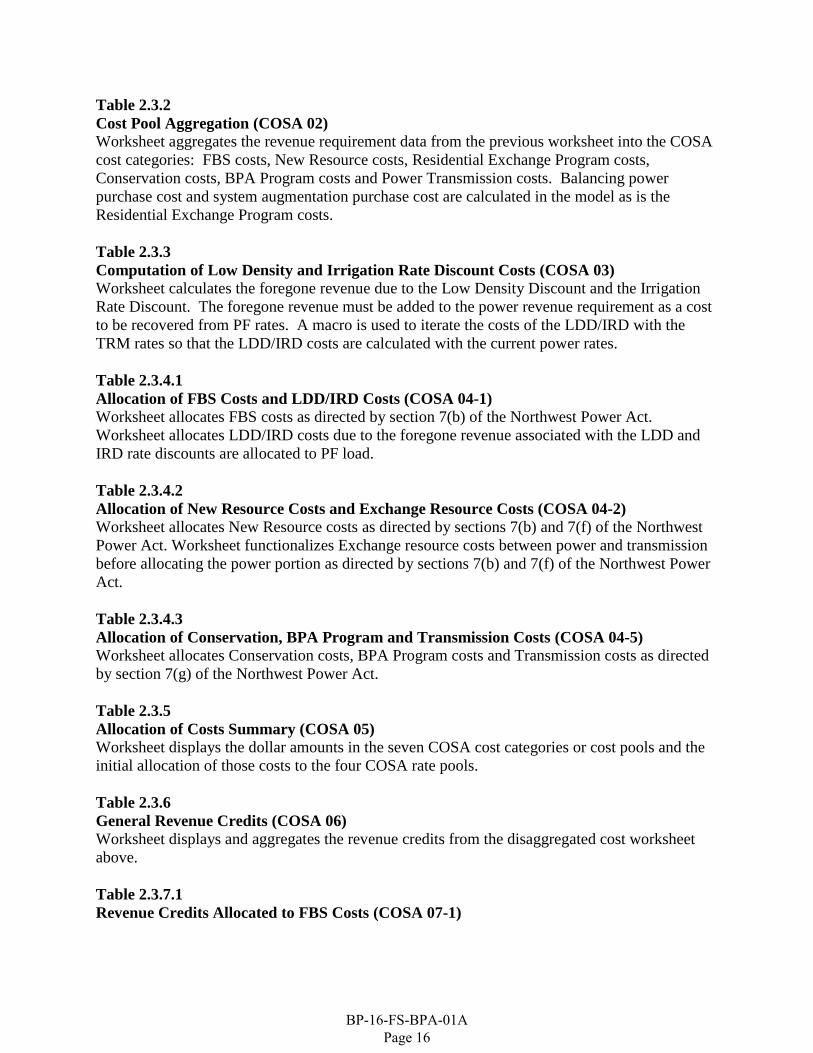
Table 2.3.2
Cost Pool Aggregation (COSA 02) Worksheet aggregates the revenue requirement data from the previous worksheet into the COSA
cost categories: FBS costs, New Resource costs, Residential Exchange Program costs,
Conservation costs, BPA Program costs and Power Transmission costs. Balancing power
purchase cost and system augmentation purchase cost are calculated in the model as is the
Residential Exchange Program costs.
Table 2.3.3
Computation of Low Density and Irrigation Rate Discount Costs (COSA 03) Worksheet calculates the foregone revenue due to the Low Density Discount and the Irrigation
Rate Discount. The foregone revenue must be added to the power revenue requirement as a cost
to be recovered from PF rates. A macro is used to iterate the costs of the LDD/IRD with the
TRM rates so that the LDD/IRD costs are calculated with the current power rates.
Table 2.3.4.1
Allocation of FBS Costs and LDD/IRD Costs (COSA 04-1)
Worksheet allocates FBS costs as directed by section 7(b) of the Northwest Power Act.
Worksheet allocates LDD/IRD costs due to the foregone revenue associated with the LDD and
IRD rate discounts are allocated to PF load.
Table 2.3.4.2
Allocation of New Resource Costs and Exchange Resource Costs (COSA 04-2)
Worksheet allocates New Resource costs as directed by sections 7(b) and 7(f) of the Northwest
Power Act. Worksheet functionalizes Exchange resource costs between power and transmission
before allocating the power portion as directed by sections 7(b) and 7(f) of the Northwest Power
Act.
Table 2.3.4.3
Allocation of Conservation, BPA Program and Transmission Costs (COSA 04-5)
Worksheet allocates Conservation costs, BPA Program costs and Transmission costs as directed
by section 7(g) of the Northwest Power Act.
Table 2.3.5
Allocation of Costs Summary (COSA 05) Worksheet displays the dollar amounts in the seven COSA cost categories or cost pools and the
initial allocation of those costs to the four COSA rate pools.
Table 2.3.6
General Revenue Credits (COSA 06)
Worksheet displays and aggregates the revenue credits from the disaggregated cost worksheet
above.
Table 2.3.7.1
Revenue Credits Allocated to FBS Costs (COSA 07-1)
BP-16-FS-BPA-01A Page 16

Worksheet allocates FBS related revenue credits as directed by section 7(b) of the Northwest
Power Act.
Table 2.3.7.2
Allocation of Transmission Related Revenue Credits (COSA 07-2) Worksheet allocates revenue credits associated with transmission costs as directed by section
7(g) of the Northwest Power Act.
Table 2.3.7.3
Revenue Credits Allocated to New Resource Costs (COSA 07-3)
Worksheet allocates New Resource related revenue credits as directed by sections 7(b) and 7(f)
of the Northwest Power Act.
Table 2.3.7.4
Revenue Credits Allocated to Conservation Costs (COSA 07-4)
Worksheet allocates revenue credits associated with Conservation costs as directed by section
7(g) of the Northwest Power Act.
Table 2.3.7.5
Allocation of Generation Input Related Revenue Credits (COSA 07-5)
Worksheet allocates revenue credits associated with providing generation inputs as directed by
section 7(g) of the Northwest Power Act.
Table 2.3.7.6
Allocation of Non-Federal RSS/RCS Related Revenue Credits (COSA 07-6)
Worksheet allocates revenue credits associated with non-federal RSS/RCS as directed by section
7(g) of the Northwest Power Act.
Table 2.3.8
Calculation and Allocation of Secondary Revenue Credit (COSA 08)
Worksheet calculates the secondary revenue credit for the rate test period. The secondary
revenue credit is allocated to loads that recover FBS and New Resource costs.
Table 2.3.9
Calculation and Allocation of FPS Revenue Deficiency Delta (COSA 09)
Worksheet calculates the firm surplus sale revenue (surplus)/shortfall. The generation revenue
requirement costs allocated to FPS sales are reduced by the excess revenue credit allocated to
FPS sales in the previous worksheet. The resulting costs are compared with the revenues
recovered from FPS sales, resulting in a revenue deficit. This revenue deficit is allocated based
on the service provided by the FBS and NR resources to these rate pools.
Table 2.3.10
Calculation of Initial Allocation Power Rates (COSA 10)
Worksheet uses the cost and revenue credit allocations at this point in the rate modeling when the
COSA allocations have been completed and before the Rate Directive steps to calculate initial
rates.
BP-16-FS-BPA-01A Page 17
Table 2.4.1
Calculation of the DSI Value of Reserves and Net Industrial Margin (RDS 01)
Worksheet is the input site where data used to calculate the Direct Service Industry (DSI) value
of reserves (VOR), Industrial Margin and Net Industrial Margin is input into the model.
Worksheet also calculates the Net Industrial Margin to be used in the calculation of the IP rates.
Table 2.4.2
Calculate Energy Rate Scalars First IP-PF Link Calculation (RDS 02)
Worksheet calculates the annual scalar adjustments needed to scale the market price monthly
diurnal energy rates such that the resultant energy rates recover the PF rate and IP rate revenue
requirements at this point in the ratemaking.
Table 2.4.3
Calculate Monthly Energy Rates Used in First IP - PF Link Calculation (RDS 03)
Worksheet uses the annual energy rate scalars calculated in the previous worksheet to produce
monthly diurnal energy rates for PF and IP rates. The annual scalars for both PF and IP rates are
then applied to the monthly market price curve to produce a monthly shape to the PF energy
rates (at the PF load shape) and the IP energy rate (at the IP load shape).
Table 2.4.4
Calculation of First IP-PF Link Delta (RDS 04)
Worksheet uses shaped energy rates from the previous worksheet to calculate the first IP-PF link
delta. The IP-PF Link 7(c)(2) adjustment is necessary to account for the difference between the
revenues expected to be recovered from the DSIs at the IP rate and the costs allocated to the
DSIs at this point in the ratemaking. This difference, known as the 7(c)(2) Delta, is allocated to
non-DSI rates, primarily the PF rate. The IP rate is a formula rate based on the “applicable
wholesale rate,” the load-weighted PF and NR rates. The interaction between the applicable
wholesale rate and the IP rate has been reduced to an algebraic formula to approximate a
solution, and then the RAM uses an intrinsic Excel function, “Goal Seek,” to converge to a
solution for each year of the rate test period
Table 2.4.5
Allocation of First IP-PF Link delta and Recalculation of Rates (RDS 05)
Worksheet reallocates the first IP-PF link delta from the previous worksheet. The delta amount is
reallocated from IP to all other loads (7b and 7f loads associated with PF Preference, PF
Exchange, and NR).
Table 2.4.6
Calculation of the DSI Floor Rate (RDS 06)
The IP-83 rates are applied to the current DSI test period billing determinants to determine an
average rate. Adjustments are made for Transmission, Exchange Cost, and Deferral to yield the
DSI floor rate.
Table 2.4.7
DSI Floor Rate Test 1 (RDS 07)
BP-16-FS-BPA-01A Page 18
A test is conducted comparing the IP rate at this stage in the rate-making process to the floor rate
established above.
Table 2.4.8
Calculation of IOU and COU Base Exchange Rates (RDS 08)
Worksheet calculates the Base Exchange rates for IOU and COU exchanging utilities. The IOU
Base Exchange rate is the unbifurcated PF rate with transmission costs added. The COU Base
Exchange rate differs in that it is calculated without Tier 2 costs and loads.
Table 2.4.9
Calculation of IOU REP Benefits in Rates (RDS 09) Worksheet calculates the annual IOU REP Benefits to be recovered in power rates.
Table 2.4.10
Calculation of REP Unconstrained Benefits (RDS 10) Worksheet calculates the REP benefits assuming no PF Public rate protection. The IOU and
COU Base PF Exchange rates are subtracted from each IOU and COU individual utility average
system cost and that difference is multiplied by the utility’s exchangeable load to yield its
Unconstrained Benefit.
Table 2.4.11
Calculation of Utility Specific PF Exchange Rates and REP Benefits (RDS 11)
Worksheet calculates utility specific PF Exchange rates by adding a utility specific REP
Settlement Charge to the Base Exchange rate. The IOU REP Settlement Charges are sized to
collect the difference between the Unconstrained Benefits for the IOUs and the REP Settlement
Benefit for the IOUs. This amount is the PF Public rate protection provided by the IOU
Exchangers. The IOU Settlement Charges are computed for each utility by allocating this rate
protection amount among the IOUs according to the relative size of their share of the
Unconstrained Benefits. COUs Settlement Charges are computed by imputing an amount of
“protection” equivalent to the IOU Settlement.
Table 2.4.12
IOU Reallocation Balances (RDS 12)
Table 2.4.11 performs a reallocation of benefits between the IOUs to account for differential
outstanding Lookback balances at the time of the REP Settlement. The procedure for the
reallocation is included in section 6.2 of the Settlement Agreement. This table shows the
outstanding balances each IOU is obligated to repay to other IOUs, if any, for the full term of the
Regional Dialogue contracts. Provided that each utility has sufficient benefit amounts prior to
reallocation, these amounts (and scheduled future amounts) will not change. However, if a
particular utility has insufficient benefits in any one rate period to pay down its reallocation
obligation, the scheduled payment amounts will be recalculated.
Table 2.4.13
Allocation of the Increased PF Exchange Costs Due to Settlement (RDS 13)
BP-16-FS-BPA-01A Page 19
The difference between the Unconstrained Benefits and the REP Settlement benefits is allocated
to the Priority Firm Exchange loads and away from the PF Preference loads. Average power
rates are calculated after this reallocation of costs.
Table 2.4.14
Calculation of PF, IP and NR Contribution to Net REP Benefit Costs (RDS 14)
At this point in the REP Settlement rate modeling, the cost of providing IOU and COU Net REP
Benefits is assumed to be spread pro-rata by load to all PF Public, IP, and NR load. A
reallocation adjustment is performed to make the REP Benefit cost contribution of the various
rate pools comport with the Net REP Exchange cost contribution present in the WP-10 rate
proceeding. The ratio of BP-12 to WP-10 net benefits is used as a factor applied to scale down
(or up) the supplemental surcharge from its WP-10 level, and apply this surcharge to IP and NR
load to determine the amount of net REP dollars which should be applied to IP and NR loads..
Table 2.4.15
Reallocate Rate Protection Provided by IP and NR Rates (RDS 15)
Worksheet reallocates the rate protection amount provided by the IP and NR rates from the
previous worksheet to the PF Public rate pool. Rates are then computed.
Table 2.4.16
Annual PF and IP scalar under Settlement (RDS 16)
Worksheet calculates the annual scalar adjustments needed to scale the market price monthly
diurnal energy rates such that the resultant energy rates recover the PF rate and IP rate revenue
requirements at this point in the ratemaking.
Table 2.4.17
Monthly PF and IP rates under Settlement (RDS 17)
Worksheet uses the annual energy rate scalars calculated in the previous worksheet to produce
monthly diurnal energy rates for PF and IP rates. The annual scalars for both PF and IP rates are
then applied to the monthly market price curve to produce a monthly shape to the PF energy
rates (at the PF load shape) and the IP energy rate (at the IP load shape).
Table 2.4.18
IP_PF Link (RDS 18)
Worksheet uses shaped energy rates from previous worksheet to calculate the IP-PF link delta.
The IP-PF Link 7(c)(2) adjustment is necessary to account for the difference between the
revenues expected to be recovered from the DSIs at the IP rate and the costs allocated to the
DSIs at this point in the ratemaking. This difference, known as the 7(c)(2) Delta, is allocated to
non-DSI rates, primarily the PF rate. The IP rate is a formula rate based on the “applicable
wholesale rate,” the load-weighted PF and NR rates. The interaction between the applicable
wholesale rate and the IP rate has been reduced to an algebraic formula to approximate a
solution, and then the RAM uses an intrinsic Excel function, “Goal Seek,” to converge to a
solution for each year of the rate test period
Table 2.4.19
Reallocation of IP-PF Link Delta (RDS 19)
BP-16-FS-BPA-01A Page 20
Worksheet Reallocates IP-PF Link Delta dollars from IP to PF preference and NR loads and
recalculates average power rates.
Table 2.4.20
REP Benefit Reconciliation (RDS 20)
This worksheet does a comparison of calculated REP benefits to the cost/revenue allocations
from the COSA step.
Table 2.5.1
Cost Aggregation under Tiered Rate Methodology (DS 01) Worksheet aggregates costs and credits to be used in the TRM ratemaking. The TRM specifies a
cost allocation methodology different from what is used in the COSA to separate costs into the
various TRM cost pools. The mapping of costs to the TRM cost pools includes costs passed from
the Power Revenue Requirement Study, credits passed from the revenue forecast, and cost and
credit line items internally computed in RAM2012. For each cost pool under TRM, costs are
conveniently grouped according to their COSA classification.
Table 2.5.2
Calculation of Unused RHWM (net) Credit (DS 02) Worksheet calculates the $/MWh value for unused Rate Period High Water Mark. That value is
used to determine the reallocation adjustment to distribute costs between the Composite and
Non-Slice cost pools properly.
Table 2.5.3
Calculation of Slice Return of Network Losses Adjustment (DS 03) Worksheet calculates the value of power associated with Non-slice network losses, such that
these costs can explicitly be included in the Nonslice cost pool. This leaves only system losses
for which all Composite customers pay (regardless of product subscription) in the Composite
cost pool, and properly accounts for Customer return of Slice-Resource losses. That value is
used to determine the reallocation credit that will shift costs between the Composite and Non-
Slice TRM cost pools.
Table 2.5.4
Calculation of Load Shaping and Demand Revenues (DS 04) Worksheet calculates the Load Shaping and Demand revenues under the TRM rate design.
These revenues are used as a credit against the costs in the Non-Slice rate pool.
Table 2.5.5
Calculation of PF Public Rates under Tiered Rate Methodology (DS 05)
Worksheet applies the costs, revenue credits and inter-rate-pool reallocations to the Composite,
Non-Slice, Slice and Tier 2 TRM rate pools to produce TRM rates. The TRM rates are in the
form of monthly $/percent TOCA.
Table 2.5.6.1
Calculation of Net REP Ratemaking and Recovery Demonstration (DS 06-1)
BP-16-FS-BPA-01A Page 21
Worksheet applies all power costs and revenue credits to the PF Public rate pool. The IP
revenues are calculated with a macro to arrive at the proper relationship between the PFp rate
and the IP rate. The net REP benefits are used in the calculations. The worksheet demonstrates
that the PFp rate using the net REP benefits is identical to the PFp calculated with BPA’s
standard gross REP methodology.
Table 2.5.6.2
TRM PFp Revenues Equal to Non-TRM PFp Revenues (DS 06-2) Worksheet demonstrates that the TRM revenues from Table 2.5.5 are equal to the non-TRM
revenues from Table 2.5.6.1.
Table 2.5.7.1
Calculation of Priority Firm Public Tier 1 Rate Equivalent Components (DS 07-1)
Worksheet calculates the energy and demand components for a PF Public rate that is equivalent
to a Tier 1 PF rate. The monthly energy Load Shaping rates are adjusted by a scalar in all
periods so that they and the monthly demand rates will recover the Tier 1 PF revenue
requirement.
Table 2.5.7.2
Calculation of Priority Firm Public Melded Rate Equivalent Components (DS 07-2)
Worksheet calculates the energy and demand components for a PF Public rate that is equivalent
to a melded Tier 1 and Tier 2 PF rate. The monthly energy Load Shaping rates are adjusted by a
scalar in all periods so that they and the monthly demand rates will recover the Tier 1 and Tier 2
PF revenue requirement. These monthly energy PF rates are necessary to calculate the Industrial
Firm Power rates.
Table 2.5.7.3
Calculation of Industrial Firm Power Rate Components (DS 07-3)
Worksheet calculates the Industrial Firm Power (IP) rate monthly energy and demand
components. The IP rate is a formula rate derived from the “applicable wholesale rate.” In this
rate proceeding, with no NR load, the applicable wholesale rate is the melded PF Public rate.
The monthly IP energy rates are set equal to the melded PF rate, plus the DSI value of reserve
(VOR), plus the Industrial Margin, plus the Settlement Charge.
Table 2.5.7.4
Calculation of New Resource Rate Components (DS 07-4) Worksheet calculates the energy and demand components for the New Resources (NR) rate. The
monthly energy Load Shaping rates are adjusted by a scalar in all periods so that they and the
monthly demand rates will recover the NR revenue requirement.
Table 2.5.7.5
Calculation of the Load Shaping True-up Rate (DS 07-5) Worksheet calculates the Load Shaping True-up rate by comparing the non-slice Tier 1 market
energy revenue (the non-slice Tier 1 loads times the market rates) with the non-slice Tier 1
energy revenue at Tier 1 rates. The difference in the form of a $/MWh is the Load Shaping
True-up rate.
BP-16-FS-BPA-01A Page 22

Table 2.5.8.1
Allocated Costs and Unit Costs, Priority Firm Power Rates (DS 08-1)
Table provides a summary of the various COSA cost allocations and Rate Design Adjustments
associated with Priority Firm Public Power and Priority Firm Exchange Power. A percent
contribution to the final Priority Firm Preference Power rate and Priority Firm Exchange Power
rate for each COSA cost allocation and Rate Design Adjustment is calculated.
Table 2.5.8.2
Allocated Costs and Unit Costs, Industrial Firm Power (DS 08-2)
Table provides a summary of the various COSA cost allocations and Rate Design Adjustments
associated with Industrial Firm Power. A percent contribution to the final Industrial Firm Power
rate for each COSA cost allocation and Rate Design Adjustment is calculated.
Table 2.5.8.3
Allocated Costs and Unit Costs, New Resource Firm Power (DS 08-3)
Table provides a summary of the various COSA cost allocations and Rate Design Adjustments
associated with New Resource Firm Power. A percent contribution to the final New Resource
Firm Power rate for each COSA cost allocation and Rate Design Adjustment is calculated.
Table 2.5.8.4
Resource Cost Contribution (DS 08-4)
Table provides a summary of the percentages of each resource pool, FBS, Residential Exchange,
and New Resources, used in ratemaking to serve each of the rate pools, PF, IP, NR, and FPS.
BP-16-FS-BPA-01A Page 23
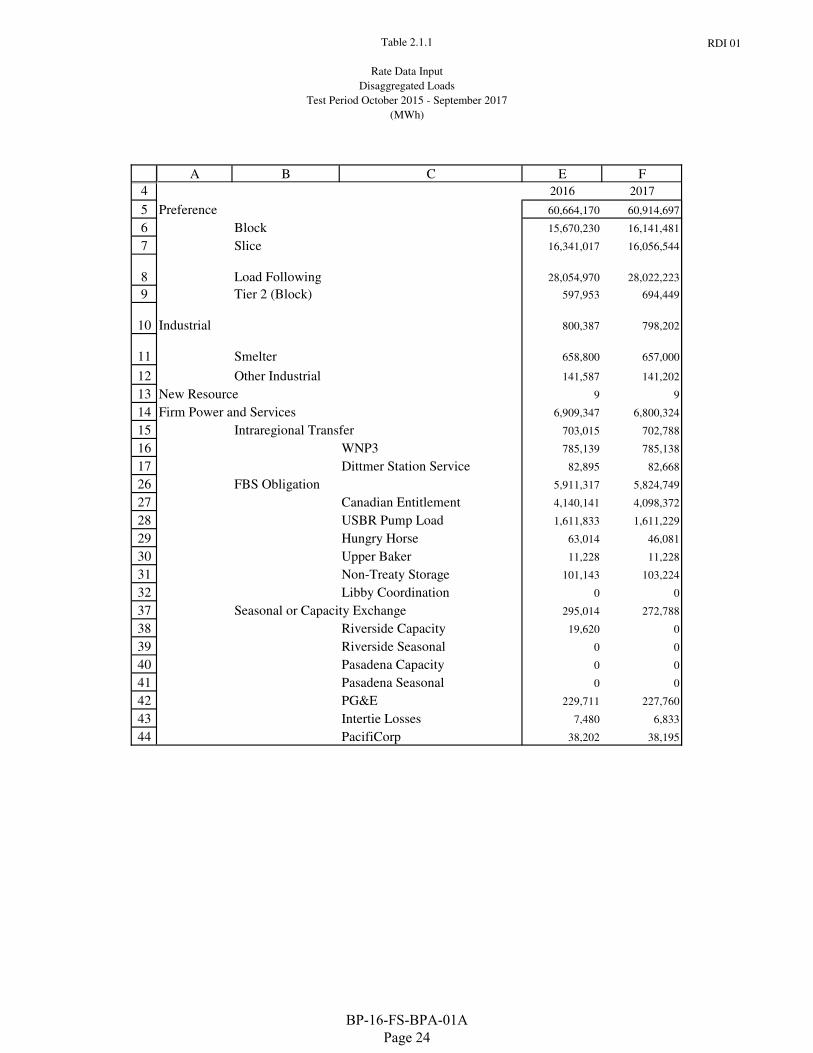
Table 2.1.1
Rate Data Input
Disaggregated Loads
Test Period October 2015 - September 2017
(MWh)
RDI 01
4
5
6
7
8
9
10
11
12
13
14
15
16
17
26
27
28
29
30
31
32
37
38
39
40
41
42
43
44
A B C E F
2016 2017
Preference 60,664,170 60,914,697
Block 15,670,230 16,141,481
Slice 16,341,017 16,056,544
Load Following 28,054,970 28,022,223
Tier 2 (Block) 597,953 694,449
Industrial 800,387 798,202
Smelter 658,800 657,000
Other Industrial 141,587 141,202
New Resource 9 9
Firm Power and Services 6,909,347 6,800,324
Intraregional Transfer 703,015 702,788
WNP3 785,139 785,138
Dittmer Station Service 82,895 82,668
FBS Obligation 5,911,317 5,824,749
Canadian Entitlement 4,140,141 4,098,372
USBR Pump Load 1,611,833 1,611,229
Hungry Horse 63,014 46,081
Upper Baker 11,228 11,228
Non-Treaty Storage 101,143 103,224
Libby Coordination 0 0
Seasonal or Capacity Exchange 295,014 272,788
Riverside Capacity 19,620 0
Riverside Seasonal 0 0
Pasadena Capacity 0 0
Pasadena Seasonal 0 0
PG&E 229,711 227,760
Intertie Losses 7,480 6,833
PacifiCorp 38,202 38,195
BP-16-FS-BPA-01A Page 24
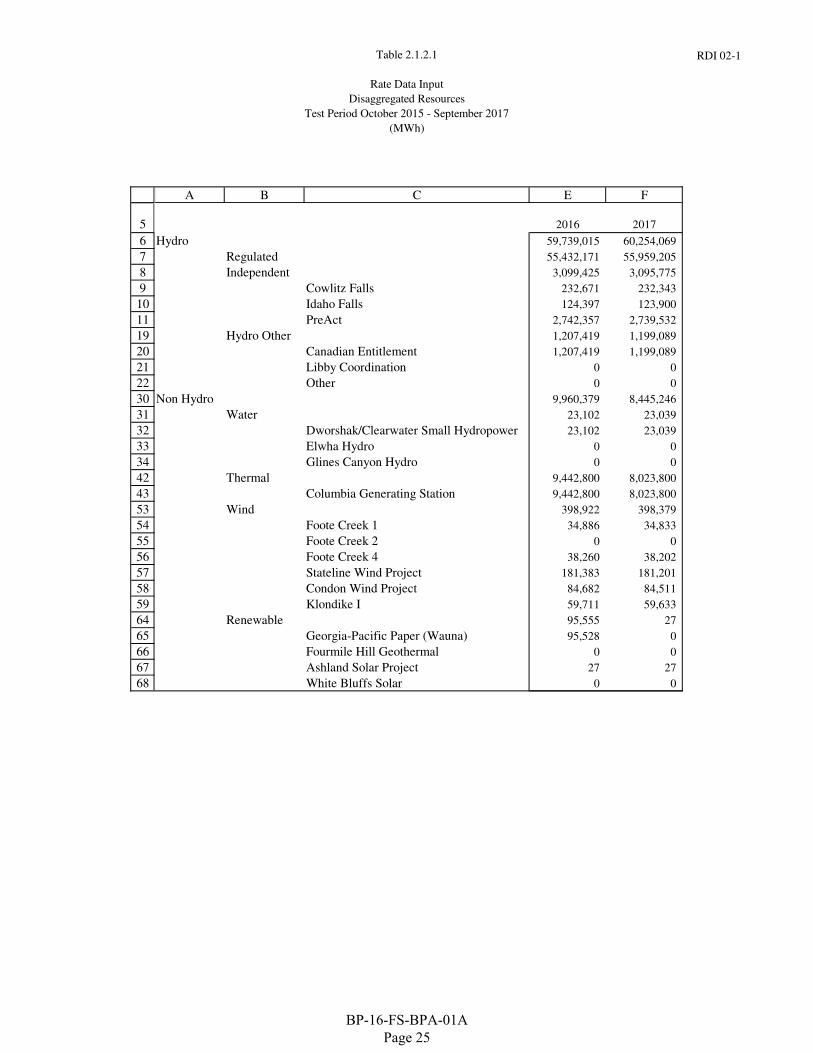
Table 2.1.2.1
Rate Data Input
Disaggregated Resources
Test Period October 2015 - September 2017
(MWh)
RDI 02-1
5
6
7
8
9
10
11
19
20
21
22
30
31
32
33
34
42
43
53
54
55
56
57
58
59
64
65
66
67
68
A B C E F
2016 2017
Hydro 59,739,015 60,254,069
Regulated 55,432,171 55,959,205
Independent 3,099,425 3,095,775
Cowlitz Falls 232,671 232,343
Idaho Falls 124,397 123,900
PreAct 2,742,357 2,739,532
Hydro Other 1,207,419 1,199,089
Canadian Entitlement 1,207,419 1,199,089
Libby Coordination 0 0
Other 0 0
Non Hydro 9,960,379 8,445,246
Water 23,102 23,039
Dworshak/Clearwater Small Hydropower 23,102 23,039
Elwha Hydro 0 0
Glines Canyon Hydro 0 0
Thermal 9,442,800 8,023,800
Columbia Generating Station 9,442,800 8,023,800
Wind 398,922 398,379
Foote Creek 1 34,886 34,833
Foote Creek 2 0 0
Foote Creek 4 38,260 38,202
Stateline Wind Project 181,383 181,201
Condon Wind Project 84,682 84,511
Klondike I 59,711 59,633
Renewable 95,555 27
Georgia-Pacific Paper (Wauna) 95,528 0
Fourmile Hill Geothermal 0 0
Ashland Solar Project 27 27
White Bluffs Solar 0 0
BP-16-FS-BPA-01A Page 25
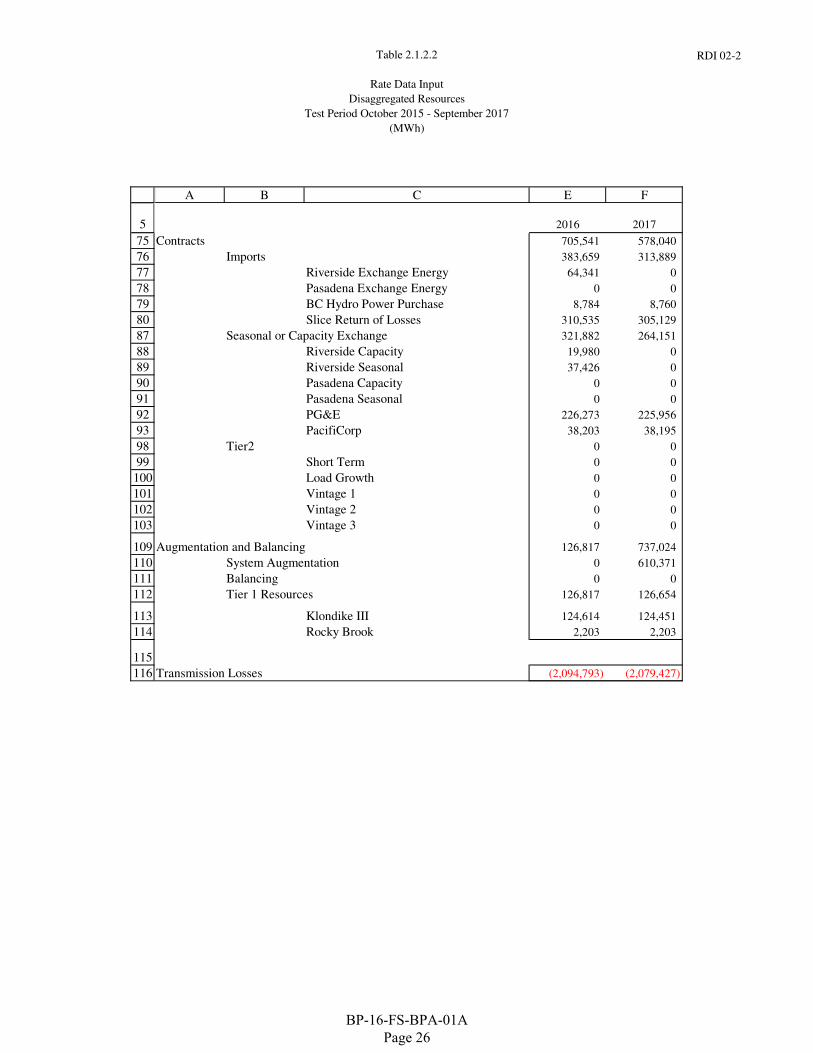
Table 2.1.2.2
Rate Data Input
Disaggregated Resources
Test Period October 2015 - September 2017
(MWh)
RDI 02-2
5
A B C E F
2016 2017
75
76
77
78
79
80
87
88
89
90
91
92
93
98
99
100
101
102
103
109
110
111
112
113
114
115
116
Contracts 705,541 578,040
Imports 383,659 313,889
Riverside Exchange Energy 64,341 0
Pasadena Exchange Energy 0 0
BC Hydro Power Purchase 8,784 8,760
Slice Return of Losses 310,535 305,129
Seasonal or Capacity Exchange 321,882 264,151
Riverside Capacity 19,980 0
Riverside Seasonal 37,426 0
Pasadena Capacity 0 0
Pasadena Seasonal 0 0
PG&E 226,273 225,956
PacifiCorp 38,203 38,195
Tier2 0 0
Short Term 0 0
Load Growth 0 0
Vintage 1 0 0
Vintage 2 0 0
Vintage 3 0 0
Augmentation and Balancing 126,817 737,024
System Augmentation 0 610,371
Balancing 0 0
Tier 1 Resources 126,817 126,654
Klondike III 124,614 124,451
Rocky Brook 2,203 2,203
Transmission Losses (2,094,793) (2,079,427)
BP-16-FS-BPA-01A Page 26
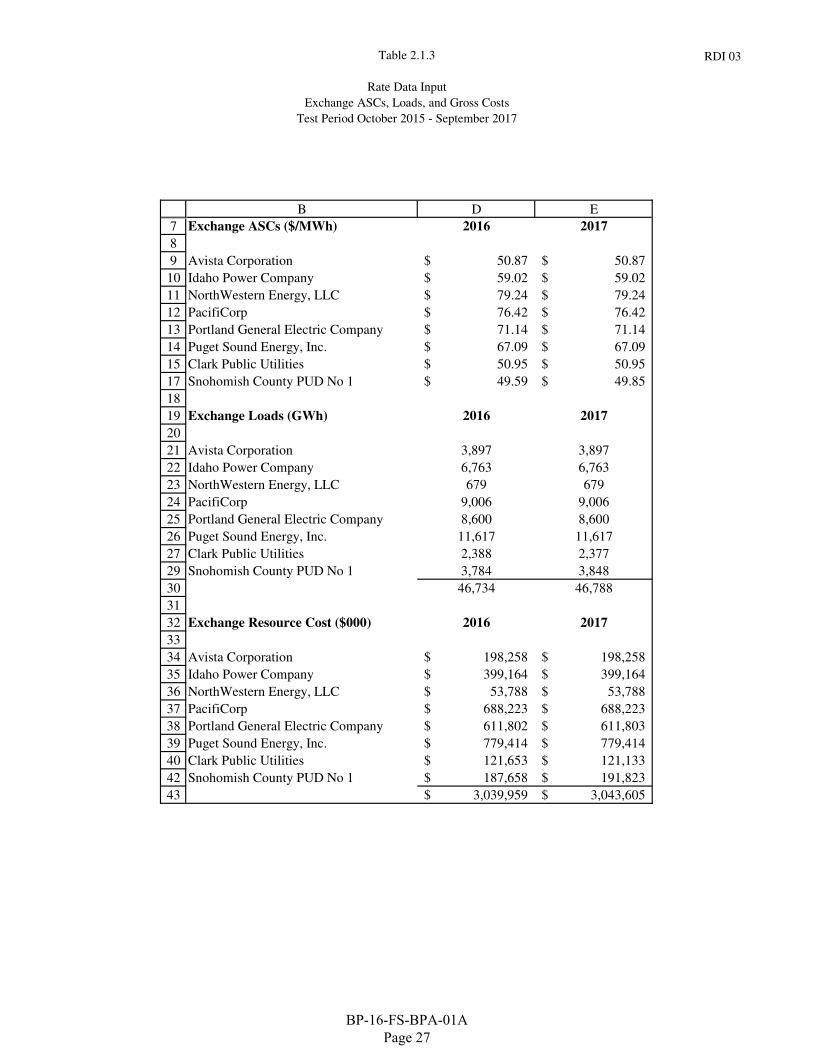
Table 2.1.3
Rate Data Input
Exchange ASCs, Loads, and Gross Costs
Test Period October 2015 - September 2017
RDI 03
7
8
9
10
11
12
13
14
15
17
18
19
20
21
22
23
24
25
26
27
29
30
31
32
33
34
35
36
37
38
39
40
42
43
B D E
Exchange ASCs ($/MWh) 2016 2017
Avista Corporation 50.87$ 50.87$
Idaho Power Company 59.02$ 59.02$
NorthWestern Energy, LLC 79.24$ 79.24$
PacifiCorp 76.42$ 76.42$
Portland General Electric Company 71.14$ 71.14$
Puget Sound Energy, Inc. 67.09$ 67.09$
Clark Public Utilities 50.95$ 50.95$
Snohomish County PUD No 1 49.59$ 49.85$
Exchange Loads (GWh) 2016 2017
Avista Corporation 3,897 3,897
Idaho Power Company 6,763 6,763
NorthWestern Energy, LLC 679 679
PacifiCorp 9,006 9,006
Portland General Electric Company 8,600 8,600
Puget Sound Energy, Inc. 11,617 11,617
Clark Public Utilities 2,388 2,377
Snohomish County PUD No 1 3,784 3,848
46,734 46,788
Exchange Resource Cost ($000) 2016 2017
Avista Corporation 198,258$ 198,258$
Idaho Power Company 399,164$ 399,164$
NorthWestern Energy, LLC 53,788$ 53,788$
PacifiCorp 688,223$ 688,223$
Portland General Electric Company 611,802$ 611,803$
Puget Sound Energy, Inc. 779,414$ 779,414$
Clark Public Utilities 121,653$ 121,133$
Snohomish County PUD No 1 187,658$ 191,823$
3,039,959$ 3,043,605$
BP-16-FS-BPA-01A Page 27
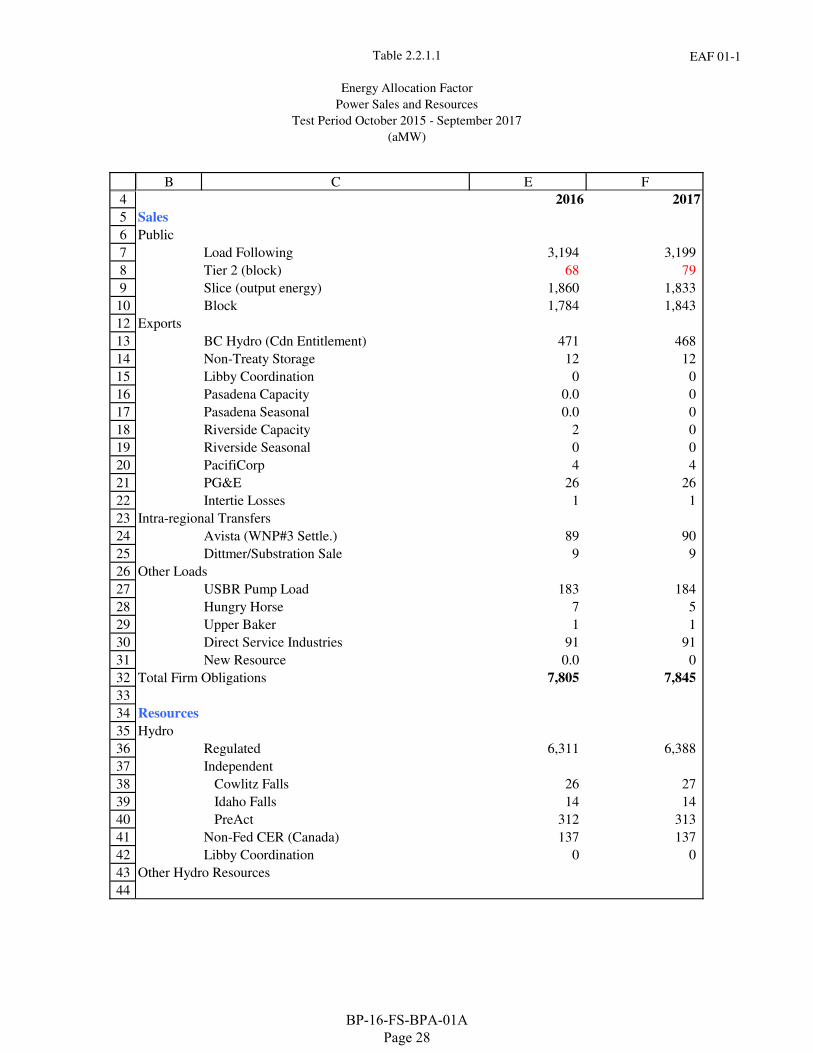
Table 2.2.1.1
Energy Allocation Factor
Power Sales and Resources
Test Period October 2015 - September 2017
(aMW)
EAF 01-1
4
5
6
7
8
9
10
12
13
14
15
16
17
18
19
20
21
22
23
24
25
26
27
28
29
30
31
32
33
34
35
36
37
38
39
40
41
42
43
44
B C E F
2016 2017
Sales
Public
Load Following 3,194 3,199
Tier 2 (block) 68 79
Slice (output energy) 1,860 1,833
Block 1,784 1,843
Exports
BC Hydro (Cdn Entitlement) 471 468
Non-Treaty Storage 12 12
Libby Coordination 0 0
Pasadena Capacity 0.0 0
Pasadena Seasonal 0.0 0
Riverside Capacity 2 0
Riverside Seasonal 0 0
PacifiCorp 4 4
PG&E 26 26
Intertie Losses 1 1
Intra-regional Transfers
Avista (WNP#3 Settle.) 89 90
Dittmer/Substration Sale 9 9
Other Loads
USBR Pump Load 183 184
Hungry Horse 7 5
Upper Baker 1 1
Direct Service Industries 91 91
New Resource 0.0 0
Total Firm Obligations 7,805 7,845
Resources
Hydro
Regulated 6,311 6,388
Independent
Cowlitz Falls 26 27
Idaho Falls 14 14
PreAct 312 313
Non-Fed CER (Canada) 137 137
Libby Coordination 0 0
Other Hydro Resources
BP-16-FS-BPA-01A Page 28
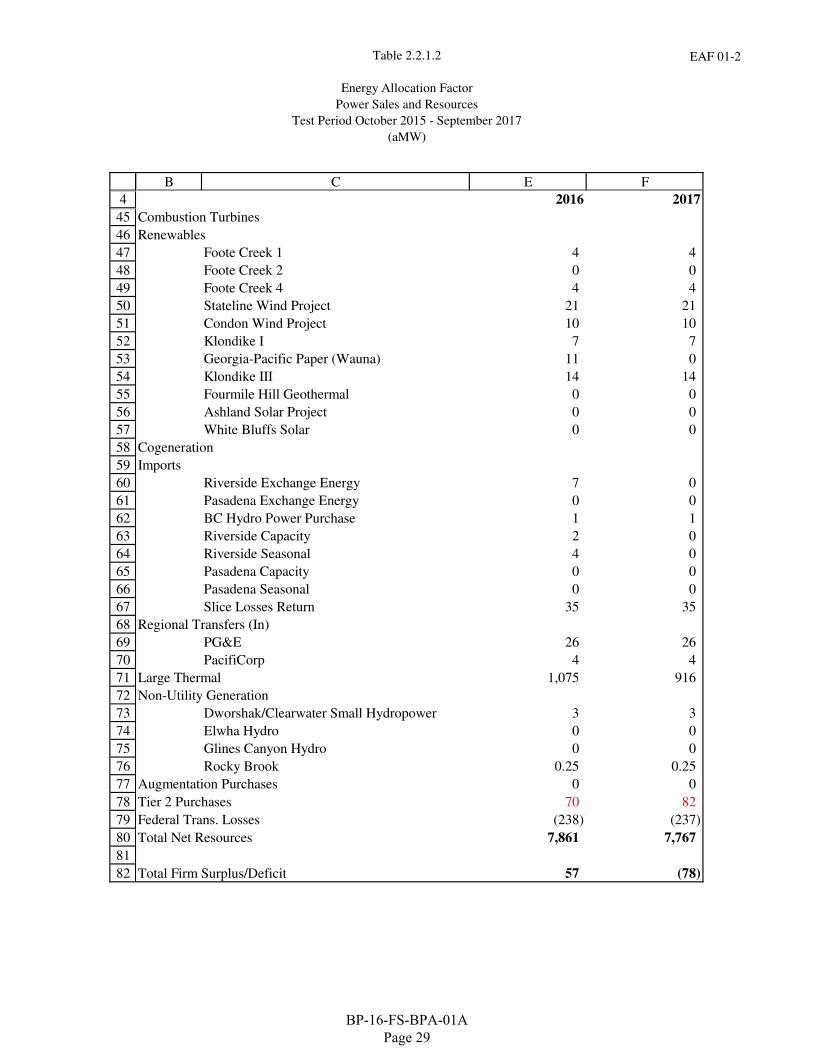
Table 2.2.1.2
Energy Allocation Factor
Power Sales and Resources
Test Period October 2015 - September 2017
(aMW)
EAF 01-2
4
B C E F
2016 2017
45
46
47
48
49
50
51
52
53
54
55
56
57
58
59
60
61
62
63
64
65
66
67
68
69
70
71
72
73
74
75
76
77
78
79
80
81
82
Combustion Turbines
Renewables
Foote Creek 1 4 4
Foote Creek 2 0 0
Foote Creek 4 4 4
Stateline Wind Project 21 21
Condon Wind Project 10 10
Klondike I 7 7
Georgia-Pacific Paper (Wauna) 11 0
Klondike III 14 14
Fourmile Hill Geothermal 0 0
Ashland Solar Project 0 0
White Bluffs Solar 0 0
Cogeneration
Imports
Riverside Exchange Energy 7 0
Pasadena Exchange Energy 0 0
BC Hydro Power Purchase 1 1
Riverside Capacity 2 0
Riverside Seasonal 4 0
Pasadena Capacity 0 0
Pasadena Seasonal 0 0
Slice Losses Return 35 35
Regional Transfers (In)
PG&E 26 26
PacifiCorp 4 4
Large Thermal 1,075 916
Non-Utility Generation
Dworshak/Clearwater Small Hydropower 3 3
Elwha Hydro 0 0
Glines Canyon Hydro 0 0
Rocky Brook 0.25 0.25
Augmentation Purchases 0 0
Tier 2 Purchases 70 82
Federal Trans. Losses (238) (237)
Total Net Resources 7,861 7,767
Total Firm Surplus/Deficit 57 (78)
BP-16-FS-BPA-01A Page 29
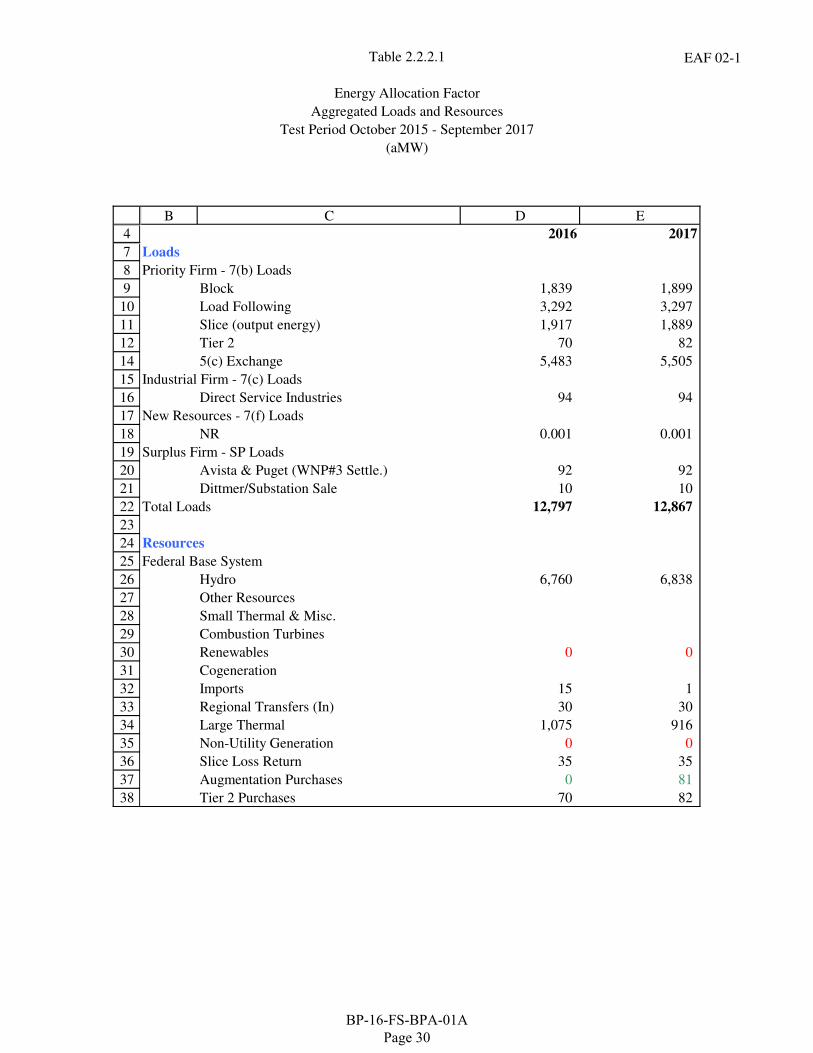
Table 2.2.2.1
Energy Allocation Factor
Aggregated Loads and Resources
Test Period October 2015 - September 2017
(aMW)
EAF 02-1
4
B C D E
2016 2017
7
8
9
10
11
12
14
15
16
17
18
19
20
21
22
23
24
25
26
27
28
29
30
31
32
33
34
35
36
37
38
Loads
Priority Firm - 7(b) Loads
Block 1,839 1,899
Load Following 3,292 3,297
Slice (output energy) 1,917 1,889
Tier 2 70 82
5(c) Exchange 5,483 5,505
Industrial Firm - 7(c) Loads
Direct Service Industries 94 94
New Resources - 7(f) Loads
NR 0.001 0.001
Surplus Firm - SP Loads
Avista & Puget (WNP#3 Settle.) 92 92
Dittmer/Substation Sale 10 10
Total Loads 12,797 12,867
Resources
Federal Base System
Hydro 6,760 6,838
Other Resources
Small Thermal & Misc.
Combustion Turbines
Renewables 0 0
Cogeneration
Imports 15 1
Regional Transfers (In) 30 30
Large Thermal 1,075 916
Non-Utility Generation 0 0
Slice Loss Return 35 35
Augmentation Purchases 0 81
Tier 2 Purchases 70 82
BP-16-FS-BPA-01A Page 30
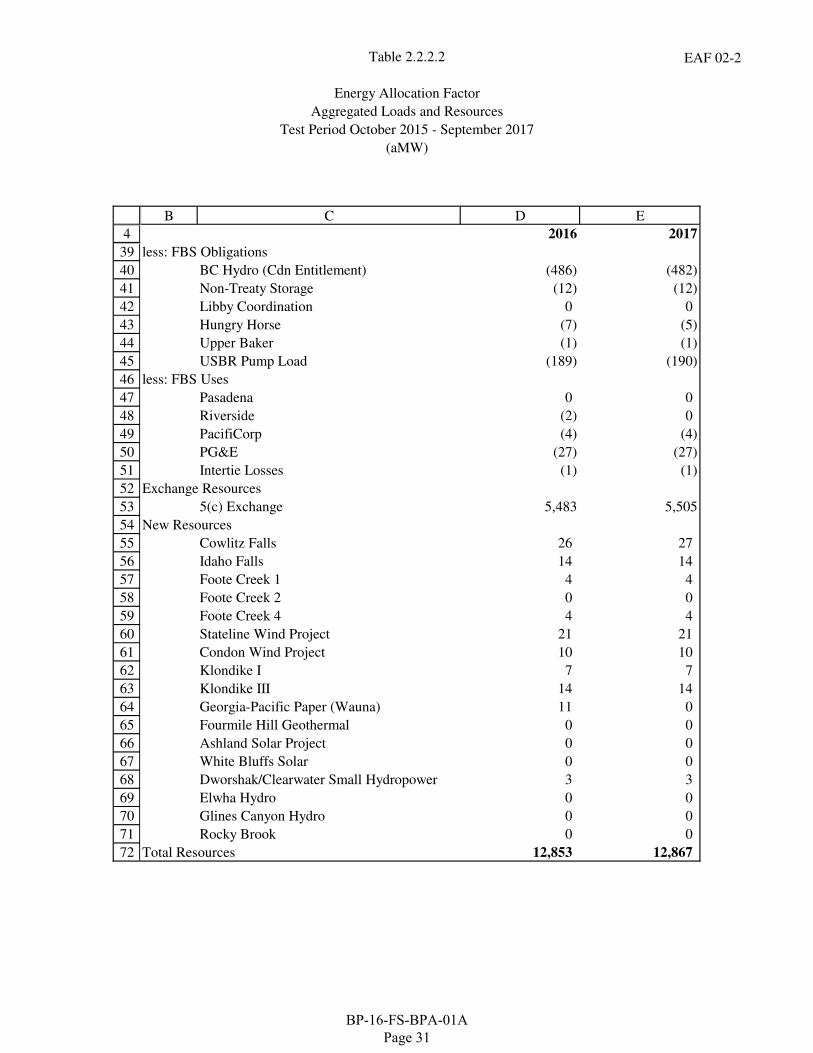
Table 2.2.2.2
Energy Allocation Factor
Aggregated Loads and Resources
Test Period October 2015 - September 2017
(aMW)
EAF 02-2
4
B C D E
2016 2017
39
40
41
42
43
44
45
46
47
48
49
50
51
52
53
54
55
56
57
58
59
60
61
62
63
64
65
66
67
68
69
70
71
72
less: FBS Obligations
BC Hydro (Cdn Entitlement) (486) (482)
Non-Treaty Storage (12) (12)
Libby Coordination 0 0
Hungry Horse (7) (5)
Upper Baker (1) (1)
USBR Pump Load (189) (190)
less: FBS Uses
Pasadena 0 0
Riverside (2) 0
PacifiCorp (4) (4)
PG&E (27) (27)
Intertie Losses (1) (1)
Exchange Resources
5(c) Exchange 5,483 5,505
New Resources
Cowlitz Falls 26 27
Idaho Falls 14 14
Foote Creek 1 4 4
Foote Creek 2 0 0
Foote Creek 4 4 4
Stateline Wind Project 21 21
Condon Wind Project 10 10
Klondike I 7 7
Klondike III 14 14
Georgia-Pacific Paper (Wauna) 11 0
Fourmile Hill Geothermal 0 0
Ashland Solar Project 0 0
White Bluffs Solar 0 0
Dworshak/Clearwater Small Hydropower 3 3
Elwha Hydro 0 0
Glines Canyon Hydro 0 0
Rocky Brook 0 0
Total Resources 12,853 12,867
BP-16-FS-BPA-01A Page 31
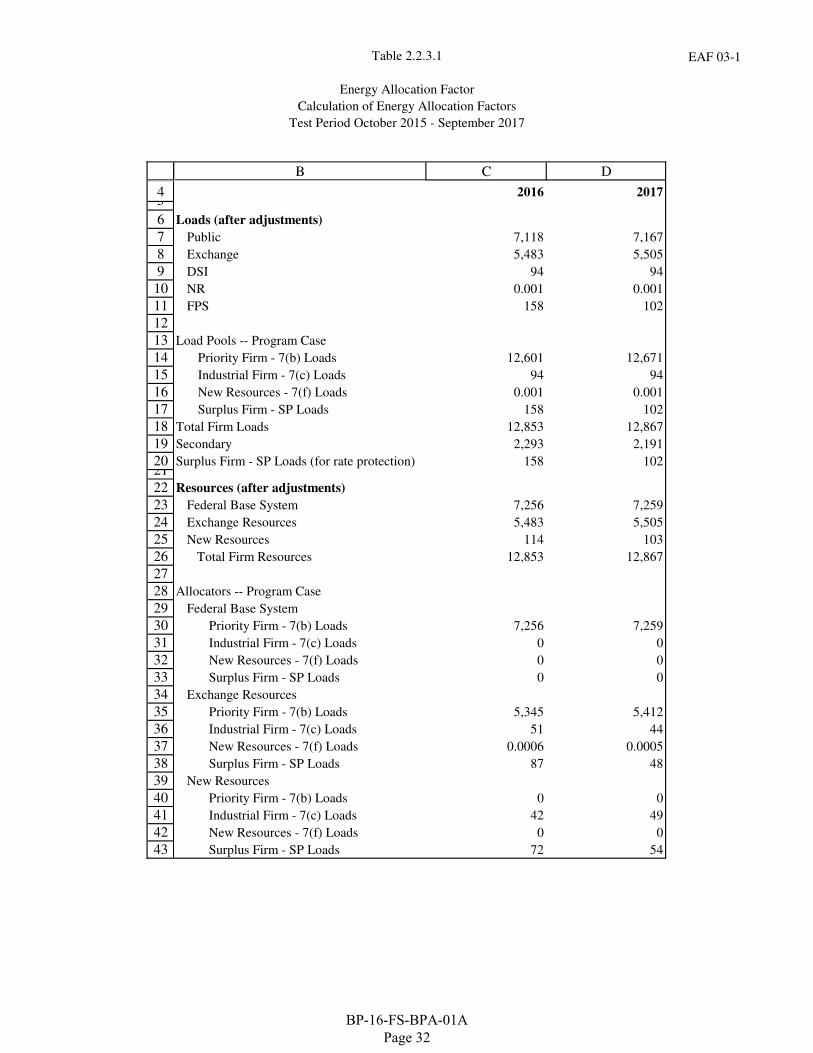
Table 2.2.3.1
Energy Allocation Factor
Calculation of Energy Allocation Factors
Test Period October 2015 - September 2017
EAF 03-1
45
6
7
8
9
10
11
12
13
14
15
16
17
18
19
2021
22
23
24
25
26
27
28
29
30
31
32
33
34
35
36
37
38
39
40
41
42
43
B C D
2016 2017
Loads (after adjustments)
Public 7,118 7,167
Exchange 5,483 5,505
DSI 94 94
NR 0.001 0.001
FPS 158 102
Load Pools -- Program Case
Priority Firm - 7(b) Loads 12,601 12,671
Industrial Firm - 7(c) Loads 94 94
New Resources - 7(f) Loads 0.001 0.001
Surplus Firm - SP Loads 158 102
Total Firm Loads 12,853 12,867
Secondary 2,293 2,191
Surplus Firm - SP Loads (for rate protection) 158 102
Resources (after adjustments)
Federal Base System 7,256 7,259
Exchange Resources 5,483 5,505
New Resources 114 103
Total Firm Resources 12,853 12,867
Allocators -- Program Case
Federal Base System
Priority Firm - 7(b) Loads 7,256 7,259
Industrial Firm - 7(c) Loads 0 0
New Resources - 7(f) Loads 0 0
Surplus Firm - SP Loads 0 0
Exchange Resources
Priority Firm - 7(b) Loads 5,345 5,412
Industrial Firm - 7(c) Loads 51 44
New Resources - 7(f) Loads 0.0006 0.0005
Surplus Firm - SP Loads 87 48
New Resources
Priority Firm - 7(b) Loads 0 0
Industrial Firm - 7(c) Loads 42 49
New Resources - 7(f) Loads 0 0
Surplus Firm - SP Loads 72 54
BP-16-FS-BPA-01A Page 32
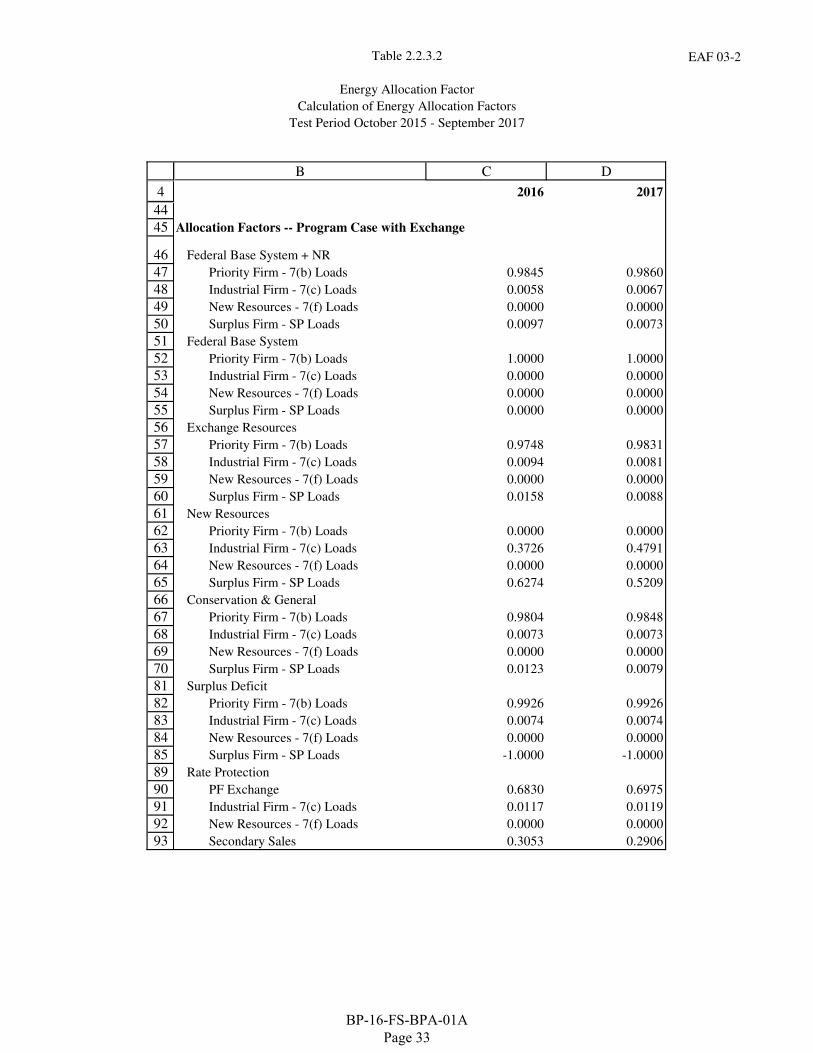
Table 2.2.3.2
Energy Allocation Factor
Calculation of Energy Allocation Factors
Test Period October 2015 - September 2017
EAF 03-2
4
B C D
2016 2017
44
45
46
47
48
49
50
51
52
53
54
55
56
57
58
59
60
61
62
63
64
65
66
67
68
69
70
81
82
83
84
85
89
90
91
92
93
Allocation Factors -- Program Case with Exchange
Federal Base System + NR
Priority Firm - 7(b) Loads 0.9845 0.9860
Industrial Firm - 7(c) Loads 0.0058 0.0067
New Resources - 7(f) Loads 0.0000 0.0000
Surplus Firm - SP Loads 0.0097 0.0073
Federal Base System
Priority Firm - 7(b) Loads 1.0000 1.0000
Industrial Firm - 7(c) Loads 0.0000 0.0000
New Resources - 7(f) Loads 0.0000 0.0000
Surplus Firm - SP Loads 0.0000 0.0000
Exchange Resources
Priority Firm - 7(b) Loads 0.9748 0.9831
Industrial Firm - 7(c) Loads 0.0094 0.0081
New Resources - 7(f) Loads 0.0000 0.0000
Surplus Firm - SP Loads 0.0158 0.0088
New Resources
Priority Firm - 7(b) Loads 0.0000 0.0000
Industrial Firm - 7(c) Loads 0.3726 0.4791
New Resources - 7(f) Loads 0.0000 0.0000
Surplus Firm - SP Loads 0.6274 0.5209
Conservation & General
Priority Firm - 7(b) Loads 0.9804 0.9848
Industrial Firm - 7(c) Loads 0.0073 0.0073
New Resources - 7(f) Loads 0.0000 0.0000
Surplus Firm - SP Loads 0.0123 0.0079
Surplus Deficit
Priority Firm - 7(b) Loads 0.9926 0.9926
Industrial Firm - 7(c) Loads 0.0074 0.0074
New Resources - 7(f) Loads 0.0000 0.0000
Surplus Firm - SP Loads -1.0000 -1.0000
Rate Protection
PF Exchange 0.6830 0.6975
Industrial Firm - 7(c) Loads 0.0117 0.0119
New Resources - 7(f) Loads 0.0000 0.0000
Secondary Sales 0.3053 0.2906
BP-16-FS-BPA-01A Page 33
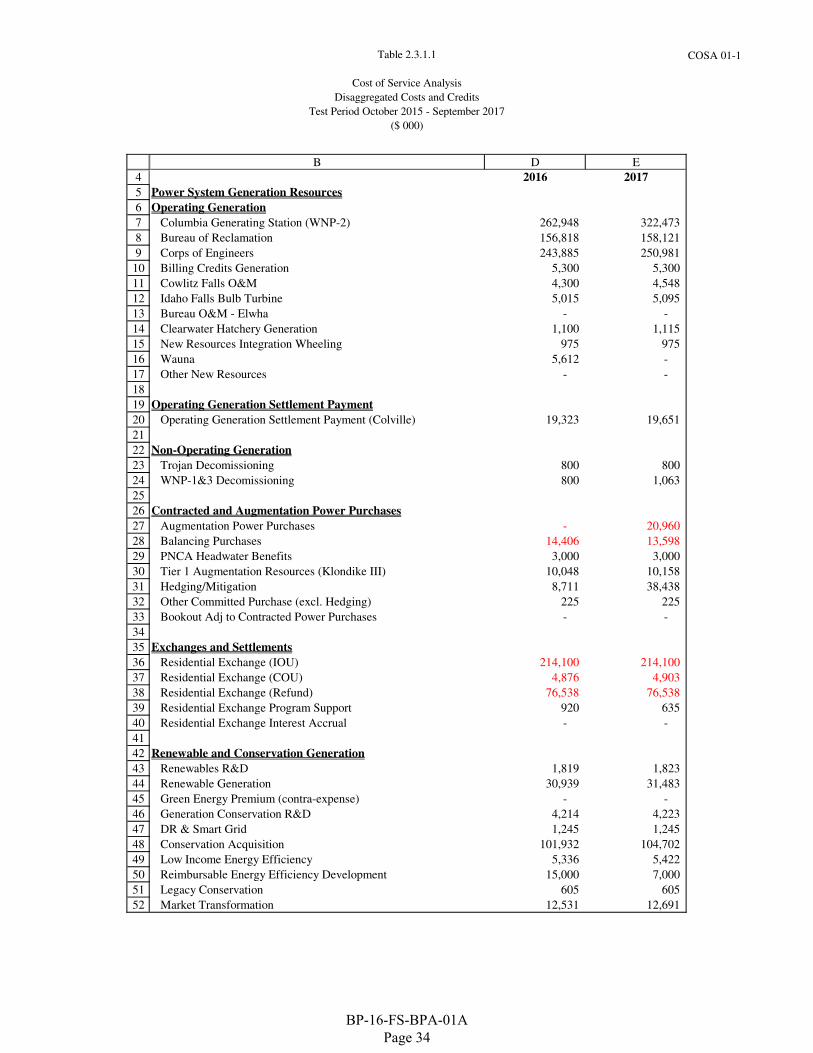
Table 2.3.1.1
Cost of Service Analysis
Disaggregated Costs and Credits
Test Period October 2015 - September 2017
($ 000)
COSA 01-1
4
5
6
7
8
9
10
11
12
13
14
15
16
17
18
19
20
21
22
23
24
25
26
27
28
29
30
31
32
33
34
35
36
37
38
39
40
41
42
43
44
45
46
47
48
49
50
51
52
B D E
2016 2017
Power System Generation Resources
Operating Generation
Columbia Generating Station (WNP-2) 262,948 322,473
Bureau of Reclamation 156,818 158,121
Corps of Engineers 243,885 250,981
Billing Credits Generation 5,300 5,300
Cowlitz Falls O&M 4,300 4,548
Idaho Falls Bulb Turbine 5,015 5,095
Bureau O&M - Elwha - -
Clearwater Hatchery Generation 1,100 1,115
New Resources Integration Wheeling 975 975
Wauna 5,612 -
Other New Resources - -
Operating Generation Settlement Payment
Operating Generation Settlement Payment (Colville) 19,323 19,651
Non-Operating Generation
Trojan Decomissioning 800 800
WNP-1&3 Decomissioning 800 1,063
Contracted and Augmentation Power Purchases
Augmentation Power Purchases - 20,960
Balancing Purchases 14,406 13,598
PNCA Headwater Benefits 3,000 3,000
Tier 1 Augmentation Resources (Klondike III) 10,048 10,158
Hedging/Mitigation 8,711 38,438
Other Committed Purchase (excl. Hedging) 225 225
Bookout Adj to Contracted Power Purchases - -
Exchanges and Settlements
Residential Exchange (IOU) 214,100 214,100
Residential Exchange (COU) 4,876 4,903
Residential Exchange (Refund) 76,538 76,538
Residential Exchange Program Support 920 635
Residential Exchange Interest Accrual - -
Renewable and Conservation Generation
Renewables R&D 1,819 1,823
Renewable Generation 30,939 31,483
Green Energy Premium (contra-expense) - -
Generation Conservation R&D 4,214 4,223
DR & Smart Grid 1,245 1,245
Conservation Acquisition 101,932 104,702
Low Income Energy Efficiency 5,336 5,422
Reimbursable Energy Efficiency Development 15,000 7,000
Legacy Conservation 605 605
Market Transformation 12,531 12,691
BP-16-FS-BPA-01A Page 34
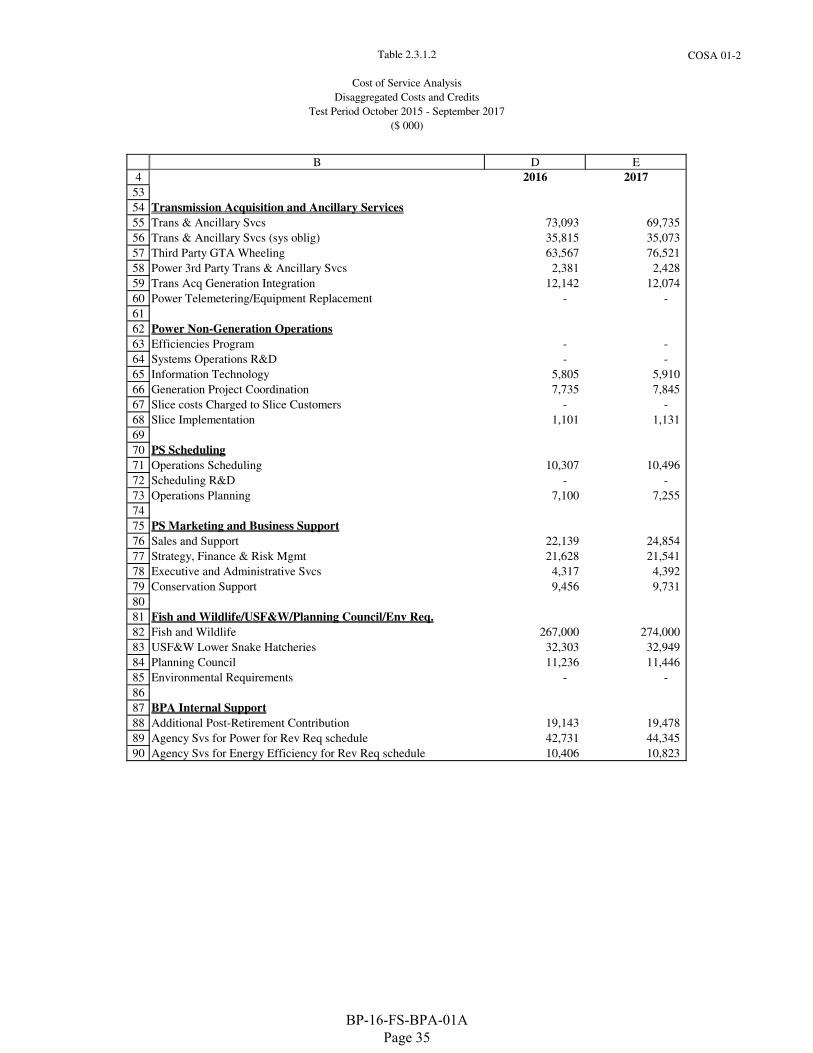
Table 2.3.1.2
Cost of Service Analysis
Disaggregated Costs and Credits
Test Period October 2015 - September 2017
($ 000)
COSA 01-2
4
B D E
2016 2017
53
54
55
56
57
58
59
60
61
62
63
64
65
66
67
68
69
70
71
72
73
74
75
76
77
78
79
80
81
82
83
84
85
86
87
88
89
90
Transmission Acquisition and Ancillary Services
Trans & Ancillary Svcs 73,093 69,735
Trans & Ancillary Svcs (sys oblig) 35,815 35,073
Third Party GTA Wheeling 63,567 76,521
Power 3rd Party Trans & Ancillary Svcs 2,381 2,428
Trans Acq Generation Integration 12,142 12,074
Power Telemetering/Equipment Replacement - -
Power Non-Generation Operations
Efficiencies Program - -
Systems Operations R&D - -
Information Technology 5,805 5,910
Generation Project Coordination 7,735 7,845
Slice costs Charged to Slice Customers - -
Slice Implementation 1,101 1,131
PS Scheduling
Operations Scheduling 10,307 10,496
Scheduling R&D - -
Operations Planning 7,100 7,255
PS Marketing and Business Support
Sales and Support 22,139 24,854
Strategy, Finance & Risk Mgmt 21,628 21,541
Executive and Administrative Svcs 4,317 4,392
Conservation Support 9,456 9,731
Fish and Wildlife/USF&W/Planning Council/Env Req.
Fish and Wildlife 267,000 274,000
USF&W Lower Snake Hatcheries 32,303 32,949
Planning Council 11,236 11,446
Environmental Requirements - -
BPA Internal Support
Additional Post-Retirement Contribution 19,143 19,478
Agency Svs for Power for Rev Req schedule 42,731 44,345
Agency Svs for Energy Efficiency for Rev Req schedule 10,406 10,823
BP-16-FS-BPA-01A Page 35
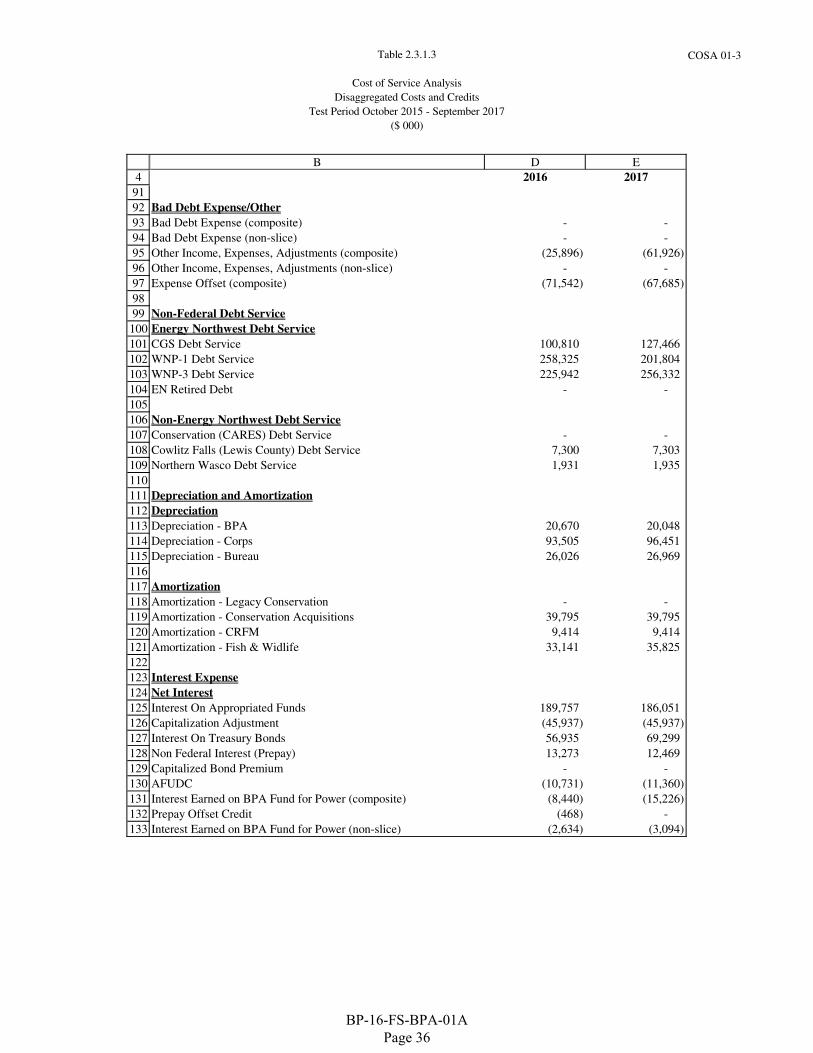
Table 2.3.1.3
Cost of Service Analysis
Disaggregated Costs and Credits
Test Period October 2015 - September 2017
($ 000)
COSA 01-3
4
B D E
2016 2017
91
92
93
94
95
96
97
98
99
100
101
102
103
104
105
106
107
108
109
110
111
112
113
114
115
116
117
118
119
120
121
122
123
124
125
126
127
128
129
130
131
132
133
Bad Debt Expense/Other
Bad Debt Expense (composite) - -
Bad Debt Expense (non-slice) - -
Other Income, Expenses, Adjustments (composite) (25,896) (61,926)
Other Income, Expenses, Adjustments (non-slice) - -
Expense Offset (composite) (71,542) (67,685)
Non-Federal Debt Service
Energy Northwest Debt Service
CGS Debt Service 100,810 127,466
WNP-1 Debt Service 258,325 201,804
WNP-3 Debt Service 225,942 256,332
EN Retired Debt - -
Non-Energy Northwest Debt Service
Conservation (CARES) Debt Service - -
Cowlitz Falls (Lewis County) Debt Service 7,300 7,303
Northern Wasco Debt Service 1,931 1,935
Depreciation and Amortization
Depreciation
Depreciation - BPA 20,670 20,048
Depreciation - Corps 93,505 96,451
Depreciation - Bureau 26,026 26,969
Amortization
Amortization - Legacy Conservation - -
Amortization - Conservation Acquisitions 39,795 39,795
Amortization - CRFM 9,414 9,414
Amortization - Fish & Widlife 33,141 35,825
Interest Expense
Net Interest
Interest On Appropriated Funds 189,757 186,051
Capitalization Adjustment (45,937) (45,937)
Interest On Treasury Bonds 56,935 69,299
Non Federal Interest (Prepay) 13,273 12,469
Capitalized Bond Premium - -
AFUDC (10,731) (11,360)
Interest Earned on BPA Fund for Power (composite) (8,440) (15,226)
Prepay Offset Credit (468) -
Interest Earned on BPA Fund for Power (non-slice) (2,634) (3,094)
BP-16-FS-BPA-01A Page 36
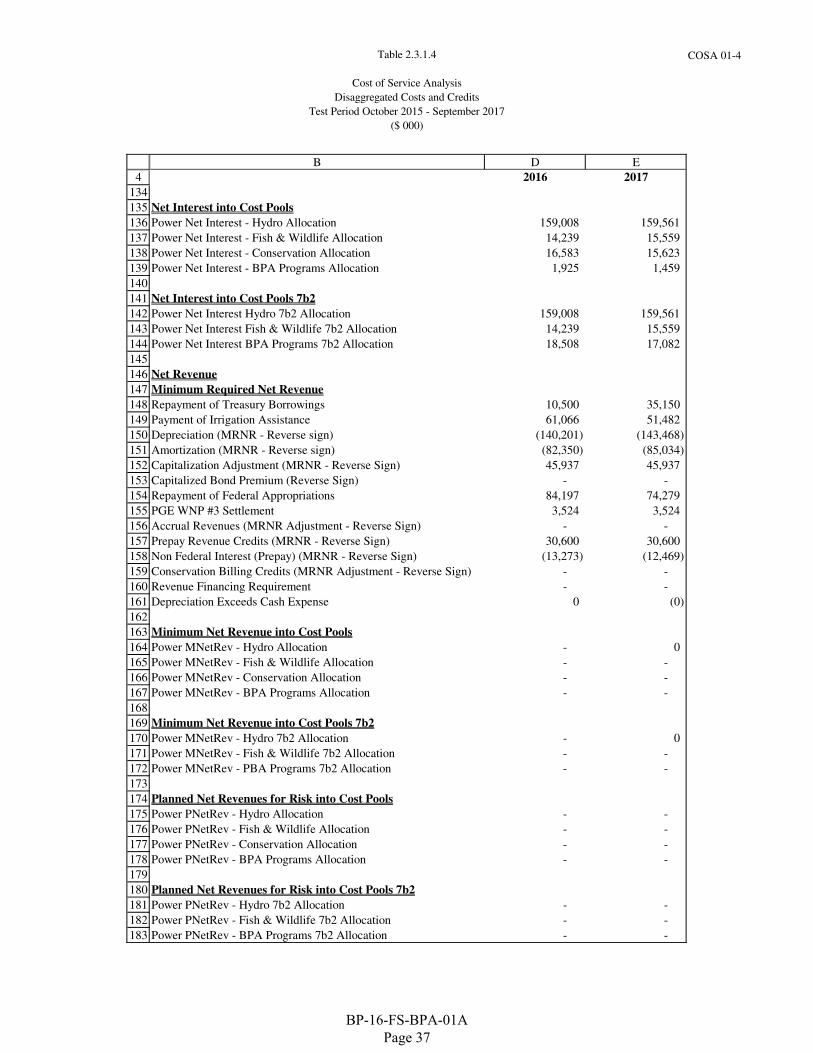
Table 2.3.1.4
Cost of Service Analysis
Disaggregated Costs and Credits
Test Period October 2015 - September 2017
($ 000)
COSA 01-4
4
B D E
2016 2017
134
135
136
137
138
139
140
141
142
143
144
145
146
147
148
149
150
151
152
153
154
155
156
157
158
159
160
161
162
163
164
165
166
167
168
169
170
171
172
173
174
175
176
177
178
179
180
181
182
183
Net Interest into Cost Pools
Power Net Interest - Hydro Allocation 159,008 159,561
Power Net Interest - Fish & Wildlife Allocation 14,239 15,559
Power Net Interest - Conservation Allocation 16,583 15,623
Power Net Interest - BPA Programs Allocation 1,925 1,459
Net Interest into Cost Pools 7b2
Power Net Interest Hydro 7b2 Allocation 159,008 159,561
Power Net Interest Fish & Wildlife 7b2 Allocation 14,239 15,559
Power Net Interest BPA Programs 7b2 Allocation 18,508 17,082
Net Revenue
Minimum Required Net Revenue
Repayment of Treasury Borrowings 10,500 35,150
Payment of Irrigation Assistance 61,066 51,482
Depreciation (MRNR - Reverse sign) (140,201) (143,468)
Amortization (MRNR - Reverse sign) (82,350) (85,034)
Capitalization Adjustment (MRNR - Reverse Sign) 45,937 45,937
Capitalized Bond Premium (Reverse Sign) - -
Repayment of Federal Appropriations 84,197 74,279
PGE WNP #3 Settlement 3,524 3,524
Accrual Revenues (MRNR Adjustment - Reverse Sign) - -
Prepay Revenue Credits (MRNR - Reverse Sign) 30,600 30,600
Non Federal Interest (Prepay) (MRNR - Reverse Sign) (13,273) (12,469)
Conservation Billing Credits (MRNR Adjustment - Reverse Sign) - -
Revenue Financing Requirement - -
Depreciation Exceeds Cash Expense 0 (0)
Minimum Net Revenue into Cost Pools
Power MNetRev - Hydro Allocation - 0
Power MNetRev - Fish & Wildlife Allocation - -
Power MNetRev - Conservation Allocation - -
Power MNetRev - BPA Programs Allocation - -
Minimum Net Revenue into Cost Pools 7b2
Power MNetRev - Hydro 7b2 Allocation - 0
Power MNetRev - Fish & Wildlife 7b2 Allocation - -
Power MNetRev - PBA Programs 7b2 Allocation - -
Planned Net Revenues for Risk into Cost Pools
Power PNetRev - Hydro Allocation - -
Power PNetRev - Fish & Wildlife Allocation - -
Power PNetRev - Conservation Allocation - -
Power PNetRev - BPA Programs Allocation - -
Planned Net Revenues for Risk into Cost Pools 7b2
Power PNetRev - Hydro 7b2 Allocation - -
Power PNetRev - Fish & Wildlife 7b2 Allocation - -
Power PNetRev - BPA Programs 7b2 Allocation - -
BP-16-FS-BPA-01A Page 37
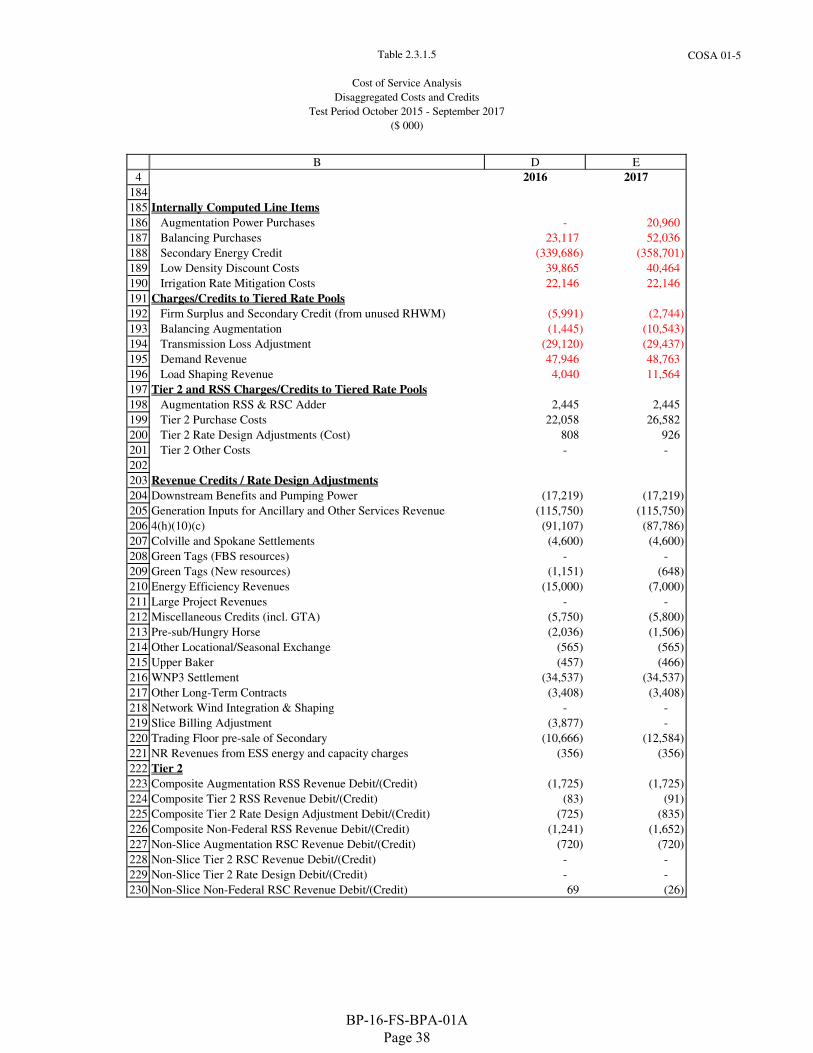
Table 2.3.1.5
Cost of Service Analysis
Disaggregated Costs and Credits
Test Period October 2015 - September 2017
($ 000)
COSA 01-5
4
B D E
2016 2017
184
185
186
187
188
189
190
191
192
193
194
195
196
197
198
199
200
201
202
203
204
205
206
207
208
209
210
211
212
213
214
215
216
217
218
219
220
221
222
223
224
225
226
227
228
229
230
Internally Computed Line Items
Augmentation Power Purchases - 20,960
Balancing Purchases 23,117 52,036
Secondary Energy Credit (339,686) (358,701)
Low Density Discount Costs 39,865 40,464
Irrigation Rate Mitigation Costs 22,146 22,146
Charges/Credits to Tiered Rate Pools
Firm Surplus and Secondary Credit (from unused RHWM) (5,991) (2,744)
Balancing Augmentation (1,445) (10,543)
Transmission Loss Adjustment (29,120) (29,437)
Demand Revenue 47,946 48,763
Load Shaping Revenue 4,040 11,564
Tier 2 and RSS Charges/Credits to Tiered Rate Pools
Augmentation RSS & RSC Adder 2,445 2,445
Tier 2 Purchase Costs 22,058 26,582
Tier 2 Rate Design Adjustments (Cost) 808 926
Tier 2 Other Costs - -
Revenue Credits / Rate Design Adjustments
Downstream Benefits and Pumping Power (17,219) (17,219)
Generation Inputs for Ancillary and Other Services Revenue (115,750) (115,750)
4(h)(10)(c) (91,107) (87,786)
Colville and Spokane Settlements (4,600) (4,600)
Green Tags (FBS resources) - -
Green Tags (New resources) (1,151) (648)
Energy Efficiency Revenues (15,000) (7,000)
Large Project Revenues - -
Miscellaneous Credits (incl. GTA) (5,750) (5,800)
Pre-sub/Hungry Horse (2,036) (1,506)
Other Locational/Seasonal Exchange (565) (565)
Upper Baker (457) (466)
WNP3 Settlement (34,537) (34,537)
Other Long-Term Contracts (3,408) (3,408)
Network Wind Integration & Shaping - -
Slice Billing Adjustment (3,877) -
Trading Floor pre-sale of Secondary (10,666) (12,584)
NR Revenues from ESS energy and capacity charges (356) (356)
Tier 2
Composite Augmentation RSS Revenue Debit/(Credit) (1,725) (1,725)
Composite Tier 2 RSS Revenue Debit/(Credit) (83) (91)
Composite Tier 2 Rate Design Adjustment Debit/(Credit) (725) (835)
Composite Non-Federal RSS Revenue Debit/(Credit) (1,241) (1,652)
Non-Slice Augmentation RSC Revenue Debit/(Credit) (720) (720)
Non-Slice Tier 2 RSC Revenue Debit/(Credit) - -
Non-Slice Tier 2 Rate Design Debit/(Credit) - -
Non-Slice Non-Federal RSC Revenue Debit/(Credit) 69 (26)
BP-16-FS-BPA-01A Page 38
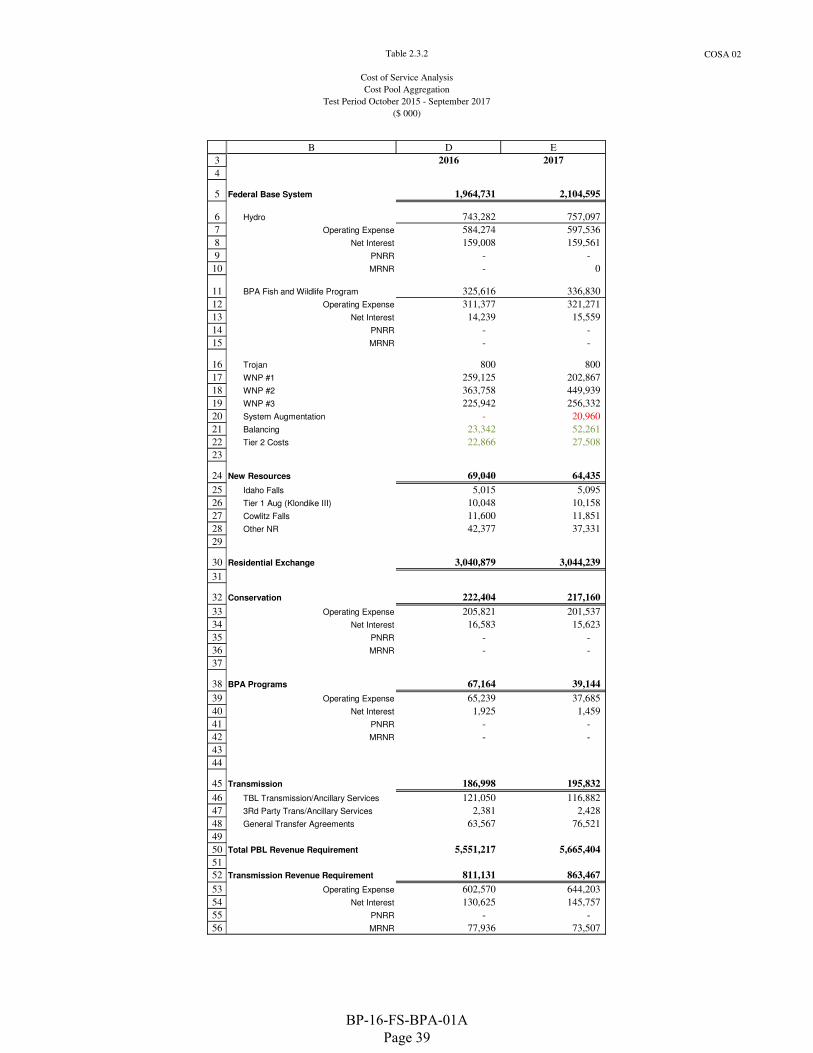
Table 2.3.2
Cost of Service Analysis
Cost Pool Aggregation
Test Period October 2015 - September 2017
($ 000)
COSA 02
3
4
5
6
7
8
9
10
11
12
13
14
15
16
17
18
19
20
21
22
23
24
25
26
27
28
29
30
31
32
33
34
35
36
37
38
39
40
41
42
43
44
45
46
47
48
49
50
51
52
53
54
55
56
B D E
2016 2017
Federal Base System 1,964,731 2,104,595
Hydro 743,282 757,097
Operating Expense 584,274 597,536
Net Interest 159,008 159,561
PNRR - -
MRNR - 0
BPA Fish and Wildlife Program 325,616 336,830
Operating Expense 311,377 321,271
Net Interest 14,239 15,559
PNRR - -
MRNR - -
Trojan 800 800
WNP #1 259,125 202,867
WNP #2 363,758 449,939
WNP #3 225,942 256,332
System Augmentation - 20,960
Balancing 23,342 52,261
Tier 2 Costs 22,866 27,508
New Resources 69,040 64,435
Idaho Falls 5,015 5,095
Tier 1 Aug (Klondike III) 10,048 10,158
Cowlitz Falls 11,600 11,851
Other NR 42,377 37,331
Residential Exchange 3,040,879 3,044,239
Conservation 222,404 217,160
Operating Expense 205,821 201,537
Net Interest 16,583 15,623
PNRR - -
MRNR - -
BPA Programs 67,164 39,144
Operating Expense 65,239 37,685
Net Interest 1,925 1,459
PNRR - -
MRNR - -
Transmission 186,998 195,832
TBL Transmission/Ancillary Services 121,050 116,882
3Rd Party Trans/Ancillary Services 2,381 2,428
General Transfer Agreements 63,567 76,521
Total PBL Revenue Requirement 5,551,217 5,665,404
Transmission Revenue Requirement 811,131 863,467
Operating Expense 602,570 644,203
Net Interest 130,625 145,757
PNRR - -
MRNR 77,936 73,507
BP-16-FS-BPA-01A Page 39
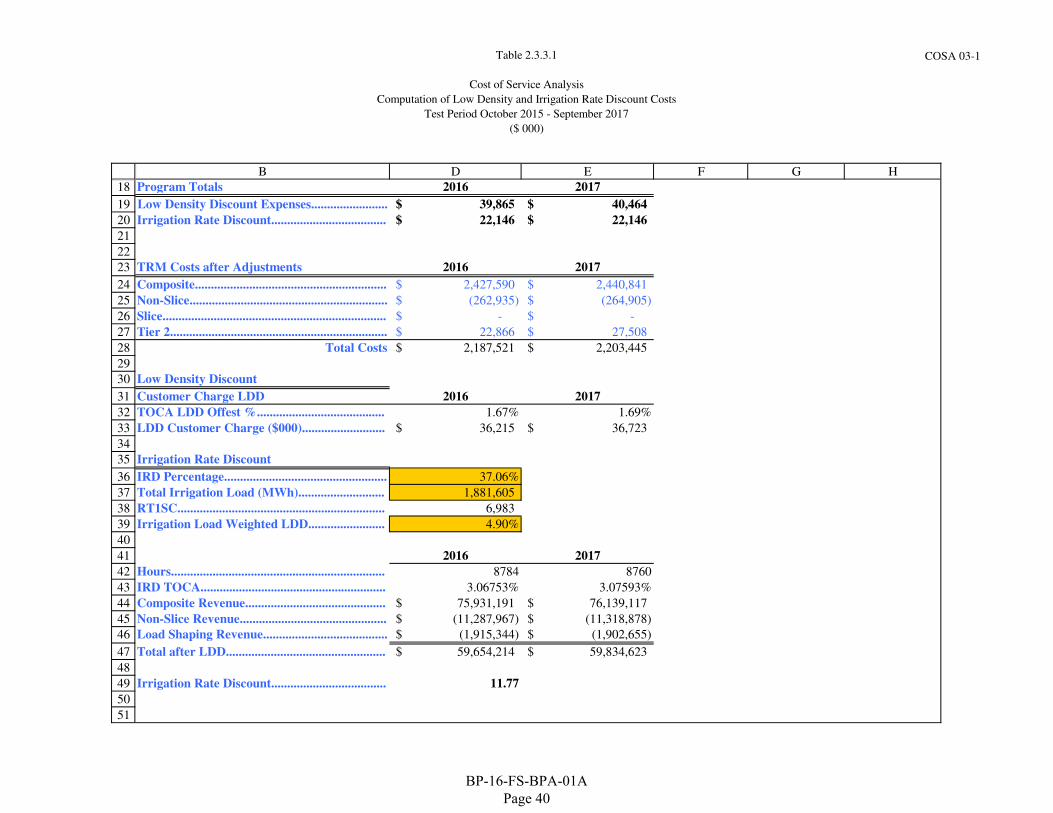
Table 2.3.3.1
Cost of Service Analysis
Computation of Low Density and Irrigation Rate Discount Costs
Test Period October 2015 - September 2017
($ 000)
COSA 03-1
18
19
20
21
22
23
24
25
26
27
28
29
30
31
32
33
34
35
36
37
38
39
40
41
42
43
44
45
46
47
48
49
50
51
B D E F G H
Program Totals 2016 2017 2018 2019 2020
Low Density Discount Expenses........................ 39,865$ 40,464$ 40,165$ 40,165$ 40,165$
Irrigation Rate Discount.................................... 22,146$ 22,146$ 22,146$ 22,146$ 22,146$
TRM Costs after Adjustments 2016 2017
Composite............................................................ 2,427,590$ 2,440,841$
Non-Slice.............................................................. (262,935)$ (264,905)$
Slice...................................................................... -$ -$
Tier 2.................................................................... 22,866$ 27,508$
Total Costs 2,187,521$ 2,203,445$
Low Density Discount
Customer Charge LDD 2016 2017
TOCA LDD Offest %........................................ 1.67% 1.69%
LDD Customer Charge ($000).......................... 36,215$ 36,723$
Irrigation Rate Discount
IRD Percentage................................................... 37.06%
Total Irrigation Load (MWh)........................... 1,881,605
RT1SC................................................................. 6,983
Irrigation Load Weighted LDD........................ 4.90%
2016 2017
Hours................................................................... 8784 8760
IRD TOCA.......................................................... 3.06753% 3.07593%
Composite Revenue............................................ 75,931,191$ 76,139,117$
Non-Slice Revenue.............................................. (11,287,967)$ (11,318,878)$
Load Shaping Revenue....................................... (1,915,344)$ (1,902,655)$
Total after LDD.................................................. 59,654,214$ 59,834,623$
Irrigation Rate Discount.................................... 11.77
BP-16-FS-BPA-01A Page 40
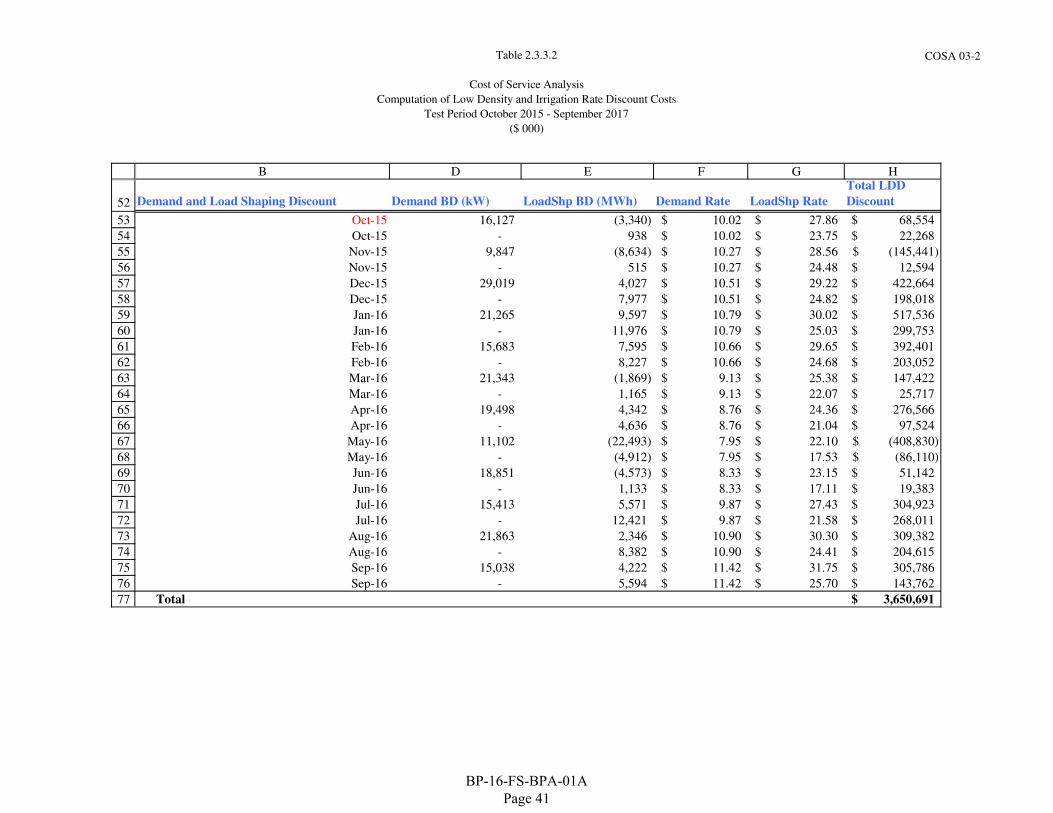
Table 2.3.3.2
Cost of Service Analysis
Computation of Low Density and Irrigation Rate Discount Costs
Test Period October 2015 - September 2017
($ 000)
COSA 03-2
52
53
54
55
56
57
58
59
60
61
62
63
64
65
66
67
68
69
70
71
72
73
74
75
76
77
B D E F G H
Demand and Load Shaping Discount Demand BD (kW) LoadShp BD (MWh) Demand Rate LoadShp Rate
Total LDD
Discount
Oct-15 16,127 (3,340) 10.02$ 27.86$ 68,554$
Oct-15 - 938 10.02$ 23.75$ 22,268$
Nov-15 9,847 (8,634) 10.27$ 28.56$ (145,441)$
Nov-15 - 515 10.27$ 24.48$ 12,594$
Dec-15 29,019 4,027 10.51$ 29.22$ 422,664$
Dec-15 - 7,977 10.51$ 24.82$ 198,018$
Jan-16 21,265 9,597 10.79$ 30.02$ 517,536$
Jan-16 - 11,976 10.79$ 25.03$ 299,753$
Feb-16 15,683 7,595 10.66$ 29.65$ 392,401$
Feb-16 - 8,227 10.66$ 24.68$ 203,052$
Mar-16 21,343 (1,869) 9.13$ 25.38$ 147,422$
Mar-16 - 1,165 9.13$ 22.07$ 25,717$
Apr-16 19,498 4,342 8.76$ 24.36$ 276,566$
Apr-16 - 4,636 8.76$ 21.04$ 97,524$
May-16 11,102 (22,493) 7.95$ 22.10$ (408,830)$
May-16 - (4,912) 7.95$ 17.53$ (86,110)$
Jun-16 18,851 (4,573) 8.33$ 23.15$ 51,142$
Jun-16 - 1,133 8.33$ 17.11$ 19,383$
Jul-16 15,413 5,571 9.87$ 27.43$ 304,923$
Jul-16 - 12,421 9.87$ 21.58$ 268,011$
Aug-16 21,863 2,346 10.90$ 30.30$ 309,382$
Aug-16 - 8,382 10.90$ 24.41$ 204,615$
Sep-16 15,038 4,222 11.42$ 31.75$ 305,786$
Sep-16 - 5,594 11.42$ 25.70$ 143,762$
Total 3,650,691$
BP-16-FS-BPA-01A Page 41
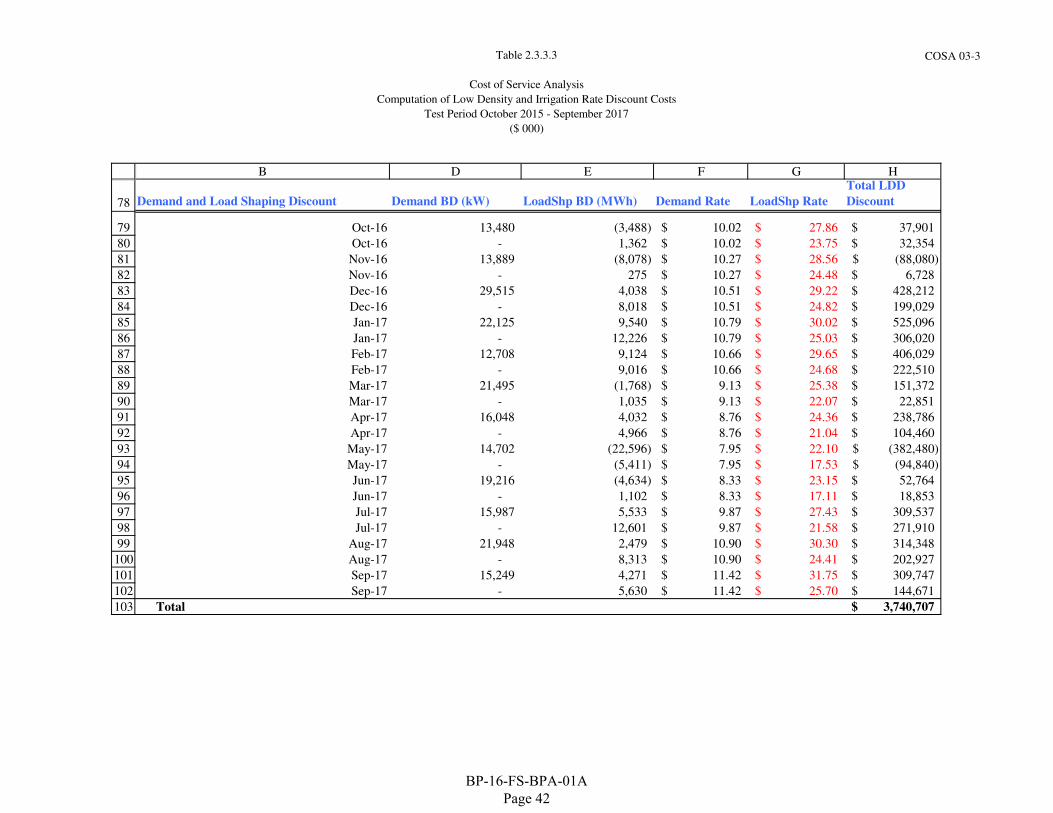
Table 2.3.3.3
Cost of Service Analysis
Computation of Low Density and Irrigation Rate Discount Costs
Test Period October 2015 - September 2017
($ 000)
COSA 03-3
78
79
80
81
82
83
84
85
86
87
88
89
90
91
92
93
94
95
96
97
98
99
100
101
102
103
B D E F G H
Demand and Load Shaping Discount Demand BD (kW) LoadShp BD (MWh) Demand Rate LoadShp Rate
Total LDD
Discount
Oct-16 13,480 (3,488) 10.02$ 27.86$ 37,901$
Oct-16 - 1,362 10.02$ 23.75$ 32,354$
Nov-16 13,889 (8,078) 10.27$ 28.56$ (88,080)$
Nov-16 - 275 10.27$ 24.48$ 6,728$
Dec-16 29,515 4,038 10.51$ 29.22$ 428,212$
Dec-16 - 8,018 10.51$ 24.82$ 199,029$
Jan-17 22,125 9,540 10.79$ 30.02$ 525,096$
Jan-17 - 12,226 10.79$ 25.03$ 306,020$
Feb-17 12,708 9,124 10.66$ 29.65$ 406,029$
Feb-17 - 9,016 10.66$ 24.68$ 222,510$
Mar-17 21,495 (1,768) 9.13$ 25.38$ 151,372$
Mar-17 - 1,035 9.13$ 22.07$ 22,851$
Apr-17 16,048 4,032 8.76$ 24.36$ 238,786$
Apr-17 - 4,966 8.76$ 21.04$ 104,460$
May-17 14,702 (22,596) 7.95$ 22.10$ (382,480)$
May-17 - (5,411) 7.95$ 17.53$ (94,840)$
Jun-17 19,216 (4,634) 8.33$ 23.15$ 52,764$
Jun-17 - 1,102 8.33$ 17.11$ 18,853$
Jul-17 15,987 5,533 9.87$ 27.43$ 309,537$
Jul-17 - 12,601 9.87$ 21.58$ 271,910$
Aug-17 21,948 2,479 10.90$ 30.30$ 314,348$
Aug-17 - 8,313 10.90$ 24.41$ 202,927$
Sep-17 15,249 4,271 11.42$ 31.75$ 309,747$
Sep-17 - 5,630 11.42$ 25.70$ 144,671$
Total 3,740,707$
BP-16-FS-BPA-01A Page 42
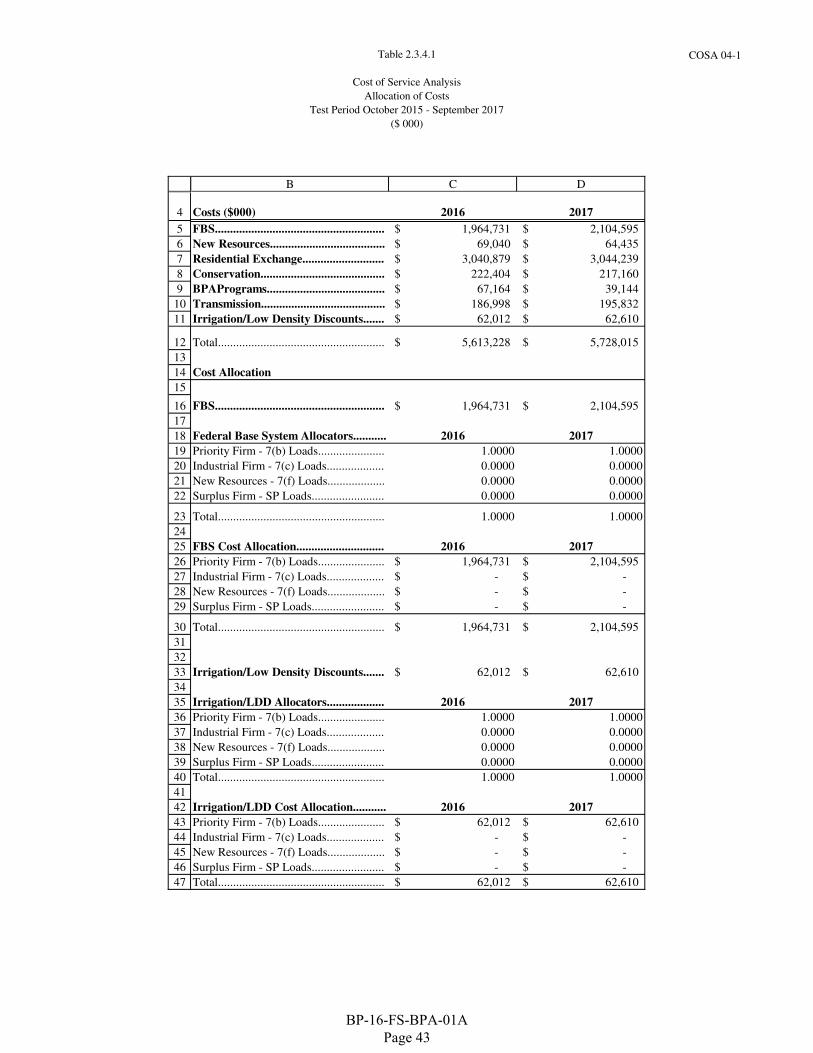
Table 2.3.4.1
Cost of Service Analysis
Allocation of Costs
Test Period October 2015 - September 2017
($ 000)
COSA 04-1
4
5
6
7
8
9
10
11
12
13
14
15
16
17
18
19
20
21
22
23
24
25
26
27
28
29
30
31
32
33
34
35
36
37
38
39
40
41
42
43
44
45
46
47
B C D
Costs ($000) 2016 2017
FBS........................................................ 1,964,731$ 2,104,595$
New Resources...................................... 69,040$ 64,435$
Residential Exchange........................... 3,040,879$ 3,044,239$
Conservation......................................... 222,404$ 217,160$
BPAPrograms....................................... 67,164$ 39,144$
Transmission......................................... 186,998$ 195,832$
Irrigation/Low Density Discounts....... 62,012$ 62,610$
Total....................................................... 5,613,228$ 5,728,015$
Cost Allocation
FBS........................................................ 1,964,731$ 2,104,595$
Federal Base System Allocators........... 2016 2017
Priority Firm - 7(b) Loads...................... 1.0000 1.0000
Industrial Firm - 7(c) Loads................... 0.0000 0.0000
New Resources - 7(f) Loads................... 0.0000 0.0000
Surplus Firm - SP Loads........................ 0.0000 0.0000
Total....................................................... 1.0000 1.0000
FBS Cost Allocation............................. 2016 2017
Priority Firm - 7(b) Loads...................... 1,964,731$ 2,104,595$
Industrial Firm - 7(c) Loads................... -$ -$
New Resources - 7(f) Loads................... -$ -$
Surplus Firm - SP Loads........................ -$ -$
Total....................................................... 1,964,731$ 2,104,595$
Irrigation/Low Density Discounts....... 62,012$ 62,610$
Irrigation/LDD Allocators................... 2016 2017
Priority Firm - 7(b) Loads...................... 1.0000 1.0000
Industrial Firm - 7(c) Loads................... 0.0000 0.0000
New Resources - 7(f) Loads................... 0.0000 0.0000
Surplus Firm - SP Loads........................ 0.0000 0.0000
Total....................................................... 1.0000 1.0000
Irrigation/LDD Cost Allocation........... 2016 2017
Priority Firm - 7(b) Loads...................... 62,012$ 62,610$
Industrial Firm - 7(c) Loads................... -$ -$
New Resources - 7(f) Loads................... -$ -$
Surplus Firm - SP Loads........................ -$ -$
Total....................................................... 62,012$ 62,610$
BP-16-FS-BPA-01A Page 43
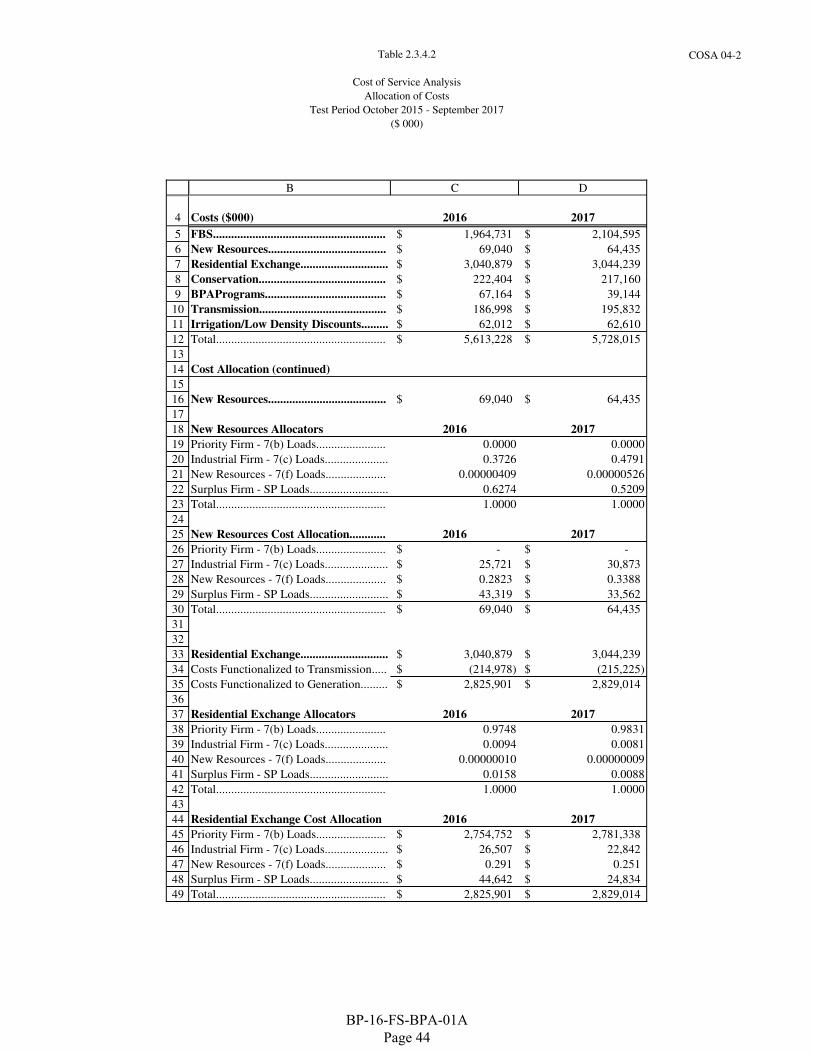
Table 2.3.4.2
Cost of Service Analysis
Allocation of Costs
Test Period October 2015 - September 2017
($ 000)
COSA 04-2
4
5
6
7
8
9
10
11
12
13
14
15
16
17
18
19
20
21
22
23
24
25
26
27
28
29
30
31
32
33
34
35
36
37
38
39
40
41
42
43
44
45
46
47
48
49
B C D
Costs ($000) 2016 2017
FBS......................................................... 1,964,731$ 2,104,595$
New Resources....................................... 69,040$ 64,435$
Residential Exchange............................. 3,040,879$ 3,044,239$
Conservation.......................................... 222,404$ 217,160$
BPAPrograms........................................ 67,164$ 39,144$
Transmission.......................................... 186,998$ 195,832$
Irrigation/Low Density Discounts......... 62,012$ 62,610$
Total........................................................ 5,613,228$ 5,728,015$
Cost Allocation (continued)
New Resources....................................... 69,040$ 64,435$
New Resources Allocators 2016 2017
Priority Firm - 7(b) Loads....................... 0.0000 0.0000
Industrial Firm - 7(c) Loads..................... 0.3726 0.4791
New Resources - 7(f) Loads.................... 0.00000409 0.00000526
Surplus Firm - SP Loads.......................... 0.6274 0.5209
Total........................................................ 1.0000 1.0000
New Resources Cost Allocation............ 2016 2017
Priority Firm - 7(b) Loads....................... -$ -$
Industrial Firm - 7(c) Loads..................... 25,721$ 30,873$
New Resources - 7(f) Loads.................... 0.2823$ 0.3388$
Surplus Firm - SP Loads.......................... 43,319$ 33,562$
Total........................................................ 69,040$ 64,435$
Residential Exchange............................. 3,040,879$ 3,044,239$
Costs Functionalized to Transmission..... (214,978)$ (215,225)$
Costs Functionalized to Generation......... 2,825,901$ 2,829,014$
Residential Exchange Allocators 2016 2017
Priority Firm - 7(b) Loads....................... 0.9748 0.9831
Industrial Firm - 7(c) Loads..................... 0.0094 0.0081
New Resources - 7(f) Loads.................... 0.00000010 0.00000009
Surplus Firm - SP Loads.......................... 0.0158 0.0088
Total........................................................ 1.0000 1.0000
Residential Exchange Cost Allocation 2016 2017
Priority Firm - 7(b) Loads....................... 2,754,752$ 2,781,338$
Industrial Firm - 7(c) Loads..................... 26,507$ 22,842$
New Resources - 7(f) Loads.................... 0.291$ 0.251$
Surplus Firm - SP Loads.......................... 44,642$ 24,834$
Total........................................................ 2,825,901$ 2,829,014$
BP-16-FS-BPA-01A Page 44
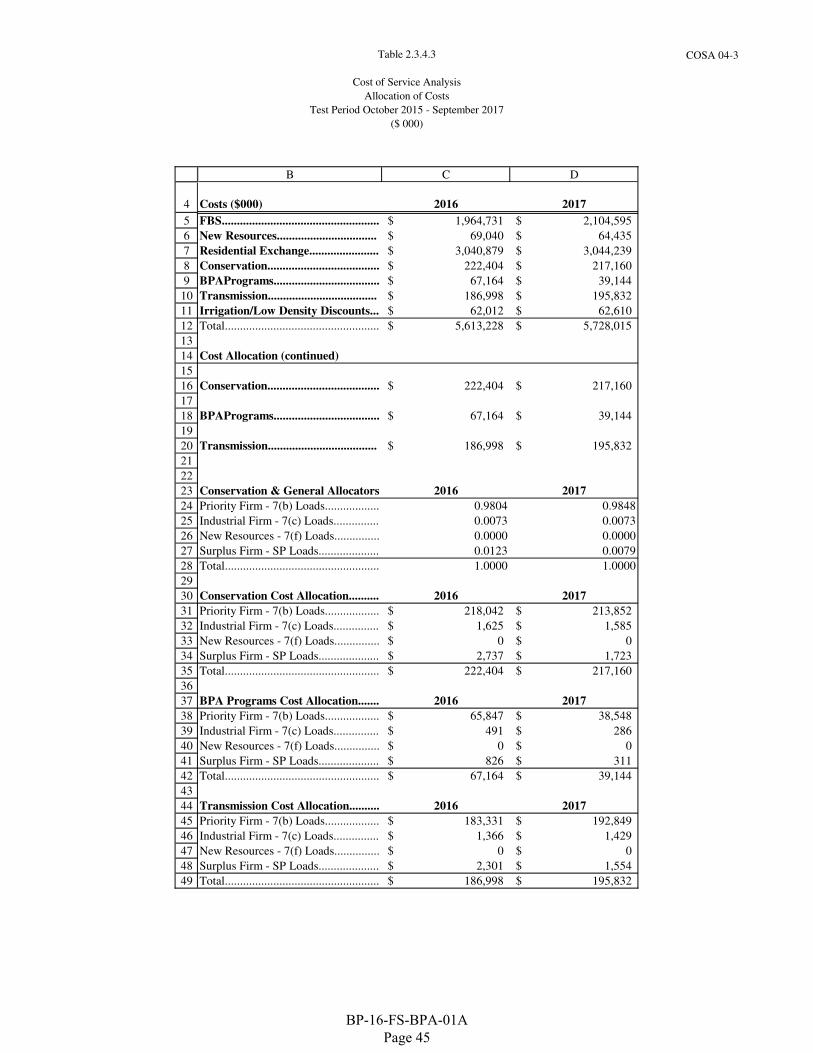
Table 2.3.4.3
Cost of Service Analysis
Allocation of Costs
Test Period October 2015 - September 2017
($ 000)
COSA 04-3
4
5
6
7
8
9
10
11
12
13
14
15
16
17
18
19
20
21
22
23
24
25
26
27
28
29
30
31
32
33
34
35
36
37
38
39
40
41
42
43
44
45
46
47
48
49
B C D
Costs ($000) 2016 2017
FBS.................................................... 1,964,731$ 2,104,595$
New Resources................................. 69,040$ 64,435$
Residential Exchange....................... 3,040,879$ 3,044,239$
Conservation..................................... 222,404$ 217,160$
BPAPrograms................................... 67,164$ 39,144$
Transmission.................................... 186,998$ 195,832$
Irrigation/Low Density Discounts... 62,012$ 62,610$
Total................................................... 5,613,228$ 5,728,015$
Cost Allocation (continued)
Conservation..................................... 222,404$ 217,160$
BPAPrograms................................... 67,164$ 39,144$
Transmission.................................... 186,998$ 195,832$
Conservation & General Allocators 2016 2017
Priority Firm - 7(b) Loads.................. 0.9804 0.9848
Industrial Firm - 7(c) Loads............... 0.0073 0.0073
New Resources - 7(f) Loads............... 0.0000 0.0000
Surplus Firm - SP Loads.................... 0.0123 0.0079
Total................................................... 1.0000 1.0000
Conservation Cost Allocation.......... 2016 2017
Priority Firm - 7(b) Loads.................. 218,042$ 213,852$
Industrial Firm - 7(c) Loads............... 1,625$ 1,585$
New Resources - 7(f) Loads............... 0$ 0$
Surplus Firm - SP Loads.................... 2,737$ 1,723$
Total................................................... 222,404$ 217,160$
BPA Programs Cost Allocation....... 2016 2017
Priority Firm - 7(b) Loads.................. 65,847$ 38,548$
Industrial Firm - 7(c) Loads............... 491$ 286$
New Resources - 7(f) Loads............... 0$ 0$
Surplus Firm - SP Loads.................... 826$ 311$
Total................................................... 67,164$ 39,144$
Transmission Cost Allocation.......... 2016 2017
Priority Firm - 7(b) Loads.................. 183,331$ 192,849$
Industrial Firm - 7(c) Loads............... 1,366$ 1,429$
New Resources - 7(f) Loads............... 0$ 0$
Surplus Firm - SP Loads.................... 2,301$ 1,554$
Total................................................... 186,998$ 195,832$
BP-16-FS-BPA-01A Page 45
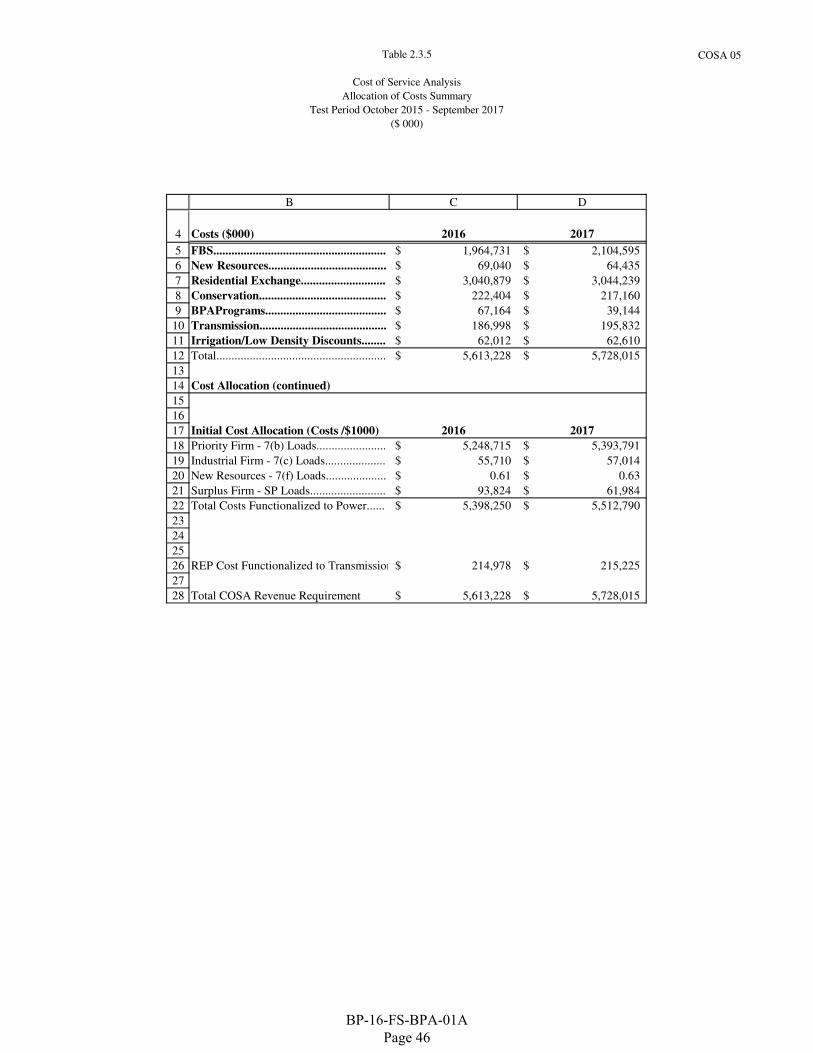
Table 2.3.5
Cost of Service Analysis
Allocation of Costs Summary
Test Period October 2015 - September 2017
($ 000)
COSA 05
4
5
6
7
8
9
10
11
12
13
14
15
16
17
18
19
20
21
22
23
24
25
26
27
28
B C D
Costs ($000) 2016 2017
FBS......................................................... 1,964,731$ 2,104,595$
New Resources....................................... 69,040$ 64,435$
Residential Exchange............................ 3,040,879$ 3,044,239$
Conservation.......................................... 222,404$ 217,160$
BPAPrograms........................................ 67,164$ 39,144$
Transmission.......................................... 186,998$ 195,832$
Irrigation/Low Density Discounts........ 62,012$ 62,610$
Total........................................................ 5,613,228$ 5,728,015$
Cost Allocation (continued)
Initial Cost Allocation (Costs /$1000) 2016 2017
Priority Firm - 7(b) Loads....................... 5,248,715$ 5,393,791$
Industrial Firm - 7(c) Loads.................... 55,710$ 57,014$
New Resources - 7(f) Loads.................... 0.61$ 0.63$
Surplus Firm - SP Loads......................... 93,824$ 61,984$
Total Costs Functionalized to Power...... 5,398,250$ 5,512,790$
REP Cost Functionalized to Transmission 214,978$ 215,225$
Total COSA Revenue Requirement 5,613,228$ 5,728,015$
BP-16-FS-BPA-01A Page 46
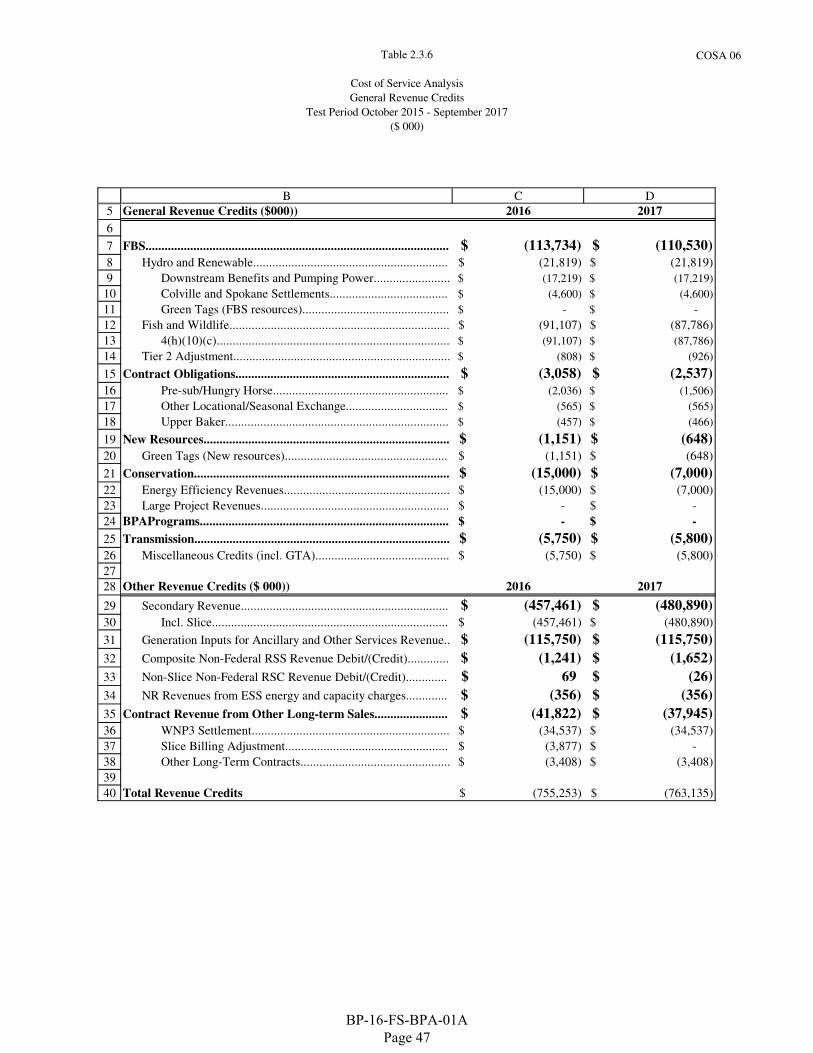
Table 2.3.6
Cost of Service Analysis
General Revenue Credits
Test Period October 2015 - September 2017
($ 000)
COSA 06
5
6
7
8
9
10
11
12
13
14
15
16
17
18
19
20
21
22
23
24
25
26
27
28
29
30
31
32
33
34
35
36
37
38
39
40
B C D
General Revenue Credits ($000)) 2016 2017
FBS............................................................................................... (113,734)$ (110,530)$
Hydro and Renewable............................................................. (21,819)$ (21,819)$
Downstream Benefits and Pumping Power........................ (17,219)$ (17,219)$
Colville and Spokane Settlements..................................... (4,600)$ (4,600)$
Green Tags (FBS resources).............................................. -$ -$
Fish and Wildlife..................................................................... (91,107)$ (87,786)$
4(h)(10)(c)......................................................................... (91,107)$ (87,786)$
Tier 2 Adjustment.................................................................... (808)$ (926)$
Contract Obligations................................................................... (3,058)$ (2,537)$
Pre-sub/Hungry Horse....................................................... (2,036)$ (1,506)$
Other Locational/Seasonal Exchange................................ (565)$ (565)$
Upper Baker...................................................................... (457)$ (466)$
New Resources............................................................................. (1,151)$ (648)$
Green Tags (New resources)................................................... (1,151)$ (648)$
Conservation................................................................................ (15,000)$ (7,000)$
Energy Efficiency Revenues.................................................... (15,000)$ (7,000)$
Large Project Revenues........................................................... -$ -$
BPAPrograms.............................................................................. -$ -$
Transmission................................................................................ (5,750)$ (5,800)$
Miscellaneous Credits (incl. GTA).......................................... (5,750)$ (5,800)$
Other Revenue Credits ($ 000)) 2016 2017
Secondary Revenue................................................................. (457,461)$ (480,890)$
Incl. Slice.......................................................................... (457,461)$ (480,890)$
Generation Inputs for Ancillary and Other Services Revenue.. (115,750)$ (115,750)$
Composite Non-Federal RSS Revenue Debit/(Credit)............. (1,241)$ (1,652)$
Non-Slice Non-Federal RSC Revenue Debit/(Credit)............. 69$ (26)$
NR Revenues from ESS energy and capacity charges............. (356)$ (356)$
Contract Revenue from Other Long-term Sales....................... (41,822)$ (37,945)$
WNP3 Settlement.............................................................. (34,537)$ (34,537)$
Slice Billing Adjustment................................................... (3,877)$ -$
Other Long-Term Contracts............................................... (3,408)$ (3,408)$
Total Revenue Credits (755,253)$ (763,135)$
BP-16-FS-BPA-01A Page 47
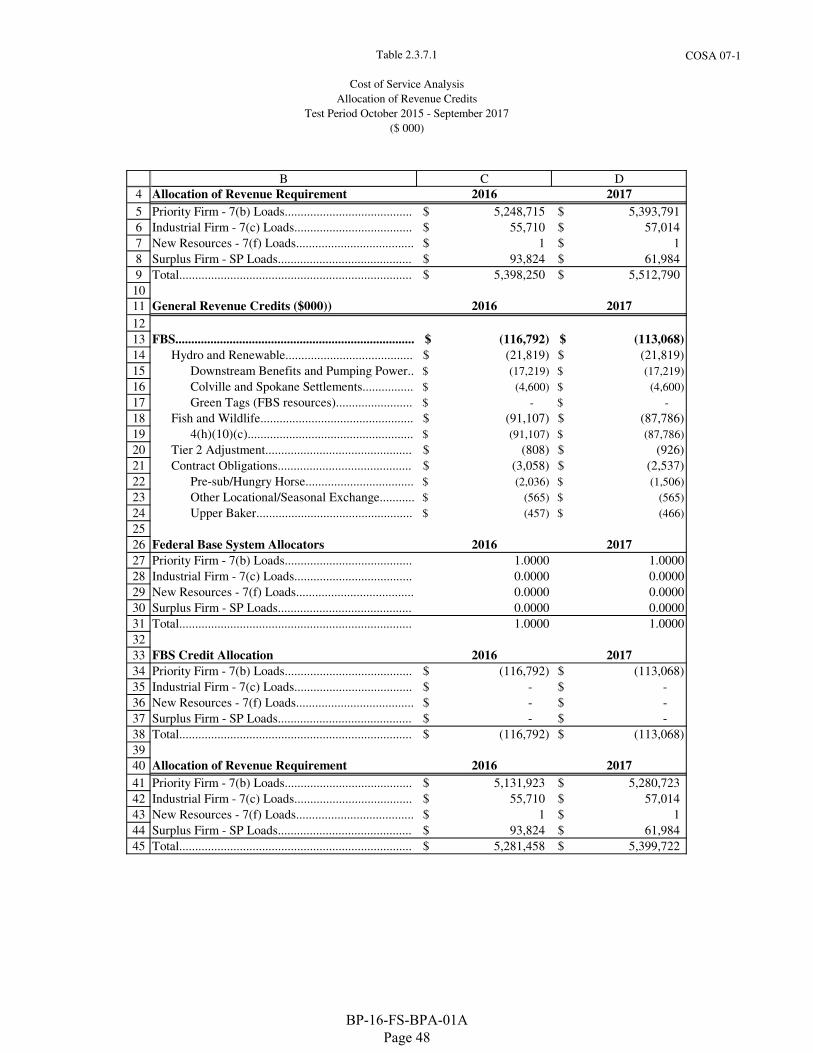
Table 2.3.7.1
Cost of Service Analysis
Allocation of Revenue Credits
Test Period October 2015 - September 2017
($ 000)
COSA 07-1
4
5
6
7
8
9
10
11
12
13
14
15
16
17
18
19
20
21
22
23
24
25
26
27
28
29
30
31
32
33
34
35
36
37
38
39
40
41
42
43
44
45
B C D
Allocation of Revenue Requirement 2016 2017
Priority Firm - 7(b) Loads........................................ 5,248,715$ 5,393,791$
Industrial Firm - 7(c) Loads..................................... 55,710$ 57,014$
New Resources - 7(f) Loads..................................... 1$ 1$
Surplus Firm - SP Loads.......................................... 93,824$ 61,984$
Total......................................................................... 5,398,250$ 5,512,790$
General Revenue Credits ($000)) 2016 2017
FBS........................................................................... (116,792)$ (113,068)$
Hydro and Renewable........................................ (21,819)$ (21,819)$
Downstream Benefits and Pumping Power.. (17,219)$ (17,219)$
Colville and Spokane Settlements................ (4,600)$ (4,600)$
Green Tags (FBS resources)........................ -$ -$
Fish and Wildlife................................................ (91,107)$ (87,786)$
4(h)(10)(c).................................................... (91,107)$ (87,786)$
Tier 2 Adjustment.............................................. (808)$ (926)$
Contract Obligations.......................................... (3,058)$ (2,537)$
Pre-sub/Hungry Horse.................................. (2,036)$ (1,506)$
Other Locational/Seasonal Exchange........... (565)$ (565)$
Upper Baker................................................. (457)$ (466)$
Federal Base System Allocators 2016 2017
Priority Firm - 7(b) Loads........................................ 1.0000 1.0000
Industrial Firm - 7(c) Loads..................................... 0.0000 0.0000
New Resources - 7(f) Loads..................................... 0.0000 0.0000
Surplus Firm - SP Loads.......................................... 0.0000 0.0000
Total......................................................................... 1.0000 1.0000
FBS Credit Allocation 2016 2017
Priority Firm - 7(b) Loads........................................ (116,792)$ (113,068)$
Industrial Firm - 7(c) Loads..................................... -$ -$
New Resources - 7(f) Loads..................................... -$ -$
Surplus Firm - SP Loads.......................................... -$ -$
Total......................................................................... (116,792)$ (113,068)$
Allocation of Revenue Requirement 2016 2017
Priority Firm - 7(b) Loads........................................ 5,131,923$ 5,280,723$
Industrial Firm - 7(c) Loads..................................... 55,710$ 57,014$
New Resources - 7(f) Loads..................................... 1$ 1$
Surplus Firm - SP Loads.......................................... 93,824$ 61,984$
Total......................................................................... 5,281,458$ 5,399,722$
BP-16-FS-BPA-01A Page 48
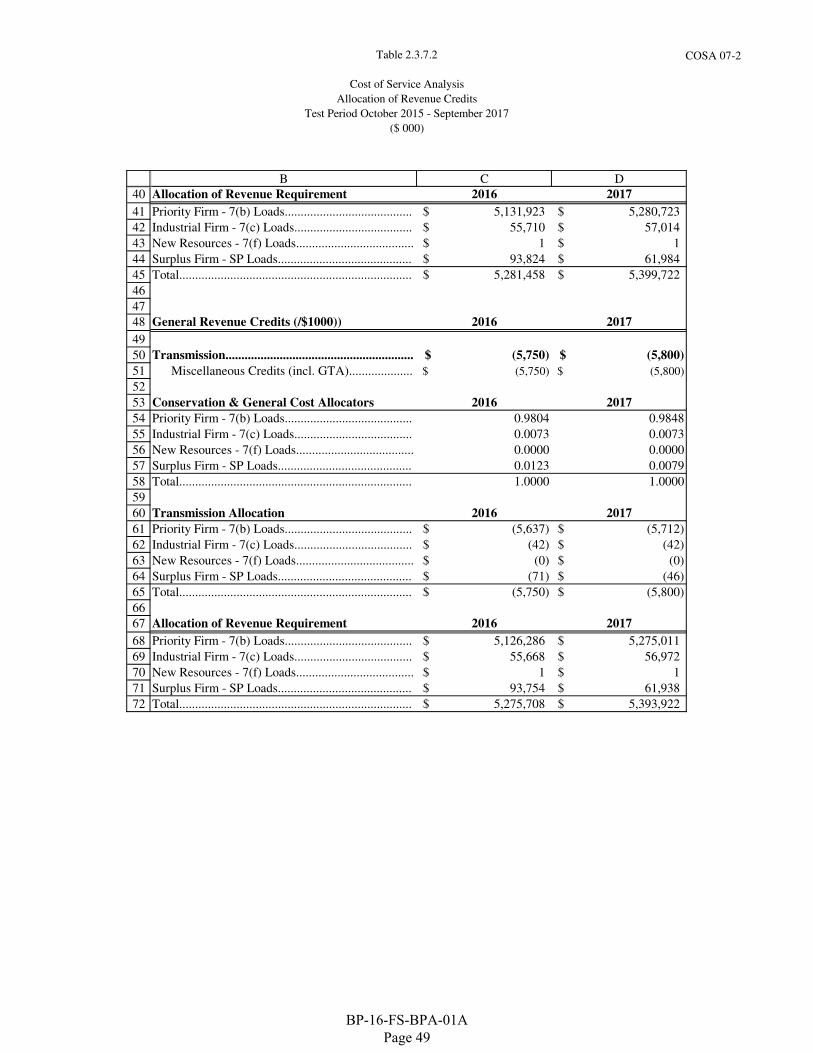
Table 2.3.7.2
Cost of Service Analysis
Allocation of Revenue Credits
Test Period October 2015 - September 2017
($ 000)
COSA 07-2
40
41
42
43
44
45
46
47
48
49
50
51
52
53
54
55
56
57
58
59
60
61
62
63
64
65
66
67
68
69
70
71
72
B C D
Allocation of Revenue Requirement 2016 2017
Priority Firm - 7(b) Loads........................................ 5,131,923$ 5,280,723$
Industrial Firm - 7(c) Loads..................................... 55,710$ 57,014$
New Resources - 7(f) Loads..................................... 1$ 1$
Surplus Firm - SP Loads.......................................... 93,824$ 61,984$
Total......................................................................... 5,281,458$ 5,399,722$
General Revenue Credits (/$1000)) 2016 2017
Transmission........................................................... (5,750)$ (5,800)$
Miscellaneous Credits (incl. GTA).................... (5,750)$ (5,800)$
Conservation & General Cost Allocators 2016 2017
Priority Firm - 7(b) Loads........................................ 0.9804 0.9848
Industrial Firm - 7(c) Loads..................................... 0.0073 0.0073
New Resources - 7(f) Loads..................................... 0.0000 0.0000
Surplus Firm - SP Loads.......................................... 0.0123 0.0079
Total......................................................................... 1.0000 1.0000
Transmission Allocation 2016 2017
Priority Firm - 7(b) Loads........................................ (5,637)$ (5,712)$
Industrial Firm - 7(c) Loads..................................... (42)$ (42)$
New Resources - 7(f) Loads..................................... (0)$ (0)$
Surplus Firm - SP Loads.......................................... (71)$ (46)$
Total......................................................................... (5,750)$ (5,800)$
Allocation of Revenue Requirement 2016 2017
Priority Firm - 7(b) Loads........................................ 5,126,286$ 5,275,011$
Industrial Firm - 7(c) Loads..................................... 55,668$ 56,972$
New Resources - 7(f) Loads..................................... 1$ 1$
Surplus Firm - SP Loads.......................................... 93,754$ 61,938$
Total......................................................................... 5,275,708$ 5,393,922$
BP-16-FS-BPA-01A Page 49
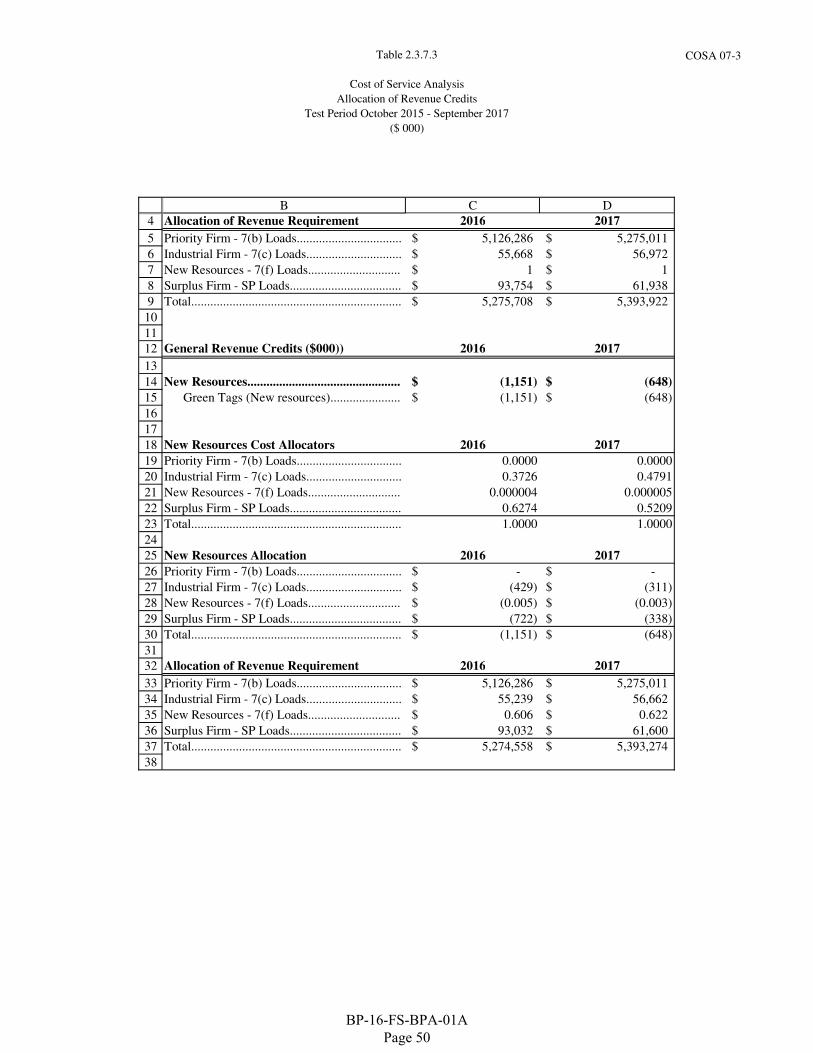
Table 2.3.7.3
Cost of Service Analysis
Allocation of Revenue Credits
Test Period October 2015 - September 2017
($ 000)
COSA 07-3
4
5
6
7
8
9
10
11
12
13
14
15
16
17
18
19
20
21
22
23
24
25
26
27
28
29
30
31
32
33
34
35
36
37
38
B C D
Allocation of Revenue Requirement 2016 2017
Priority Firm - 7(b) Loads................................. 5,126,286$ 5,275,011$
Industrial Firm - 7(c) Loads.............................. 55,668$ 56,972$
New Resources - 7(f) Loads............................. 1$ 1$
Surplus Firm - SP Loads................................... 93,754$ 61,938$
Total.................................................................. 5,275,708$ 5,393,922$
General Revenue Credits ($000)) 2016 2017
New Resources................................................ (1,151)$ (648)$
Green Tags (New resources)...................... (1,151)$ (648)$
New Resources Cost Allocators 2016 2017
Priority Firm - 7(b) Loads................................. 0.0000 0.0000
Industrial Firm - 7(c) Loads.............................. 0.3726 0.4791
New Resources - 7(f) Loads............................. 0.000004 0.000005
Surplus Firm - SP Loads................................... 0.6274 0.5209
Total.................................................................. 1.0000 1.0000
New Resources Allocation 2016 2017
Priority Firm - 7(b) Loads................................. -$ -$
Industrial Firm - 7(c) Loads.............................. (429)$ (311)$
New Resources - 7(f) Loads............................. (0.005)$ (0.003)$
Surplus Firm - SP Loads................................... (722)$ (338)$
Total.................................................................. (1,151)$ (648)$
Allocation of Revenue Requirement 2016 2017
Priority Firm - 7(b) Loads................................. 5,126,286$ 5,275,011$
Industrial Firm - 7(c) Loads.............................. 55,239$ 56,662$
New Resources - 7(f) Loads............................. 0.606$ 0.622$
Surplus Firm - SP Loads................................... 93,032$ 61,600$
Total.................................................................. 5,274,558$ 5,393,274$
BP-16-FS-BPA-01A Page 50
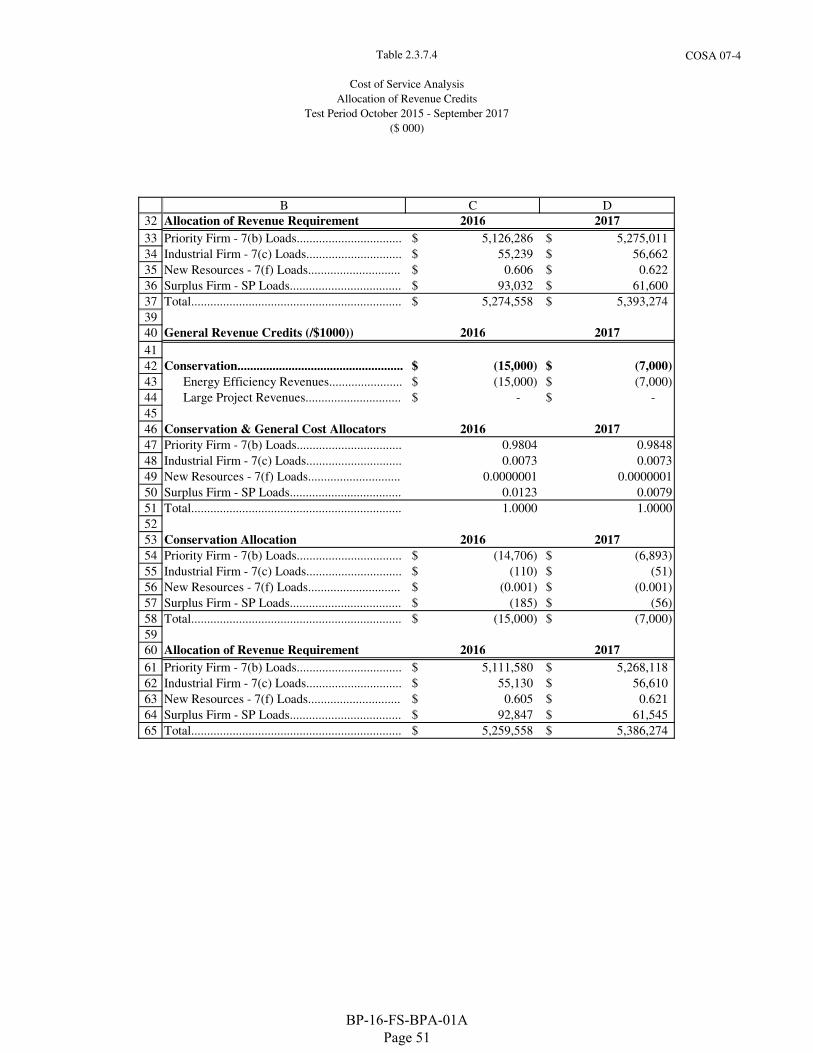
Table 2.3.7.4
Cost of Service Analysis
Allocation of Revenue Credits
Test Period October 2015 - September 2017
($ 000)
COSA 07-4
32
33
34
35
36
37
B C D
Allocation of Revenue Requirement 2016 2017
Priority Firm - 7(b) Loads................................. 5,126,286$ 5,275,011$
Industrial Firm - 7(c) Loads.............................. 55,239$ 56,662$
New Resources - 7(f) Loads............................. 0.606$ 0.622$
Surplus Firm - SP Loads................................... 93,032$ 61,600$
Total.................................................................. 5,274,558$ 5,393,274$
39
40
41
42
43
44
45
46
47
48
49
50
51
52
53
54
55
56
57
58
59
60
61
62
63
64
65
General Revenue Credits (/$1000)) 2016 2017
Conservation.................................................... (15,000)$ (7,000)$
Energy Efficiency Revenues....................... (15,000)$ (7,000)$
Large Project Revenues.............................. -$ -$
Conservation & General Cost Allocators 2016 2017
Priority Firm - 7(b) Loads................................. 0.9804 0.9848
Industrial Firm - 7(c) Loads.............................. 0.0073 0.0073
New Resources - 7(f) Loads............................. 0.0000001 0.0000001
Surplus Firm - SP Loads................................... 0.0123 0.0079
Total.................................................................. 1.0000 1.0000
Conservation Allocation 2016 2017
Priority Firm - 7(b) Loads................................. (14,706)$ (6,893)$
Industrial Firm - 7(c) Loads.............................. (110)$ (51)$
New Resources - 7(f) Loads............................. (0.001)$ (0.001)$
Surplus Firm - SP Loads................................... (185)$ (56)$
Total.................................................................. (15,000)$ (7,000)$
Allocation of Revenue Requirement 2016 2017
Priority Firm - 7(b) Loads................................. 5,111,580$ 5,268,118$
Industrial Firm - 7(c) Loads.............................. 55,130$ 56,610$
New Resources - 7(f) Loads............................. 0.605$ 0.621$
Surplus Firm - SP Loads................................... 92,847$ 61,545$
Total.................................................................. 5,259,558$ 5,386,274$
BP-16-FS-BPA-01A Page 51
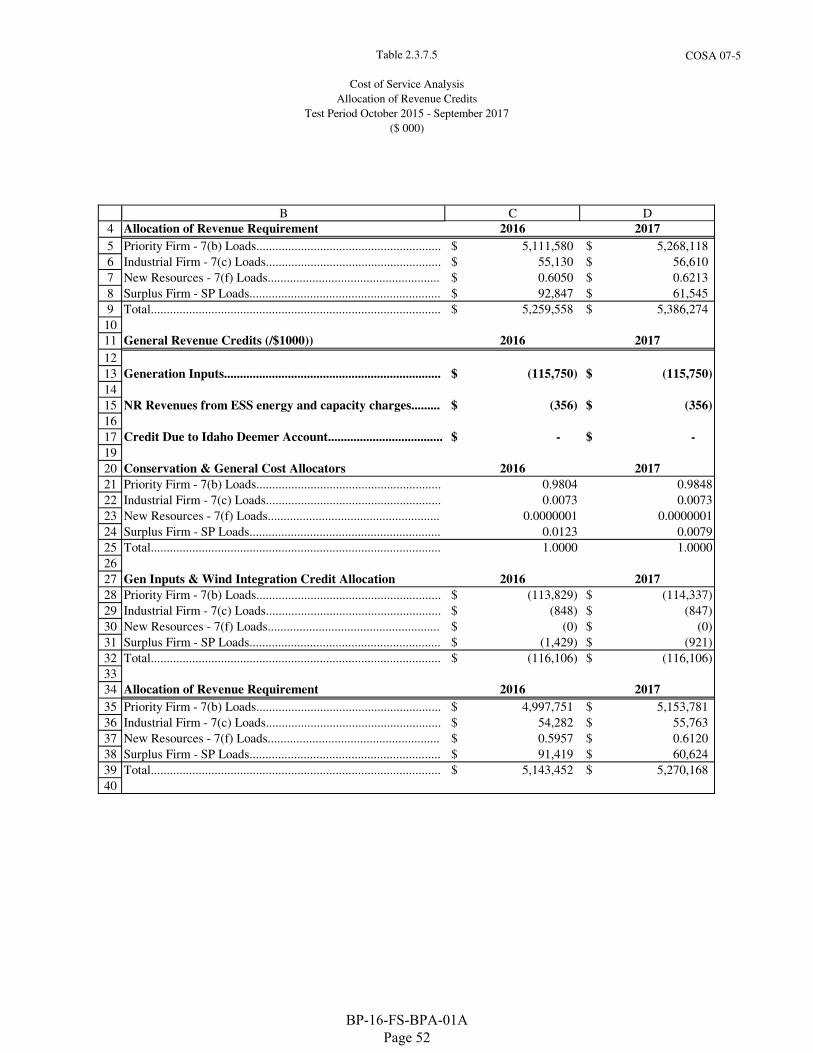
Table 2.3.7.5
Cost of Service Analysis
Allocation of Revenue Credits
Test Period October 2015 - September 2017
($ 000)
COSA 07-5
4
5
6
7
8
9
10
11
12
13
14
15
16
17
19
20
21
22
23
24
25
26
27
28
29
30
31
32
33
34
35
36
37
38
39
40
B C D
Allocation of Revenue Requirement 2016 2017
Priority Firm - 7(b) Loads.......................................................... 5,111,580$ 5,268,118$
Industrial Firm - 7(c) Loads....................................................... 55,130$ 56,610$
New Resources - 7(f) Loads...................................................... 0.6050$ 0.6213$
Surplus Firm - SP Loads............................................................ 92,847$ 61,545$
Total........................................................................................... 5,259,558$ 5,386,274$
General Revenue Credits (/$1000)) 2016 2017
Generation Inputs.................................................................... (115,750)$ (115,750)$
NR Revenues from ESS energy and capacity charges......... (356)$ (356)$
Credit Due to Idaho Deemer Account.................................... -$ -$
Conservation & General Cost Allocators 2016 2017
Priority Firm - 7(b) Loads.......................................................... 0.9804 0.9848
Industrial Firm - 7(c) Loads....................................................... 0.0073 0.0073
New Resources - 7(f) Loads...................................................... 0.0000001 0.0000001
Surplus Firm - SP Loads............................................................ 0.0123 0.0079
Total........................................................................................... 1.0000 1.0000
Gen Inputs & Wind Integration Credit Allocation 2016 2017
Priority Firm - 7(b) Loads.......................................................... (113,829)$ (114,337)$
Industrial Firm - 7(c) Loads....................................................... (848)$ (847)$
New Resources - 7(f) Loads...................................................... (0)$ (0)$
Surplus Firm - SP Loads............................................................ (1,429)$ (921)$
Total........................................................................................... (116,106)$ (116,106)$
Allocation of Revenue Requirement 2016 2017
Priority Firm - 7(b) Loads.......................................................... 4,997,751$ 5,153,781$
Industrial Firm - 7(c) Loads....................................................... 54,282$ 55,763$
New Resources - 7(f) Loads...................................................... 0.5957$ 0.6120$
Surplus Firm - SP Loads............................................................ 91,419$ 60,624$
Total........................................................................................... 5,143,452$ 5,270,168$
BP-16-FS-BPA-01A Page 52
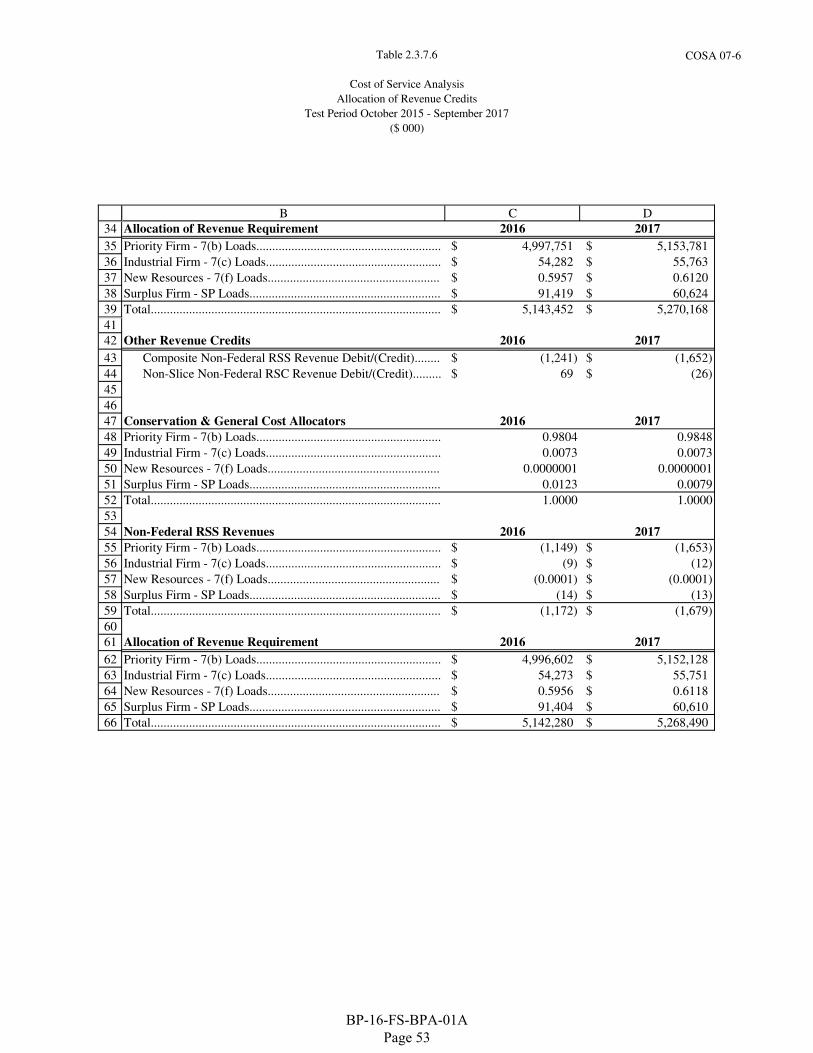
Table 2.3.7.6
Cost of Service Analysis
Allocation of Revenue Credits
Test Period October 2015 - September 2017
($ 000)
COSA 07-6
34
35
36
37
38
39
B C D
Allocation of Revenue Requirement 2016 2017
Priority Firm - 7(b) Loads.......................................................... 4,997,751$ 5,153,781$
Industrial Firm - 7(c) Loads....................................................... 54,282$ 55,763$
New Resources - 7(f) Loads...................................................... 0.5957$ 0.6120$
Surplus Firm - SP Loads............................................................ 91,419$ 60,624$
Total........................................................................................... 5,143,452$ 5,270,168$
41
42
43
44
45
46
47
48
49
50
51
52
53
54
55
56
57
58
59
60
61
62
63
64
65
66
Other Revenue Credits 2016 2017
Composite Non-Federal RSS Revenue Debit/(Credit)........ (1,241)$ (1,652)$
Non-Slice Non-Federal RSC Revenue Debit/(Credit)......... 69$ (26)$
Conservation & General Cost Allocators 2016 2017
Priority Firm - 7(b) Loads.......................................................... 0.9804 0.9848
Industrial Firm - 7(c) Loads....................................................... 0.0073 0.0073
New Resources - 7(f) Loads...................................................... 0.0000001 0.0000001
Surplus Firm - SP Loads............................................................ 0.0123 0.0079
Total........................................................................................... 1.0000 1.0000
Non-Federal RSS Revenues 2016 2017
Priority Firm - 7(b) Loads.......................................................... (1,149)$ (1,653)$
Industrial Firm - 7(c) Loads....................................................... (9)$ (12)$
New Resources - 7(f) Loads...................................................... (0.0001)$ (0.0001)$
Surplus Firm - SP Loads............................................................ (14)$ (13)$
Total........................................................................................... (1,172)$ (1,679)$
Allocation of Revenue Requirement 2016 2017
Priority Firm - 7(b) Loads.......................................................... 4,996,602$ 5,152,128$
Industrial Firm - 7(c) Loads....................................................... 54,273$ 55,751$
New Resources - 7(f) Loads...................................................... 0.5956$ 0.6118$
Surplus Firm - SP Loads............................................................ 91,404$ 60,610$
Total........................................................................................... 5,142,280$ 5,268,490$
BP-16-FS-BPA-01A Page 53
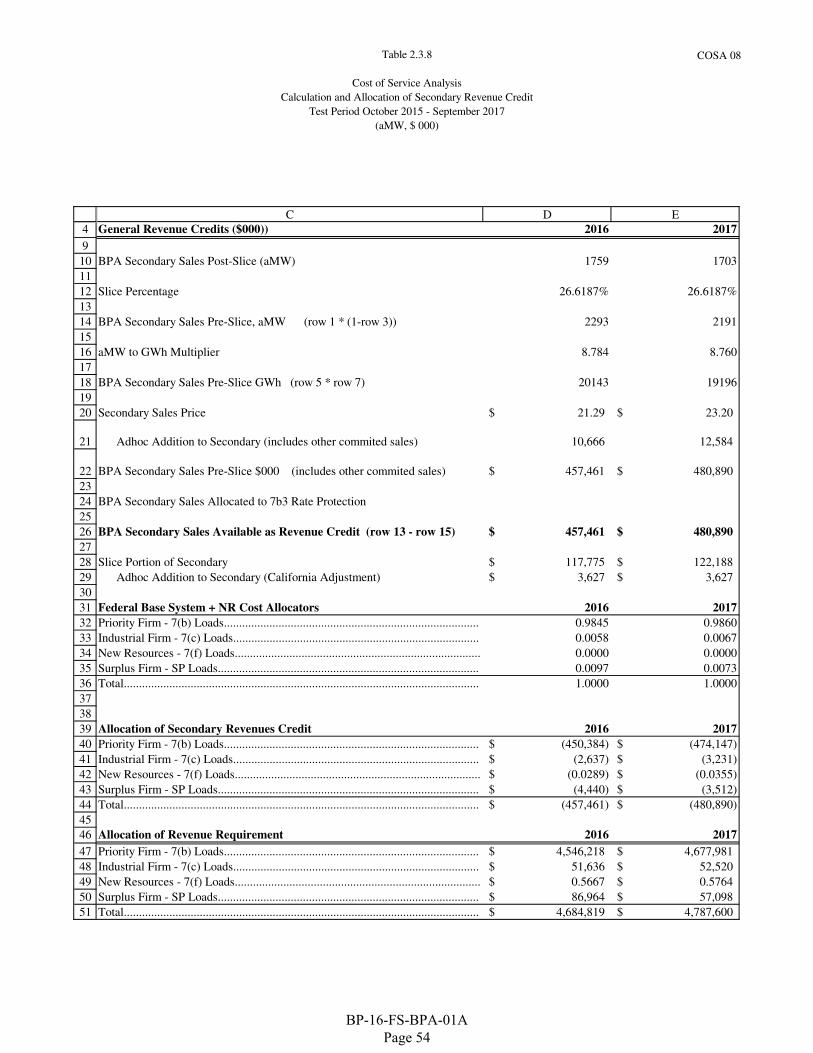
Table 2.3.8
Cost of Service Analysis
Calculation and Allocation of Secondary Revenue Credit
Test Period October 2015 - September 2017
(aMW, $ 000)
COSA 08
4
9
10
11
12
13
14
15
16
17
18
19
20
21
22
23
24
25
26
27
28
29
30
31
32
33
34
35
36
37
38
39
40
41
42
43
44
45
46
47
48
49
50
51
C D E
General Revenue Credits ($000)) 2016 2017
BPA Secondary Sales Post-Slice (aMW) 1759 1703
Slice Percentage 26.6187% 26.6187%
BPA Secondary Sales Pre-Slice, aMW (row 1 * (1-row 3)) 2293 2191
aMW to GWh Multiplier 8.784 8.760
BPA Secondary Sales Pre-Slice GWh (row 5 * row 7) 20143 19196
Secondary Sales Price 21.29$ 23.20$
Adhoc Addition to Secondary (includes other commited sales) 10,666 12,584
BPA Secondary Sales Pre-Slice $000 (includes other commited sales) 457,461$ 480,890$
BPA Secondary Sales Allocated to 7b3 Rate Protection
BPA Secondary Sales Available as Revenue Credit (row 13 - row 15) 457,461$ 480,890$
Slice Portion of Secondary 117,775$ 122,188$
Adhoc Addition to Secondary (California Adjustment) 3,627$ 3,627$
Federal Base System + NR Cost Allocators 2016 2017
Priority Firm - 7(b) Loads.................................................................................... 0.9845 0.9860
Industrial Firm - 7(c) Loads................................................................................. 0.0058 0.0067
New Resources - 7(f) Loads................................................................................. 0.0000 0.0000
Surplus Firm - SP Loads...................................................................................... 0.0097 0.0073
Total..................................................................................................................... 1.0000 1.0000
Allocation of Secondary Revenues Credit 2016 2017
Priority Firm - 7(b) Loads.................................................................................... (450,384)$ (474,147)$
Industrial Firm - 7(c) Loads................................................................................. (2,637)$ (3,231)$
New Resources - 7(f) Loads................................................................................. (0.0289)$ (0.0355)$
Surplus Firm - SP Loads...................................................................................... (4,440)$ (3,512)$
Total..................................................................................................................... (457,461)$ (480,890)$
Allocation of Revenue Requirement 2016 2017
Priority Firm - 7(b) Loads.................................................................................... 4,546,218$ 4,677,981$
Industrial Firm - 7(c) Loads................................................................................. 51,636$ 52,520$
New Resources - 7(f) Loads................................................................................. 0.5667$ 0.5764$
Surplus Firm - SP Loads...................................................................................... 86,964$ 57,098$
Total..................................................................................................................... 4,684,819$ 4,787,600$
BP-16-FS-BPA-01A Page 54
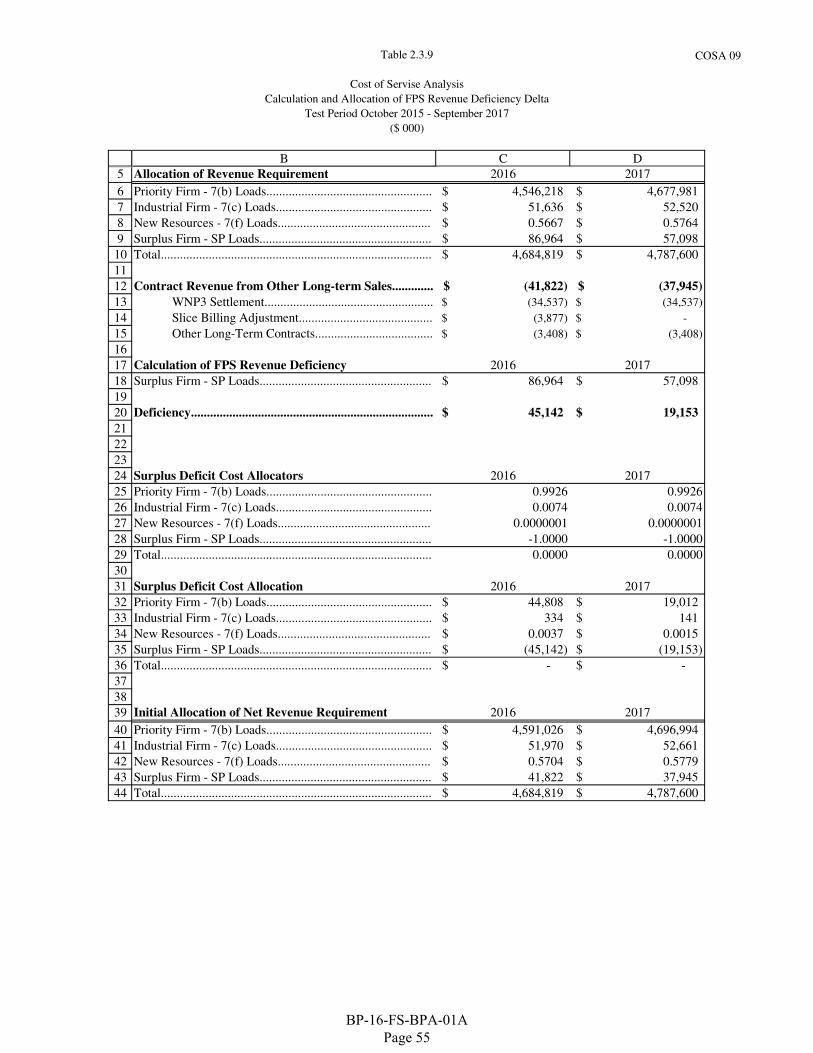
Table 2.3.9
Cost of Servise Analysis
Calculation and Allocation of FPS Revenue Deficiency Delta
Test Period October 2015 - September 2017
($ 000)
COSA 09
5
6
7
8
9
10
11
12
13
14
15
16
17
18
19
20
21
22
23
24
25
26
27
28
29
30
31
32
33
34
35
36
37
38
39
40
41
42
43
44
B C D
Allocation of Revenue Requirement 2016 2017
Priority Firm - 7(b) Loads.................................................... 4,546,218$ 4,677,981$
Industrial Firm - 7(c) Loads................................................. 51,636$ 52,520$
New Resources - 7(f) Loads................................................ 0.5667$ 0.5764$
Surplus Firm - SP Loads...................................................... 86,964$ 57,098$
Total..................................................................................... 4,684,819$ 4,787,600$
Contract Revenue from Other Long-term Sales............. (41,822)$ (37,945)$
WNP3 Settlement..................................................... (34,537)$ (34,537)$
Slice Billing Adjustment.......................................... (3,877)$ -$
Other Long-Term Contracts..................................... (3,408)$ (3,408)$
Calculation of FPS Revenue Deficiency 2016 2017
Surplus Firm - SP Loads...................................................... 86,964$ 57,098$
Deficiency............................................................................ 45,142$ 19,153$
Surplus Deficit Cost Allocators 2016 2017
Priority Firm - 7(b) Loads.................................................... 0.9926 0.9926
Industrial Firm - 7(c) Loads................................................. 0.0074 0.0074
New Resources - 7(f) Loads................................................ 0.0000001 0.0000001
Surplus Firm - SP Loads...................................................... -1.0000 -1.0000
Total..................................................................................... 0.0000 0.0000
Surplus Deficit Cost Allocation 2016 2017
Priority Firm - 7(b) Loads.................................................... 44,808$ 19,012$
Industrial Firm - 7(c) Loads................................................. 334$ 141$
New Resources - 7(f) Loads................................................ 0.0037$ 0.0015$
Surplus Firm - SP Loads...................................................... (45,142)$ (19,153)$
Total..................................................................................... -$ -$
Initial Allocation of Net Revenue Requirement 2016 2017
Priority Firm - 7(b) Loads.................................................... 4,591,026$ 4,696,994$
Industrial Firm - 7(c) Loads................................................. 51,970$ 52,661$
New Resources - 7(f) Loads................................................ 0.5704$ 0.5779$
Surplus Firm - SP Loads...................................................... 41,822$ 37,945$
Total..................................................................................... 4,684,819$ 4,787,600$
BP-16-FS-BPA-01A Page 55
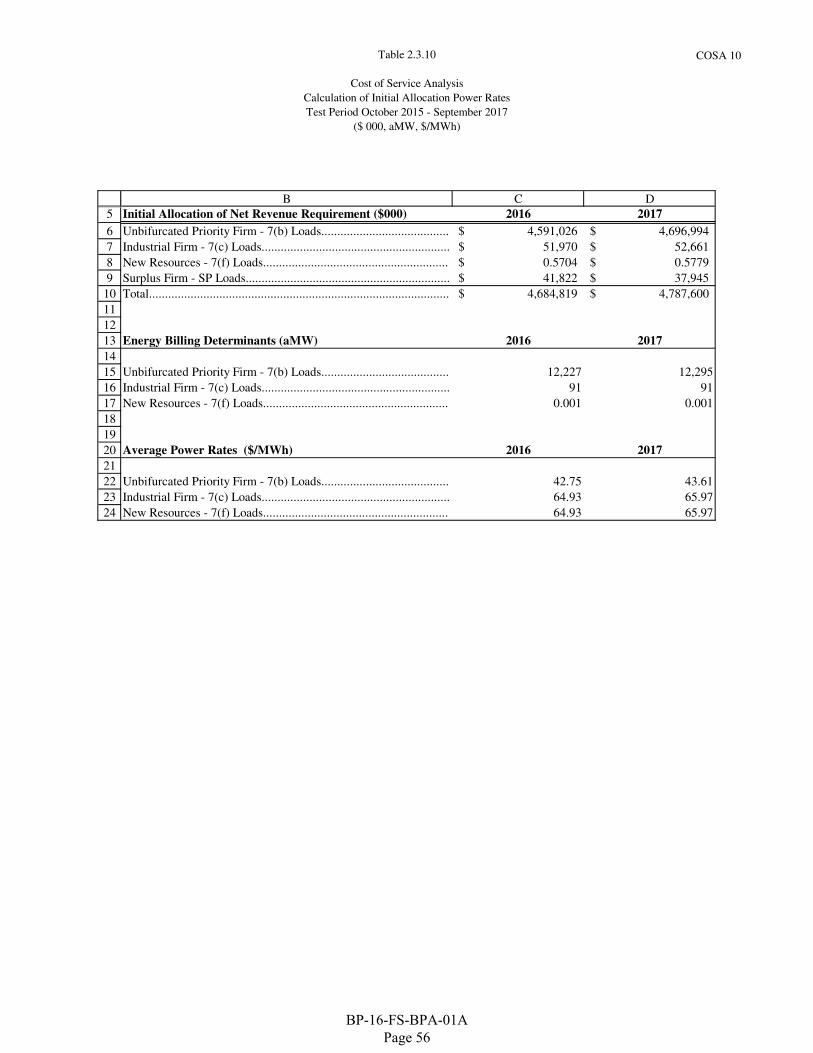
Table 2.3.10
Cost of Service Analysis
Calculation of Initial Allocation Power Rates
Test Period October 2015 - September 2017
($ 000, aMW, $/MWh)
COSA 10
5
6
7
8
9
10
11
12
13
14
15
16
17
18
19
20
21
22
23
24
B C D
Initial Allocation of Net Revenue Requirement ($000) 2016 2017
Unbifurcated Priority Firm - 7(b) Loads........................................ 4,591,026$ 4,696,994$
Industrial Firm - 7(c) Loads........................................................... 51,970$ 52,661$
New Resources - 7(f) Loads.......................................................... 0.5704$ 0.5779$
Surplus Firm - SP Loads................................................................ 41,822$ 37,945$
Total.............................................................................................. 4,684,819$ 4,787,600$
Energy Billing Determinants (aMW) 2016 2017
Unbifurcated Priority Firm - 7(b) Loads........................................ 12,227 12,295
Industrial Firm - 7(c) Loads........................................................... 91 91
New Resources - 7(f) Loads.......................................................... 0.001 0.001
Average Power Rates ($/MWh) 2016 2017
Unbifurcated Priority Firm - 7(b) Loads........................................ 42.75 43.61
Industrial Firm - 7(c) Loads........................................................... 64.93 65.97
New Resources - 7(f) Loads.......................................................... 64.93 65.97
BP-16-FS-BPA-01A Page 56
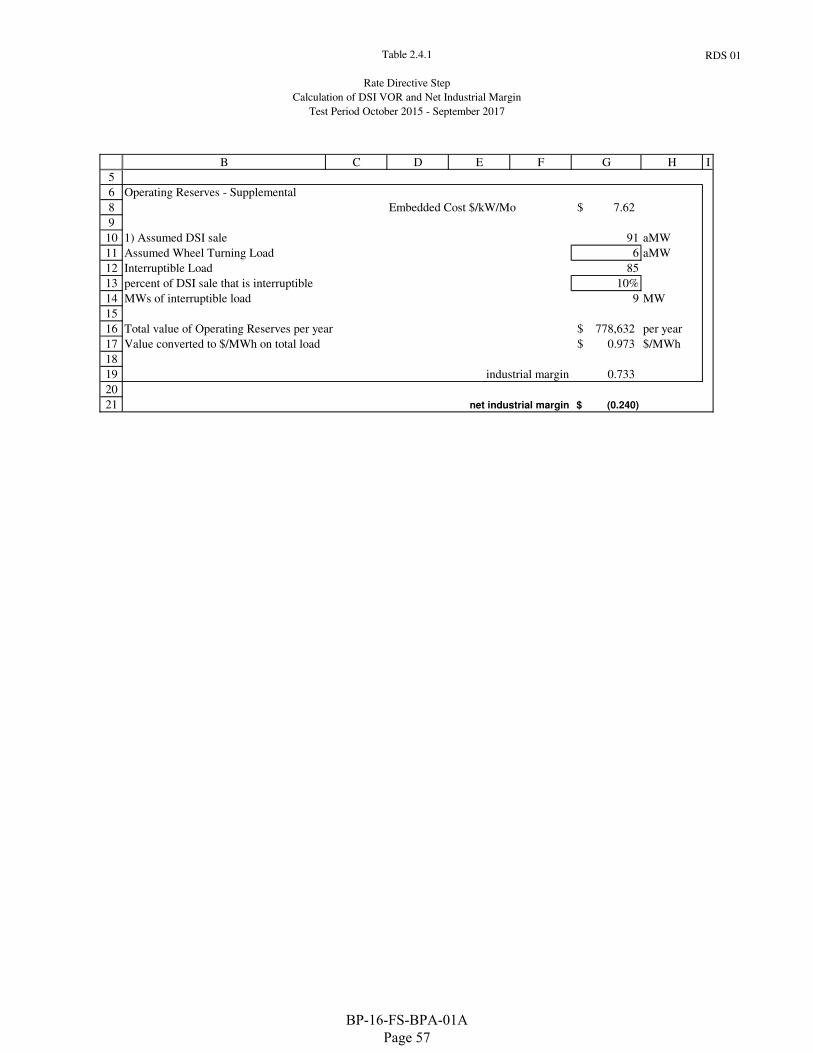
Table 2.4.1
Rate Directive Step
Calculation of DSI VOR and Net Industrial Margin
Test Period October 2015 - September 2017
RDS 01
5
6
8
9
10
11
12
13
14
15
16
17
18
19
20
21
B C D E F G H I
Operating Reserves - Supplemental
Embedded Cost $/kW/Mo 7.62$
1) Assumed DSI sale 91 aMW
Assumed Wheel Turning Load 6 aMW
Interruptible Load 85
percent of DSI sale that is interruptible 10%
MWs of interruptible load 9 MW
Total value of Operating Reserves per year 778,632$ per year
Value converted to $/MWh on total load 0.973$ $/MWh
industrial margin 0.733
net industrial margin (0.240)$
BP-16-FS-BPA-01A Page 57
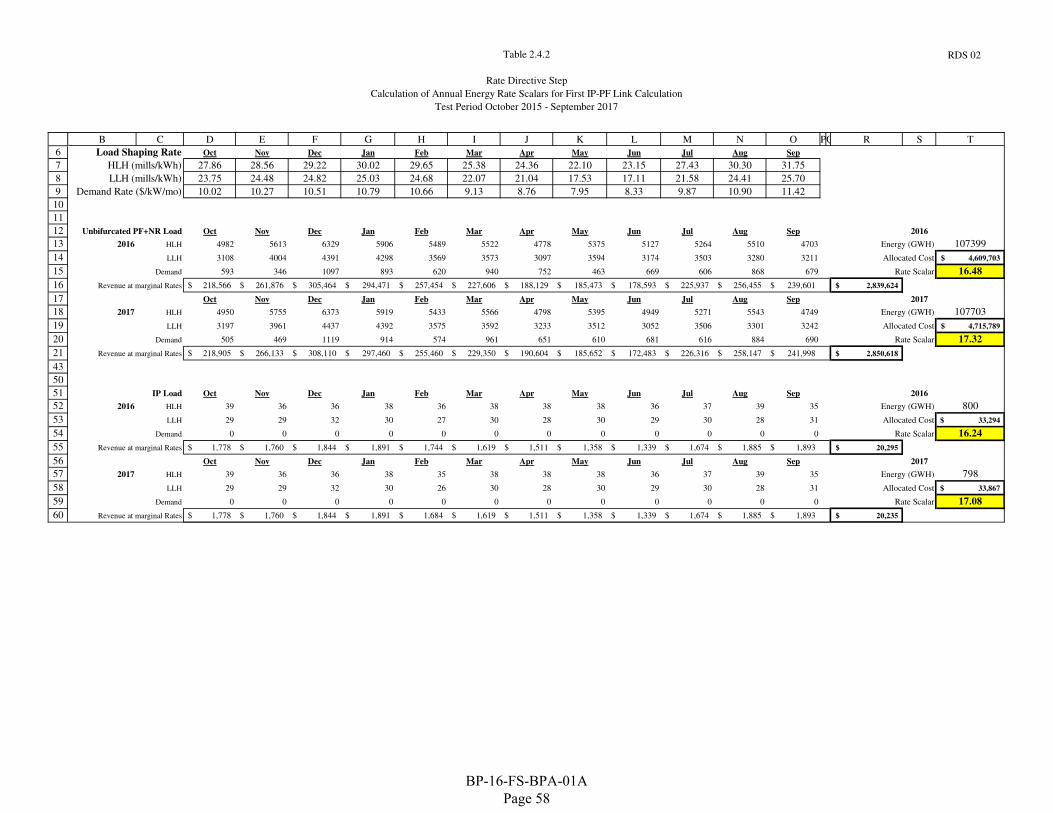
Table 2.4.2
Rate Directive Step
Calculation of Annual Energy Rate Scalars for First IP-PF Link Calculation
Test Period October 2015 - September 2017
RDS 02
6
7
8
9
10
11
12
13
14
15
16
17
18
19
20
21
43
50
51
52
53
54
55
56
57
58
59
60
B C D E F G H I J K L M N O PQ R S T
Load Shaping Rate Oct Nov Dec Jan Feb Mar Apr May Jun Jul Aug Sep
HLH (mills/kWh) 27.86 28.56 29.22 30.02 29.65 25.38 24.36 22.10 23.15 27.43 30.30 31.75
LLH (mills/kWh) 23.75 24.48 24.82 25.03 24.68 22.07 21.04 17.53 17.11 21.58 24.41 25.70
Demand Rate ($/kW/mo) 10.02 10.27 10.51 10.79 10.66 9.13 8.76 7.95 8.33 9.87 10.90 11.42
Unbifurcated PF+NR Load Oct Nov Dec Jan Feb Mar Apr May Jun Jul Aug Sep 2016
2016 HLH 4982 5613 6329 5906 5489 5522 4778 5375 5127 5264 5510 4703 Energy (GWH) 107399
LLH 3108 4004 4391 4298 3569 3573 3097 3594 3174 3503 3280 3211 Allocated Cost 4,609,703$
Demand 593 346 1097 893 620 940 752 463 669 606 868 679 Rate Scalar 16.48
Revenue at marginal Rates 218,566$ 261,876$ 305,464$ 294,471$ 257,454$ 227,606$ 188,129$ 185,473$ 178,593$ 225,937$ 256,455$ 239,601$ 2,839,624$
Oct Nov Dec Jan Feb Mar Apr May Jun Jul Aug Sep 2017
2017 HLH 4950 5755 6373 5919 5433 5566 4798 5395 4949 5271 5543 4749 Energy (GWH) 107703
LLH 3197 3961 4437 4392 3575 3592 3233 3512 3052 3506 3301 3242 Allocated Cost 4,715,789$
Demand 505 469 1119 914 574 961 651 610 681 616 884 690 Rate Scalar 17.32
Revenue at marginal Rates 218,905$ 266,133$ 308,110$ 297,460$ 255,460$ 229,350$ 190,604$ 185,652$ 172,483$ 226,316$ 258,147$ 241,998$ 2,850,618$
IP Load Oct Nov Dec Jan Feb Mar Apr May Jun Jul Aug Sep 2016
2016 HLH 39 36 36 38 36 38 38 38 36 37 39 35 Energy (GWH) 800
LLH 29 29 32 30 27 30 28 30 29 30 28 31 Allocated Cost 33,294$
Demand 0 0 0 0 0 0 0 0 0 0 0 0 Rate Scalar 16.24
Revenue at marginal Rates 1,778$ 1,760$ 1,844$ 1,891$ 1,744$ 1,619$ 1,511$ 1,358$ 1,339$ 1,674$ 1,885$ 1,893$ 20,295$
Oct Nov Dec Jan Feb Mar Apr May Jun Jul Aug Sep 2017
2017 HLH 39 36 36 38 35 38 38 38 36 37 39 35 Energy (GWH) 798
LLH 29 29 32 30 26 30 28 30 29 30 28 31 Allocated Cost 33,867$
Demand 0 0 0 0 0 0 0 0 0 0 0 0 Rate Scalar 17.08
Revenue at marginal Rates 1,778$ 1,760$ 1,844$ 1,891$ 1,684$ 1,619$ 1,511$ 1,358$ 1,339$ 1,674$ 1,885$ 1,893$ 20,235$
BP-16-FS-BPA-01A Page 58
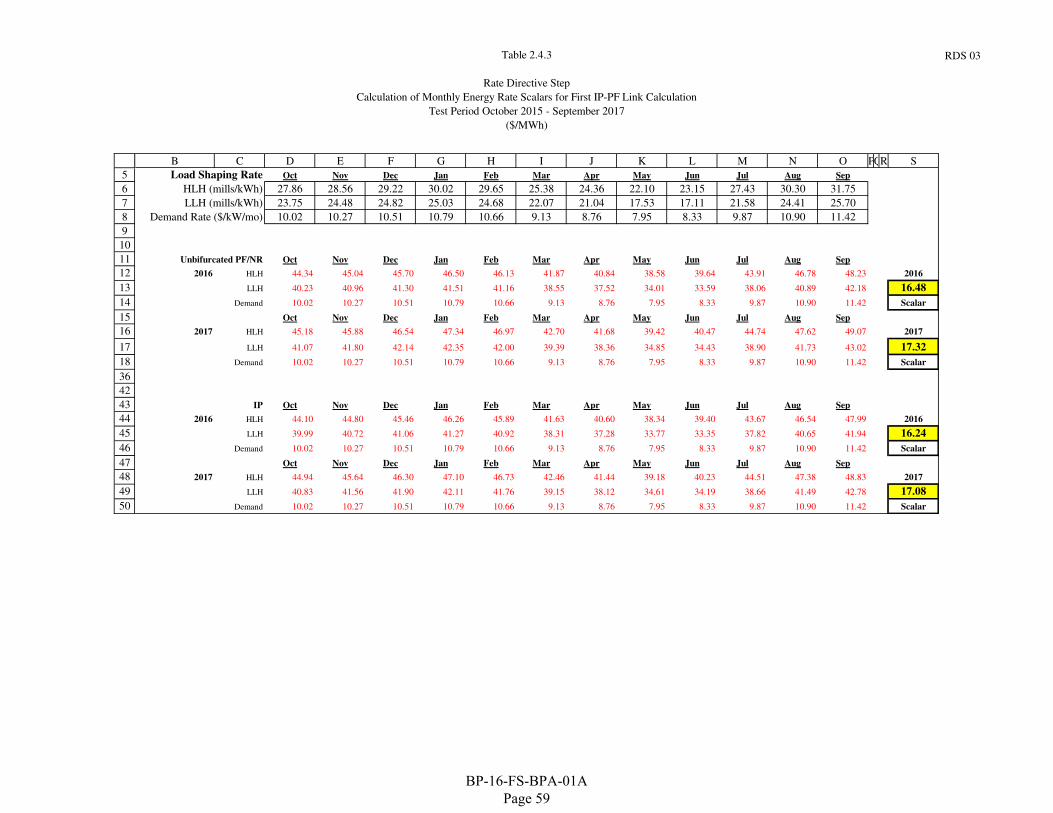
Table 2.4.3
Rate Directive Step
Calculation of Monthly Energy Rate Scalars for First IP-PF Link Calculation
Test Period October 2015 - September 2017
($/MWh)
RDS 03
5
6
7
8
9
10
11
12
13
14
15
16
17
18
36
42
43
44
45
46
47
48
49
50
B C D E F G H I J K L M N O PQR S
Load Shaping Rate Oct Nov Dec Jan Feb Mar Apr May Jun Jul Aug Sep
HLH (mills/kWh) 27.86 28.56 29.22 30.02 29.65 25.38 24.36 22.10 23.15 27.43 30.30 31.75
LLH (mills/kWh) 23.75 24.48 24.82 25.03 24.68 22.07 21.04 17.53 17.11 21.58 24.41 25.70
Demand Rate ($/kW/mo) 10.02 10.27 10.51 10.79 10.66 9.13 8.76 7.95 8.33 9.87 10.90 11.42
Unbifurcated PF/NR Oct Nov Dec Jan Feb Mar Apr May Jun Jul Aug Sep
2016 HLH 44.34 45.04 45.70 46.50 46.13 41.87 40.84 38.58 39.64 43.91 46.78 48.23 2016
LLH 40.23 40.96 41.30 41.51 41.16 38.55 37.52 34.01 33.59 38.06 40.89 42.18 16.48
Demand 10.02 10.27 10.51 10.79 10.66 9.13 8.76 7.95 8.33 9.87 10.90 11.42 Scalar
Oct Nov Dec Jan Feb Mar Apr May Jun Jul Aug Sep
2017 HLH 45.18 45.88 46.54 47.34 46.97 42.70 41.68 39.42 40.47 44.74 47.62 49.07 2017
LLH 41.07 41.80 42.14 42.35 42.00 39.39 38.36 34.85 34.43 38.90 41.73 43.02 17.32
Demand 10.02 10.27 10.51 10.79 10.66 9.13 8.76 7.95 8.33 9.87 10.90 11.42 Scalar
IP Oct Nov Dec Jan Feb Mar Apr May Jun Jul Aug Sep
2016 HLH 44.10 44.80 45.46 46.26 45.89 41.63 40.60 38.34 39.40 43.67 46.54 47.99 2016
LLH 39.99 40.72 41.06 41.27 40.92 38.31 37.28 33.77 33.35 37.82 40.65 41.94 16.24
Demand 10.02 10.27 10.51 10.79 10.66 9.13 8.76 7.95 8.33 9.87 10.90 11.42 Scalar
Oct Nov Dec Jan Feb Mar Apr May Jun Jul Aug Sep
2017 HLH 44.94 45.64 46.30 47.10 46.73 42.46 41.44 39.18 40.23 44.51 47.38 48.83 2017
LLH 40.83 41.56 41.90 42.11 41.76 39.15 38.12 34.61 34.19 38.66 41.49 42.78 17.08
Demand 10.02 10.27 10.51 10.79 10.66 9.13 8.76 7.95 8.33 9.87 10.90 11.42 Scalar
BP-16-FS-BPA-01A Page 59
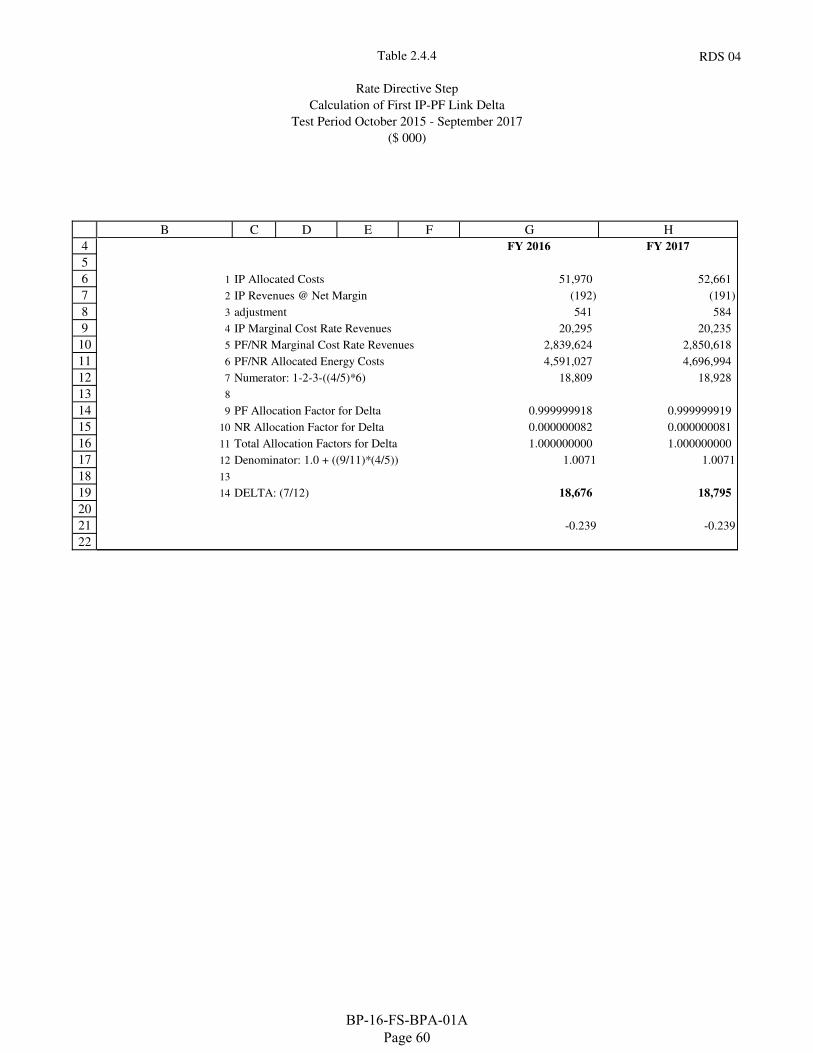
Table 2.4.4
Rate Directive Step
Calculation of First IP-PF Link Delta
Test Period October 2015 - September 2017
($ 000)
RDS 04
4
5
6
7
8
9
10
11
12
13
14
15
16
17
18
19
20
21
22
B C D E F G H
FY 2016 FY 2017
1 IP Allocated Costs 51,970 52,661
2 IP Revenues @ Net Margin (192) (191)
3 adjustment 541 584
4 IP Marginal Cost Rate Revenues 20,295 20,235
5 PF/NR Marginal Cost Rate Revenues 2,839,624 2,850,618
6 PF/NR Allocated Energy Costs 4,591,027 4,696,994
7 Numerator: 1-2-3-((4/5)*6) 18,809 18,928
8
9 PF Allocation Factor for Delta 0.999999918 0.999999919
10 NR Allocation Factor for Delta 0.000000082 0.000000081
11 Total Allocation Factors for Delta 1.000000000 1.000000000
12 Denominator: 1.0 + ((9/11)*(4/5)) 1.0071 1.0071
13
14 DELTA: (7/12) 18,676 18,795
-0.239 -0.239
BP-16-FS-BPA-01A Page 60
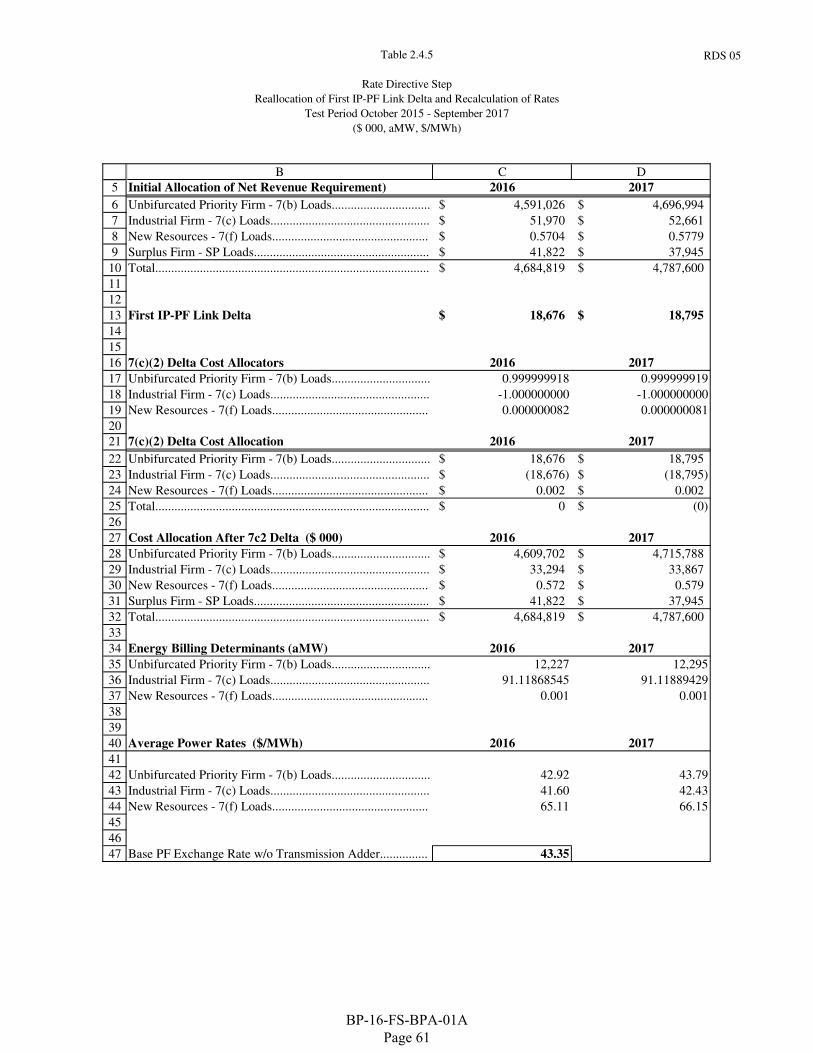
Table 2.4.5
Rate Directive Step
Reallocation of First IP-PF Link Delta and Recalculation of Rates
Test Period October 2015 - September 2017
($ 000, aMW, $/MWh)
RDS 05
5
6
7
8
9
10
11
12
13
14
15
16
17
18
19
20
21
22
23
24
25
26
27
28
29
30
31
32
33
34
35
36
37
38
39
40
41
42
43
44
45
46
47
B C D
Initial Allocation of Net Revenue Requirement) 2016 2017
Unbifurcated Priority Firm - 7(b) Loads............................... 4,591,026$ 4,696,994$
Industrial Firm - 7(c) Loads.................................................. 51,970$ 52,661$
New Resources - 7(f) Loads................................................. 0.5704$ 0.5779$
Surplus Firm - SP Loads....................................................... 41,822$ 37,945$
Total...................................................................................... 4,684,819$ 4,787,600$
First IP-PF Link Delta 18,676$ 18,795$
7(c)(2) Delta Cost Allocators 2016 2017
Unbifurcated Priority Firm - 7(b) Loads............................... 0.999999918 0.999999919
Industrial Firm - 7(c) Loads.................................................. -1.000000000 -1.000000000
New Resources - 7(f) Loads................................................. 0.000000082 0.000000081
7(c)(2) Delta Cost Allocation 2016 2017
Unbifurcated Priority Firm - 7(b) Loads............................... 18,676$ 18,795$
Industrial Firm - 7(c) Loads.................................................. (18,676)$ (18,795)$
New Resources - 7(f) Loads................................................. 0.002$ 0.002$
Total...................................................................................... 0$ (0)$
Cost Allocation After 7c2 Delta ($ 000) 2016 2017
Unbifurcated Priority Firm - 7(b) Loads............................... 4,609,702$ 4,715,788$
Industrial Firm - 7(c) Loads.................................................. 33,294$ 33,867$
New Resources - 7(f) Loads................................................. 0.572$ 0.579$
Surplus Firm - SP Loads....................................................... 41,822$ 37,945$
Total...................................................................................... 4,684,819$ 4,787,600$
Energy Billing Determinants (aMW) 2016 2017
Unbifurcated Priority Firm - 7(b) Loads............................... 12,227 12,295
Industrial Firm - 7(c) Loads.................................................. 91.11868545 91.11889429
New Resources - 7(f) Loads................................................. 0.001 0.001
Average Power Rates ($/MWh) 2016 2017
Unbifurcated Priority Firm - 7(b) Loads............................... 42.92 43.79
Industrial Firm - 7(c) Loads.................................................. 41.60 42.43
New Resources - 7(f) Loads................................................. 65.11 66.15
Base PF Exchange Rate w/o Transmission Adder............... 43.35
BP-16-FS-BPA-01A Page 61
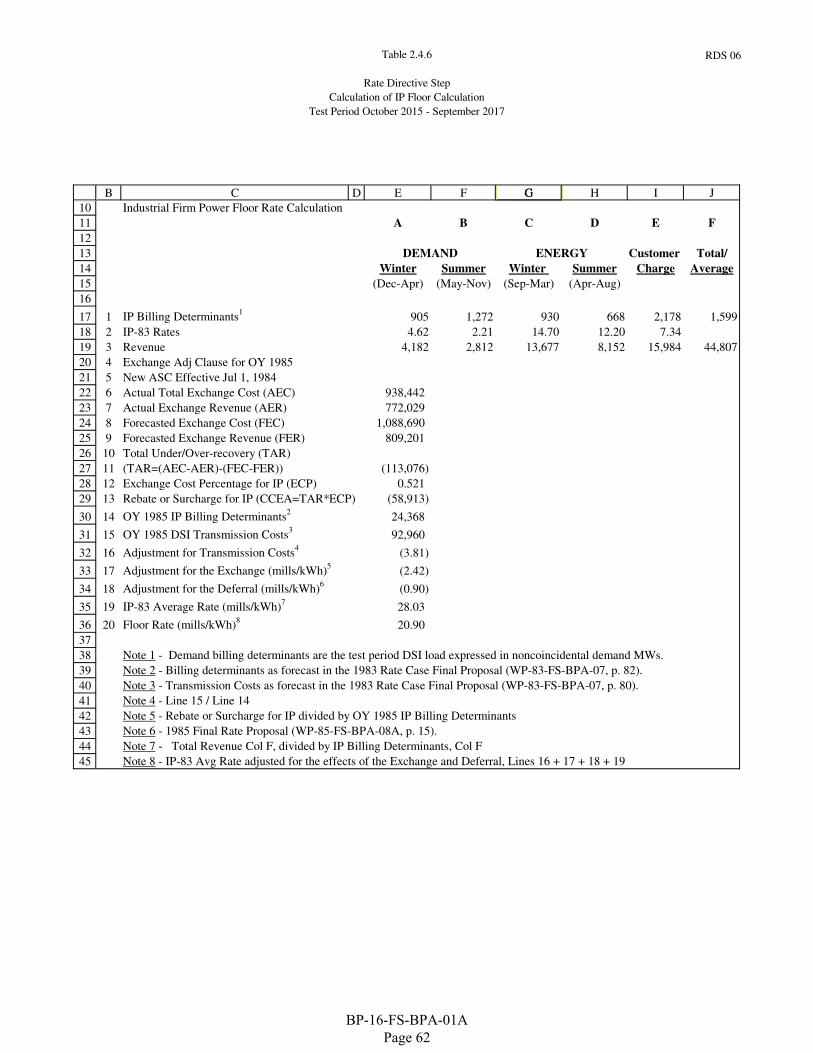
Table 2.4.6
Rate Directive Step
Calculation of IP Floor Calculation
Test Period October 2015 - September 2017
RDS 06
10
11
12
13
14
15
16
17
18
19
20
21
22
23
24
25
26
27
28
29
30
31
32
33
34
35
36
37
38
39
40
41
42
43
44
45
B C D E F G H I JG
A B C D E F
DEMAND ENERGY Customer Total/
Winter Summer Winter Summer Charge Average
(Dec-Apr) (May-Nov) (Sep-Mar) (Apr-Aug)
1 IP Billing Determinants1
905 1,272 930 668 2,178 1,599
2 IP-83 Rates 4.62 2.21 14.70 12.20 7.34
3 Revenue 4,182 2,812 13,677 8,152 15,984 44,807
4 Exchange Adj Clause for OY 1985
5 New ASC Effective Jul 1, 1984
6 Actual Total Exchange Cost (AEC) 938,442
7 Actual Exchange Revenue (AER) 772,029
8 Forecasted Exchange Cost (FEC) 1,088,690
9 Forecasted Exchange Revenue (FER) 809,201
10 Total Under/Over-recovery (TAR)
11 (TAR=(AEC-AER)-(FEC-FER)) (113,076)
12 Exchange Cost Percentage for IP (ECP) 0.521
13 Rebate or Surcharge for IP (CCEA=TAR*ECP) (58,913)
14 OY 1985 IP Billing Determinants2
24,368
15 OY 1985 DSI Transmission Costs3
92,960
16 Adjustment for Transmission Costs4
(3.81)
17 Adjustment for the Exchange (mills/kWh)5
(2.42)
18 Adjustment for the Deferral (mills/kWh)6
(0.90)
19 IP-83 Average Rate (mills/kWh)7
28.03
20 Floor Rate (mills/kWh)8
20.90
Note 1 - Demand billing determinants are the test period DSI load expressed in noncoincidental demand MWs.
Note 2 - Billing determinants as forecast in the 1983 Rate Case Final Proposal (WP-83-FS-BPA-07, p. 82).
Note 3 - Transmission Costs as forecast in the 1983 Rate Case Final Proposal (WP-83-FS-BPA-07, p. 80).
Note 4 - Line 15 / Line 14
Note 5 - Rebate or Surcharge for IP divided by OY 1985 IP Billing Determinants
Note 6 - 1985 Final Rate Proposal (WP-85-FS-BPA-08A, p. 15).
Note 7 - Total Revenue Col F, divided by IP Billing Determinants, Col F
Note 8 - IP-83 Avg Rate adjusted for the effects of the Exchange and Deferral, Lines 16 + 17 + 18 + 19
Industrial Firm Power Floor Rate Calculation
BP-16-FS-BPA-01A Page 62
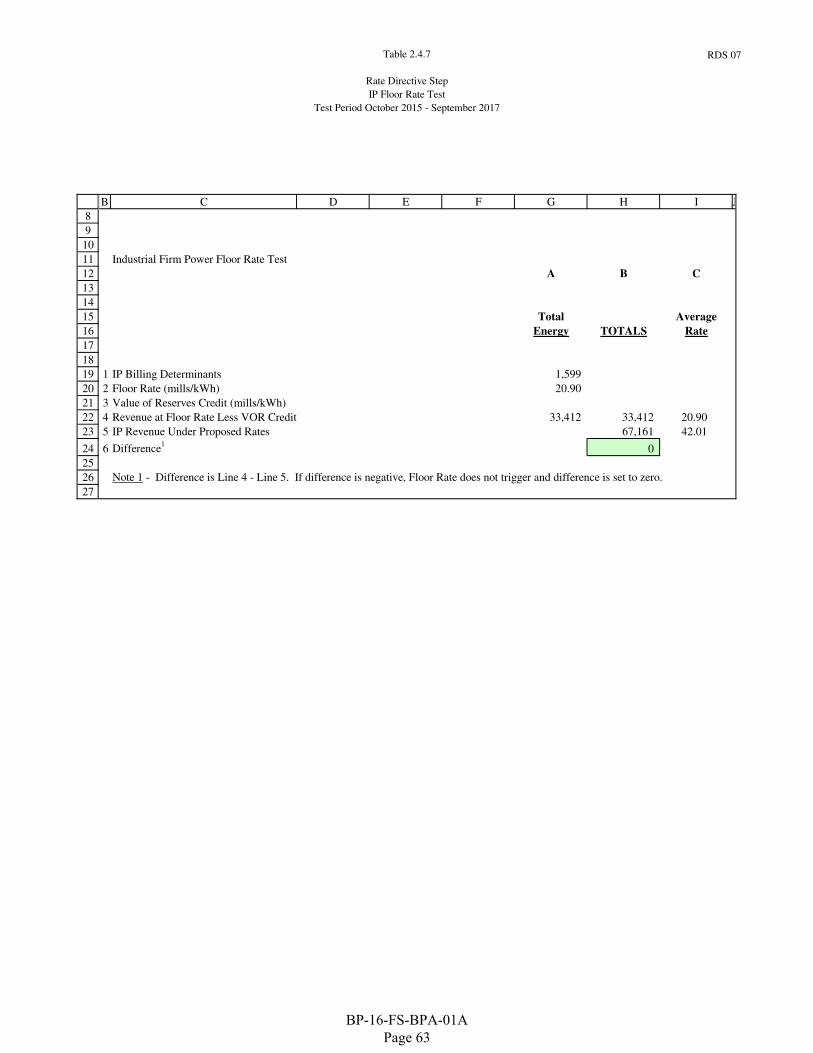
Table 2.4.7
Rate Directive Step
IP Floor Rate Test
Test Period October 2015 - September 2017
RDS 07
8
9
10
11
12
13
14
15
16
17
18
19
20
21
22
23
24
25
26
27
B C D E F G H I J
A B C
Total Average
Energy TOTALS Rate
1 IP Billing Determinants 1,599
2 Floor Rate (mills/kWh) 20.90
3 Value of Reserves Credit (mills/kWh)
4 Revenue at Floor Rate Less VOR Credit 33,412 33,412 20.90
5 IP Revenue Under Proposed Rates 67,161 42.01
6 Difference1
0
Note 1 - Difference is Line 4 - Line 5. If difference is negative, Floor Rate does not trigger and difference is set to zero.
Industrial Firm Power Floor Rate Test
BP-16-FS-BPA-01A Page 63
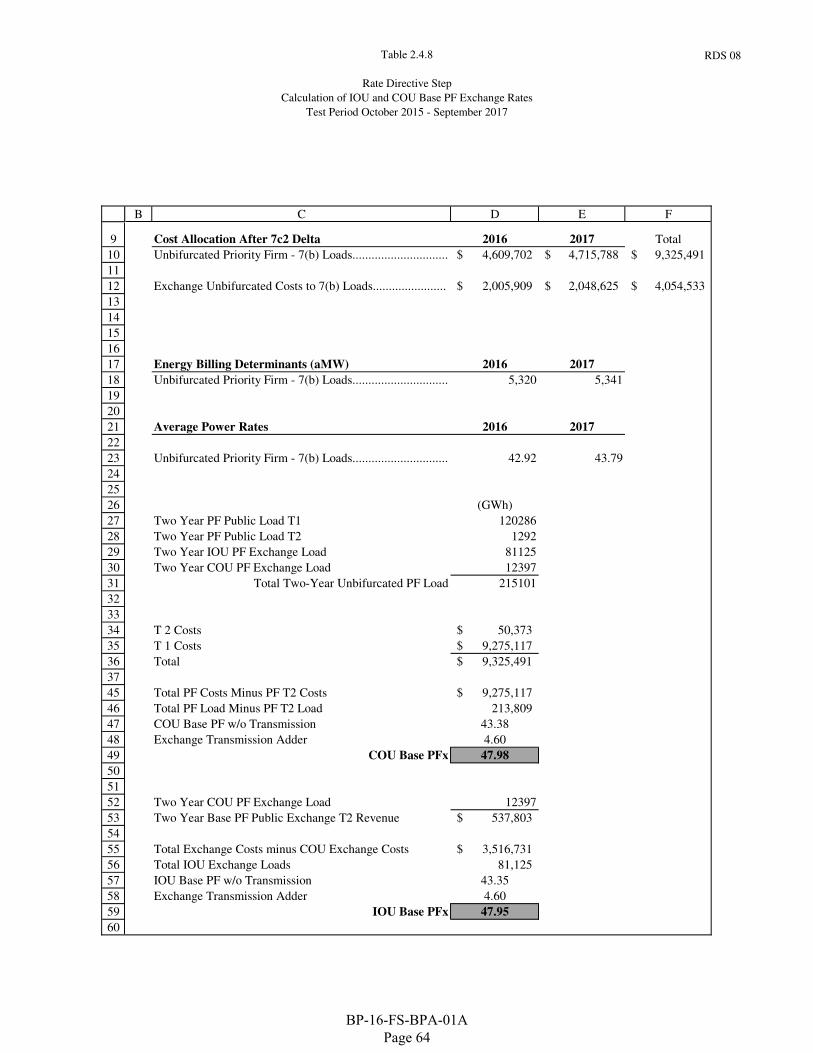
Table 2.4.8
Rate Directive Step
Calculation of IOU and COU Base PF Exchange Rates
Test Period October 2015 - September 2017
RDS 08
9
10
11
12
13
14
15
16
17
18
19
20
21
22
23
24
25
26
27
28
29
30
31
32
33
34
35
36
37
45
46
47
48
49
50
51
52
53
54
55
56
57
58
59
60
B C D E F
Cost Allocation After 7c2 Delta 2016 2017 Total
Unbifurcated Priority Firm - 7(b) Loads.............................. 4,609,702$ 4,715,788$ 9,325,491$
Exchange Unbifurcated Costs to 7(b) Loads....................... 2,005,909$ 2,048,625$ 4,054,533$
Energy Billing Determinants (aMW) 2016 2017
Unbifurcated Priority Firm - 7(b) Loads.............................. 5,320 5,341
Average Power Rates 2016 2017
Unbifurcated Priority Firm - 7(b) Loads.............................. 42.92 43.79
(GWh)
Two Year PF Public Load T1 120286
Two Year PF Public Load T2 1292
Two Year IOU PF Exchange Load 81125
Two Year COU PF Exchange Load 12397
Total Two-Year Unbifurcated PF Load 215101
T 2 Costs 50,373$
T 1 Costs 9,275,117$
Total 9,325,491$
Total PF Costs Minus PF T2 Costs 9,275,117$
Total PF Load Minus PF T2 Load 213,809
COU Base PF w/o Transmission 43.38
Exchange Transmission Adder 4.60
COU Base PFx 47.98
Two Year COU PF Exchange Load 12397
Two Year Base PF Public Exchange T2 Revenue 537,803$
Total Exchange Costs minus COU Exchange Costs 3,516,731$
Total IOU Exchange Loads 81,125
IOU Base PF w/o Transmission 43.35
Exchange Transmission Adder 4.60
IOU Base PFx 47.95
BP-16-FS-BPA-01A Page 64
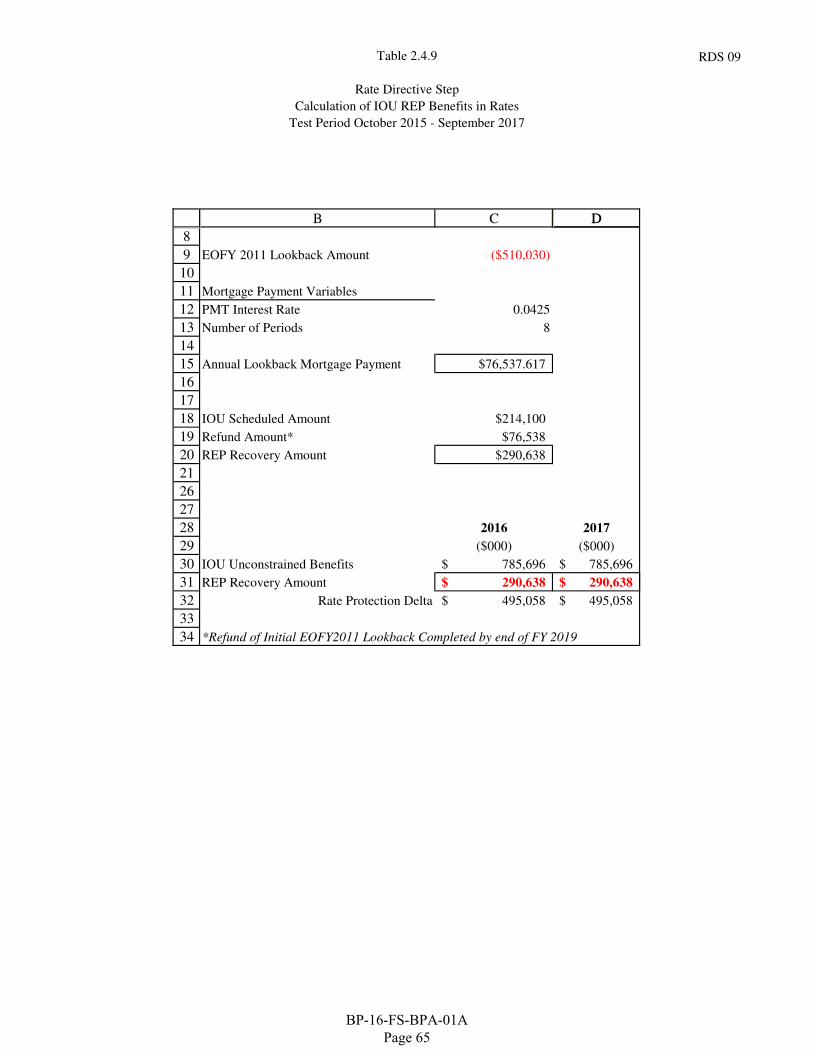
Table 2.4.9
Rate Directive Step
Calculation of IOU REP Benefits in Rates
Test Period October 2015 - September 2017
RDS 09
8
9
10
11
12
13
14
15
16
17
18
19
20
21
26
27
28
29
30
31
32
33
34
B C DD
EOFY 2011 Lookback Amount ($510,030)
Mortgage Payment Variables
PMT Interest Rate 0.0425
Number of Periods 8
Annual Lookback Mortgage Payment $76,537.617
IOU Scheduled Amount $214,100
Refund Amount* $76,538
REP Recovery Amount $290,638
2016 2017
($000) ($000)
IOU Unconstrained Benefits 785,696$ 785,696$
REP Recovery Amount 290,638$ 290,638$
Rate Protection Delta 495,058$ 495,058$
*Refund of Initial EOFY2011 Lookback Completed by end of FY 2019
BP-16-FS-BPA-01A Page 65
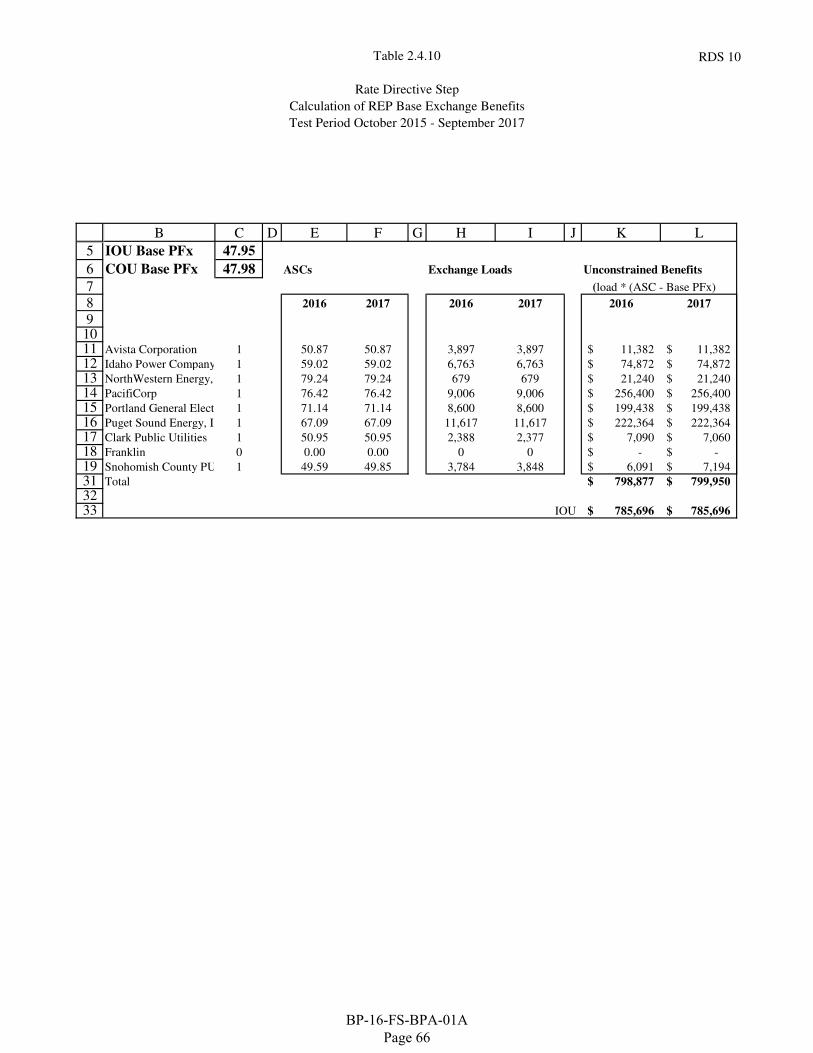
Table 2.4.10
Rate Directive Step
Calculation of REP Base Exchange Benefits
Test Period October 2015 - September 2017
RDS 10
5
6
7
8
910111213141516171819313233
B C D E F G H I J K L
IOU Base PFx 47.95
COU Base PFx 47.98 ASCs Exchange Loads Unconstrained Benefits
(load * (ASC - Base PFx)
2016 2017 2016 2017 2016 2017
Avista Corporation 1 50.87 50.87 3,897 3,897 11,382$ 11,382$
Idaho Power Company 1 59.02 59.02 6,763 6,763 74,872$ 74,872$
NorthWestern Energy, LLC1 79.24 79.24 679 679 21,240$ 21,240$
PacifiCorp 1 76.42 76.42 9,006 9,006 256,400$ 256,400$
Portland General Electric Company1 71.14 71.14 8,600 8,600 199,438$ 199,438$
Puget Sound Energy, Inc. 1 67.09 67.09 11,617 11,617 222,364$ 222,364$
Clark Public Utilities 1 50.95 50.95 2,388 2,377 7,090$ 7,060$
Franklin 0 0.00 0.00 0 0 -$ -$
Snohomish County PUD No 11 49.59 49.85 3,784 3,848 6,091$ 7,194$
Total 798,877$ 799,950$
IOU 785,696$ 785,696$
BP-16-FS-BPA-01A Page 66
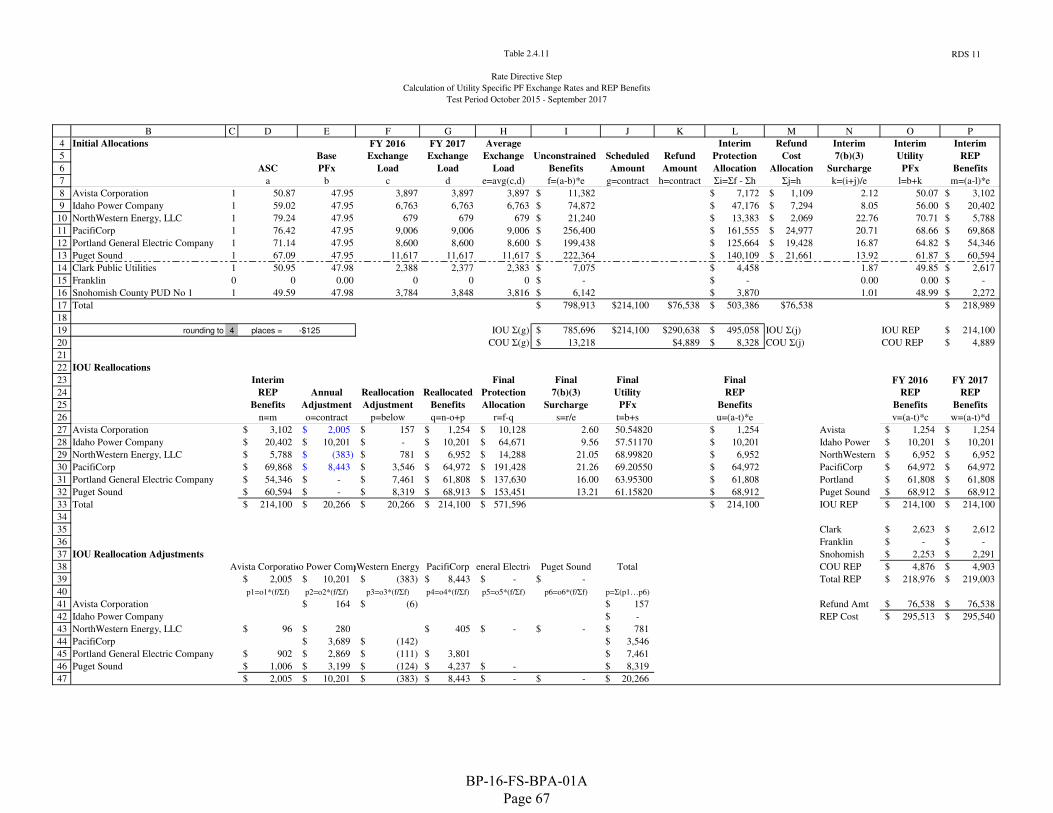
Table 2.4.11
Rate Directive Step
Calculation of Utility Specific PF Exchange Rates and REP Benefits
Test Period October 2015 - September 2017
RDS 11
4
5
6
7
8
9
10
11
12
13
14
15
16
17
18
19
20
21
22
23
24
25
26
27
28
29
30
31
32
33
34
35
36
37
38
39
40
41
42
43
44
45
46
47
B C D E F G H I J K L M N O P
Initial Allocations FY 2016 FY 2017 Average Interim Refund Interim Interim Interim
Base Exchange Exchange Exchange Unconstrained Scheduled Refund Protection Cost 7(b)(3) Utility REP
ASC PFx Load Load Load Benefits Amount Amount Allocation Allocation Surcharge PFx Benefits
a b c d e=avg(c,d) f=(a-b)*e g=contract h=contract Σi=Σf - Σh Σj=h k=(i+j)/e l=b+k m=(a-l)*e
Avista Corporation 1 50.87 47.95 3,897 3,897 3,897 11,382$ 7,172$ 1,109$ 2.12 50.07 3,102$
Idaho Power Company 1 59.02 47.95 6,763 6,763 6,763 74,872$ 47,176$ 7,294$ 8.05 56.00 20,402$
NorthWestern Energy, LLC 1 79.24 47.95 679 679 679 21,240$ 13,383$ 2,069$ 22.76 70.71 5,788$
PacifiCorp 1 76.42 47.95 9,006 9,006 9,006 256,400$ 161,555$ 24,977$ 20.71 68.66 69,868$
Portland General Electric Company 1 71.14 47.95 8,600 8,600 8,600 199,438$ 125,664$ 19,428$ 16.87 64.82 54,346$
Puget Sound 1 67.09 47.95 11,617 11,617 11,617 222,364$ 140,109$ 21,661$ 13.92 61.87 60,594$
Clark Public Utilities 1 50.95 47.98 2,388 2,377 2,383 7,075$ 4,458$ 1.87 49.85 2,617$
Franklin 0 0 0.00 0 0 0 -$ -$ 0.00 0.00 -$
Snohomish County PUD No 1 1 49.59 47.98 3,784 3,848 3,816 6,142$ 3,870$ 1.01 48.99 2,272$
Total 798,913$ $214,100 $76,538 503,386$ $76,538 218,989$
rounding to 4 places = -$125 IOU Σ(g) 785,696$ $214,100 $290,638 495,058$ IOU Σ(j) IOU REP 214,100$
COU Σ(g) 13,218$ $4,889 8,328$ COU Σ(j) COU REP 4,889$
IOU Reallocations
Interim Final Final Final Final FY 2016 FY 2017
REP Annual Reallocation Reallocated Protection 7(b)(3) Utility REP REP REP
Benefits Adjustment Adjustment Benefits Allocation Surcharge PFx Benefits Benefits Benefits
n=m o=contract p=below q=n-o+p r=f-q s=r/e t=b+s u=(a-t)*e v=(a-t)*c w=(a-t)*d
Avista Corporation 3,102$ 2,005$ 157$ 1,254$ 10,128$ 2.60 50.54820 1,254$ Avista 1,254$ 1,254$
Idaho Power Company 20,402$ 10,201$ -$ 10,201$ 64,671$ 9.56 57.51170 10,201$ Idaho Power 10,201$ 10,201$
NorthWestern Energy, LLC 5,788$ (383)$ 781$ 6,952$ 14,288$ 21.05 68.99820 6,952$ NorthWestern 6,952$ 6,952$
PacifiCorp 69,868$ 8,443$ 3,546$ 64,972$ 191,428$ 21.26 69.20550 64,972$ PacifiCorp 64,972$ 64,972$
Portland General Electric Company 54,346$ -$ 7,461$ 61,808$ 137,630$ 16.00 63.95300 61,808$ Portland 61,808$ 61,808$
Puget Sound 60,594$ -$ 8,319$ 68,913$ 153,451$ 13.21 61.15820 68,912$ Puget Sound 68,912$ 68,912$
Total 214,100$ 20,266$ 20,266$ 214,100$ 571,596$ 214,100$ IOU REP 214,100$ 214,100$
Clark 2,623$ 2,612$
Franklin -$ -$
IOU Reallocation Adjustments Snohomish 2,253$ 2,291$
Avista CorporationIdaho Power CompanyNorthWestern Energy, LLCPacifiCorpPortland General Electric CompanyPuget Sound Total COU REP 4,876$ 4,903$
2,005$ 10,201$ (383)$ 8,443$ -$ -$ Total REP 218,976$ 219,003$
p1=o1*(f/Σf) p2=o2*(f/Σf) p3=o3*(f/Σf) p4=o4*(f/Σf) p5=o5*(f/Σf) p6=o6*(f/Σf) p=Σ(p1…p6)
Avista Corporation 164$ (6)$ 157$ Refund Amt 76,538$ 76,538$
Idaho Power Company -$ REP Cost 295,513$ 295,540$
NorthWestern Energy, LLC 96$ 280$ 405$ -$ -$ 781$
PacifiCorp 3,689$ (142)$ 3,546$
Portland General Electric Company 902$ 2,869$ (111)$ 3,801$ 7,461$
Puget Sound 1,006$ 3,199$ (124)$ 4,237$ -$ 8,319$
2,005$ 10,201$ (383)$ 8,443$ -$ -$ 20,266$
BP-16-FS-BPA-01A Page 67
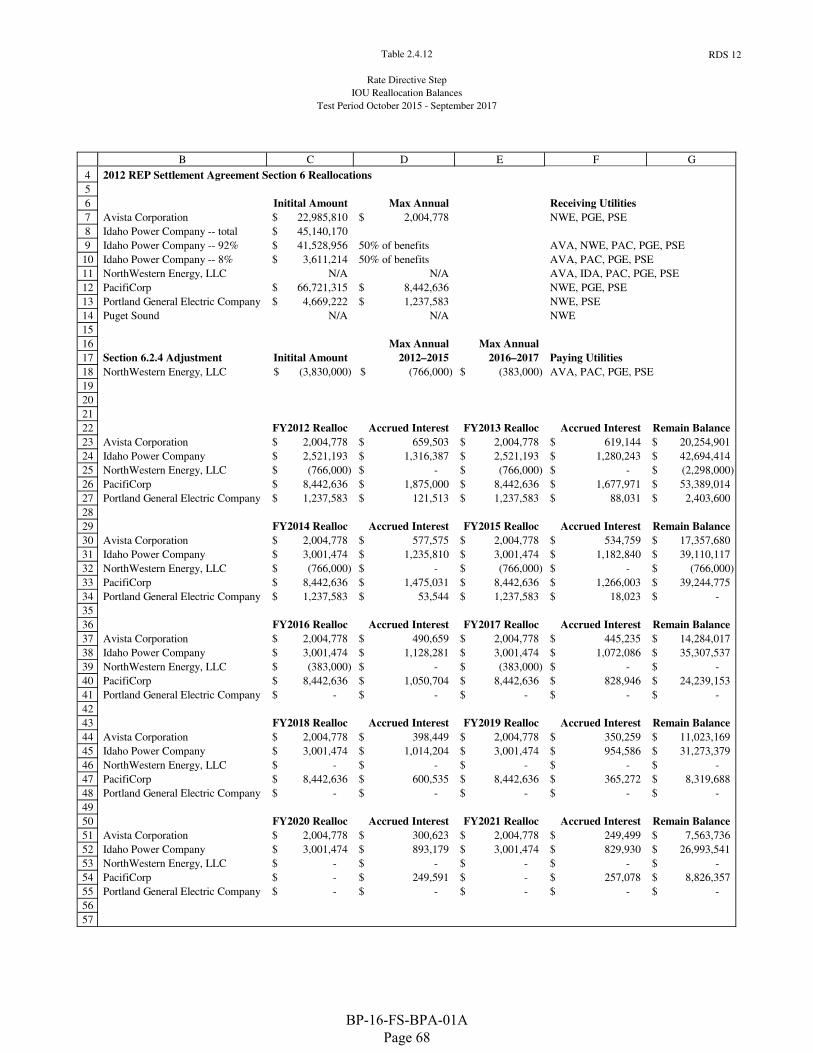
Table 2.4.12
Rate Directive Step
IOU Reallocation Balances
Test Period October 2015 - September 2017
RDS 12
4
5
6
7
8
9
10
11
12
13
14
15
16
17
18
19
20
21
22
23
24
25
26
27
28
29
30
31
32
33
34
35
36
37
38
39
40
41
42
43
44
45
46
47
48
49
50
51
52
53
54
55
56
57
B C D E F G
2012 REP Settlement Agreement Section 6 Reallocations
Initital Amount Max Annual Receiving Utilities
Avista Corporation 22,985,810$ 2,004,778$ NWE, PGE, PSE
Idaho Power Company -- total 45,140,170$
Idaho Power Company -- 92% 41,528,956$ 50% of benefits AVA, NWE, PAC, PGE, PSE
Idaho Power Company -- 8% 3,611,214$ 50% of benefits AVA, PAC, PGE, PSE
NorthWestern Energy, LLC N/A N/A AVA, IDA, PAC, PGE, PSE
PacifiCorp 66,721,315$ 8,442,636$ NWE, PGE, PSE
Portland General Electric Company 4,669,222$ 1,237,583$ NWE, PSE
Puget Sound N/A N/A NWE
Max Annual Max Annual
Section 6.2.4 Adjustment Initital Amount 2012–2015 2016–2017 Paying Utilities
NorthWestern Energy, LLC (3,830,000)$ (766,000)$ (383,000)$ AVA, PAC, PGE, PSE
FY2012 Realloc Accrued Interest FY2013 Realloc Accrued Interest Remain Balance
Avista Corporation 2,004,778$ 659,503$ 2,004,778$ 619,144$ 20,254,901$
Idaho Power Company 2,521,193$ 1,316,387$ 2,521,193$ 1,280,243$ 42,694,414$
NorthWestern Energy, LLC (766,000)$ -$ (766,000)$ -$ (2,298,000)$
PacifiCorp 8,442,636$ 1,875,000$ 8,442,636$ 1,677,971$ 53,389,014$
Portland General Electric Company 1,237,583$ 121,513$ 1,237,583$ 88,031$ 2,403,600$
FY2014 Realloc Accrued Interest FY2015 Realloc Accrued Interest Remain Balance
Avista Corporation 2,004,778$ 577,575$ 2,004,778$ 534,759$ 17,357,680$
Idaho Power Company 3,001,474$ 1,235,810$ 3,001,474$ 1,182,840$ 39,110,117$
NorthWestern Energy, LLC (766,000)$ -$ (766,000)$ -$ (766,000)$
PacifiCorp 8,442,636$ 1,475,031$ 8,442,636$ 1,266,003$ 39,244,775$
Portland General Electric Company 1,237,583$ 53,544$ 1,237,583$ 18,023$ -$
FY2016 Realloc Accrued Interest FY2017 Realloc Accrued Interest Remain Balance
Avista Corporation 2,004,778$ 490,659$ 2,004,778$ 445,235$ 14,284,017$
Idaho Power Company 3,001,474$ 1,128,281$ 3,001,474$ 1,072,086$ 35,307,537$
NorthWestern Energy, LLC (383,000)$ -$ (383,000)$ -$ -$
PacifiCorp 8,442,636$ 1,050,704$ 8,442,636$ 828,946$ 24,239,153$
Portland General Electric Company -$ -$ -$ -$ -$
FY2018 Realloc Accrued Interest FY2019 Realloc Accrued Interest Remain Balance
Avista Corporation 2,004,778$ 398,449$ 2,004,778$ 350,259$ 11,023,169$
Idaho Power Company 3,001,474$ 1,014,204$ 3,001,474$ 954,586$ 31,273,379$
NorthWestern Energy, LLC -$ -$ -$ -$ -$
PacifiCorp 8,442,636$ 600,535$ 8,442,636$ 365,272$ 8,319,688$
Portland General Electric Company -$ -$ -$ -$ -$
FY2020 Realloc Accrued Interest FY2021 Realloc Accrued Interest Remain Balance
Avista Corporation 2,004,778$ 300,623$ 2,004,778$ 249,499$ 7,563,736$
Idaho Power Company 3,001,474$ 893,179$ 3,001,474$ 829,930$ 26,993,541$
NorthWestern Energy, LLC -$ -$ -$ -$ -$
PacifiCorp -$ 249,591$ -$ 257,078$ 8,826,357$
Portland General Electric Company -$ -$ -$ -$ -$
BP-16-FS-BPA-01A Page 68
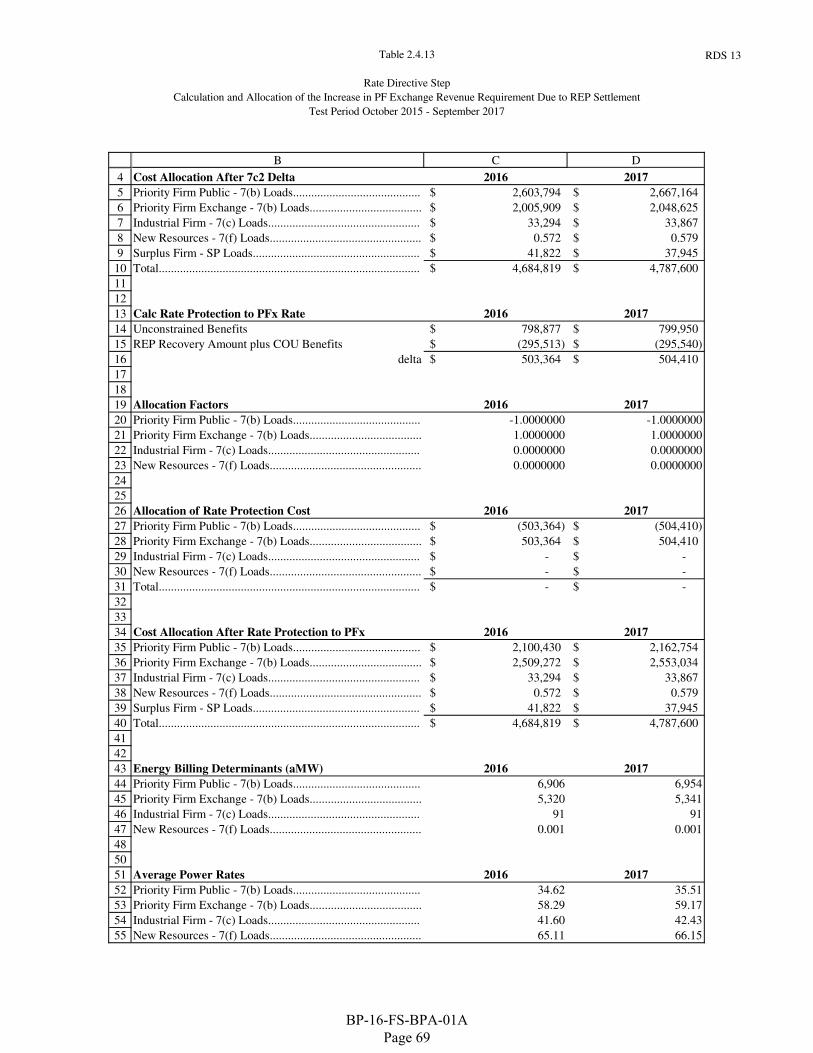
Table 2.4.13
Rate Directive Step
Calculation and Allocation of the Increase in PF Exchange Revenue Requirement Due to REP Settlement
Test Period October 2015 - September 2017
RDS 13
4
5
6
7
8
9
10
11
12
13
14
15
16
17
18
19
20
21
22
23
24
25
26
27
28
29
30
31
32
33
34
35
36
37
38
39
40
41
42
43
44
45
46
47
48
50
51
52
53
54
55
B C D
Cost Allocation After 7c2 Delta 2016 2017
Priority Firm Public - 7(b) Loads.......................................... 2,603,794$ 2,667,164$
Priority Firm Exchange - 7(b) Loads..................................... 2,005,909$ 2,048,625$
Industrial Firm - 7(c) Loads.................................................. 33,294$ 33,867$
New Resources - 7(f) Loads.................................................. 0.572$ 0.579$
Surplus Firm - SP Loads....................................................... 41,822$ 37,945$
Total...................................................................................... 4,684,819$ 4,787,600$
Calc Rate Protection to PFx Rate 2016 2017
Unconstrained Benefits 798,877$ 799,950$
REP Recovery Amount plus COU Benefits (295,513)$ (295,540)$
delta 503,364$ 504,410$
Allocation Factors 2016 2017
Priority Firm Public - 7(b) Loads.......................................... -1.0000000 -1.0000000
Priority Firm Exchange - 7(b) Loads..................................... 1.0000000 1.0000000
Industrial Firm - 7(c) Loads.................................................. 0.0000000 0.0000000
New Resources - 7(f) Loads.................................................. 0.0000000 0.0000000
Allocation of Rate Protection Cost 2016 2017
Priority Firm Public - 7(b) Loads.......................................... (503,364)$ (504,410)$
Priority Firm Exchange - 7(b) Loads..................................... 503,364$ 504,410$
Industrial Firm - 7(c) Loads.................................................. -$ -$
New Resources - 7(f) Loads.................................................. -$ -$
Total...................................................................................... -$ -$
Cost Allocation After Rate Protection to PFx 2016 2017
Priority Firm Public - 7(b) Loads.......................................... 2,100,430$ 2,162,754$
Priority Firm Exchange - 7(b) Loads..................................... 2,509,272$ 2,553,034$
Industrial Firm - 7(c) Loads.................................................. 33,294$ 33,867$
New Resources - 7(f) Loads.................................................. 0.572$ 0.579$
Surplus Firm - SP Loads....................................................... 41,822$ 37,945$
Total...................................................................................... 4,684,819$ 4,787,600$
Energy Billing Determinants (aMW) 2016 2017
Priority Firm Public - 7(b) Loads.......................................... 6,906 6,954
Priority Firm Exchange - 7(b) Loads..................................... 5,320 5,341
Industrial Firm - 7(c) Loads.................................................. 91 91
New Resources - 7(f) Loads.................................................. 0.001 0.001
Average Power Rates 2016 2017
Priority Firm Public - 7(b) Loads.......................................... 34.62 35.51
Priority Firm Exchange - 7(b) Loads..................................... 58.29 59.17
Industrial Firm - 7(c) Loads.................................................. 41.60 42.43
New Resources - 7(f) Loads.................................................. 65.11 66.15
BP-16-FS-BPA-01A Page 69
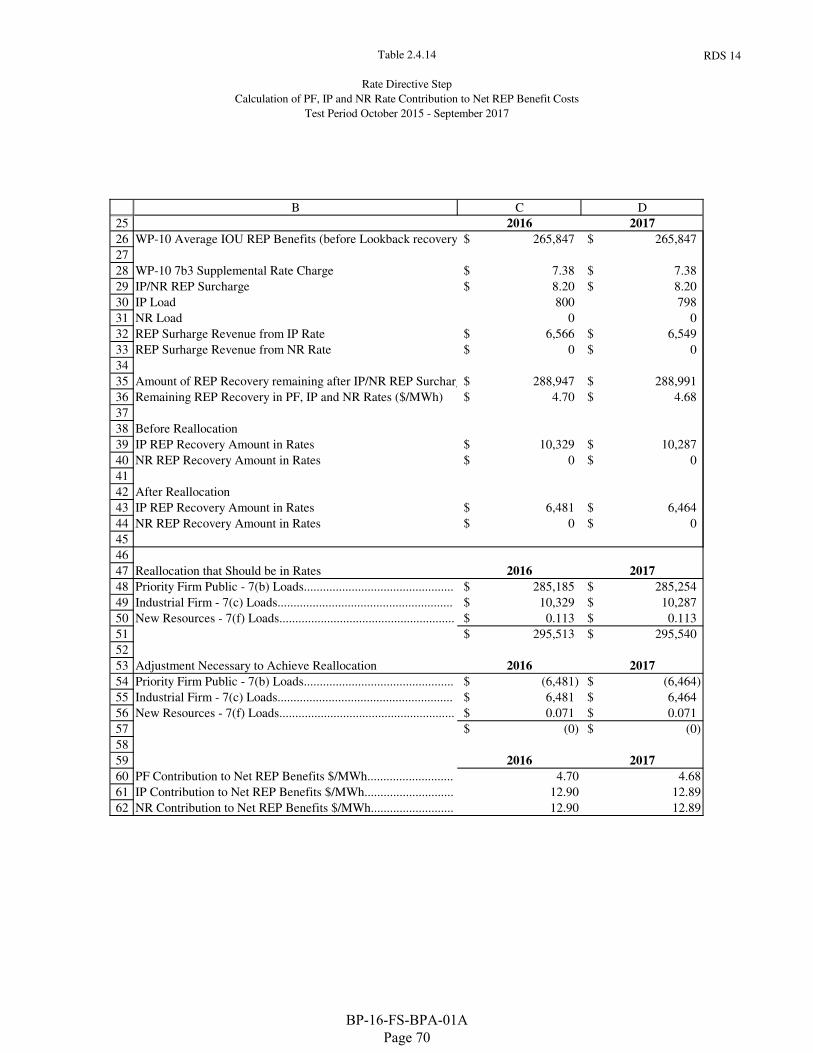
Table 2.4.14
Rate Directive Step
Calculation of PF, IP and NR Rate Contribution to Net REP Benefit Costs
Test Period October 2015 - September 2017
RDS 14
25
26
27
28
29
30
31
32
33
34
35
36
37
38
39
40
41
42
43
44
45
46
47
48
49
50
51
52
53
54
55
56
57
58
59
60
61
62
B C D
2016 2017
WP-10 Average IOU REP Benefits (before Lookback recovery) 265,847$ 265,847$
WP-10 7b3 Supplemental Rate Charge 7.38$ 7.38$
IP/NR REP Surcharge 8.20$ 8.20$
IP Load 800 798
NR Load 0 0
REP Surharge Revenue from IP Rate 6,566$ 6,549$
REP Surharge Revenue from NR Rate 0$ 0$
Amount of REP Recovery remaining after IP/NR REP Surcharge 288,947$ 288,991$
Remaining REP Recovery in PF, IP and NR Rates ($/MWh) 4.70$ 4.68$
Before Reallocation
IP REP Recovery Amount in Rates 10,329$ 10,287$
NR REP Recovery Amount in Rates 0$ 0$
After Reallocation
IP REP Recovery Amount in Rates 6,481$ 6,464$
NR REP Recovery Amount in Rates 0$ 0$
Reallocation that Should be in Rates 2016 2017
Priority Firm Public - 7(b) Loads............................................... 285,185$ 285,254$
Industrial Firm - 7(c) Loads....................................................... 10,329$ 10,287$
New Resources - 7(f) Loads....................................................... 0.113$ 0.113$
295,513$ 295,540$
Adjustment Necessary to Achieve Reallocation 2016 2017
Priority Firm Public - 7(b) Loads............................................... (6,481)$ (6,464)$
Industrial Firm - 7(c) Loads....................................................... 6,481$ 6,464$
New Resources - 7(f) Loads....................................................... 0.071$ 0.071$
(0)$ (0)$
2016 2017
PF Contribution to Net REP Benefits $/MWh........................... 4.70 4.68
IP Contribution to Net REP Benefits $/MWh............................ 12.90 12.89
NR Contribution to Net REP Benefits $/MWh.......................... 12.90 12.89
BP-16-FS-BPA-01A Page 70
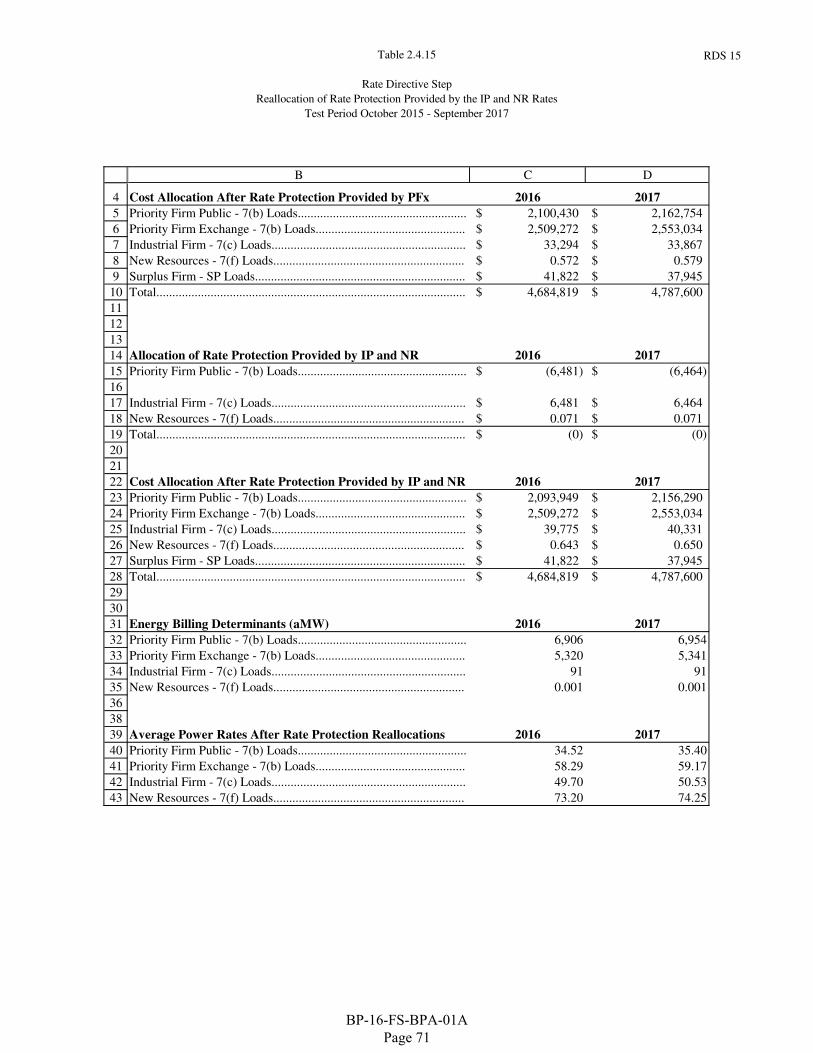
Table 2.4.15
Rate Directive Step
Reallocation of Rate Protection Provided by the IP and NR Rates
Test Period October 2015 - September 2017
RDS 15
4
5
6
7
8
9
10
11
12
13
14
15
16
17
18
19
20
21
22
23
24
25
26
27
28
29
30
31
32
33
34
35
36
38
39
40
41
42
43
B C D
Cost Allocation After Rate Protection Provided by PFx 2016 2017
Priority Firm Public - 7(b) Loads..................................................... 2,100,430$ 2,162,754$
Priority Firm Exchange - 7(b) Loads............................................... 2,509,272$ 2,553,034$
Industrial Firm - 7(c) Loads............................................................. 33,294$ 33,867$
New Resources - 7(f) Loads............................................................ 0.572$ 0.579$
Surplus Firm - SP Loads.................................................................. 41,822$ 37,945$
Total................................................................................................. 4,684,819$ 4,787,600$
Allocation of Rate Protection Provided by IP and NR 2016 2017
Priority Firm Public - 7(b) Loads..................................................... (6,481)$ (6,464)$
Industrial Firm - 7(c) Loads............................................................. 6,481$ 6,464$
New Resources - 7(f) Loads............................................................ 0.071$ 0.071$
Total................................................................................................. (0)$ (0)$
Cost Allocation After Rate Protection Provided by IP and NR 2016 2017
Priority Firm Public - 7(b) Loads..................................................... 2,093,949$ 2,156,290$
Priority Firm Exchange - 7(b) Loads............................................... 2,509,272$ 2,553,034$
Industrial Firm - 7(c) Loads............................................................. 39,775$ 40,331$
New Resources - 7(f) Loads............................................................ 0.643$ 0.650$
Surplus Firm - SP Loads.................................................................. 41,822$ 37,945$
Total................................................................................................. 4,684,819$ 4,787,600$
Energy Billing Determinants (aMW) 2016 2017
Priority Firm Public - 7(b) Loads..................................................... 6,906 6,954
Priority Firm Exchange - 7(b) Loads............................................... 5,320 5,341
Industrial Firm - 7(c) Loads............................................................. 91 91
New Resources - 7(f) Loads............................................................ 0.001 0.001
Average Power Rates After Rate Protection Reallocations 2016 2017
Priority Firm Public - 7(b) Loads..................................................... 34.52 35.40
Priority Firm Exchange - 7(b) Loads............................................... 58.29 59.17
Industrial Firm - 7(c) Loads............................................................. 49.70 50.53
New Resources - 7(f) Loads............................................................ 73.20 74.25
BP-16-FS-BPA-01A Page 71
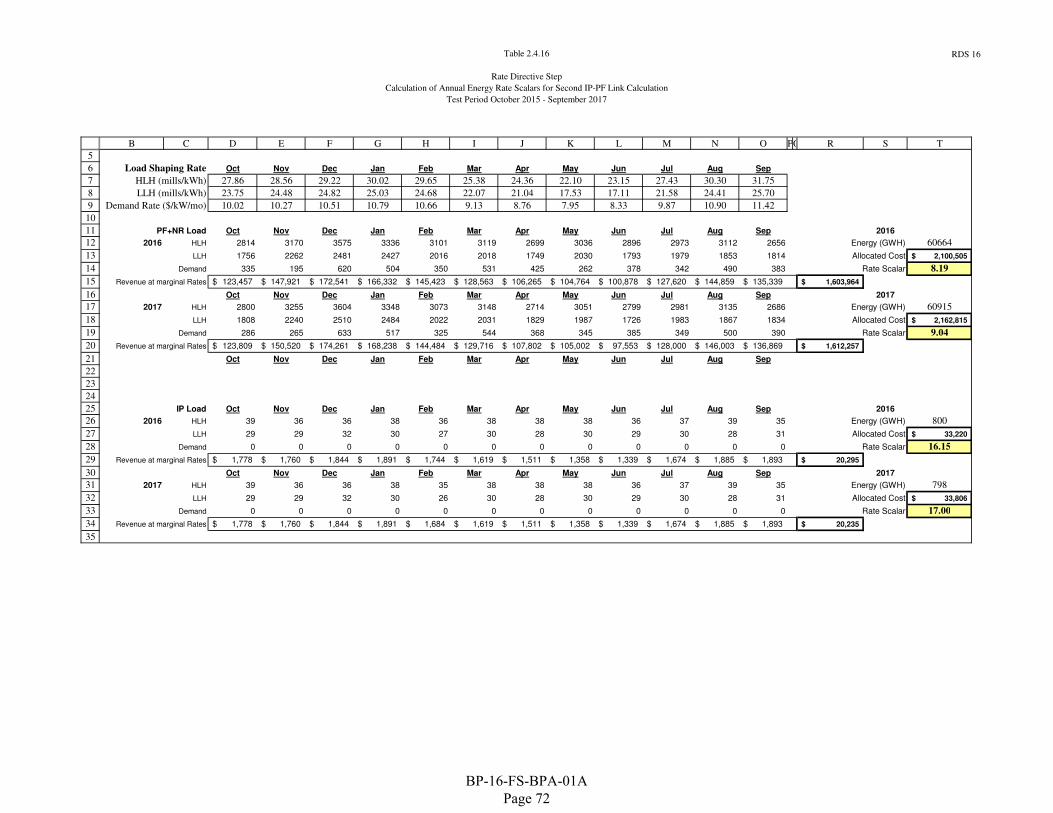
Table 2.4.16
Rate Directive Step
Calculation of Annual Energy Rate Scalars for Second IP-PF Link Calculation
Test Period October 2015 - September 2017
RDS 16
5
6
7
8
9
10
11
12
13
14
15
16
17
18
19
20
21
22
23
24
25
26
27
28
29
30
31
32
33
34
35
B C D E F G H I J K L M N O PQ R S T
Load Shaping Rate Oct Nov Dec Jan Feb Mar Apr May Jun Jul Aug Sep
HLH (mills/kWh) 27.86 28.56 29.22 30.02 29.65 25.38 24.36 22.10 23.15 27.43 30.30 31.75
LLH (mills/kWh) 23.75 24.48 24.82 25.03 24.68 22.07 21.04 17.53 17.11 21.58 24.41 25.70
Demand Rate ($/kW/mo) 10.02 10.27 10.51 10.79 10.66 9.13 8.76 7.95 8.33 9.87 10.90 11.42
PF+NR Load Oct Nov Dec Jan Feb Mar Apr May Jun Jul Aug Sep 2016
2016 HLH 2814 3170 3575 3336 3101 3119 2699 3036 2896 2973 3112 2656 Energy (GWH) 60664
LLH 1756 2262 2481 2427 2016 2018 1749 2030 1793 1979 1853 1814 Allocated Cost 2,100,505$
Demand 335 195 620 504 350 531 425 262 378 342 490 383 Rate Scalar 8.19
Revenue at marginal Rates 123,457$ 147,921$ 172,541$ 166,332$ 145,423$ 128,563$ 106,265$ 104,764$ 100,878$ 127,620$ 144,859$ 135,339$ 1,603,964$
Oct Nov Dec Jan Feb Mar Apr May Jun Jul Aug Sep 2017
2017 HLH 2800 3255 3604 3348 3073 3148 2714 3051 2799 2981 3135 2686 Energy (GWH) 60915
LLH 1808 2240 2510 2484 2022 2031 1829 1987 1726 1983 1867 1834 Allocated Cost 2,162,815$
Demand 286 265 633 517 325 544 368 345 385 349 500 390 Rate Scalar 9.04
Revenue at marginal Rates 123,809$ 150,520$ 174,261$ 168,238$ 144,484$ 129,716$ 107,802$ 105,002$ 97,553$ 128,000$ 146,003$ 136,869$ 1,612,257$
Oct Nov Dec Jan Feb Mar Apr May Jun Jul Aug Sep
IP Load Oct Nov Dec Jan Feb Mar Apr May Jun Jul Aug Sep 2016
2016 HLH 39 36 36 38 36 38 38 38 36 37 39 35 Energy (GWH) 800
LLH 29 29 32 30 27 30 28 30 29 30 28 31 Allocated Cost 33,220$
Demand 0 0 0 0 0 0 0 0 0 0 0 0 Rate Scalar 16.15
Revenue at marginal Rates 1,778$ 1,760$ 1,844$ 1,891$ 1,744$ 1,619$ 1,511$ 1,358$ 1,339$ 1,674$ 1,885$ 1,893$ 20,295$
Oct Nov Dec Jan Feb Mar Apr May Jun Jul Aug Sep 2017
2017 HLH 39 36 36 38 35 38 38 38 36 37 39 35 Energy (GWH) 798
LLH 29 29 32 30 26 30 28 30 29 30 28 31 Allocated Cost 33,806$
Demand 0 0 0 0 0 0 0 0 0 0 0 0 Rate Scalar 17.00
Revenue at marginal Rates 1,778$ 1,760$ 1,844$ 1,891$ 1,684$ 1,619$ 1,511$ 1,358$ 1,339$ 1,674$ 1,885$ 1,893$ 20,235$
BP-16-FS-BPA-01A Page 72
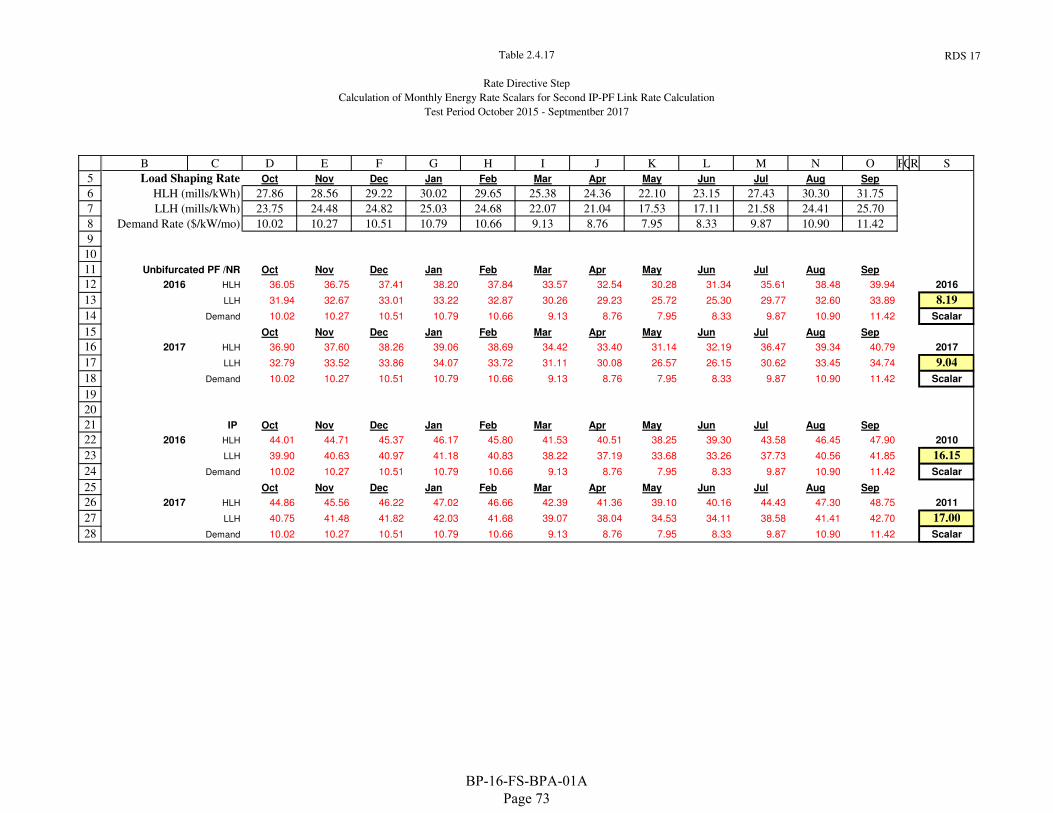
Table 2.4.17
Rate Directive Step
Calculation of Monthly Energy Rate Scalars for Second IP-PF Link Rate Calculation
Test Period October 2015 - Septmentber 2017
RDS 17
5
6
7
8
9
10
11
12
13
14
15
16
17
18
19
20
21
22
23
24
25
26
27
28
B C D E F G H I J K L M N O PQR S
Load Shaping Rate Oct Nov Dec Jan Feb Mar Apr May Jun Jul Aug Sep
HLH (mills/kWh) 27.86 28.56 29.22 30.02 29.65 25.38 24.36 22.10 23.15 27.43 30.30 31.75
LLH (mills/kWh) 23.75 24.48 24.82 25.03 24.68 22.07 21.04 17.53 17.11 21.58 24.41 25.70
Demand Rate ($/kW/mo) 10.02 10.27 10.51 10.79 10.66 9.13 8.76 7.95 8.33 9.87 10.90 11.42
Unbifurcated PF /NR Oct Nov Dec Jan Feb Mar Apr May Jun Jul Aug Sep
2016 HLH 36.05 36.75 37.41 38.20 37.84 33.57 32.54 30.28 31.34 35.61 38.48 39.94 2016
LLH 31.94 32.67 33.01 33.22 32.87 30.26 29.23 25.72 25.30 29.77 32.60 33.89 8.19
Demand 10.02 10.27 10.51 10.79 10.66 9.13 8.76 7.95 8.33 9.87 10.90 11.42 Scalar
Oct Nov Dec Jan Feb Mar Apr May Jun Jul Aug Sep
2017 HLH 36.90 37.60 38.26 39.06 38.69 34.42 33.40 31.14 32.19 36.47 39.34 40.79 2017
LLH 32.79 33.52 33.86 34.07 33.72 31.11 30.08 26.57 26.15 30.62 33.45 34.74 9.04
Demand 10.02 10.27 10.51 10.79 10.66 9.13 8.76 7.95 8.33 9.87 10.90 11.42 Scalar
IP Oct Nov Dec Jan Feb Mar Apr May Jun Jul Aug Sep
2016 HLH 44.01 44.71 45.37 46.17 45.80 41.53 40.51 38.25 39.30 43.58 46.45 47.90 2010
LLH 39.90 40.63 40.97 41.18 40.83 38.22 37.19 33.68 33.26 37.73 40.56 41.85 16.15
Demand 10.02 10.27 10.51 10.79 10.66 9.13 8.76 7.95 8.33 9.87 10.90 11.42 Scalar
Oct Nov Dec Jan Feb Mar Apr May Jun Jul Aug Sep
2017 HLH 44.86 45.56 46.22 47.02 46.66 42.39 41.36 39.10 40.16 44.43 47.30 48.75 2011
LLH 40.75 41.48 41.82 42.03 41.68 39.07 38.04 34.53 34.11 38.58 41.41 42.70 17.00
Demand 10.02 10.27 10.51 10.79 10.66 9.13 8.76 7.95 8.33 9.87 10.90 11.42 Scalar
BP-16-FS-BPA-01A Page 73
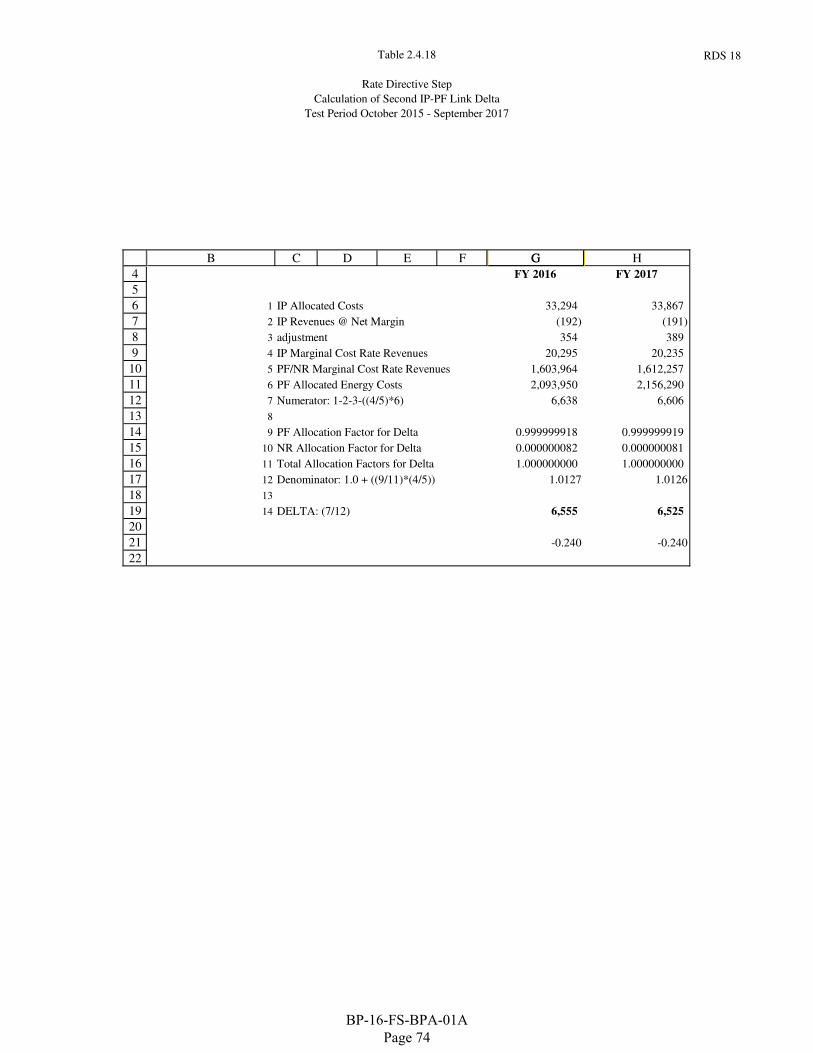
Table 2.4.18
Rate Directive Step
Calculation of Second IP-PF Link Delta
Test Period October 2015 - September 2017
RDS 18
4
5
6
7
8
9
10
11
12
13
14
15
16
17
18
19
20
21
22
B C D E F G HG
FY 2016 FY 2017
1 IP Allocated Costs 33,294 33,867
2 IP Revenues @ Net Margin (192) (191)
3 adjustment 354 389
4 IP Marginal Cost Rate Revenues 20,295 20,235
5 PF/NR Marginal Cost Rate Revenues 1,603,964 1,612,257
6 PF Allocated Energy Costs 2,093,950 2,156,290
7 Numerator: 1-2-3-((4/5)*6) 6,638 6,606
8
9 PF Allocation Factor for Delta 0.999999918 0.999999919
10 NR Allocation Factor for Delta 0.000000082 0.000000081
11 Total Allocation Factors for Delta 1.000000000 1.000000000
12 Denominator: 1.0 + ((9/11)*(4/5)) 1.0127 1.0126
13
14 DELTA: (7/12) 6,555 6,525
-0.240 -0.240
BP-16-FS-BPA-01A Page 74
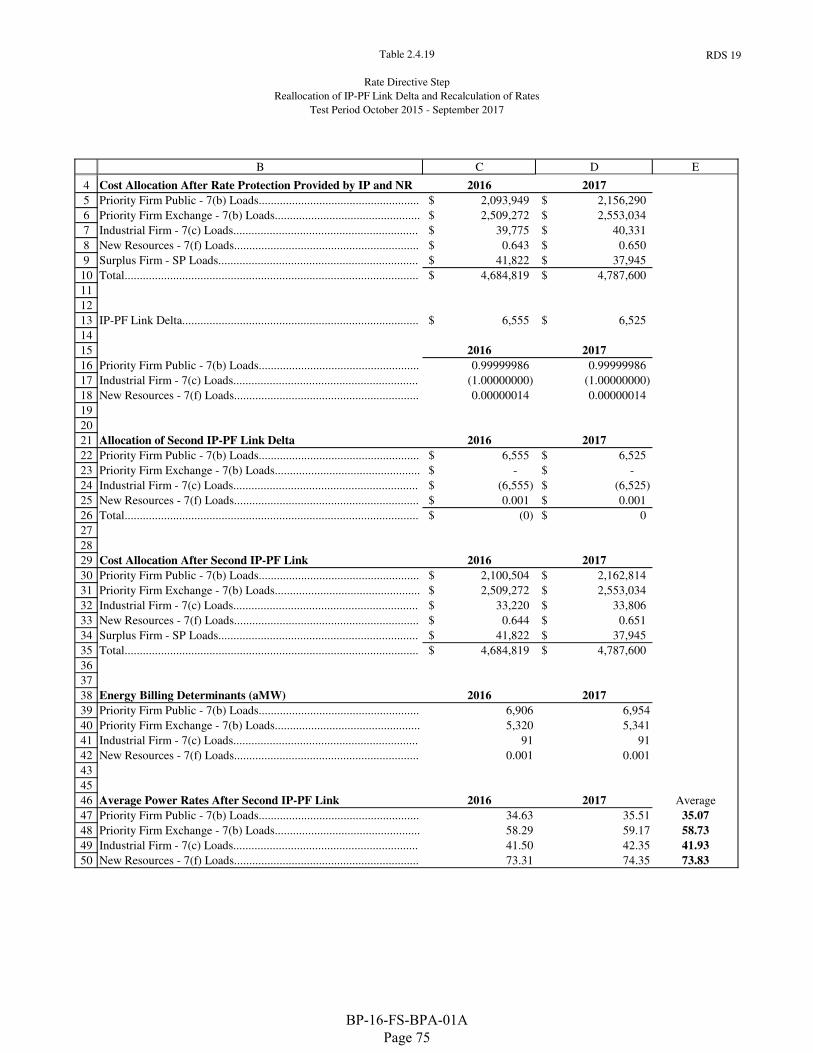
Table 2.4.19
Rate Directive Step
Reallocation of IP-PF Link Delta and Recalculation of Rates
Test Period October 2015 - September 2017
RDS 19
4
5
6
7
8
9
10
11
12
13
14
15
16
17
18
19
20
21
22
23
24
25
26
27
28
29
30
31
32
33
34
35
36
37
38
39
40
41
42
43
45
46
47
48
49
50
B C D E
Cost Allocation After Rate Protection Provided by IP and NR 2016 2017
Priority Firm Public - 7(b) Loads..................................................... 2,093,949$ 2,156,290$
Priority Firm Exchange - 7(b) Loads................................................ 2,509,272$ 2,553,034$
Industrial Firm - 7(c) Loads............................................................. 39,775$ 40,331$
New Resources - 7(f) Loads............................................................. 0.643$ 0.650$
Surplus Firm - SP Loads.................................................................. 41,822$ 37,945$
Total................................................................................................. 4,684,819$ 4,787,600$
IP-PF Link Delta.............................................................................. 6,555$ 6,525$
2016 2017
Priority Firm Public - 7(b) Loads..................................................... 0.99999986 0.99999986
Industrial Firm - 7(c) Loads............................................................. (1.00000000) (1.00000000)
New Resources - 7(f) Loads............................................................. 0.00000014 0.00000014
Allocation of Second IP-PF Link Delta 2016 2017
Priority Firm Public - 7(b) Loads..................................................... 6,555$ 6,525$
Priority Firm Exchange - 7(b) Loads................................................ -$ -$
Industrial Firm - 7(c) Loads............................................................. (6,555)$ (6,525)$
New Resources - 7(f) Loads............................................................. 0.001$ 0.001$
Total................................................................................................. (0)$ 0$
Cost Allocation After Second IP-PF Link 2016 2017
Priority Firm Public - 7(b) Loads..................................................... 2,100,504$ 2,162,814$
Priority Firm Exchange - 7(b) Loads................................................ 2,509,272$ 2,553,034$
Industrial Firm - 7(c) Loads............................................................. 33,220$ 33,806$
New Resources - 7(f) Loads............................................................. 0.644$ 0.651$
Surplus Firm - SP Loads.................................................................. 41,822$ 37,945$
Total................................................................................................. 4,684,819$ 4,787,600$
Energy Billing Determinants (aMW) 2016 2017
Priority Firm Public - 7(b) Loads..................................................... 6,906 6,954
Priority Firm Exchange - 7(b) Loads................................................ 5,320 5,341
Industrial Firm - 7(c) Loads............................................................. 91 91
New Resources - 7(f) Loads............................................................. 0.001 0.001
Average Power Rates After Second IP-PF Link 2016 2017 Average
Priority Firm Public - 7(b) Loads..................................................... 34.63 35.51 35.07
Priority Firm Exchange - 7(b) Loads................................................ 58.29 59.17 58.73
Industrial Firm - 7(c) Loads............................................................. 41.50 42.35 41.93
New Resources - 7(f) Loads............................................................. 73.31 74.35 73.83
BP-16-FS-BPA-01A Page 75
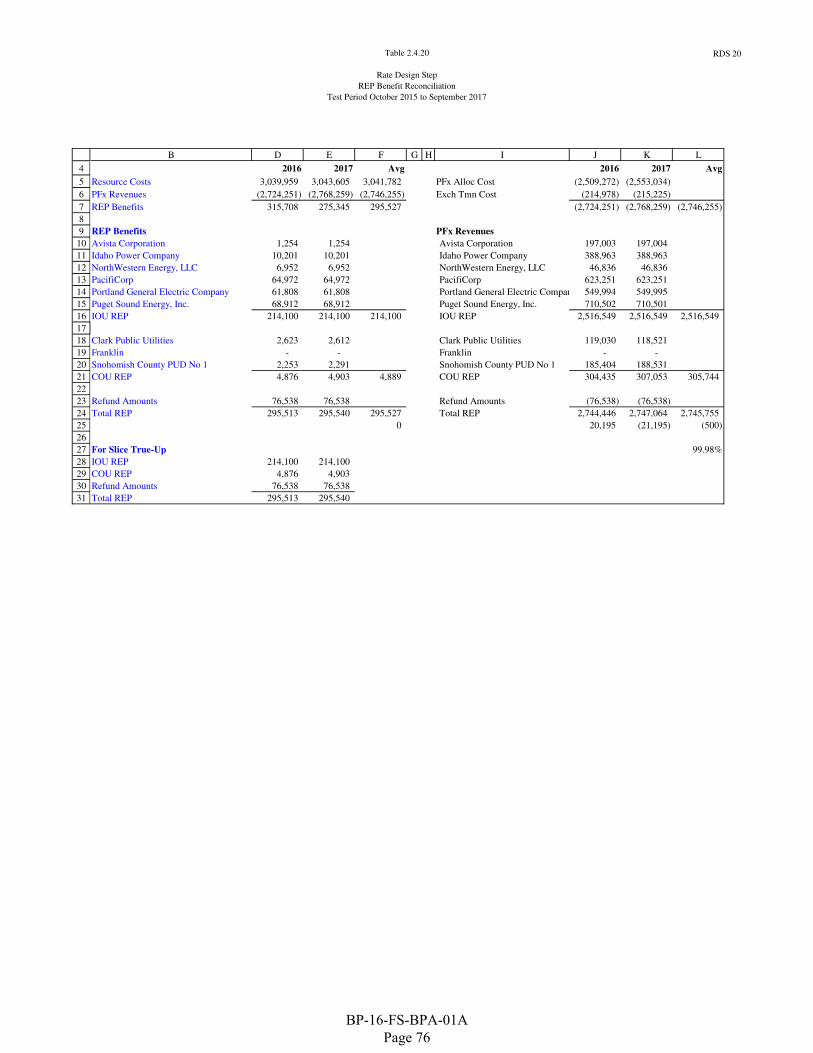
Table 2.4.20
Rate Design Step
REP Benefit Reconciliation
Test Period October 2015 to September 2017
RDS 20
4
5
6
7
8
9
10
11
12
13
14
15
16
17
18
19
20
21
22
23
24
25
26
27
28
29
30
31
B D E F G H I J K L
2016 2017 Avg 2016 2017 Avg
Resource Costs 3,039,959 3,043,605 3,041,782 PFx Alloc Cost (2,509,272) (2,553,034)
PFx Revenues (2,724,251) (2,768,259) (2,746,255) Exch Tmn Cost (214,978) (215,225)
REP Benefits 315,708 275,345 295,527 (2,724,251) (2,768,259) (2,746,255)
REP Benefits PFx Revenues
Avista Corporation 1,254 1,254 Avista Corporation 197,003 197,004
Idaho Power Company 10,201 10,201 Idaho Power Company 388,963 388,963
NorthWestern Energy, LLC 6,952 6,952 NorthWestern Energy, LLC 46,836 46,836
PacifiCorp 64,972 64,972 PacifiCorp 623,251 623,251
Portland General Electric Company 61,808 61,808 Portland General Electric Company 549,994 549,995
Puget Sound Energy, Inc. 68,912 68,912 Puget Sound Energy, Inc. 710,502 710,501
IOU REP 214,100 214,100 214,100 IOU REP 2,516,549 2,516,549 2,516,549
Clark Public Utilities 2,623 2,612 Clark Public Utilities 119,030 118,521
Franklin - - Franklin - -
Snohomish County PUD No 1 2,253 2,291 Snohomish County PUD No 1 185,404 188,531
COU REP 4,876 4,903 4,889 COU REP 304,435 307,053 305,744
Refund Amounts 76,538 76,538 Refund Amounts (76,538) (76,538)
Total REP 295,513 295,540 295,527 Total REP 2,744,446 2,747,064 2,745,755
0 20,195 (21,195) (500)
For Slice True-Up 99.98%
IOU REP 214,100 214,100
COU REP 4,876 4,903
Refund Amounts 76,538 76,538
Total REP 295,513 295,540
BP-16-FS-BPA-01A Page 76
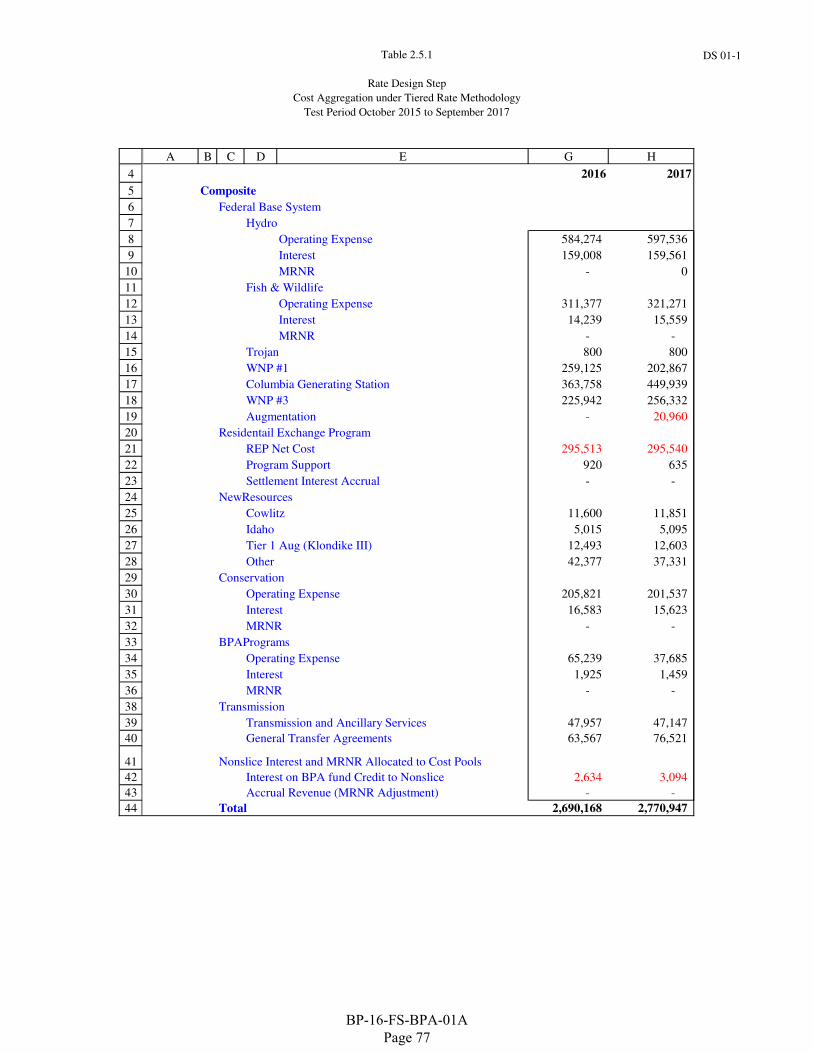
Table 2.5.1
Rate Design Step
Cost Aggregation under Tiered Rate Methodology
Test Period October 2015 to September 2017
DS 01-1
4
5
6
7
8
9
10
11
12
13
14
15
16
17
18
19
20
21
22
23
24
25
26
27
28
29
30
31
32
33
34
35
36
38
39
40
41
42
43
44
A B C D E G H
2016 2017
Composite
Federal Base System
Hydro
Operating Expense 584,274 597,536
Interest 159,008 159,561
MRNR - 0
Fish & Wildlife
Operating Expense 311,377 321,271
Interest 14,239 15,559
MRNR - -
Trojan 800 800
WNP #1 259,125 202,867
Columbia Generating Station 363,758 449,939
WNP #3 225,942 256,332
Augmentation - 20,960
Residentail Exchange Program
REP Net Cost 295,513 295,540
Program Support 920 635
Settlement Interest Accrual - -
NewResources
Cowlitz 11,600 11,851
Idaho 5,015 5,095
Tier 1 Aug (Klondike III) 12,493 12,603
Other 42,377 37,331
Conservation
Operating Expense 205,821 201,537
Interest 16,583 15,623
MRNR - -
BPAPrograms
Operating Expense 65,239 37,685
Interest 1,925 1,459
MRNR - -
Transmission
Transmission and Ancillary Services 47,957 47,147
General Transfer Agreements 63,567 76,521
Nonslice Interest and MRNR Allocated to Cost Pools
Interest on BPA fund Credit to Nonslice 2,634 3,094
Accrual Revenue (MRNR Adjustment) - -
Total 2,690,168 2,770,947
BP-16-FS-BPA-01A Page 77
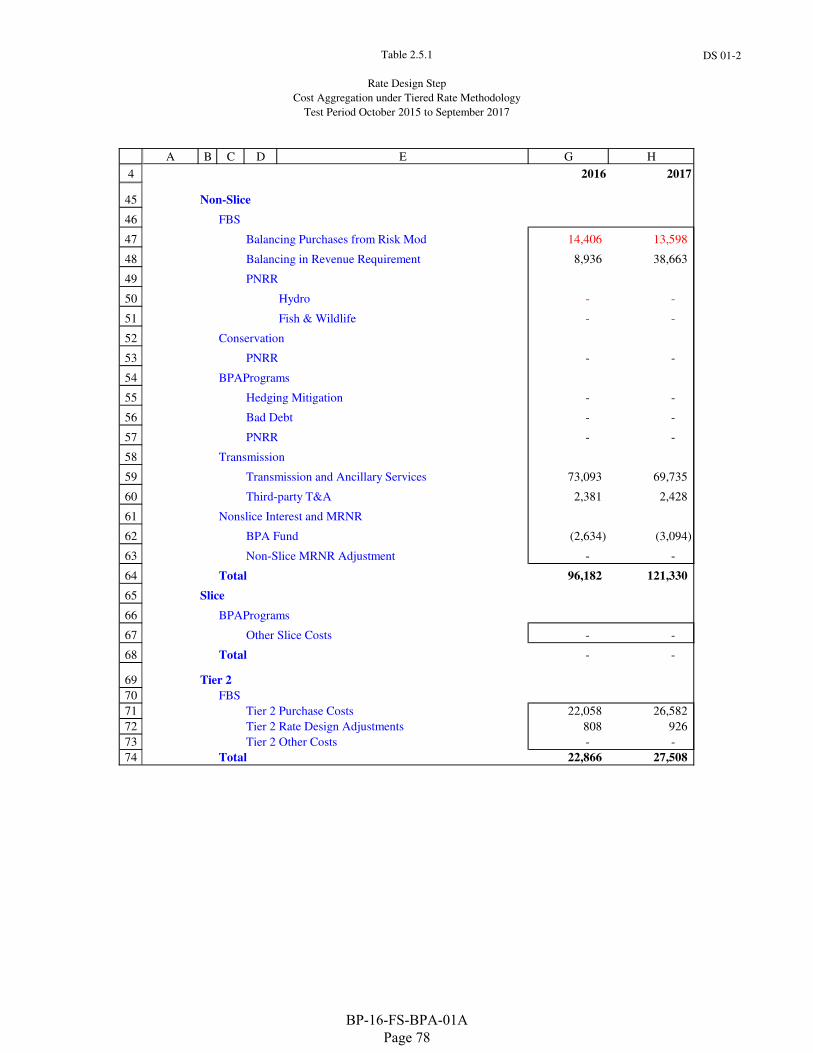
Table 2.5.1
Rate Design Step
Cost Aggregation under Tiered Rate Methodology
Test Period October 2015 to September 2017
DS 01-2
4
A B C D E G H
2016 2017
45
46
47
48
49
50
51
52
53
54
55
56
57
58
59
60
61
62
63
64
65
66
67
68
69
70
71
72
73
74
Non-Slice
FBS
Balancing Purchases from Risk Mod 14,406 13,598
Balancing in Revenue Requirement 8,936 38,663
PNRR
Hydro - -
Fish & Wildlife - -
Conservation
PNRR - -
BPAPrograms
Hedging Mitigation - -
Bad Debt - -
PNRR - -
Transmission
Transmission and Ancillary Services 73,093 69,735
Third-party T&A 2,381 2,428
Nonslice Interest and MRNR
BPA Fund (2,634) (3,094)
Non-Slice MRNR Adjustment - -
Total 96,182 121,330
Slice
BPAPrograms
Other Slice Costs - -
Total - -
Tier 2
FBS
Tier 2 Purchase Costs 22,058 26,582
Tier 2 Rate Design Adjustments 808 926
Tier 2 Other Costs - -
Total 22,866 27,508
BP-16-FS-BPA-01A Page 78
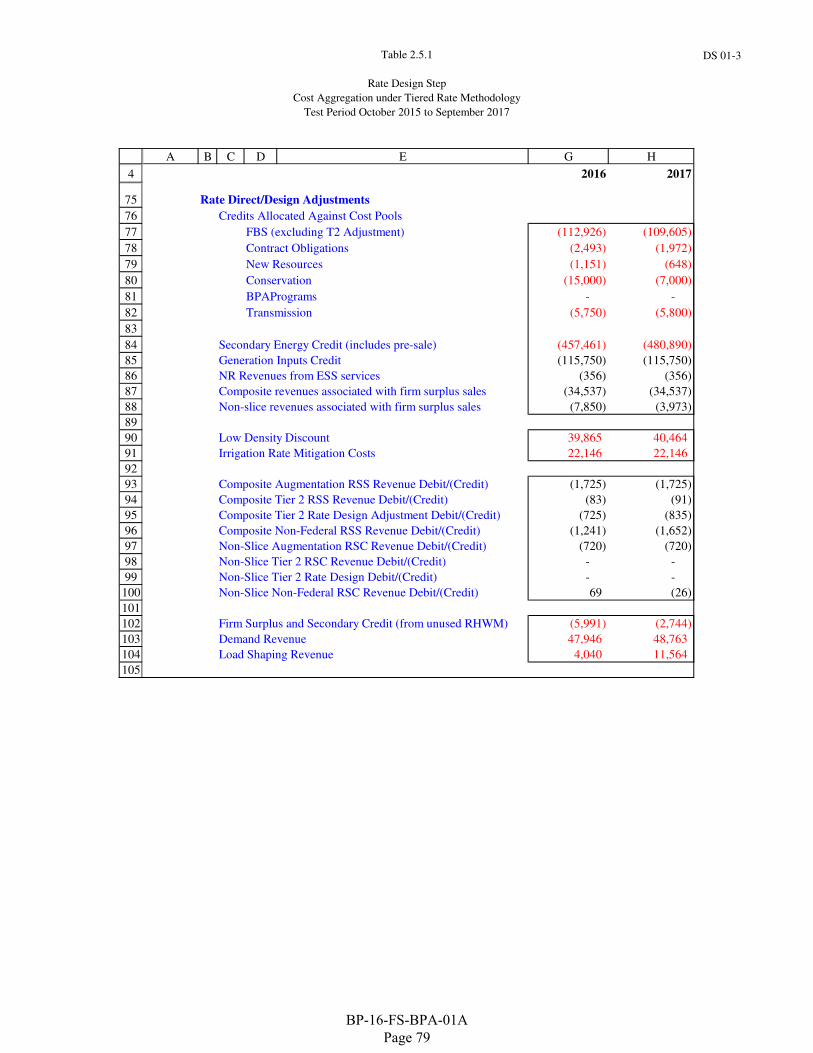
Table 2.5.1
Rate Design Step
Cost Aggregation under Tiered Rate Methodology
Test Period October 2015 to September 2017
DS 01-3
4
A B C D E G H
2016 2017
75
76
77
78
79
80
81
82
83
84
85
86
87
88
89
90
91
92
93
94
95
96
97
98
99
100
101
102
103
104
105
Rate Direct/Design Adjustments
Credits Allocated Against Cost Pools
FBS (excluding T2 Adjustment) (112,926) (109,605)
Contract Obligations (2,493) (1,972)
New Resources (1,151) (648)
Conservation (15,000) (7,000)
BPAPrograms - -
Transmission (5,750) (5,800)
Secondary Energy Credit (includes pre-sale) (457,461) (480,890)
Generation Inputs Credit (115,750) (115,750)
NR Revenues from ESS services (356) (356)
Composite revenues associated with firm surplus sales (34,537) (34,537)
Non-slice revenues associated with firm surplus sales (7,850) (3,973)
Low Density Discount 39,865 40,464
Irrigation Rate Mitigation Costs 22,146 22,146
Composite Augmentation RSS Revenue Debit/(Credit) (1,725) (1,725)
Composite Tier 2 RSS Revenue Debit/(Credit) (83) (91)
Composite Tier 2 Rate Design Adjustment Debit/(Credit) (725) (835)
Composite Non-Federal RSS Revenue Debit/(Credit) (1,241) (1,652)
Non-Slice Augmentation RSC Revenue Debit/(Credit) (720) (720)
Non-Slice Tier 2 RSC Revenue Debit/(Credit) - -
Non-Slice Tier 2 Rate Design Debit/(Credit) - -
Non-Slice Non-Federal RSC Revenue Debit/(Credit) 69 (26)
Firm Surplus and Secondary Credit (from unused RHWM) (5,991) (2,744)
Demand Revenue 47,946 48,763
Load Shaping Revenue 4,040 11,564
BP-16-FS-BPA-01A Page 79
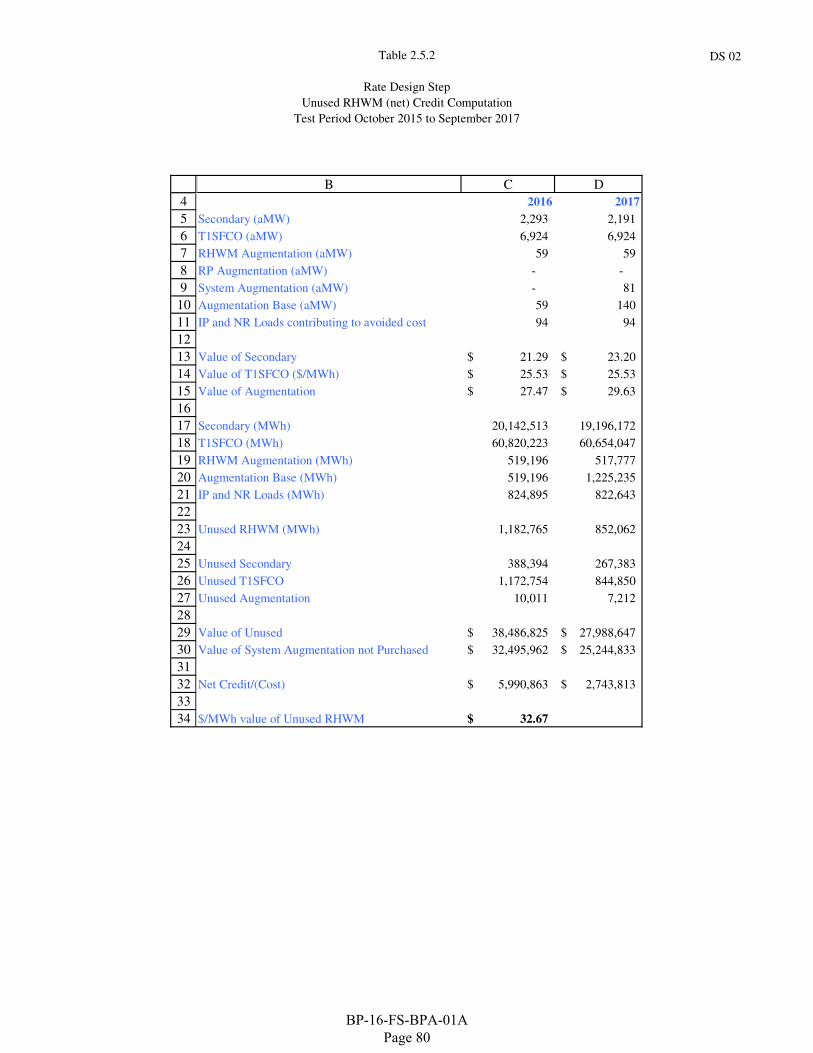
Table 2.5.2
Rate Design Step
Unused RHWM (net) Credit Computation
Test Period October 2015 to September 2017
DS 02
4
5
6
7
8
9
10
11
12
13
14
15
16
17
18
19
20
21
22
23
24
25
26
27
28
29
30
31
32
33
34
B C D
2016 2017
Secondary (aMW) 2,293 2,191
T1SFCO (aMW) 6,924 6,924
RHWM Augmentation (aMW) 59 59
RP Augmentation (aMW) - -
System Augmentation (aMW) - 81
Augmentation Base (aMW) 59 140
IP and NR Loads contributing to avoided cost 94 94
Value of Secondary 21.29$ 23.20$
Value of T1SFCO ($/MWh) 25.53$ 25.53$
Value of Augmentation 27.47$ 29.63$
Secondary (MWh) 20,142,513 19,196,172
T1SFCO (MWh) 60,820,223 60,654,047
RHWM Augmentation (MWh) 519,196 517,777
Augmentation Base (MWh) 519,196 1,225,235
IP and NR Loads (MWh) 824,895 822,643
Unused RHWM (MWh) 1,182,765 852,062
Unused Secondary 388,394 267,383
Unused T1SFCO 1,172,754 844,850
Unused Augmentation 10,011 7,212
Value of Unused 38,486,825$ 27,988,647$
Value of System Augmentation not Purchased 32,495,962$ 25,244,833$
Net Credit/(Cost) 5,990,863$ 2,743,813$
$/MWh value of Unused RHWM 32.67$
BP-16-FS-BPA-01A Page 80
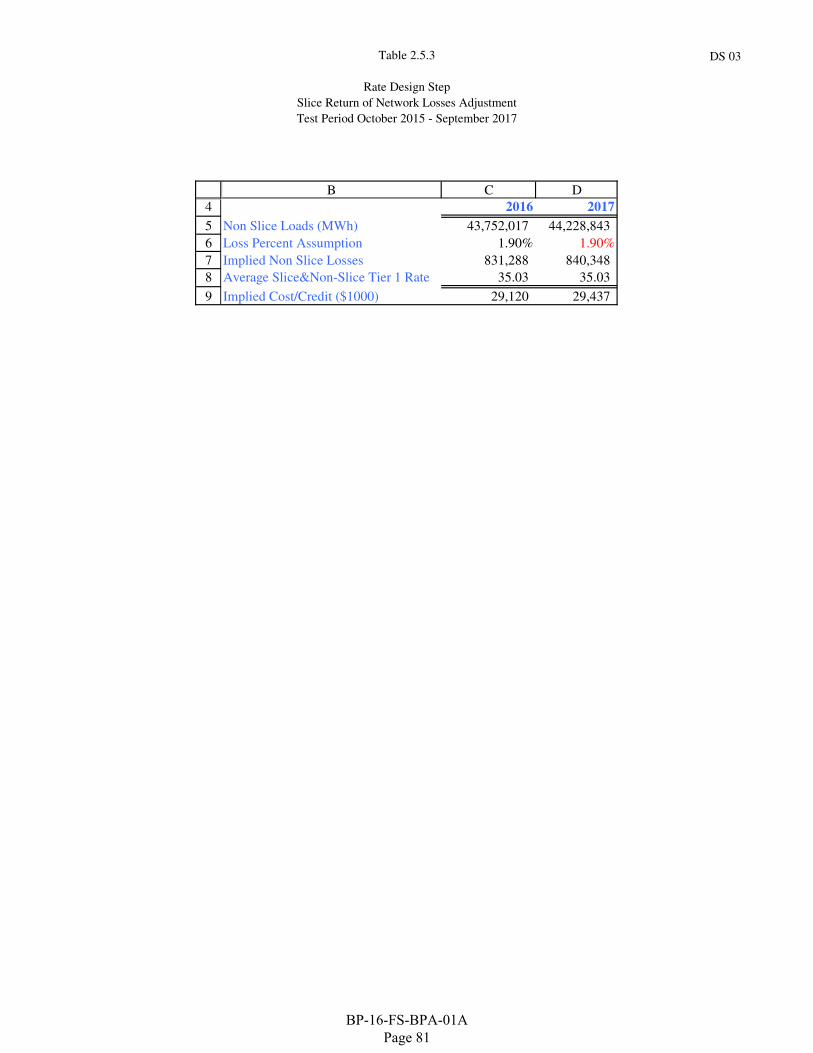
Table 2.5.3
Rate Design Step
Slice Return of Network Losses Adjustment
Test Period October 2015 - September 2017
DS 03
4
5
6
7
8
9
B C D
2016 2017
Non Slice Loads (MWh) 43,752,017 44,228,843
Loss Percent Assumption 1.90% 1.90%
Implied Non Slice Losses 831,288 840,348
Average Slice&Non-Slice Tier 1 Rate 35.03 35.03
Implied Cost/Credit ($1000) 29,120 29,437
BP-16-FS-BPA-01A Page 81
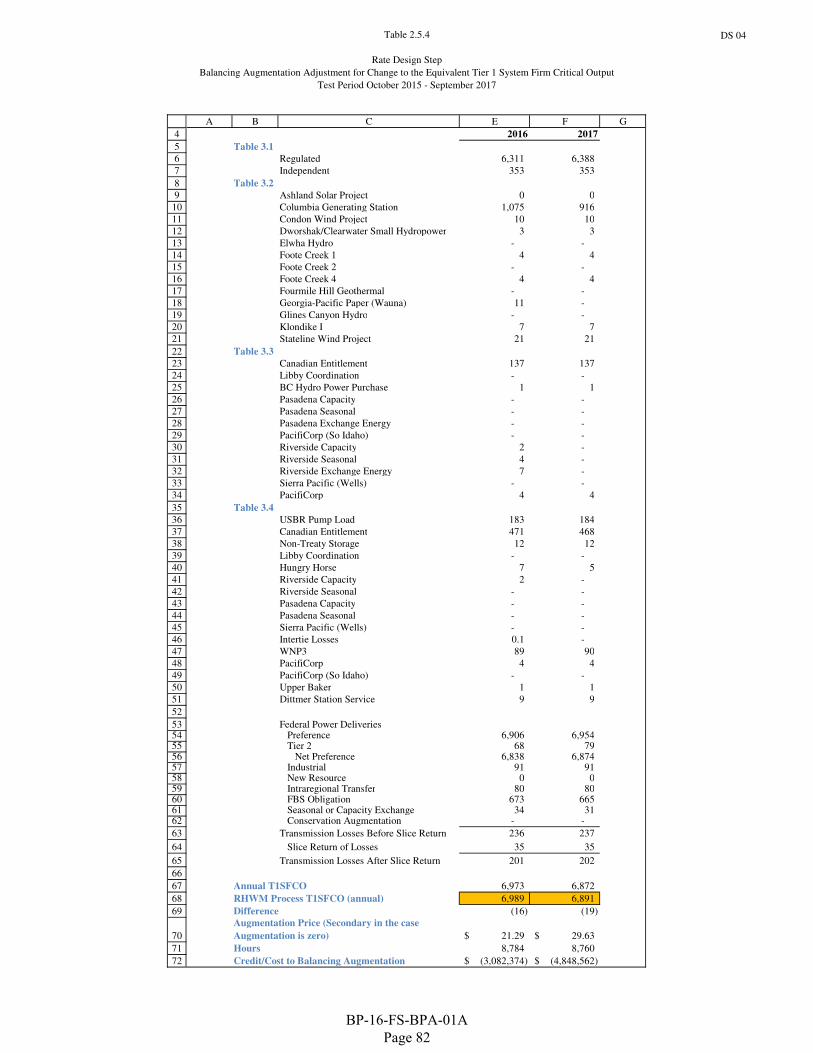
Table 2.5.4
Rate Design Step
Balancing Augmentation Adjustment for Change to the Equivalent Tier 1 System Firm Critical Output
Test Period October 2015 - September 2017
DS 04
4
5
6
7
8
9
10
11
12
13
14
15
16
17
18
19
20
21
22
23
24
25
26
27
28
29
30
31
32
33
34
35
36
37
38
39
40
41
42
43
44
45
46
47
48
49
50
51
52
53545556575859606162
63
64
65
66
67
68
69
70
71
72
A B C E F G
2016 2017
Table 3.1
Regulated 6,311 6,388
Independent 353 353
Table 3.2
Ashland Solar Project 0 0
Columbia Generating Station 1,075 916
Condon Wind Project 10 10
Dworshak/Clearwater Small Hydropower 3 3
Elwha Hydro - -
Foote Creek 1 4 4
Foote Creek 2 - -
Foote Creek 4 4 4
Fourmile Hill Geothermal - -
Georgia-Pacific Paper (Wauna) 11 -
Glines Canyon Hydro - -
Klondike I 7 7
Stateline Wind Project 21 21
Table 3.3
Canadian Entitlement 137 137
Libby Coordination - -
BC Hydro Power Purchase 1 1
Pasadena Capacity - -
Pasadena Seasonal - -
Pasadena Exchange Energy - -
PacifiCorp (So Idaho) - -
Riverside Capacity 2 -
Riverside Seasonal 4 -
Riverside Exchange Energy 7 -
Sierra Pacific (Wells) - -
PacifiCorp 4 4
Table 3.4
USBR Pump Load 183 184
Canadian Entitlement 471 468
Non-Treaty Storage 12 12
Libby Coordination - -
Hungry Horse 7 5
Riverside Capacity 2 -
Riverside Seasonal - -
Pasadena Capacity - -
Pasadena Seasonal - -
Sierra Pacific (Wells) - -
Intertie Losses 0.1 -
WNP3 89 90
PacifiCorp 4 4
PacifiCorp (So Idaho) - -
Upper Baker 1 1
Dittmer Station Service 9 9
Federal Power DeliveriesPreference 6,906 6,954 Tier 2 68 79
Net Preference 6,838 6,874 Industrial 91 91 New Resource 0 0 Intraregional Transfer 80 80 FBS Obligation 673 665 Seasonal or Capacity Exchange 34 31 Conservation Augmentation - -
Transmission Losses Before Slice Return 236 237
Slice Return of Losses 35 35
Transmission Losses After Slice Return 201 202
Annual T1SFCO 6,973 6,872
RHWM Process T1SFCO (annual) 6,989 6,891
Difference (16) (19)
21.29$ 29.63$
Hours 8,784 8,760
Credit/Cost to Balancing Augmentation (3,082,374)$ (4,848,562)$
Augmentation Price (Secondary in the case
Augmentation is zero)
BP-16-FS-BPA-01A Page 82
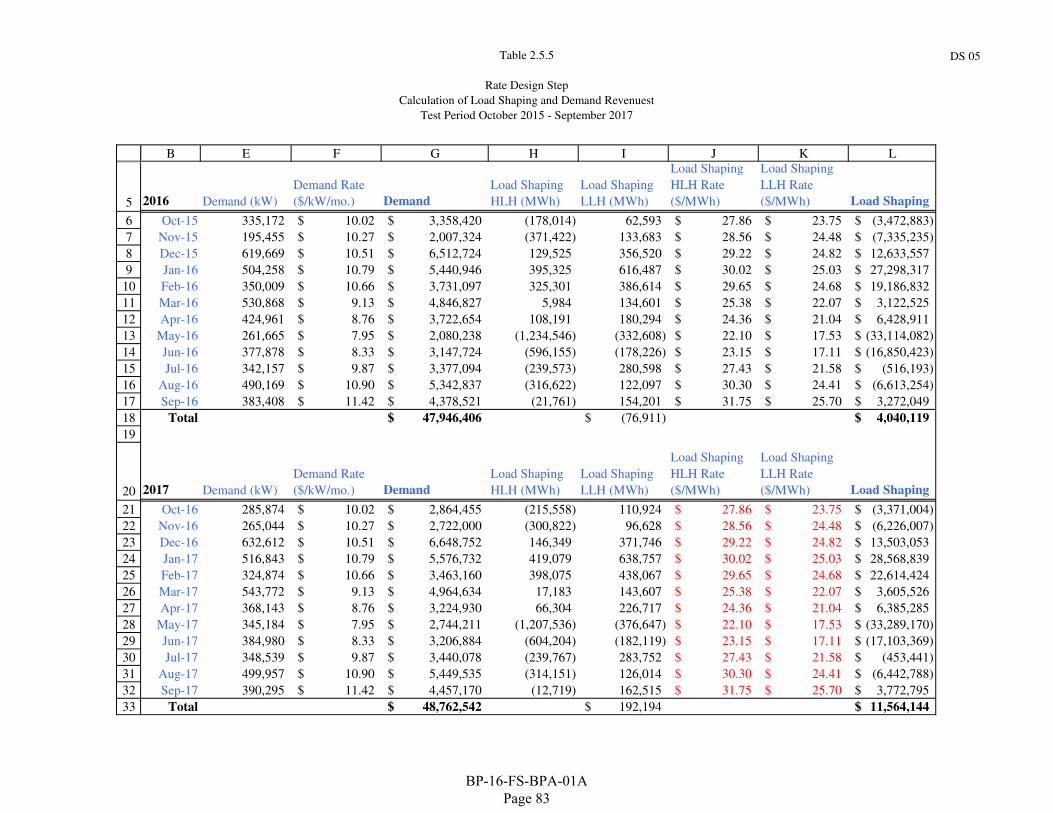
Table 2.5.5
Rate Design Step
Calculation of Load Shaping and Demand Revenuest
Test Period October 2015 - September 2017
DS 05
5
6
7
8
9
10
11
12
13
14
15
16
17
18
19
20
21
22
23
24
25
26
27
28
29
30
31
32
33
B E F G H I J K L
2016 Demand (kW)
Demand Rate
($/kW/mo.) Demand
Load Shaping
HLH (MWh)
Load Shaping
LLH (MWh)
Load Shaping
HLH Rate
($/MWh)
Load Shaping
LLH Rate
($/MWh) Load Shaping
Oct-15 335,172 10.02$ 3,358,420$ (178,014) 62,593 27.86$ 23.75$ (3,472,883)$
Nov-15 195,455 10.27$ 2,007,324$ (371,422) 133,683 28.56$ 24.48$ (7,335,235)$
Dec-15 619,669 10.51$ 6,512,724$ 129,525 356,520 29.22$ 24.82$ 12,633,557$
Jan-16 504,258 10.79$ 5,440,946$ 395,325 616,487 30.02$ 25.03$ 27,298,317$
Feb-16 350,009 10.66$ 3,731,097$ 325,301 386,614 29.65$ 24.68$ 19,186,832$
Mar-16 530,868 9.13$ 4,846,827$ 5,984 134,601 25.38$ 22.07$ 3,122,525$
Apr-16 424,961 8.76$ 3,722,654$ 108,191 180,294 24.36$ 21.04$ 6,428,911$
May-16 261,665 7.95$ 2,080,238$ (1,234,546) (332,608) 22.10$ 17.53$ (33,114,082)$
Jun-16 377,878 8.33$ 3,147,724$ (596,155) (178,226) 23.15$ 17.11$ (16,850,423)$
Jul-16 342,157 9.87$ 3,377,094$ (239,573) 280,598 27.43$ 21.58$ (516,193)$
Aug-16 490,169 10.90$ 5,342,837$ (316,622) 122,097 30.30$ 24.41$ (6,613,254)$
Sep-16 383,408 11.42$ 4,378,521$ (21,761) 154,201 31.75$ 25.70$ 3,272,049$
Total 47,946,406$ (76,911)$ 4,040,119$
2017 Demand (kW)
Demand Rate
($/kW/mo.) Demand
Load Shaping
HLH (MWh)
Load Shaping
LLH (MWh)
Load Shaping
HLH Rate
($/MWh)
Load Shaping
LLH Rate
($/MWh) Load Shaping
Oct-16 285,874 10.02$ 2,864,455$ (215,558) 110,924 27.86$ 23.75$ (3,371,004)$
Nov-16 265,044 10.27$ 2,722,000$ (300,822) 96,628 28.56$ 24.48$ (6,226,007)$
Dec-16 632,612 10.51$ 6,648,752$ 146,349 371,746 29.22$ 24.82$ 13,503,053$
Jan-17 516,843 10.79$ 5,576,732$ 419,079 638,757 30.02$ 25.03$ 28,568,839$
Feb-17 324,874 10.66$ 3,463,160$ 398,075 438,067 29.65$ 24.68$ 22,614,424$
Mar-17 543,772 9.13$ 4,964,634$ 17,183 143,607 25.38$ 22.07$ 3,605,526$
Apr-17 368,143 8.76$ 3,224,930$ 66,304 226,717 24.36$ 21.04$ 6,385,285$
May-17 345,184 7.95$ 2,744,211$ (1,207,536) (376,647) 22.10$ 17.53$ (33,289,170)$
Jun-17 384,980 8.33$ 3,206,884$ (604,204) (182,119) 23.15$ 17.11$ (17,103,369)$
Jul-17 348,539 9.87$ 3,440,078$ (239,767) 283,752 27.43$ 21.58$ (453,441)$
Aug-17 499,957 10.90$ 5,449,535$ (314,151) 126,014 30.30$ 24.41$ (6,442,788)$
Sep-17 390,295 11.42$ 4,457,170$ (12,719) 162,515 31.75$ 25.70$ 3,772,795$
Total 48,762,542$ 192,194$ 11,564,144$
BP-16-FS-BPA-01A Page 83

Table 2.5.6.1
Rate Design Step
Calculation of PF Preference Rates under Tiered Rate Methodology
Test Period October 2015 - September 2017
DS 06-1
5
6
7
8
9
B C D E
Costs ($000) 2016 2017 Rate Period
Composite..................................................................................... 2,690,168$ 2,770,947$ 5,461,115$
Non-Slice....................................................................................... 96,182$ 121,330$ 217,513$
Slice................................................................................................ -$ -$ -$
Tier 2............................................................................................. 22,866$ 27,508$ 50,373$
13
14
15
16
17
18
19
20
21
22
23
24
25
26
27
28
29
30
31
32
33
34
35
36
Revenues from Rate Pools to Composite Cost Pool 2016 2017 Rate Period
DSI Revenue Credit....................................................................... (33,560)$ (33,469)$ (67,029)$
Exchange Revenues....................................................................... -$ -$ -$
New Resource Revenues................................................................ (0.64)$ (0.65)$ (1)$
FPS Revenues................................................................................ (34,537)$ (34,537)$ (69,074)$
Non-Federal RSS Revenues........................................................... (1,241)$ (1,652)$ (2,894)$
Other Credits.................................................................................. (253,070)$ (240,775)$ (493,845)$
Tiered Rate Elements..................................................................... -$
Unused RHWM Credit Reallocation.......................................... (5,991)$ (2,744)$ (8,735)$
Balancing Augmentation Adjustment Reallocation................... (1,445)$ (10,543)$ (11,988)$
Composite Augmentation RSS Revenue Debit/(Credit)............ (1,725)$ (1,725)$ (3,450)$
Composite Tier 2 RSS Revenue Debit/(Credit)......................... (83)$ (91)$ (174)$
Composite Tier 2 Rate Design Adjustment Debit/(Credit)........ (725)$ (835)$ (1,559)$
Transmission Losses Adjustment Reallocation.......................... (29,120)$ (29,437)$ (58,557)$
Total............................................................................................... (361,497)$ (355,808)$ (717,305)$
Rate Discount Costs Applied to Composite Pool 2016 2017 Rate Period
Irigation Rate Discout Costs.......................................................... 22,146$ 22,146$ 44,293$
Low Density Discount Costs......................................................... 39,865$ 40,464$ 80,329$
Total............................................................................................... 62,012$ 62,610$ 124,622$
2016 2017 Rate Period
Composite..................................................................................... 2,390,683$ 2,477,749$ 4,868,432$
BP-16-FS-BPA-01A Page 84
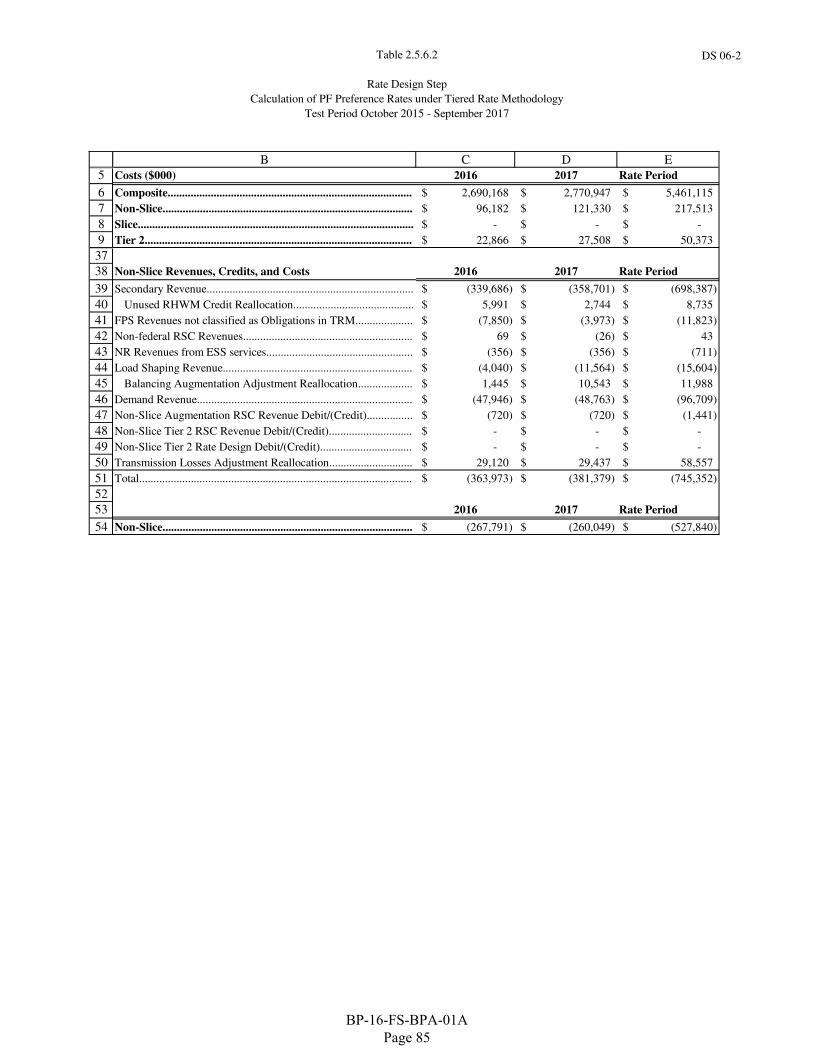
Table 2.5.6.2
Rate Design Step
Calculation of PF Preference Rates under Tiered Rate Methodology
Test Period October 2015 - September 2017
DS 06-2
5
6
7
8
9
B C D E
Costs ($000) 2016 2017 Rate Period
Composite..................................................................................... 2,690,168$ 2,770,947$ 5,461,115$
Non-Slice....................................................................................... 96,182$ 121,330$ 217,513$
Slice................................................................................................ -$ -$ -$
Tier 2............................................................................................. 22,866$ 27,508$ 50,373$
37
38
39
40
41
42
43
44
45
46
47
48
49
50
51
52
53
54
Non-Slice Revenues, Credits, and Costs 2016 2017 Rate Period
Secondary Revenue........................................................................ (339,686)$ (358,701)$ (698,387)$
Unused RHWM Credit Reallocation.......................................... 5,991$ 2,744$ 8,735$
FPS Revenues not classified as Obligations in TRM.................... (7,850)$ (3,973)$ (11,823)$
Non-federal RSC Revenues........................................................... 69$ (26)$ 43$
NR Revenues from ESS services................................................... (356)$ (356)$ (711)$
Load Shaping Revenue.................................................................. (4,040)$ (11,564)$ (15,604)$
Balancing Augmentation Adjustment Reallocation................... 1,445$ 10,543$ 11,988$
Demand Revenue........................................................................... (47,946)$ (48,763)$ (96,709)$
Non-Slice Augmentation RSC Revenue Debit/(Credit)................ (720)$ (720)$ (1,441)$
Non-Slice Tier 2 RSC Revenue Debit/(Credit)............................. -$ -$ -$
Non-Slice Tier 2 Rate Design Debit/(Credit)................................ -$ -$ -$
Transmission Losses Adjustment Reallocation............................. 29,120$ 29,437$ 58,557$
Total............................................................................................... (363,973)$ (381,379)$ (745,352)$
2016 2017 Rate Period
Non-Slice....................................................................................... (267,791)$ (260,049)$ (527,840)$
BP-16-FS-BPA-01A Page 85
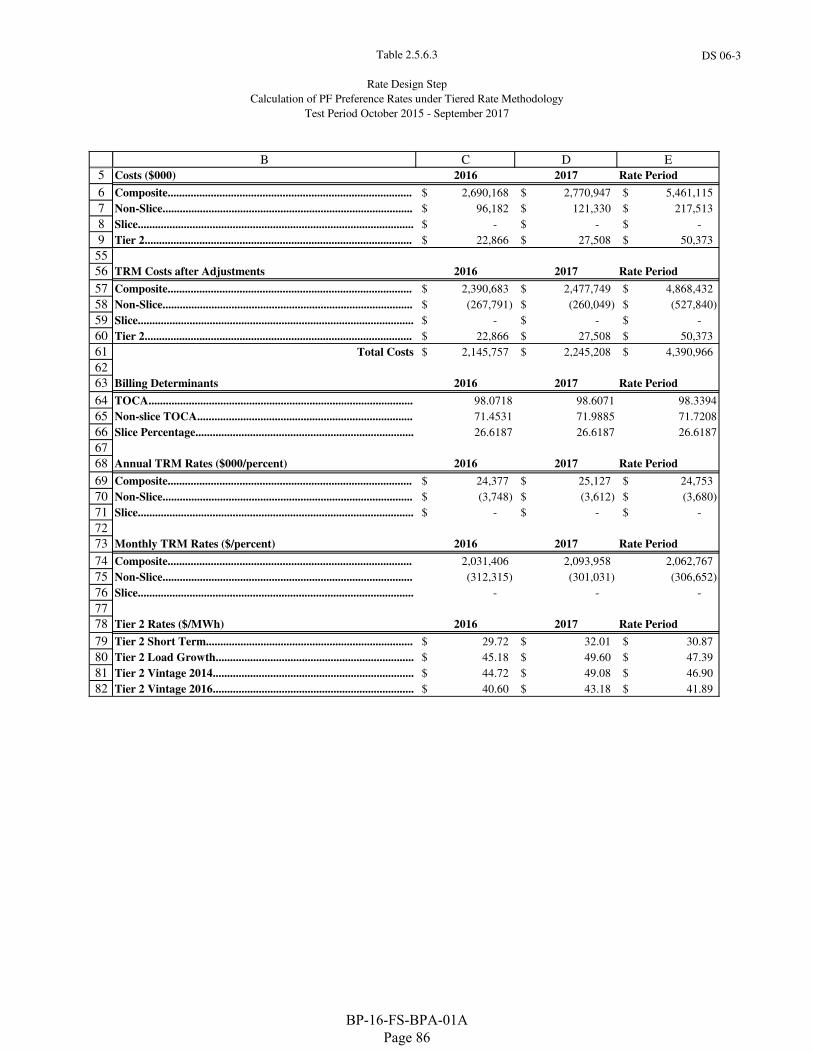
Table 2.5.6.3
Rate Design Step
Calculation of PF Preference Rates under Tiered Rate Methodology
Test Period October 2015 - September 2017
DS 06-3
5
6
7
8
9
B C D E
Costs ($000) 2016 2017 Rate Period
Composite..................................................................................... 2,690,168$ 2,770,947$ 5,461,115$
Non-Slice....................................................................................... 96,182$ 121,330$ 217,513$
Slice................................................................................................ -$ -$ -$
Tier 2............................................................................................. 22,866$ 27,508$ 50,373$
55
56
57
58
59
60
61
62
63
64
65
66
67
68
69
70
71
72
73
74
75
76
77
78
79
80
81
82
TRM Costs after Adjustments 2016 2017 Rate Period
Composite..................................................................................... 2,390,683$ 2,477,749$ 4,868,432$
Non-Slice....................................................................................... (267,791)$ (260,049)$ (527,840)$
Slice................................................................................................ -$ -$ -$
Tier 2............................................................................................. 22,866$ 27,508$ 50,373$
Total Costs 2,145,757$ 2,245,208$ 4,390,966$
Billing Determinants 2016 2017 Rate Period
TOCA............................................................................................ 98.0718 98.6071 98.3394
Non-slice TOCA........................................................................... 71.4531 71.9885 71.7208
Slice Percentage............................................................................ 26.6187 26.6187 26.6187
Annual TRM Rates ($000/percent) 2016 2017 Rate Period
Composite..................................................................................... 24,377$ 25,127$ 24,753$
Non-Slice....................................................................................... (3,748)$ (3,612)$ (3,680)$
Slice................................................................................................ -$ -$ -$
Monthly TRM Rates ($/percent) 2016 2017 Rate Period
Composite..................................................................................... 2,031,406 2,093,958 2,062,767
Non-Slice....................................................................................... (312,315) (301,031) (306,652)
Slice................................................................................................ - - -
Tier 2 Rates ($/MWh) 2016 2017 Rate Period
Tier 2 Short Term........................................................................ 29.72$ 32.01$ 30.87$
Tier 2 Load Growth..................................................................... 45.18$ 49.60$ 47.39$
Tier 2 Vintage 2014...................................................................... 44.72$ 49.08$ 46.90$
Tier 2 Vintage 2016...................................................................... 40.60$ 43.18$ 41.89$
BP-16-FS-BPA-01A Page 86
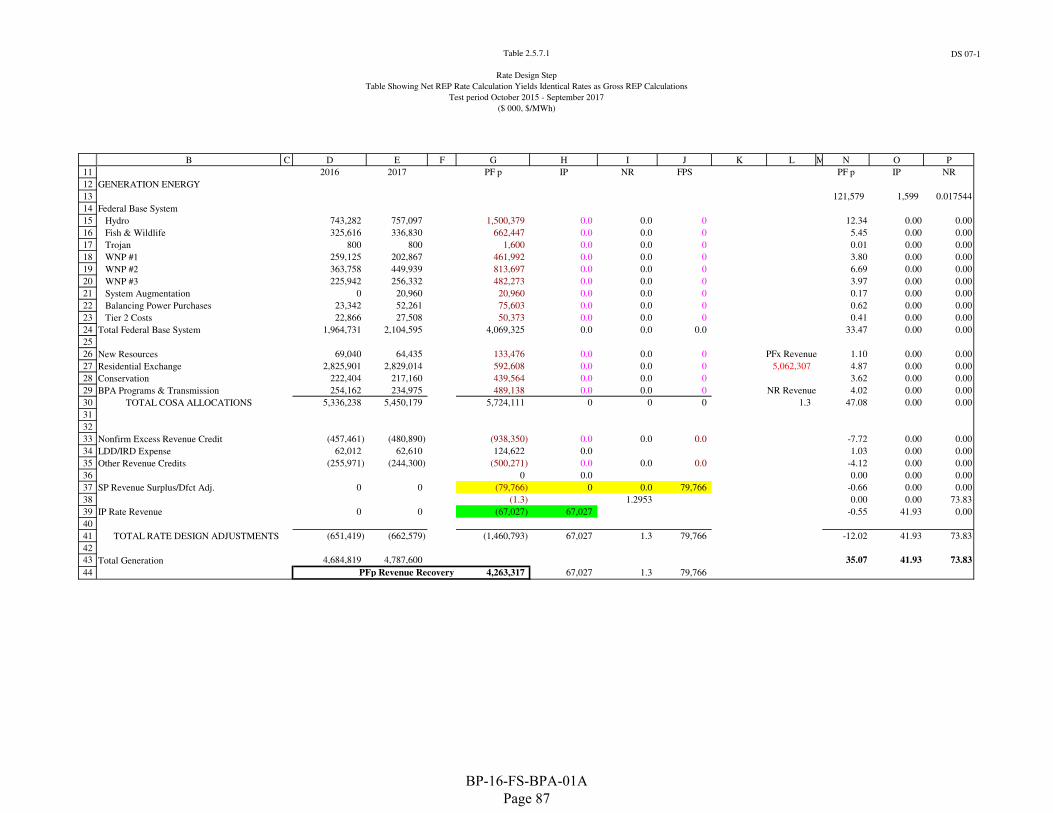
Table 2.5.7.1
Rate Design Step
Table Showing Net REP Rate Calculation Yields Identical Rates as Gross REP Calculations
Test period October 2015 - September 2017
($ 000, $/MWh)
DS 07-1
11
12
13
14
15
16
17
18
19
20
21
22
23
24
25
26
27
28
29
30
31
32
33
34
35
36
37
38
39
40
41
42
43
44
B C D E F G H I J K L M N O P
2016 2017 PF p IP NR FPS PF p IP NR
GENERATION ENERGY
121,579 1,599 0.017544
Federal Base System
Hydro 743,282 757,097 1,500,379 0.0 0.0 0 12.34 0.00 0.00
Fish & Wildlife 325,616 336,830 662,447 0.0 0.0 0 5.45 0.00 0.00
Trojan 800 800 1,600 0.0 0.0 0 0.01 0.00 0.00
WNP #1 259,125 202,867 461,992 0.0 0.0 0 3.80 0.00 0.00
WNP #2 363,758 449,939 813,697 0.0 0.0 0 6.69 0.00 0.00
WNP #3 225,942 256,332 482,273 0.0 0.0 0 3.97 0.00 0.00
System Augmentation 0 20,960 20,960 0.0 0.0 0 0.17 0.00 0.00
Balancing Power Purchases 23,342 52,261 75,603 0.0 0.0 0 0.62 0.00 0.00
Tier 2 Costs 22,866 27,508 50,373 0.0 0.0 0 0.41 0.00 0.00
Total Federal Base System 1,964,731 2,104,595 4,069,325 0.0 0.0 0.0 33.47 0.00 0.00
New Resources 69,040 64,435 133,476 0.0 0.0 0 PFx Revenue 1.10 0.00 0.00
Residential Exchange 2,825,901 2,829,014 592,608 0.0 0.0 0 5,062,307 4.87 0.00 0.00
Conservation 222,404 217,160 439,564 0.0 0.0 0 3.62 0.00 0.00
BPA Programs & Transmission 254,162 234,975 489,138 0.0 0.0 0 NR Revenue 4.02 0.00 0.00
TOTAL COSA ALLOCATIONS 5,336,238 5,450,179 5,724,111 0 0 0 1.3 47.08 0.00 0.00
Nonfirm Excess Revenue Credit (457,461) (480,890) (938,350) 0.0 0.0 0.0 -7.72 0.00 0.00
LDD/IRD Expense 62,012 62,610 124,622 0.0 1.03 0.00 0.00
Other Revenue Credits (255,971) (244,300) (500,271) 0.0 0.0 0.0 -4.12 0.00 0.00
0 0.0 0.00 0.00 0.00
SP Revenue Surplus/Dfct Adj. 0 0 (79,766) 0 0.0 79,766 -0.66 0.00 0.00
(1.3) 1.2953 0.00 0.00 73.83
IP Rate Revenue 0 0 (67,027) 67,027 -0.55 41.93 0.00
TOTAL RATE DESIGN ADJUSTMENTS (651,419) (662,579) (1,460,793) 67,027 1.3 79,766 -12.02 41.93 73.83
Total Generation 4,684,819 4,787,600 4,410,112 35.07 41.93 73.83
PFp Revenue Recovery 4,263,317 67,027 1.3 79,766
BP-16-FS-BPA-01A Page 87
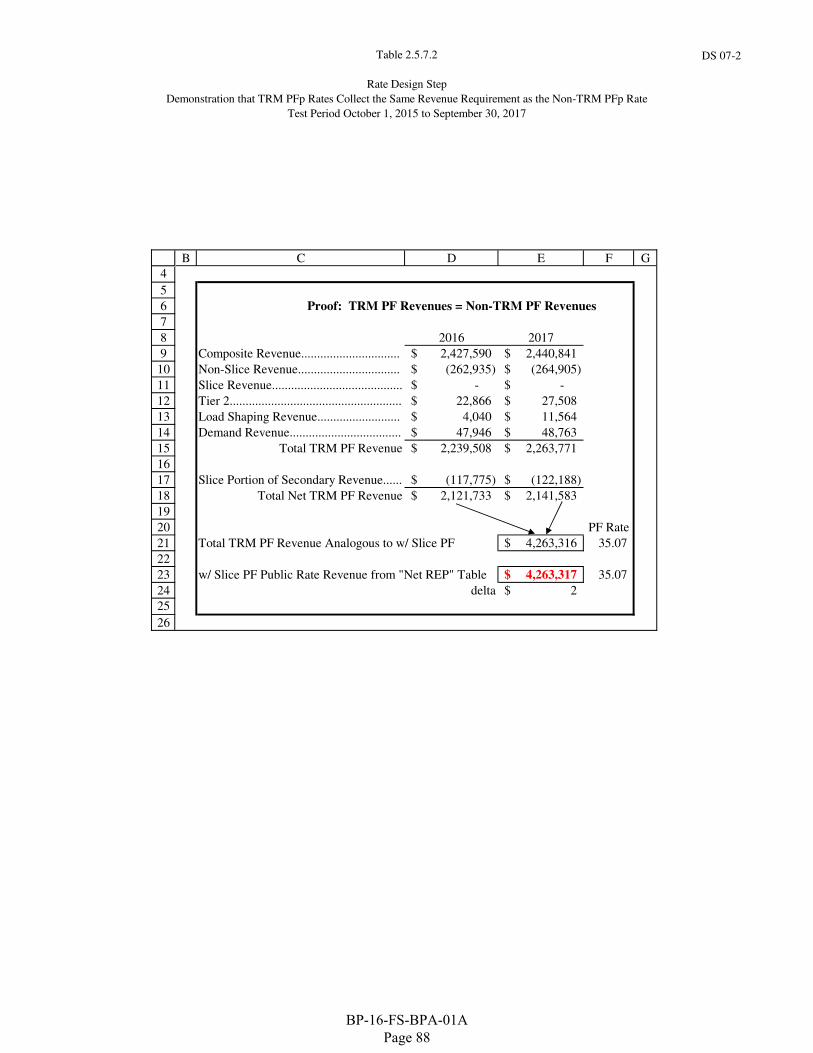
Table 2.5.7.2
Rate Design Step
Demonstration that TRM PFp Rates Collect the Same Revenue Requirement as the Non-TRM PFp Rate
Test Period October 1, 2015 to September 30, 2017
DS 07-2
4
5
6
7
8
9
10
11
12
13
14
15
16
17
18
19
20
21
22
23
24
25
26
B C D E F G
Proof: TRM PF Revenues = Non-TRM PF Revenues
2016 2017
Composite Revenue............................... 2,427,590$ 2,440,841$
Non-Slice Revenue................................ (262,935)$ (264,905)$
Slice Revenue......................................... -$ -$
Tier 2...................................................... 22,866$ 27,508$
Load Shaping Revenue.......................... 4,040$ 11,564$
Demand Revenue................................... 47,946$ 48,763$
Total TRM PF Revenue 2,239,508$ 2,263,771$
Slice Portion of Secondary Revenue...... (117,775)$ (122,188)$
Total Net TRM PF Revenue 2,121,733$ 2,141,583$
PF Rate
Total TRM PF Revenue Analogous to w/ Slice PF 4,263,316$ 35.07
w/ Slice PF Public Rate Revenue from "Net REP" Table 4,263,317$ 35.07
delta 2$
BP-16-FS-BPA-01A Page 88
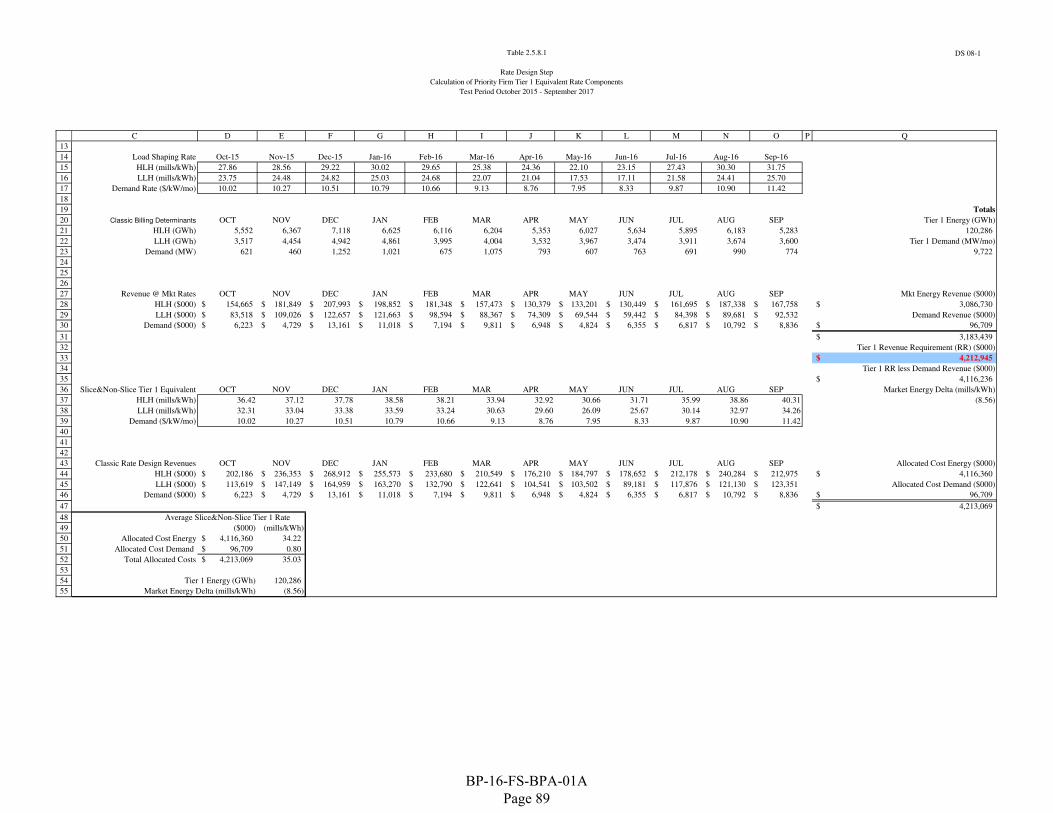
Table 2.5.8.1
Rate Design Step
Calculation of Priority Firm Tier 1 Equivalent Rate Components
Test Period October 2015 - September 2017
DS 08-1
13
14
15
16
17
18
19
20
21
22
23
24
25
26
27
28
29
30
31
32
33
34
35
36
37
38
39
40
41
42
43
44
45
46
47
48
49
50
51
52
53
54
55
C D E F G H I J K L M N O P Q
Load Shaping Rate Oct-15 Nov-15 Dec-15 Jan-16 Feb-16 Mar-16 Apr-16 May-16 Jun-16 Jul-16 Aug-16 Sep-16
HLH (mills/kWh) 27.86 28.56 29.22 30.02 29.65 25.38 24.36 22.10 23.15 27.43 30.30 31.75
LLH (mills/kWh) 23.75 24.48 24.82 25.03 24.68 22.07 21.04 17.53 17.11 21.58 24.41 25.70
Demand Rate ($/kW/mo) 10.02 10.27 10.51 10.79 10.66 9.13 8.76 7.95 8.33 9.87 10.90 11.42
Totals
Classic Billing Determinants OCT NOV DEC JAN FEB MAR APR MAY JUN JUL AUG SEP Tier 1 Energy (GWh)
HLH (GWh) 5,552 6,367 7,118 6,625 6,116 6,204 5,353 6,027 5,634 5,895 6,183 5,283 120,286
LLH (GWh) 3,517 4,454 4,942 4,861 3,995 4,004 3,532 3,967 3,474 3,911 3,674 3,600 Tier 1 Demand (MW/mo)
Demand (MW) 621 460 1,252 1,021 675 1,075 793 607 763 691 990 774 9,722
Revenue @ Mkt Rates OCT NOV DEC JAN FEB MAR APR MAY JUN JUL AUG SEP Mkt Energy Revenue ($000)
HLH ($000) 154,665$ 181,849$ 207,993$ 198,852$ 181,348$ 157,473$ 130,379$ 133,201$ 130,449$ 161,695$ 187,338$ 167,758$ 3,086,730$
LLH ($000) 83,518$ 109,026$ 122,657$ 121,663$ 98,594$ 88,367$ 74,309$ 69,544$ 59,442$ 84,398$ 89,681$ 92,532$ Demand Revenue ($000)
Demand ($000) 6,223$ 4,729$ 13,161$ 11,018$ 7,194$ 9,811$ 6,948$ 4,824$ 6,355$ 6,817$ 10,792$ 8,836$ 96,709$
3,183,439$
Tier 1 Revenue Requirement (RR) ($000)
4,212,945$
Tier 1 RR less Demand Revenue ($000)
4,116,236$
Slice&Non-Slice Tier 1 Equivalent OCT NOV DEC JAN FEB MAR APR MAY JUN JUL AUG SEP Market Energy Delta (mills/kWh)
HLH (mills/kWh) 36.42 37.12 37.78 38.58 38.21 33.94 32.92 30.66 31.71 35.99 38.86 40.31 (8.56)
LLH (mills/kWh) 32.31 33.04 33.38 33.59 33.24 30.63 29.60 26.09 25.67 30.14 32.97 34.26
Demand ($/kW/mo) 10.02 10.27 10.51 10.79 10.66 9.13 8.76 7.95 8.33 9.87 10.90 11.42
Classic Rate Design Revenues OCT NOV DEC JAN FEB MAR APR MAY JUN JUL AUG SEP Allocated Cost Energy ($000)
HLH ($000) 202,186$ 236,353$ 268,912$ 255,573$ 233,680$ 210,549$ 176,210$ 184,797$ 178,652$ 212,178$ 240,284$ 212,975$ 4,116,360$
LLH ($000) 113,619$ 147,149$ 164,959$ 163,270$ 132,790$ 122,641$ 104,541$ 103,502$ 89,181$ 117,876$ 121,130$ 123,351$ Allocated Cost Demand ($000)
Demand ($000) 6,223$ 4,729$ 13,161$ 11,018$ 7,194$ 9,811$ 6,948$ 4,824$ 6,355$ 6,817$ 10,792$ 8,836$ 96,709$
4,213,069$
Average Slice&Non-Slice Tier 1 Rate
($000) (mills/kWh)
Allocated Cost Energy 4,116,360$ 34.22
Allocated Cost Demand 96,709$ 0.80
Total Allocated Costs 4,213,069$ 35.03
Tier 1 Energy (GWh) 120,286
Market Energy Delta (mills/kWh) (8.56)
BP-16-FS-BPA-01A Page 89
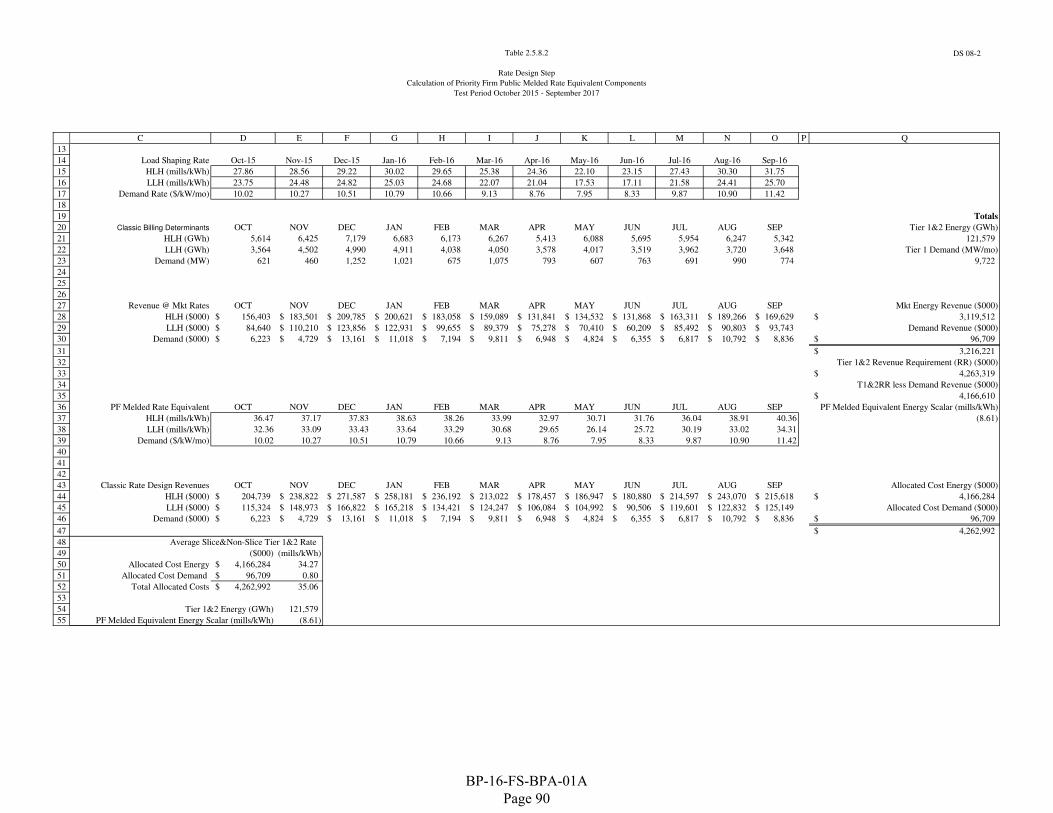
Table 2.5.8.2
Rate Design Step
Calculation of Priority Firm Public Melded Rate Equivalent Components
Test Period October 2015 - September 2017
DS 08-2
13
14
15
16
17
18
19
20
21
22
23
24
25
26
27
28
29
30
31
32
33
34
35
36
37
38
39
40
41
42
43
44
45
46
47
48
49
50
51
52
53
54
55
C D E F G H I J K L M N O P Q
Load Shaping Rate Oct-15 Nov-15 Dec-15 Jan-16 Feb-16 Mar-16 Apr-16 May-16 Jun-16 Jul-16 Aug-16 Sep-16
HLH (mills/kWh) 27.86 28.56 29.22 30.02 29.65 25.38 24.36 22.10 23.15 27.43 30.30 31.75
LLH (mills/kWh) 23.75 24.48 24.82 25.03 24.68 22.07 21.04 17.53 17.11 21.58 24.41 25.70
Demand Rate ($/kW/mo) 10.02 10.27 10.51 10.79 10.66 9.13 8.76 7.95 8.33 9.87 10.90 11.42
Totals
Classic Billing Determinants OCT NOV DEC JAN FEB MAR APR MAY JUN JUL AUG SEP Tier 1&2 Energy (GWh)
HLH (GWh) 5,614 6,425 7,179 6,683 6,173 6,267 5,413 6,088 5,695 5,954 6,247 5,342 121,579
LLH (GWh) 3,564 4,502 4,990 4,911 4,038 4,050 3,578 4,017 3,519 3,962 3,720 3,648 Tier 1 Demand (MW/mo)
Demand (MW) 621 460 1,252 1,021 675 1,075 793 607 763 691 990 774 9,722
Revenue @ Mkt Rates OCT NOV DEC JAN FEB MAR APR MAY JUN JUL AUG SEP Mkt Energy Revenue ($000)
HLH ($000) 156,403$ 183,501$ 209,785$ 200,621$ 183,058$ 159,089$ 131,841$ 134,532$ 131,868$ 163,311$ 189,266$ 169,629$ 3,119,512$
LLH ($000) 84,640$ 110,210$ 123,856$ 122,931$ 99,655$ 89,379$ 75,278$ 70,410$ 60,209$ 85,492$ 90,803$ 93,743$ Demand Revenue ($000)
Demand ($000) 6,223$ 4,729$ 13,161$ 11,018$ 7,194$ 9,811$ 6,948$ 4,824$ 6,355$ 6,817$ 10,792$ 8,836$ 96,709$
3,216,221$
Tier 1&2 Revenue Requirement (RR) ($000)
4,263,319$
T1&2RR less Demand Revenue ($000)
4,166,610$
PF Melded Rate Equivalent OCT NOV DEC JAN FEB MAR APR MAY JUN JUL AUG SEP PF Melded Equivalent Energy Scalar (mills/kWh)
HLH (mills/kWh) 36.47 37.17 37.83 38.63 38.26 33.99 32.97 30.71 31.76 36.04 38.91 40.36 (8.61)
LLH (mills/kWh) 32.36 33.09 33.43 33.64 33.29 30.68 29.65 26.14 25.72 30.19 33.02 34.31
Demand ($/kW/mo) 10.02 10.27 10.51 10.79 10.66 9.13 8.76 7.95 8.33 9.87 10.90 11.42
Classic Rate Design Revenues OCT NOV DEC JAN FEB MAR APR MAY JUN JUL AUG SEP Allocated Cost Energy ($000)
HLH ($000) 204,739$ 238,822$ 271,587$ 258,181$ 236,192$ 213,022$ 178,457$ 186,947$ 180,880$ 214,597$ 243,070$ 215,618$ 4,166,284$
LLH ($000) 115,324$ 148,973$ 166,822$ 165,218$ 134,421$ 124,247$ 106,084$ 104,992$ 90,506$ 119,601$ 122,832$ 125,149$ Allocated Cost Demand ($000)
Demand ($000) 6,223$ 4,729$ 13,161$ 11,018$ 7,194$ 9,811$ 6,948$ 4,824$ 6,355$ 6,817$ 10,792$ 8,836$ 96,709$
4,262,992$
Average Slice&Non-Slice Tier 1&2 Rate
($000) (mills/kWh)
Allocated Cost Energy 4,166,284$ 34.27
Allocated Cost Demand 96,709$ 0.80
Total Allocated Costs 4,262,992$ 35.06
Tier 1&2 Energy (GWh) 121,579
PF Melded Equivalent Energy Scalar (mills/kWh) (8.61)
BP-16-FS-BPA-01A Page 90
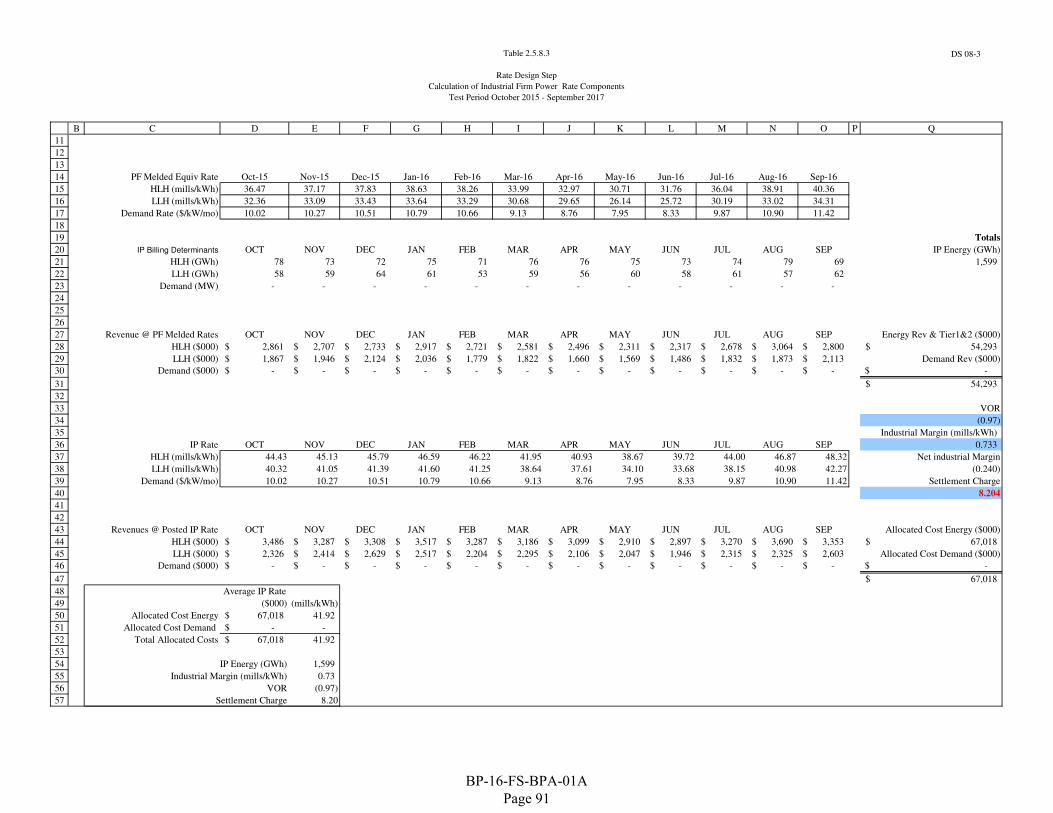
Table 2.5.8.3
Rate Design Step
Calculation of Industrial Firm Power Rate Components
Test Period October 2015 - September 2017
DS 08-3
11
12
13
14
15
16
17
18
19
20
21
22
23
24
25
26
27
28
29
30
31
32
33
34
35
36
37
38
39
40
41
42
43
44
45
46
47
48
49
50
51
52
53
54
55
56
57
B C D E F G H I J K L M N O P Q
PF Melded Equiv Rate Oct-15 Nov-15 Dec-15 Jan-16 Feb-16 Mar-16 Apr-16 May-16 Jun-16 Jul-16 Aug-16 Sep-16
HLH (mills/kWh) 36.47 37.17 37.83 38.63 38.26 33.99 32.97 30.71 31.76 36.04 38.91 40.36
LLH (mills/kWh) 32.36 33.09 33.43 33.64 33.29 30.68 29.65 26.14 25.72 30.19 33.02 34.31
Demand Rate ($/kW/mo) 10.02 10.27 10.51 10.79 10.66 9.13 8.76 7.95 8.33 9.87 10.90 11.42
Totals
IP Billing Determinants OCT NOV DEC JAN FEB MAR APR MAY JUN JUL AUG SEP IP Energy (GWh)
HLH (GWh) 78 73 72 75 71 76 76 75 73 74 79 69 1,599
LLH (GWh) 58 59 64 61 53 59 56 60 58 61 57 62
Demand (MW) - - - - - - - - - - - -
Revenue @ PF Melded Rates OCT NOV DEC JAN FEB MAR APR MAY JUN JUL AUG SEP Energy Rev & Tier1&2 ($000)
HLH ($000) 2,861$ 2,707$ 2,733$ 2,917$ 2,721$ 2,581$ 2,496$ 2,311$ 2,317$ 2,678$ 3,064$ 2,800$ 54,293$
LLH ($000) 1,867$ 1,946$ 2,124$ 2,036$ 1,779$ 1,822$ 1,660$ 1,569$ 1,486$ 1,832$ 1,873$ 2,113$ Demand Rev ($000)
Demand ($000) -$ -$ -$ -$ -$ -$ -$ -$ -$ -$ -$ -$ -$
54,293$
VOR
(0.97)
Industrial Margin (mills/kWh)
IP Rate OCT NOV DEC JAN FEB MAR APR MAY JUN JUL AUG SEP 0.733
HLH (mills/kWh) 44.43 45.13 45.79 46.59 46.22 41.95 40.93 38.67 39.72 44.00 46.87 48.32 Net industrial Margin
LLH (mills/kWh) 40.32 41.05 41.39 41.60 41.25 38.64 37.61 34.10 33.68 38.15 40.98 42.27 (0.240)
Demand ($/kW/mo) 10.02 10.27 10.51 10.79 10.66 9.13 8.76 7.95 8.33 9.87 10.90 11.42 Settlement Charge
8.204
Revenues @ Posted IP Rate OCT NOV DEC JAN FEB MAR APR MAY JUN JUL AUG SEP Allocated Cost Energy ($000)
HLH ($000) 3,486$ 3,287$ 3,308$ 3,517$ 3,287$ 3,186$ 3,099$ 2,910$ 2,897$ 3,270$ 3,690$ 3,353$ 67,018$
LLH ($000) 2,326$ 2,414$ 2,629$ 2,517$ 2,204$ 2,295$ 2,106$ 2,047$ 1,946$ 2,315$ 2,325$ 2,603$ Allocated Cost Demand ($000)
Demand ($000) -$ -$ -$ -$ -$ -$ -$ -$ -$ -$ -$ -$ -$
67,018$
Average IP Rate
($000) (mills/kWh)
Allocated Cost Energy 67,018$ 41.92
Allocated Cost Demand -$ -
Total Allocated Costs 67,018$ 41.92
IP Energy (GWh) 1,599
Industrial Margin (mills/kWh) 0.73
VOR (0.97)
Settlement Charge 8.20
BP-16-FS-BPA-01A Page 91
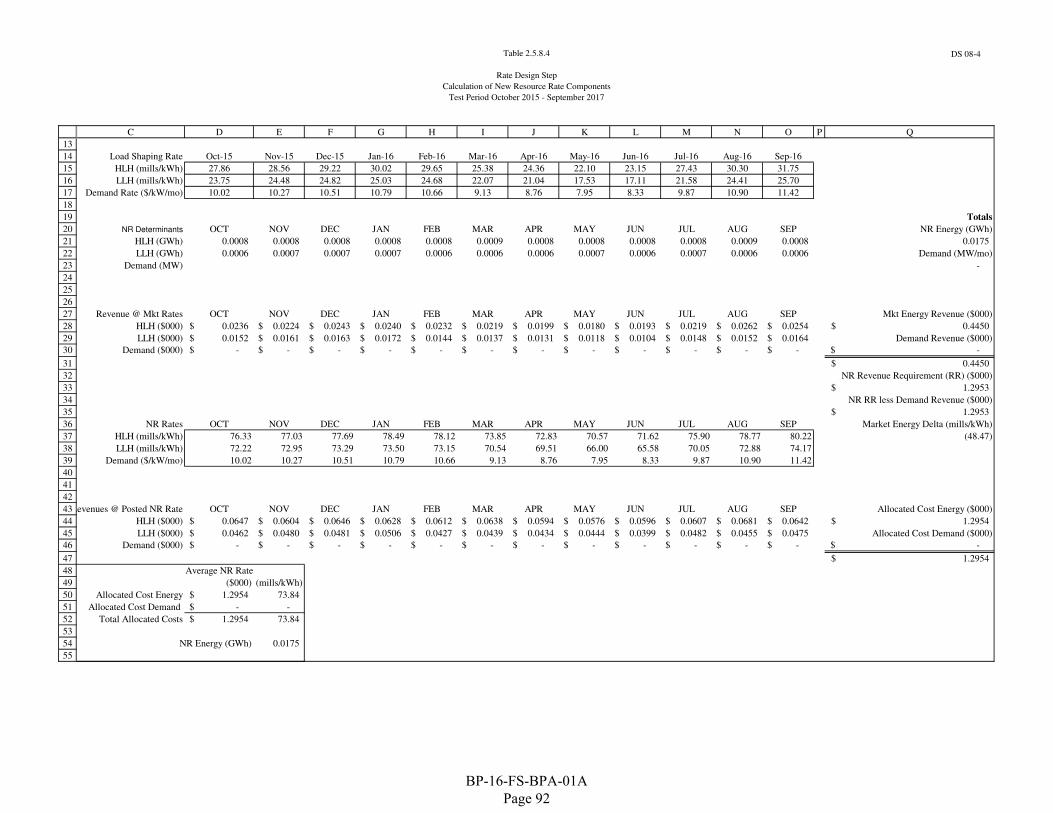
Table 2.5.8.4
Rate Design Step
Calculation of New Resource Rate Components
Test Period October 2015 - September 2017
DS 08-4
13
14
15
16
17
18
19
20
21
22
23
24
25
26
27
28
29
30
31
32
33
34
35
36
37
38
39
40
41
42
43
44
45
46
47
48
49
50
51
52
53
54
55
C D E F G H I J K L M N O P Q
Load Shaping Rate Oct-15 Nov-15 Dec-15 Jan-16 Feb-16 Mar-16 Apr-16 May-16 Jun-16 Jul-16 Aug-16 Sep-16
HLH (mills/kWh) 27.86 28.56 29.22 30.02 29.65 25.38 24.36 22.10 23.15 27.43 30.30 31.75
LLH (mills/kWh) 23.75 24.48 24.82 25.03 24.68 22.07 21.04 17.53 17.11 21.58 24.41 25.70
Demand Rate ($/kW/mo) 10.02 10.27 10.51 10.79 10.66 9.13 8.76 7.95 8.33 9.87 10.90 11.42
Totals
NR Determinants OCT NOV DEC JAN FEB MAR APR MAY JUN JUL AUG SEP NR Energy (GWh)
HLH (GWh) 0.0008 0.0008 0.0008 0.0008 0.0008 0.0009 0.0008 0.0008 0.0008 0.0008 0.0009 0.0008 0.0175
LLH (GWh) 0.0006 0.0007 0.0007 0.0007 0.0006 0.0006 0.0006 0.0007 0.0006 0.0007 0.0006 0.0006 Demand (MW/mo)
Demand (MW) -
Revenue @ Mkt Rates OCT NOV DEC JAN FEB MAR APR MAY JUN JUL AUG SEP Mkt Energy Revenue ($000)
HLH ($000) 0.0236$ 0.0224$ 0.0243$ 0.0240$ 0.0232$ 0.0219$ 0.0199$ 0.0180$ 0.0193$ 0.0219$ 0.0262$ 0.0254$ 0.4450$
LLH ($000) 0.0152$ 0.0161$ 0.0163$ 0.0172$ 0.0144$ 0.0137$ 0.0131$ 0.0118$ 0.0104$ 0.0148$ 0.0152$ 0.0164$ Demand Revenue ($000)
Demand ($000) -$ -$ -$ -$ -$ -$ -$ -$ -$ -$ -$ -$ -$
0.4450$
NR Revenue Requirement (RR) ($000)
1.2953$
NR RR less Demand Revenue ($000)
1.2953$
NR Rates OCT NOV DEC JAN FEB MAR APR MAY JUN JUL AUG SEP Market Energy Delta (mills/kWh)
HLH (mills/kWh) 76.33 77.03 77.69 78.49 78.12 73.85 72.83 70.57 71.62 75.90 78.77 80.22 (48.47)
LLH (mills/kWh) 72.22 72.95 73.29 73.50 73.15 70.54 69.51 66.00 65.58 70.05 72.88 74.17
Demand ($/kW/mo) 10.02 10.27 10.51 10.79 10.66 9.13 8.76 7.95 8.33 9.87 10.90 11.42
Revenues @ Posted NR Rate OCT NOV DEC JAN FEB MAR APR MAY JUN JUL AUG SEP Allocated Cost Energy ($000)
HLH ($000) 0.0647$ 0.0604$ 0.0646$ 0.0628$ 0.0612$ 0.0638$ 0.0594$ 0.0576$ 0.0596$ 0.0607$ 0.0681$ 0.0642$ 1.2954$
LLH ($000) 0.0462$ 0.0480$ 0.0481$ 0.0506$ 0.0427$ 0.0439$ 0.0434$ 0.0444$ 0.0399$ 0.0482$ 0.0455$ 0.0475$ Allocated Cost Demand ($000)
Demand ($000) -$ -$ -$ -$ -$ -$ -$ -$ -$ -$ -$ -$ -$
1.2954$
Average NR Rate
($000) (mills/kWh)
Allocated Cost Energy 1.2954$ 73.84
Allocated Cost Demand -$ -
Total Allocated Costs 1.2954$ 73.84
NR Energy (GWh) 0.0175
BP-16-FS-BPA-01A Page 92
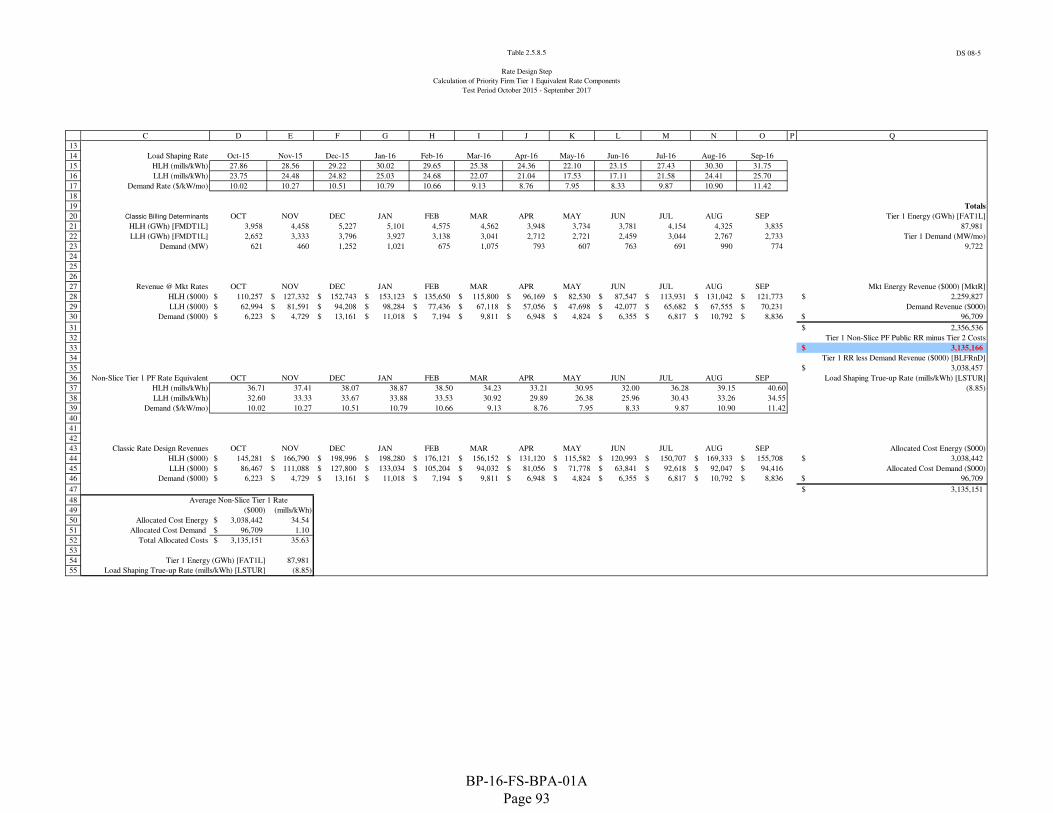
Table 2.5.8.5
Rate Design Step
Calculation of Priority Firm Tier 1 Equivalent Rate Components
Test Period October 2015 - September 2017
DS 08-5
13
14
15
16
17
18
19
20
21
22
23
24
25
26
27
28
29
30
31
32
33
34
35
36
37
38
39
40
41
42
43
44
45
46
47
48
49
50
51
52
53
54
55
C D E F G H I J K L M N O P Q
Load Shaping Rate Oct-15 Nov-15 Dec-15 Jan-16 Feb-16 Mar-16 Apr-16 May-16 Jun-16 Jul-16 Aug-16 Sep-16
HLH (mills/kWh) 27.86 28.56 29.22 30.02 29.65 25.38 24.36 22.10 23.15 27.43 30.30 31.75
LLH (mills/kWh) 23.75 24.48 24.82 25.03 24.68 22.07 21.04 17.53 17.11 21.58 24.41 25.70
Demand Rate ($/kW/mo) 10.02 10.27 10.51 10.79 10.66 9.13 8.76 7.95 8.33 9.87 10.90 11.42
Totals
Classic Billing Determinants OCT NOV DEC JAN FEB MAR APR MAY JUN JUL AUG SEP Tier 1 Energy (GWh) [FAT1L]
HLH (GWh) [FMDT1L] 3,958 4,458 5,227 5,101 4,575 4,562 3,948 3,734 3,781 4,154 4,325 3,835 87,981
LLH (GWh) [FMDT1L] 2,652 3,333 3,796 3,927 3,138 3,041 2,712 2,721 2,459 3,044 2,767 2,733 Tier 1 Demand (MW/mo)
Demand (MW) 621 460 1,252 1,021 675 1,075 793 607 763 691 990 774 9,722
Revenue @ Mkt Rates OCT NOV DEC JAN FEB MAR APR MAY JUN JUL AUG SEP Mkt Energy Revenue ($000) [MktR]
HLH ($000) 110,257$ 127,332$ 152,743$ 153,123$ 135,650$ 115,800$ 96,169$ 82,530$ 87,547$ 113,931$ 131,042$ 121,773$ 2,259,827$
LLH ($000) 62,994$ 81,591$ 94,208$ 98,284$ 77,436$ 67,118$ 57,056$ 47,698$ 42,077$ 65,682$ 67,555$ 70,231$ Demand Revenue ($000)
Demand ($000) 6,223$ 4,729$ 13,161$ 11,018$ 7,194$ 9,811$ 6,948$ 4,824$ 6,355$ 6,817$ 10,792$ 8,836$ 96,709$
2,356,536$
Tier 1 Non-Slice PF Public RR minus Tier 2 Costs
3,135,166$
Tier 1 RR less Demand Revenue ($000) [BLFRnD]
3,038,457$
Non-Slice Tier 1 PF Rate Equivalent OCT NOV DEC JAN FEB MAR APR MAY JUN JUL AUG SEP Load Shaping True-up Rate (mills/kWh) [LSTUR]
HLH (mills/kWh) 36.71 37.41 38.07 38.87 38.50 34.23 33.21 30.95 32.00 36.28 39.15 40.60 (8.85)
LLH (mills/kWh) 32.60 33.33 33.67 33.88 33.53 30.92 29.89 26.38 25.96 30.43 33.26 34.55
Demand ($/kW/mo) 10.02 10.27 10.51 10.79 10.66 9.13 8.76 7.95 8.33 9.87 10.90 11.42
Classic Rate Design Revenues OCT NOV DEC JAN FEB MAR APR MAY JUN JUL AUG SEP Allocated Cost Energy ($000)
HLH ($000) 145,281$ 166,790$ 198,996$ 198,280$ 176,121$ 156,152$ 131,120$ 115,582$ 120,993$ 150,707$ 169,333$ 155,708$ 3,038,442$
LLH ($000) 86,467$ 111,088$ 127,800$ 133,034$ 105,204$ 94,032$ 81,056$ 71,778$ 63,841$ 92,618$ 92,047$ 94,416$ Allocated Cost Demand ($000)
Demand ($000) 6,223$ 4,729$ 13,161$ 11,018$ 7,194$ 9,811$ 6,948$ 4,824$ 6,355$ 6,817$ 10,792$ 8,836$ 96,709$
3,135,151$
Average Non-Slice Tier 1 Rate
($000) (mills/kWh)
Allocated Cost Energy 3,038,442$ 34.54
Allocated Cost Demand 96,709$ 1.10
Total Allocated Costs 3,135,151$ 35.63
Tier 1 Energy (GWh) [FAT1L] 87,981
Load Shaping True-up Rate (mills/kWh) [LSTUR] (8.85)
BP-16-FS-BPA-01A Page 93
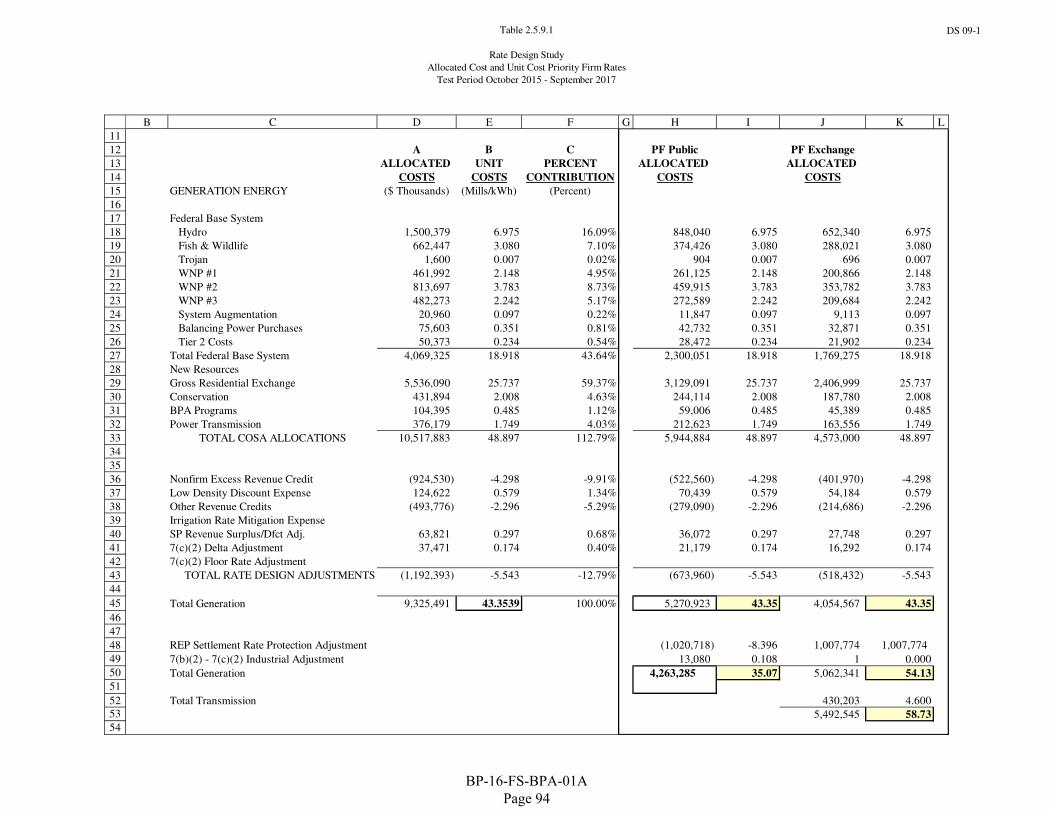
Table 2.5.9.1
Rate Design Study
Allocated Cost and Unit Cost Priority Firm Rates
Test Period October 2015 - September 2017
DS 09-1
11
12
13
14
15
16
17
18
19
20
21
22
23
24
25
26
27
28
29
30
31
32
33
34
35
36
37
38
39
40
41
42
43
44
45
46
47
48
49
50
51
52
53
54
B C D E F G H I J K L
A B C PF Public PF Exchange
ALLOCATED UNIT PERCENT ALLOCATED ALLOCATED
COSTS COSTS CONTRIBUTION COSTS COSTS
GENERATION ENERGY ($ Thousands) (Mills/kWh) (Percent)
Federal Base System
Hydro 1,500,379 6.975 16.09% 848,040 6.975 652,340 6.975
Fish & Wildlife 662,447 3.080 7.10% 374,426 3.080 288,021 3.080
Trojan 1,600 0.007 0.02% 904 0.007 696 0.007
WNP #1 461,992 2.148 4.95% 261,125 2.148 200,866 2.148
WNP #2 813,697 3.783 8.73% 459,915 3.783 353,782 3.783
WNP #3 482,273 2.242 5.17% 272,589 2.242 209,684 2.242
System Augmentation 20,960 0.097 0.22% 11,847 0.097 9,113 0.097
Balancing Power Purchases 75,603 0.351 0.81% 42,732 0.351 32,871 0.351
Tier 2 Costs 50,373 0.234 0.54% 28,472 0.234 21,902 0.234
Total Federal Base System 4,069,325 18.918 43.64% 2,300,051 18.918 1,769,275 18.918
New Resources
Gross Residential Exchange 5,536,090 25.737 59.37% 3,129,091 25.737 2,406,999 25.737
Conservation 431,894 2.008 4.63% 244,114 2.008 187,780 2.008
BPA Programs 104,395 0.485 1.12% 59,006 0.485 45,389 0.485
Power Transmission 376,179 1.749 4.03% 212,623 1.749 163,556 1.749
TOTAL COSA ALLOCATIONS 10,517,883 48.897 112.79% 5,944,884 48.897 4,573,000 48.897
Nonfirm Excess Revenue Credit (924,530) -4.298 -9.91% (522,560) -4.298 (401,970) -4.298
Low Density Discount Expense 124,622 0.579 1.34% 70,439 0.579 54,184 0.579
Other Revenue Credits (493,776) -2.296 -5.29% (279,090) -2.296 (214,686) -2.296
Irrigation Rate Mitigation Expense
SP Revenue Surplus/Dfct Adj. 63,821 0.297 0.68% 36,072 0.297 27,748 0.297
7(c)(2) Delta Adjustment 37,471 0.174 0.40% 21,179 0.174 16,292 0.174
7(c)(2) Floor Rate Adjustment
TOTAL RATE DESIGN ADJUSTMENTS (1,192,393) -5.543 -12.79% (673,960) -5.543 (518,432) -5.543
Total Generation 9,325,491 43.3539 100.00% 5,270,923 43.35 4,054,567 43.35
REP Settlement Rate Protection Adjustment (1,020,718) -8.396 1,007,774 1,007,774
7(b)(2) - 7(c)(2) Industrial Adjustment 13,080 0.108 1 0.000
Total Generation 4,263,285 35.07 5,062,341 54.13
Total Transmission 430,203 4.600
5,492,545 58.73
BP-16-FS-BPA-01A Page 94
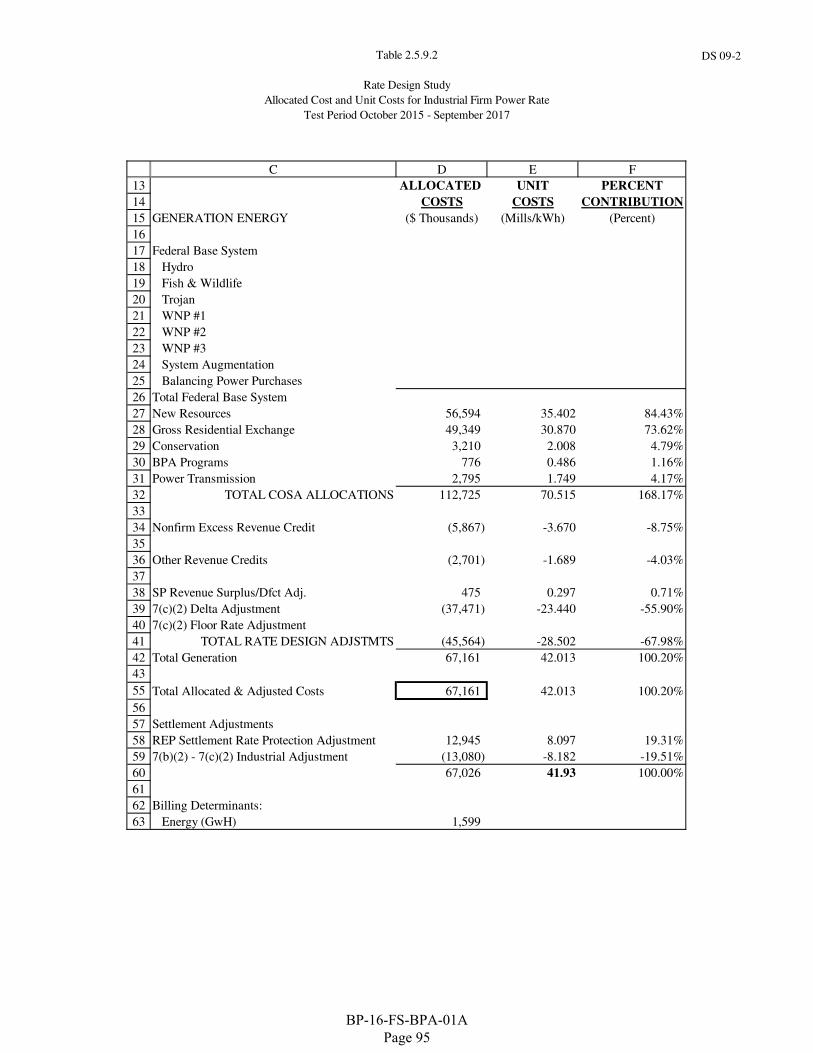
Table 2.5.9.2
Rate Design Study
Allocated Cost and Unit Costs for Industrial Firm Power Rate
Test Period October 2015 - September 2017
DS 09-2
13
14
15
16
17
18
19
20
21
22
23
24
25
26
27
28
29
30
31
32
33
34
35
36
37
38
39
40
41
42
43
55
56
57
58
59
60
61
62
63
C D E F
ALLOCATED UNIT PERCENT
COSTS COSTS CONTRIBUTION
GENERATION ENERGY ($ Thousands) (Mills/kWh) (Percent)
Federal Base System
Hydro
Fish & Wildlife
Trojan
WNP #1
WNP #2
WNP #3
System Augmentation
Balancing Power Purchases
Total Federal Base System
New Resources 56,594 35.402 84.43%
Gross Residential Exchange 49,349 30.870 73.62%
Conservation 3,210 2.008 4.79%
BPA Programs 776 0.486 1.16%
Power Transmission 2,795 1.749 4.17%
TOTAL COSA ALLOCATIONS 112,725 70.515 168.17%
Nonfirm Excess Revenue Credit (5,867) -3.670 -8.75%
Other Revenue Credits (2,701) -1.689 -4.03%
SP Revenue Surplus/Dfct Adj. 475 0.297 0.71%
7(c)(2) Delta Adjustment (37,471) -23.440 -55.90%
7(c)(2) Floor Rate Adjustment
TOTAL RATE DESIGN ADJSTMTS (45,564) -28.502 -67.98%
Total Generation 67,161 42.013 100.20%
Total Allocated & Adjusted Costs 67,161 42.013 100.20%
Settlement Adjustments
REP Settlement Rate Protection Adjustment 12,945 8.097 19.31%
7(b)(2) - 7(c)(2) Industrial Adjustment (13,080) -8.182 -19.51%
67,026 41.93 100.00%
Billing Determinants:
Energy (GwH) 1,599
BP-16-FS-BPA-01A Page 95
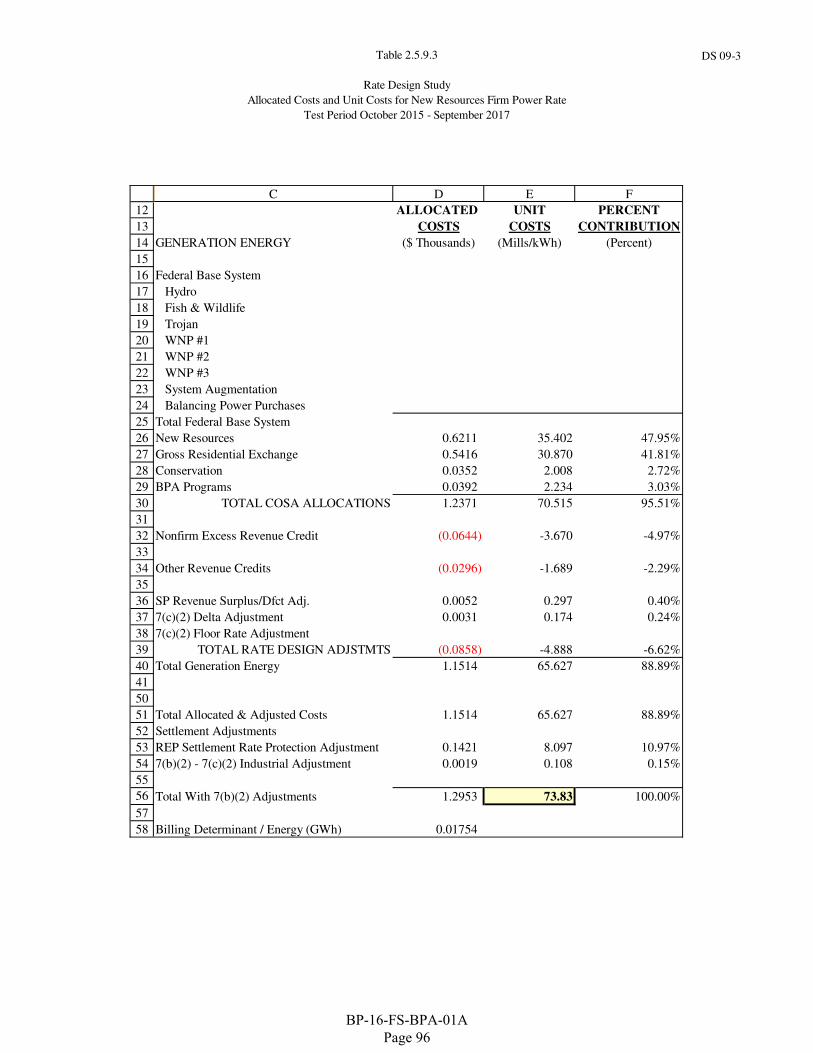
Table 2.5.9.3
Rate Design Study
Allocated Costs and Unit Costs for New Resources Firm Power Rate
Test Period October 2015 - September 2017
DS 09-3
12
13
14
15
16
17
18
19
20
21
22
23
24
25
26
27
28
29
30
31
32
33
34
35
36
37
38
39
40
41
50
51
52
53
54
55
56
57
58
C D E F
ALLOCATED UNIT PERCENT
COSTS COSTS CONTRIBUTION
GENERATION ENERGY ($ Thousands) (Mills/kWh) (Percent)
Federal Base System
Hydro
Fish & Wildlife
Trojan
WNP #1
WNP #2
WNP #3
System Augmentation
Balancing Power Purchases
Total Federal Base System
New Resources 0.6211 35.402 47.95%
Gross Residential Exchange 0.5416 30.870 41.81%
Conservation 0.0352 2.008 2.72%
BPA Programs 0.0392 2.234 3.03%
TOTAL COSA ALLOCATIONS 1.2371 70.515 95.51%
Nonfirm Excess Revenue Credit (0.0644) -3.670 -4.97%
Other Revenue Credits (0.0296) -1.689 -2.29%
SP Revenue Surplus/Dfct Adj. 0.0052 0.297 0.40%
7(c)(2) Delta Adjustment 0.0031 0.174 0.24%
7(c)(2) Floor Rate Adjustment
TOTAL RATE DESIGN ADJSTMTS (0.0858) -4.888 -6.62%
Total Generation Energy 1.1514 65.627 88.89%
Total Allocated & Adjusted Costs 1.1514 65.627 88.89%
Settlement Adjustments
REP Settlement Rate Protection Adjustment 0.1421 8.097 10.97%
7(b)(2) - 7(c)(2) Industrial Adjustment 0.0019 0.108 0.15%
Total With 7(b)(2) Adjustments 1.2953 73.83 100.00%
Billing Determinant / Energy (GWh) 0.01754
BP-16-FS-BPA-01A Page 96
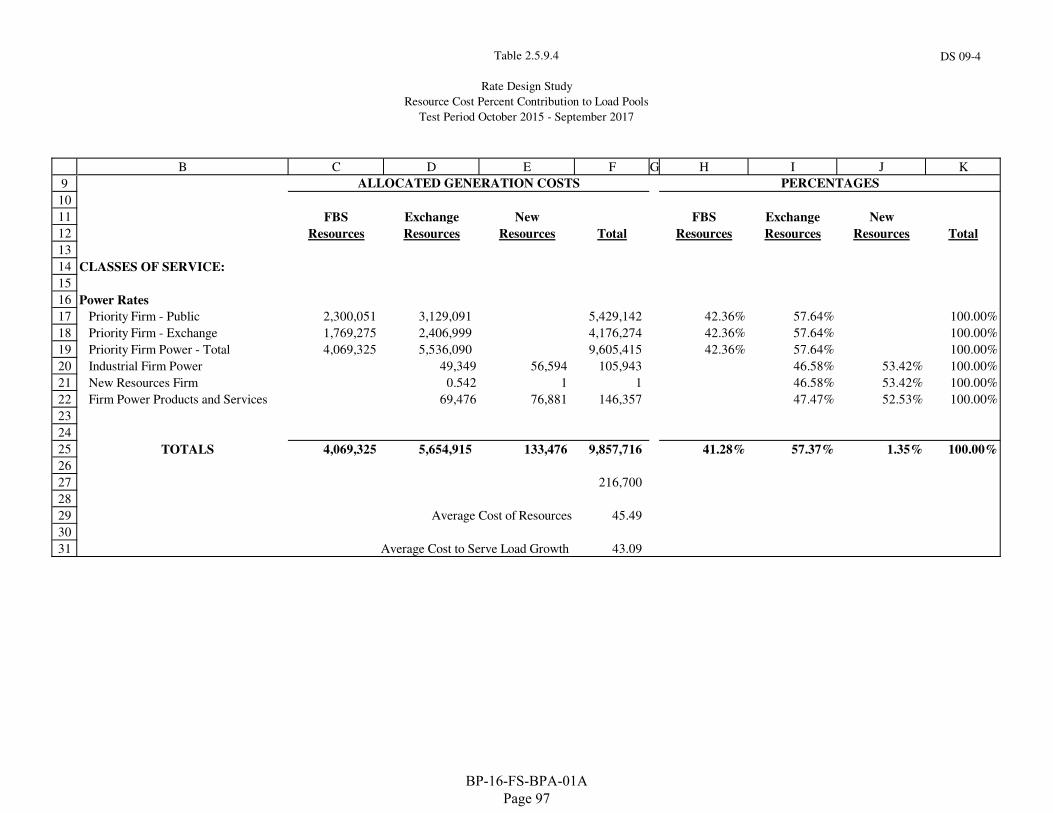
Table 2.5.9.4
Rate Design Study
Resource Cost Percent Contribution to Load Pools
Test Period October 2015 - September 2017
DS 09-4
9
10
11
12
13
14
15
16
17
18
19
20
21
22
23
24
25
26
27
28
29
30
31
B C D E F G H I J K
FBS Exchange New FBS Exchange New
Resources Resources Resources Total Resources Resources Resources Total
CLASSES OF SERVICE:
Power Rates
Priority Firm - Public 2,300,051 3,129,091 5,429,142 42.36% 57.64% 100.00%
Priority Firm - Exchange 1,769,275 2,406,999 4,176,274 42.36% 57.64% 100.00%
Priority Firm Power - Total 4,069,325 5,536,090 9,605,415 42.36% 57.64% 100.00%
Industrial Firm Power 49,349 56,594 105,943 46.58% 53.42% 100.00%
New Resources Firm 0.542 1 1 46.58% 53.42% 100.00%
Firm Power Products and Services 69,476 76,881 146,357 47.47% 52.53% 100.00%
TOTALS 4,069,325 5,654,915 133,476 9,857,716 41.28% 57.37% 1.35% 100.00%
216,700
Average Cost of Resources 45.49
Average Cost to Serve Load Growth 43.09
PERCENTAGESALLOCATED GENERATION COSTS
BP-16-FS-BPA-01A Page 97

This page intentionally left blank
BP-16-FS-BPA-01A Page 98

SECTION 3: RATE DESIGN
BP-16-FS-BPA-01A Page 99
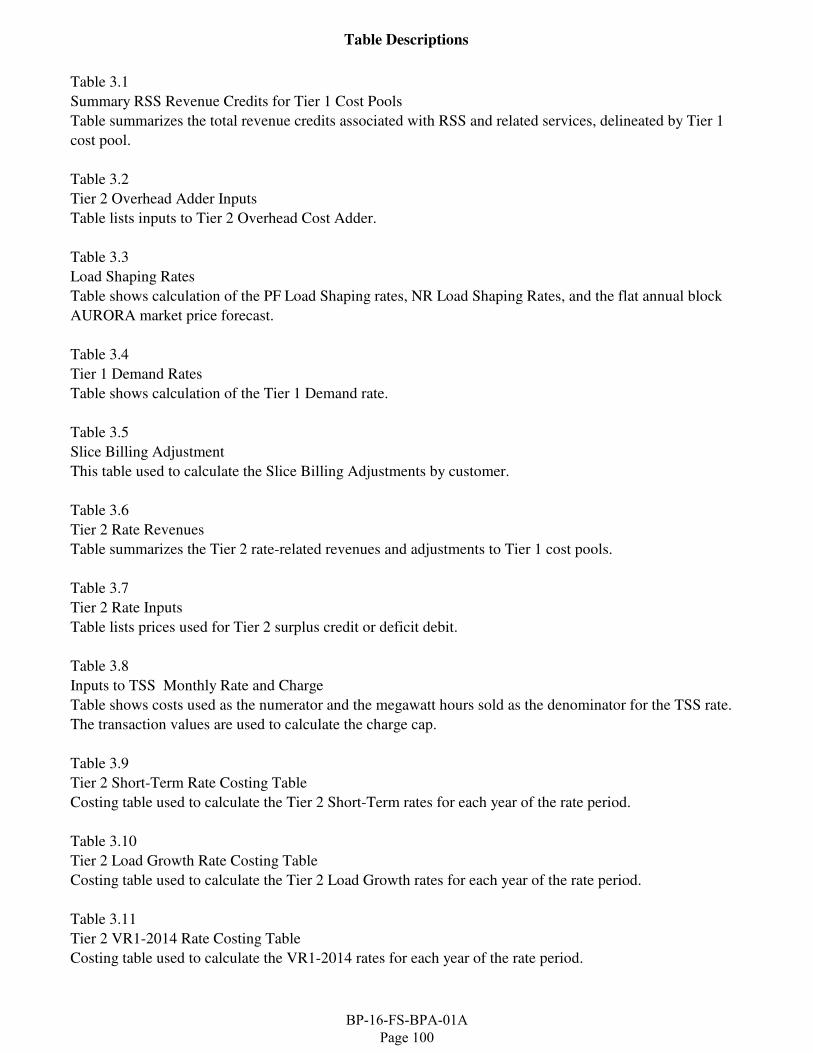
Table Descriptions
Table 3.1
Summary RSS Revenue Credits for Tier 1 Cost Pools
Table summarizes the total revenue credits associated with RSS and related services, delineated by Tier 1
cost pool.
Table 3.2
Tier 2 Overhead Adder Inputs
Table lists inputs to Tier 2 Overhead Cost Adder.
Table 3.3
Load Shaping Rates
Table shows calculation of the PF Load Shaping rates, NR Load Shaping Rates, and the flat annual block
AURORA market price forecast.
Table 3.4
Tier 1 Demand Rates
Table shows calculation of the Tier 1 Demand rate.
Table 3.5
Slice Billing Adjustment
This table used to calculate the Slice Billing Adjustments by customer.
Table 3.6
Tier 2 Rate Revenues
Table summarizes the Tier 2 rate-related revenues and adjustments to Tier 1 cost pools.
Table 3.7
Tier 2 Rate Inputs
Table lists prices used for Tier 2 surplus credit or deficit debit.
Table 3.8
Inputs to TSS Monthly Rate and Charge
Table shows costs used as the numerator and the megawatt hours sold as the denominator for the TSS rate.
The transaction values are used to calculate the charge cap.
Table 3.9
Tier 2 Short-Term Rate Costing Table
Costing table used to calculate the Tier 2 Short-Term rates for each year of the rate period.
Table 3.10
Tier 2 Load Growth Rate Costing Table
Costing table used to calculate the Tier 2 Load Growth rates for each year of the rate period.
Table 3.11
Tier 2 VR1-2014 Rate Costing Table
Costing table used to calculate the VR1-2014 rates for each year of the rate period.
BP-16-FS-BPA-01A Page 100
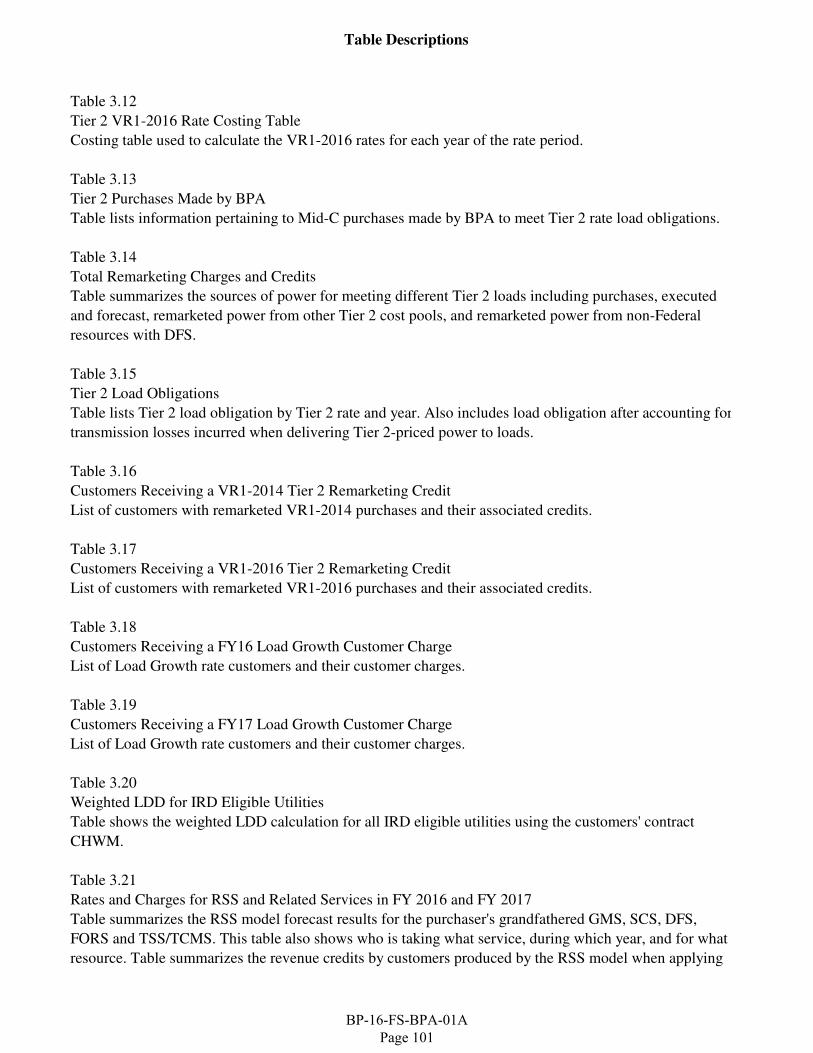
Table Descriptions
Table 3.12
Tier 2 VR1-2016 Rate Costing Table
Costing table used to calculate the VR1-2016 rates for each year of the rate period.
Table 3.13
Tier 2 Purchases Made by BPA
Table lists information pertaining to Mid-C purchases made by BPA to meet Tier 2 rate load obligations.
Table 3.14
Total Remarketing Charges and Credits
Table summarizes the sources of power for meeting different Tier 2 loads including purchases, executed
and forecast, remarketed power from other Tier 2 cost pools, and remarketed power from non-Federal
resources with DFS.
Table 3.15
Tier 2 Load Obligations
Table lists Tier 2 load obligation by Tier 2 rate and year. Also includes load obligation after accounting for
transmission losses incurred when delivering Tier 2-priced power to loads.
Table 3.16
Customers Receiving a VR1-2014 Tier 2 Remarketing Credit
List of customers with remarketed VR1-2014 purchases and their associated credits.
Table 3.17
Customers Receiving a VR1-2016 Tier 2 Remarketing Credit
List of customers with remarketed VR1-2016 purchases and their associated credits.
Table 3.18
Customers Receiving a FY16 Load Growth Customer Charge
List of Load Growth rate customers and their customer charges.
Table 3.19
Customers Receiving a FY17 Load Growth Customer Charge
List of Load Growth rate customers and their customer charges.
Table 3.20
Weighted LDD for IRD Eligible Utilities
Table shows the weighted LDD calculation for all IRD eligible utilities using the customers' contract
CHWM.
Table 3.21
Rates and Charges for RSS and Related Services in FY 2016 and FY 2017
Table summarizes the RSS model forecast results for the purchaser's grandfathered GMS, SCS, DFS,
FORS and TSS/TCMS. This table also shows who is taking what service, during which year, and for what
resource. Table summarizes the revenue credits by customers produced by the RSS model when applying
BP-16-FS-BPA-01A Page 101
Table Descriptions
the RSS and related services’ charges to the identified resources. Also included is the all-in forecast $/MWh
equivalent rate for the identified services.
Table 3.22
Customers Receiving Remarketing Credits for Non-Federal Resources with DFS
List of customers with remarketed Non-Federal resources with DFS and their associated credits.
Table 3.23
WECC and Peak Dues Charge Calculation
Table shows calculations for the WECC Dues Charge and the Peak Dues Charge.
Table 3.24
Southeast Idaho Load Service Five-Year Market Purchases
Table shows calculations for the Southeast Idaho Load service five-year market purchases.
Table 3.25
Southeast Idaho Load Service Market Purchases - Monthly Power Purchase Segmented by Cost Pool and
by Fiscal Year
Table shows the monthly transfer cost by fiscal year for the Southeast Idaho Load service five-year market
purchases.
BP-16-FS-BPA-01A Page 102
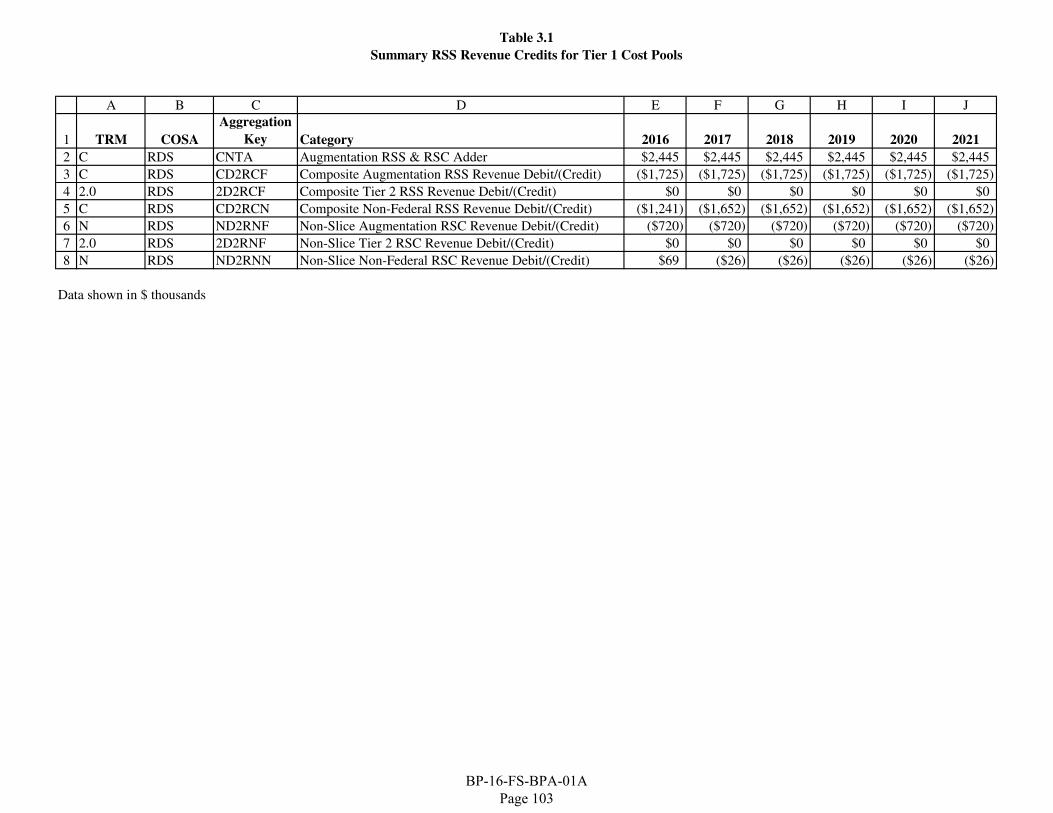
Table 3.1
Summary RSS Revenue Credits for Tier 1 Cost Pools
A B C D E F G H I J
1 TRM COSA
Aggregation
Key Category 2016 2017 2018 2019 2020 2021
2 C RDS CNTA Augmentation RSS & RSC Adder $2,445 $2,445 $2,445 $2,445 $2,445 $2,445
3 C RDS CD2RCF Composite Augmentation RSS Revenue Debit/(Credit) ($1,725) ($1,725) ($1,725) ($1,725) ($1,725) ($1,725)
4 2.0 RDS 2D2RCF Composite Tier 2 RSS Revenue Debit/(Credit) $0 $0 $0 $0 $0 $0
5 C RDS CD2RCN Composite Non-Federal RSS Revenue Debit/(Credit) ($1,241) ($1,652) ($1,652) ($1,652) ($1,652) ($1,652)
6 N RDS ND2RNF Non-Slice Augmentation RSC Revenue Debit/(Credit) ($720) ($720) ($720) ($720) ($720) ($720)
7 2.0 RDS 2D2RNF Non-Slice Tier 2 RSC Revenue Debit/(Credit) $0 $0 $0 $0 $0 $0
8 N RDS ND2RNN Non-Slice Non-Federal RSC Revenue Debit/(Credit) $69 ($26) ($26) ($26) ($26) ($26)
Data shown in $ thousands
BP-16-FS-BPA-01A Page 103
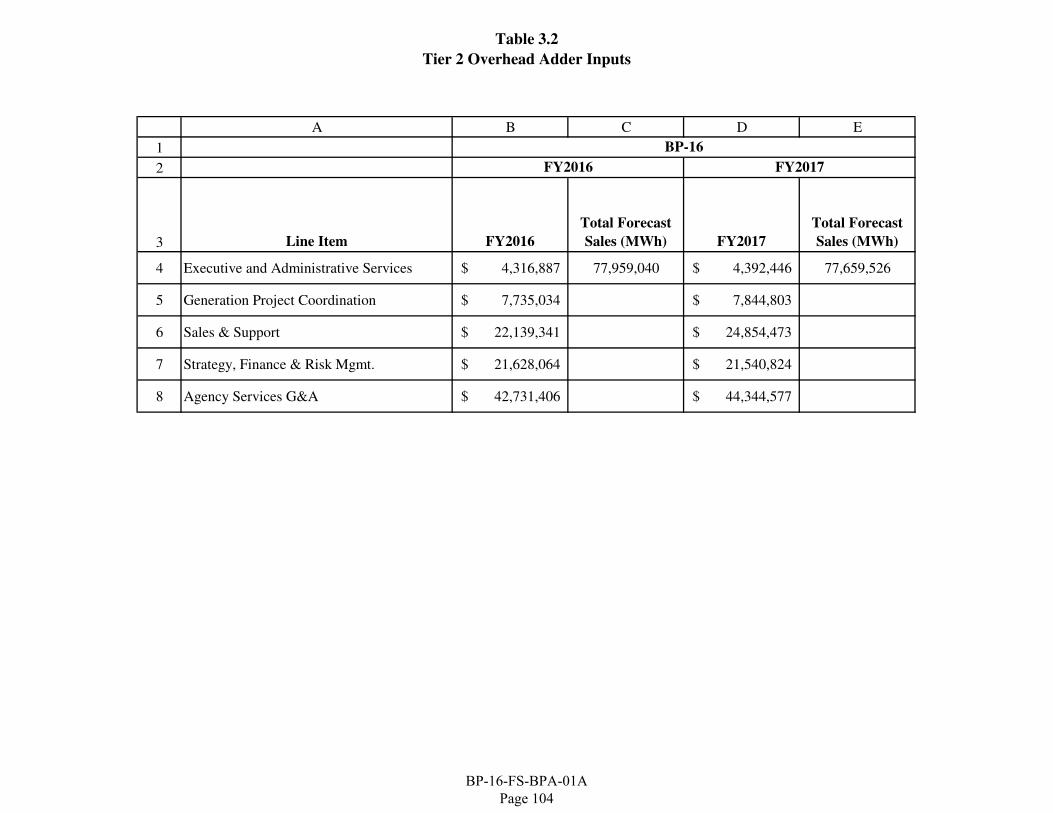
Table 3.2
Tier 2 Overhead Adder Inputs
A B C D E
1 BP-16
2 FY2016 FY2017
3 Line Item FY2016
Total Forecast
Sales (MWh) FY2017
Total Forecast
Sales (MWh)
4 Executive and Administrative Services 4,316,887$ 77,959,040 4,392,446$ 77,659,526
5 Generation Project Coordination 7,735,034$ 7,844,803$
6 Sales & Support 22,139,341$ 24,854,473$
7 Strategy, Finance & Risk Mgmt. 21,628,064$ 21,540,824$
8 Agency Services G&A 42,731,406$ 44,344,577$
BP-16-FS-BPA-01A Page 104
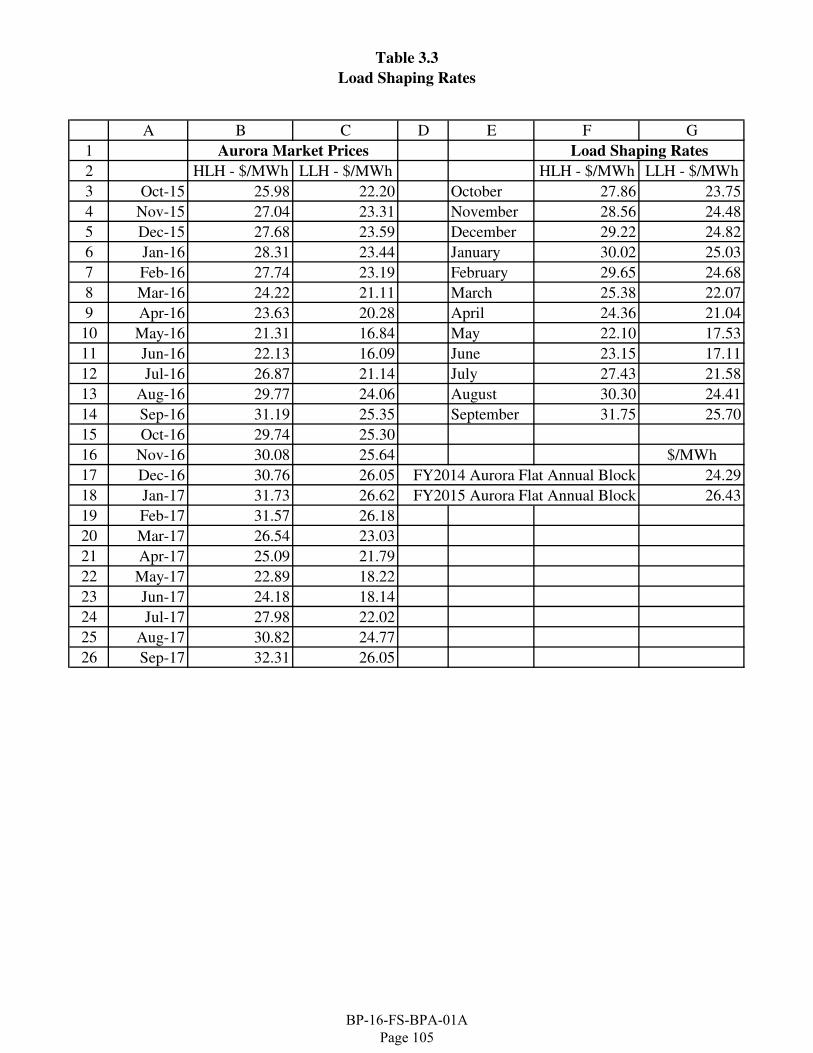
Table 3.3
Load Shaping Rates
A B C D E F G
1
2 HLH - $/MWh LLH - $/MWh HLH - $/MWh LLH - $/MWh
3 Oct-15 25.98 22.20 October 27.86 23.75
4 Nov-15 27.04 23.31 November 28.56 24.48
5 Dec-15 27.68 23.59 December 29.22 24.82
6 Jan-16 28.31 23.44 January 30.02 25.03
7 Feb-16 27.74 23.19 February 29.65 24.68
8 Mar-16 24.22 21.11 March 25.38 22.07
9 Apr-16 23.63 20.28 April 24.36 21.04
10 May-16 21.31 16.84 May 22.10 17.53
11 Jun-16 22.13 16.09 June 23.15 17.11
12 Jul-16 26.87 21.14 July 27.43 21.58
13 Aug-16 29.77 24.06 August 30.30 24.41
14 Sep-16 31.19 25.35 September 31.75 25.70
15 Oct-16 29.74 25.30
16 Nov-16 30.08 25.64 $/MWh
17 Dec-16 30.76 26.05 FY2014 Aurora Flat Annual Block 24.29
18 Jan-17 31.73 26.62 FY2015 Aurora Flat Annual Block 26.43
19 Feb-17 31.57 26.18
20 Mar-17 26.54 23.03
21 Apr-17 25.09 21.79
22 May-17 22.89 18.22
23 Jun-17 24.18 18.14
24 Jul-17 27.98 22.02
25 Aug-17 30.82 24.77
26 Sep-17 32.31 26.05
Aurora Market Prices Load Shaping Rates
BP-16-FS-BPA-01A Page 105
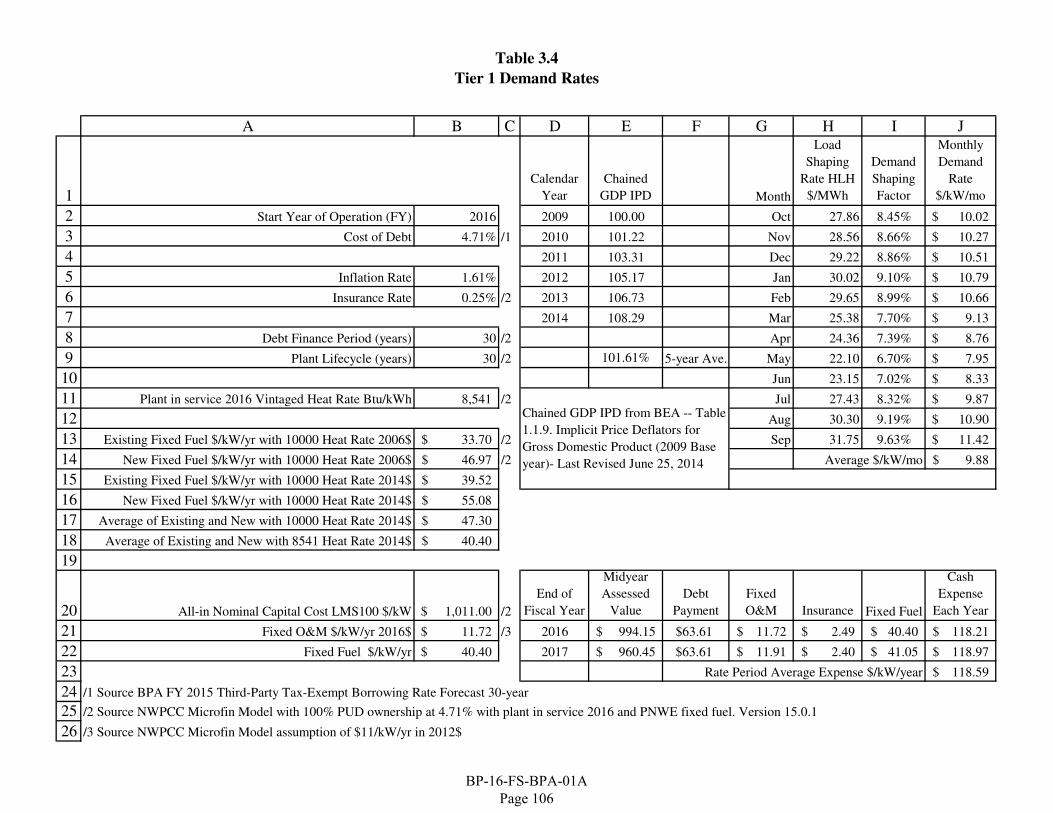
Table 3.4
Tier 1 Demand Rates
A B C D E F G H I J
1Calendar
Year
Chained
GDP IPD Month
Load
Shaping
Rate HLH
$/MWh
Demand
Shaping
Factor
Monthly
Demand
Rate
$/kW/mo
2 Start Year of Operation (FY) 2016 2009 100.00 Oct 27.86 8.45% 10.02$
3 Cost of Debt 4.71% /1 2010 101.22 Nov 28.56 8.66% 10.27$
4 2011 103.31 Dec 29.22 8.86% 10.51$
5 Inflation Rate 1.61% 2012 105.17 Jan 30.02 9.10% 10.79$
6 Insurance Rate 0.25% /2 2013 106.73 Feb 29.65 8.99% 10.66$
7 2014 108.29 Mar 25.38 7.70% 9.13$
8 Debt Finance Period (years) 30 /2 Apr 24.36 7.39% 8.76$
9 Plant Lifecycle (years) 30 /2 101.61% 5-year Ave. May 22.10 6.70% 7.95$
10 Jun 23.15 7.02% 8.33$
11 Plant in service 2016 Vintaged Heat Rate Btu/kWh 8,541 /2 Jul 27.43 8.32% 9.87$
12 Aug 30.30 9.19% 10.90$
13 Existing Fixed Fuel $/kW/yr with 10000 Heat Rate 2006$ 33.70$ /2 Sep 31.75 9.63% 11.42$
14 New Fixed Fuel $/kW/yr with 10000 Heat Rate 2006$ 46.97$ /2 Average $/kW/mo 9.88$
15 Existing Fixed Fuel $/kW/yr with 10000 Heat Rate 2014$ 39.52$
16 New Fixed Fuel $/kW/yr with 10000 Heat Rate 2014$ 55.08$
17 Average of Existing and New with 10000 Heat Rate 2014$ 47.30$
18 Average of Existing and New with 8541 Heat Rate 2014$ 40.40$
19
20 All-in Nominal Capital Cost LMS100 $/kW 1,011.00$ /2
End of
Fiscal Year
Midyear
Assessed
Value
Debt
Payment
Fixed
O&M Insurance Fixed Fuel
Cash
Expense
Each Year
21 Fixed O&M $/kW/yr 2016$ 11.72$ /3 2016 994.15$ $63.61 11.72$ 2.49$ 40.40$ 118.21$
22 Fixed Fuel $/kW/yr 40.40$ 2017 960.45$ $63.61 11.91$ 2.40$ 41.05$ 118.97$
23 Rate Period Average Expense $/kW/year 118.59$
24 /1 Source BPA FY 2015 Third-Party Tax-Exempt Borrowing Rate Forecast 30-year
25 /2 Source NWPCC Microfin Model with 100% PUD ownership at 4.71% with plant in service 2016 and PNWE fixed fuel. Version 15.0.1
26 /3 Source NWPCC Microfin Model assumption of $11/kW/yr in 2012$
Chained GDP IPD from BEA -- Table
1.1.9. Implicit Price Deflators for
Gross Domestic Product (2009 Base
year)- Last Revised June 25, 2014
BP-16-FS-BPA-01A Page 106
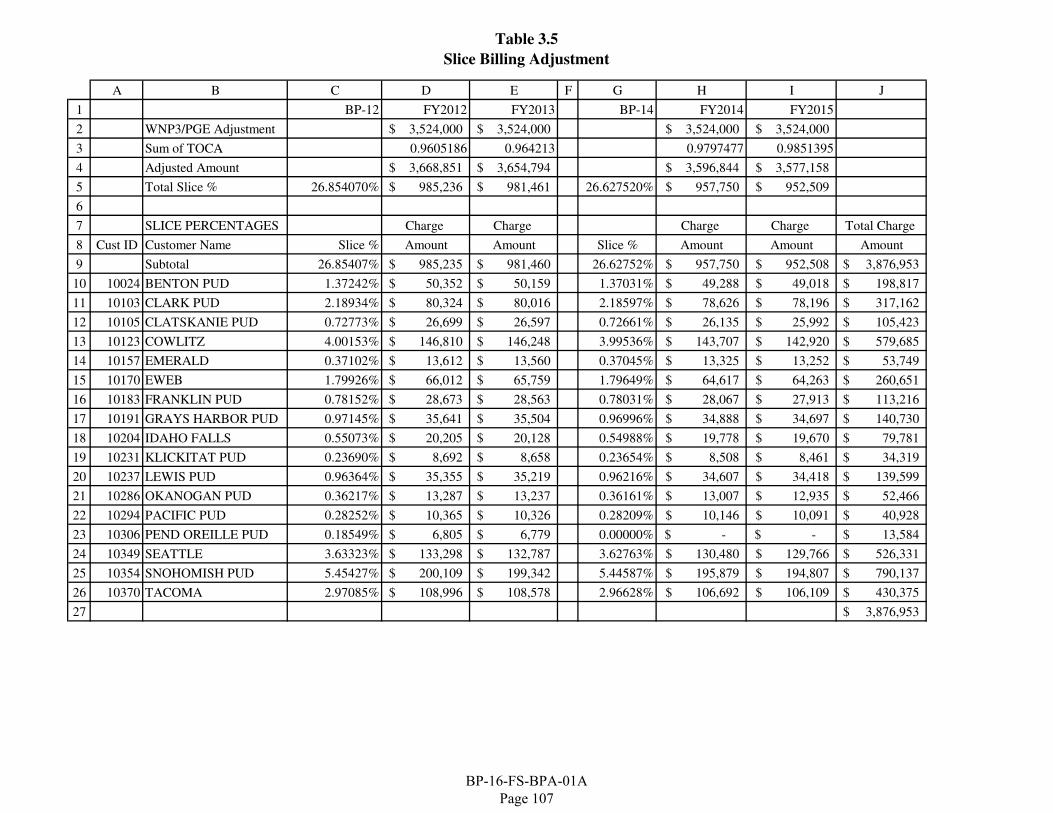
Table 3.5
Slice Billing Adjustment
A B C D E F G H I J
1 BP-12 FY2012 FY2013 BP-14 FY2014 FY2015
2 WNP3/PGE Adjustment 3,524,000$ 3,524,000$ 3,524,000$ 3,524,000$
3 Sum of TOCA 0.9605186 0.964213 0.9797477 0.9851395
4 Adjusted Amount 3,668,851$ 3,654,794$ 3,596,844$ 3,577,158$
5 Total Slice % 26.854070% 985,236$ 981,461$ 26.627520% 957,750$ 952,509$
6
7 SLICE PERCENTAGES Charge Charge Charge Charge Total Charge
8 Cust ID Customer Name Slice % Amount Amount Slice % Amount Amount Amount
9 Subtotal 26.85407% 985,235$ 981,460$ 26.62752% 957,750$ 952,508$ 3,876,953$
10 10024 BENTON PUD 1.37242% 50,352$ 50,159$ 1.37031% 49,288$ 49,018$ 198,817$
11 10103 CLARK PUD 2.18934% 80,324$ 80,016$ 2.18597% 78,626$ 78,196$ 317,162$
12 10105 CLATSKANIE PUD 0.72773% 26,699$ 26,597$ 0.72661% 26,135$ 25,992$ 105,423$
13 10123 COWLITZ 4.00153% 146,810$ 146,248$ 3.99536% 143,707$ 142,920$ 579,685$
14 10157 EMERALD 0.37102% 13,612$ 13,560$ 0.37045% 13,325$ 13,252$ 53,749$
15 10170 EWEB 1.79926% 66,012$ 65,759$ 1.79649% 64,617$ 64,263$ 260,651$
16 10183 FRANKLIN PUD 0.78152% 28,673$ 28,563$ 0.78031% 28,067$ 27,913$ 113,216$
17 10191 GRAYS HARBOR PUD 0.97145% 35,641$ 35,504$ 0.96996% 34,888$ 34,697$ 140,730$
18 10204 IDAHO FALLS 0.55073% 20,205$ 20,128$ 0.54988% 19,778$ 19,670$ 79,781$
19 10231 KLICKITAT PUD 0.23690% 8,692$ 8,658$ 0.23654% 8,508$ 8,461$ 34,319$
20 10237 LEWIS PUD 0.96364% 35,355$ 35,219$ 0.96216% 34,607$ 34,418$ 139,599$
21 10286 OKANOGAN PUD 0.36217% 13,287$ 13,237$ 0.36161% 13,007$ 12,935$ 52,466$
22 10294 PACIFIC PUD 0.28252% 10,365$ 10,326$ 0.28209% 10,146$ 10,091$ 40,928$
23 10306 PEND OREILLE PUD 0.18549% 6,805$ 6,779$ 0.00000% -$ -$ 13,584$
24 10349 SEATTLE 3.63323% 133,298$ 132,787$ 3.62763% 130,480$ 129,766$ 526,331$
25 10354 SNOHOMISH PUD 5.45427% 200,109$ 199,342$ 5.44587% 195,879$ 194,807$ 790,137$
26 10370 TACOMA 2.97085% 108,996$ 108,578$ 2.96628% 106,692$ 106,109$ 430,375$
27 3,876,953$
BP-16-FS-BPA-01A Page 107
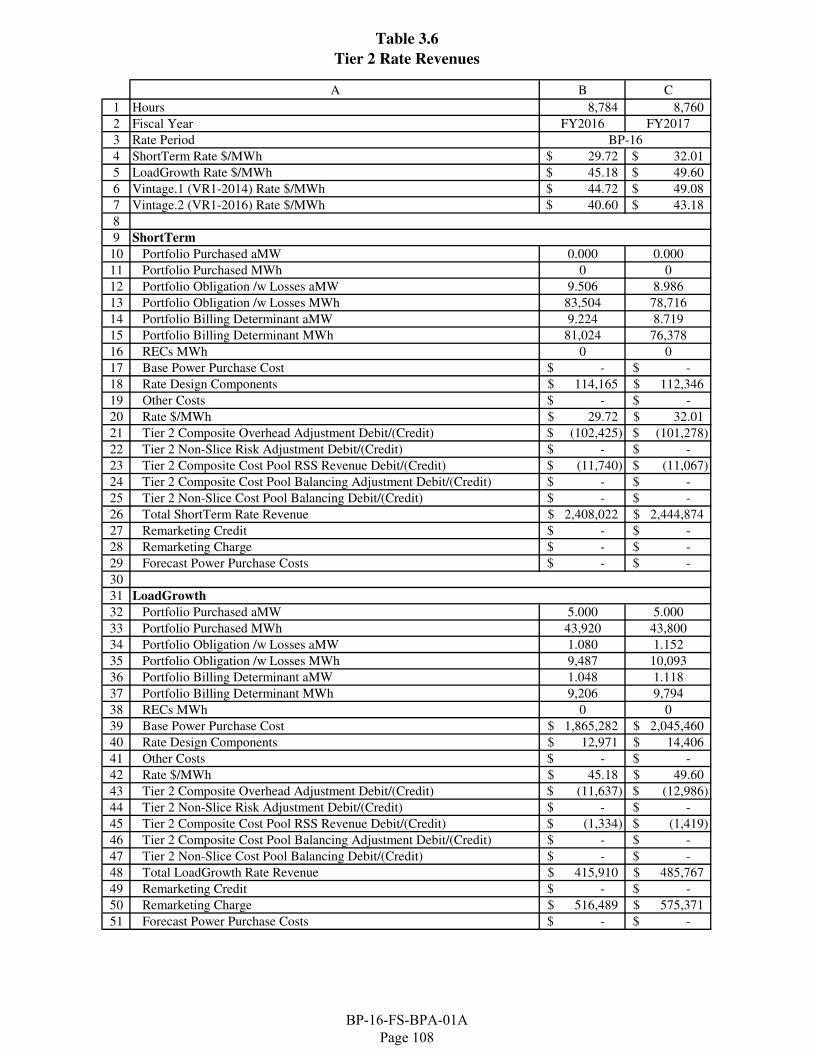
Table 3.6
Tier 2 Rate Revenues
A B C
1 Hours 8,784 8,760
2 Fiscal Year FY2016 FY2017
3 Rate Period
4 ShortTerm Rate $/MWh 29.72$ 32.01$
5 LoadGrowth Rate $/MWh 45.18$ 49.60$
6 Vintage.1 (VR1-2014) Rate $/MWh 44.72$ 49.08$
7 Vintage.2 (VR1-2016) Rate $/MWh 40.60$ 43.18$
8
9 ShortTerm
10 Portfolio Purchased aMW 0.000 0.000
11 Portfolio Purchased MWh 0 0
12 Portfolio Obligation /w Losses aMW 9.506 8.986
13 Portfolio Obligation /w Losses MWh 83,504 78,716
14 Portfolio Billing Determinant aMW 9.224 8.719
15 Portfolio Billing Determinant MWh 81,024 76,378
16 RECs MWh 0 0
17 Base Power Purchase Cost -$ -$
18 Rate Design Components 114,165$ 112,346$
19 Other Costs -$ -$
20 Rate $/MWh 29.72$ 32.01$
21 Tier 2 Composite Overhead Adjustment Debit/(Credit) (102,425)$ (101,278)$
22 Tier 2 Non-Slice Risk Adjustment Debit/(Credit) -$ -$
23 Tier 2 Composite Cost Pool RSS Revenue Debit/(Credit) (11,740)$ (11,067)$
24 Tier 2 Composite Cost Pool Balancing Adjustment Debit/(Credit) -$ -$
25 Tier 2 Non-Slice Cost Pool Balancing Debit/(Credit) -$ -$
26 Total ShortTerm Rate Revenue 2,408,022$ 2,444,874$
27 Remarketing Credit -$ -$
28 Remarketing Charge -$ -$
29 Forecast Power Purchase Costs -$ -$
30
31 LoadGrowth
32 Portfolio Purchased aMW 5.000 5.000
33 Portfolio Purchased MWh 43,920 43,800
34 Portfolio Obligation /w Losses aMW 1.080 1.152
35 Portfolio Obligation /w Losses MWh 9,487 10,093
36 Portfolio Billing Determinant aMW 1.048 1.118
37 Portfolio Billing Determinant MWh 9,206 9,794
38 RECs MWh 0 0
39 Base Power Purchase Cost 1,865,282$ 2,045,460$
40 Rate Design Components 12,971$ 14,406$
41 Other Costs -$ -$
42 Rate $/MWh 45.18$ 49.60$
43 Tier 2 Composite Overhead Adjustment Debit/(Credit) (11,637)$ (12,986)$
44 Tier 2 Non-Slice Risk Adjustment Debit/(Credit) -$ -$
45 Tier 2 Composite Cost Pool RSS Revenue Debit/(Credit) (1,334)$ (1,419)$
46 Tier 2 Composite Cost Pool Balancing Adjustment Debit/(Credit) -$ -$
47 Tier 2 Non-Slice Cost Pool Balancing Debit/(Credit) -$ -$
48 Total LoadGrowth Rate Revenue 415,910$ 485,767$
49 Remarketing Credit -$ -$
50 Remarketing Charge 516,489$ 575,371$
51 Forecast Power Purchase Costs -$ -$
BP-16
BP-16-FS-BPA-01A Page 108
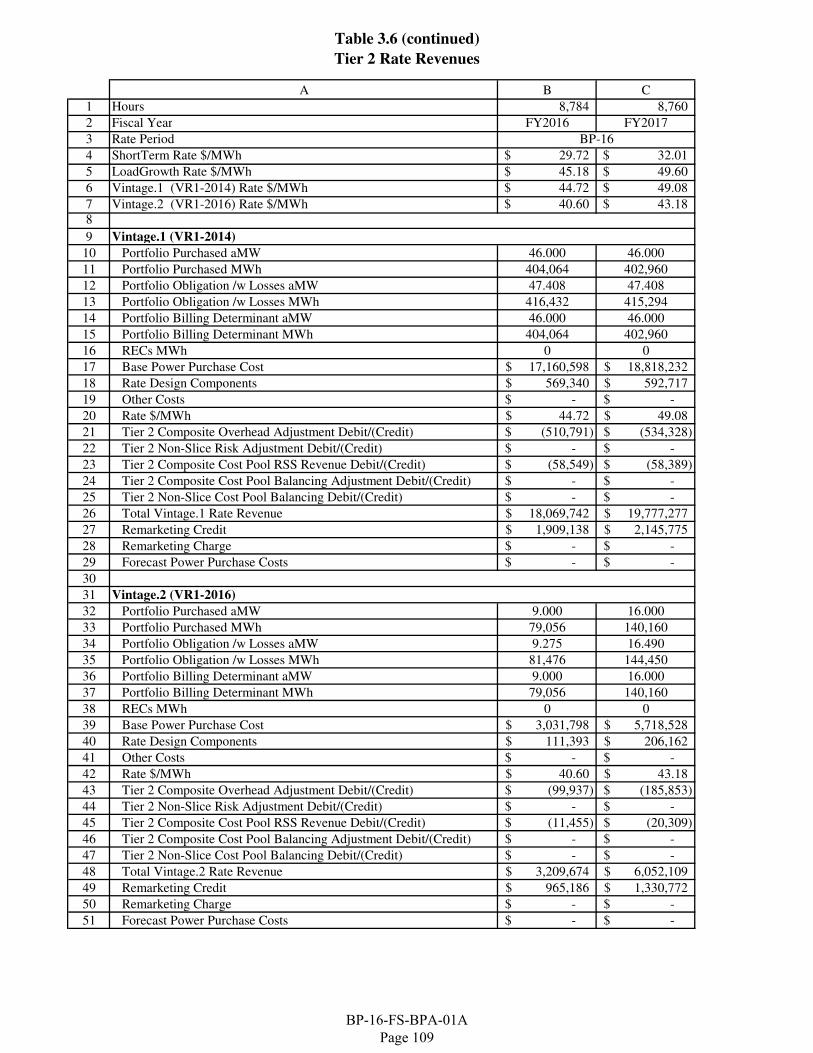
Table 3.6 (continued)
Tier 2 Rate Revenues
A B C
1 Hours 8,784 8,760
2 Fiscal Year FY2016 FY2017
3 Rate Period
4 ShortTerm Rate $/MWh 29.72$ 32.01$
5 LoadGrowth Rate $/MWh 45.18$ 49.60$
6 Vintage.1 (VR1-2014) Rate $/MWh 44.72$ 49.08$
7 Vintage.2 (VR1-2016) Rate $/MWh 40.60$ 43.18$
8
9 Vintage.1 (VR1-2014)
10 Portfolio Purchased aMW 46.000 46.000
11 Portfolio Purchased MWh 404,064 402,960
12 Portfolio Obligation /w Losses aMW 47.408 47.408
13 Portfolio Obligation /w Losses MWh 416,432 415,294
14 Portfolio Billing Determinant aMW 46.000 46.000
15 Portfolio Billing Determinant MWh 404,064 402,960
16 RECs MWh 0 0
17 Base Power Purchase Cost 17,160,598$ 18,818,232$
18 Rate Design Components 569,340$ 592,717$
19 Other Costs -$ -$
20 Rate $/MWh 44.72$ 49.08$
21 Tier 2 Composite Overhead Adjustment Debit/(Credit) (510,791)$ (534,328)$
22 Tier 2 Non-Slice Risk Adjustment Debit/(Credit) -$ -$
23 Tier 2 Composite Cost Pool RSS Revenue Debit/(Credit) (58,549)$ (58,389)$
24 Tier 2 Composite Cost Pool Balancing Adjustment Debit/(Credit) -$ -$
25 Tier 2 Non-Slice Cost Pool Balancing Debit/(Credit) -$ -$
26 Total Vintage.1 Rate Revenue 18,069,742$ 19,777,277$
27 Remarketing Credit 1,909,138$ 2,145,775$
28 Remarketing Charge -$ -$
29 Forecast Power Purchase Costs -$ -$
30
31 Vintage.2 (VR1-2016)
32 Portfolio Purchased aMW 9.000 16.000
33 Portfolio Purchased MWh 79,056 140,160
34 Portfolio Obligation /w Losses aMW 9.275 16.490
35 Portfolio Obligation /w Losses MWh 81,476 144,450
36 Portfolio Billing Determinant aMW 9.000 16.000
37 Portfolio Billing Determinant MWh 79,056 140,160
38 RECs MWh 0 0
39 Base Power Purchase Cost 3,031,798$ 5,718,528$
40 Rate Design Components 111,393$ 206,162$
41 Other Costs -$ -$
42 Rate $/MWh 40.60$ 43.18$
43 Tier 2 Composite Overhead Adjustment Debit/(Credit) (99,937)$ (185,853)$
44 Tier 2 Non-Slice Risk Adjustment Debit/(Credit) -$ -$
45 Tier 2 Composite Cost Pool RSS Revenue Debit/(Credit) (11,455)$ (20,309)$
46 Tier 2 Composite Cost Pool Balancing Adjustment Debit/(Credit) -$ -$
47 Tier 2 Non-Slice Cost Pool Balancing Debit/(Credit) -$ -$
48 Total Vintage.2 Rate Revenue 3,209,674$ 6,052,109$
49 Remarketing Credit 965,186$ 1,330,772$
50 Remarketing Charge -$ -$
51 Forecast Power Purchase Costs -$ -$
BP-16
BP-16-FS-BPA-01A Page 109
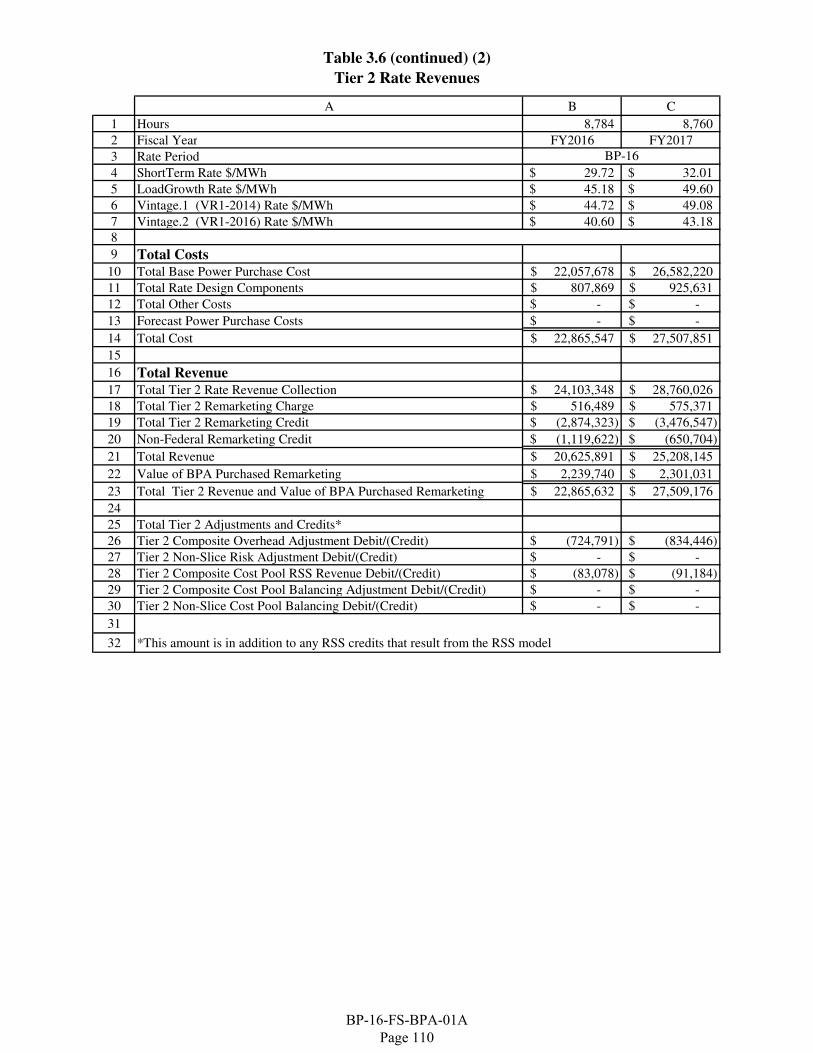
Table 3.6 (continued) (2)
Tier 2 Rate Revenues
A B C
1 Hours 8,784 8,760
2 Fiscal Year FY2016 FY2017
3 Rate Period
4 ShortTerm Rate $/MWh 29.72$ 32.01$
5 LoadGrowth Rate $/MWh 45.18$ 49.60$
6 Vintage.1 (VR1-2014) Rate $/MWh 44.72$ 49.08$
7 Vintage.2 (VR1-2016) Rate $/MWh 40.60$ 43.18$
8
9 Total Costs
10 Total Base Power Purchase Cost 22,057,678$ 26,582,220$
11 Total Rate Design Components 807,869$ 925,631$
12 Total Other Costs -$ -$
13 Forecast Power Purchase Costs -$ -$
14 Total Cost 22,865,547$ 27,507,851$
15
16 Total Revenue
17 Total Tier 2 Rate Revenue Collection 24,103,348$ 28,760,026$
18 Total Tier 2 Remarketing Charge 516,489$ 575,371$
19 Total Tier 2 Remarketing Credit (2,874,323)$ (3,476,547)$
20 Non-Federal Remarketing Credit (1,119,622)$ (650,704)$
21 Total Revenue 20,625,891$ 25,208,145$
22 Value of BPA Purchased Remarketing 2,239,740$ 2,301,031$
23 Total Tier 2 Revenue and Value of BPA Purchased Remarketing 22,865,632$ 27,509,176$
24
25 Total Tier 2 Adjustments and Credits*
26 Tier 2 Composite Overhead Adjustment Debit/(Credit) (724,791)$ (834,446)$
27 Tier 2 Non-Slice Risk Adjustment Debit/(Credit) -$ -$
28 Tier 2 Composite Cost Pool RSS Revenue Debit/(Credit) (83,078)$ (91,184)$
29 Tier 2 Composite Cost Pool Balancing Adjustment Debit/(Credit) -$ -$
30 Tier 2 Non-Slice Cost Pool Balancing Debit/(Credit) -$ -$
31
32 *This amount is in addition to any RSS credits that result from the RSS model
BP-16
BP-16-FS-BPA-01A Page 110
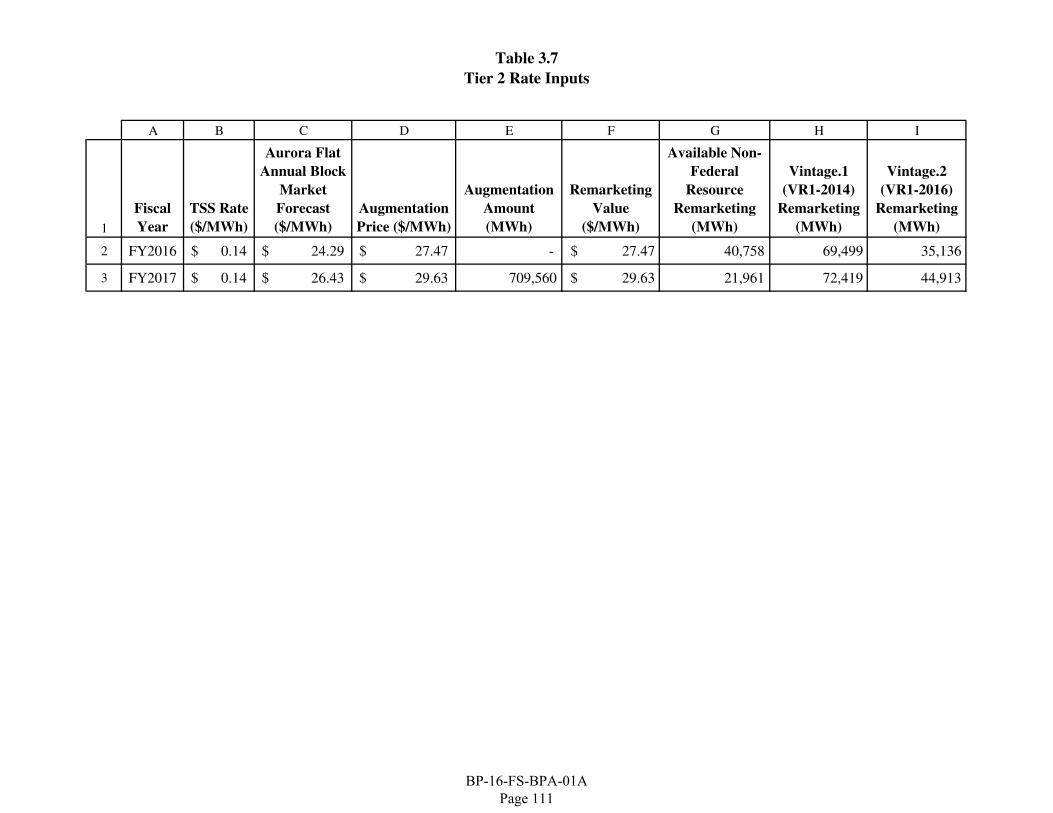
Table 3.7
Tier 2 Rate Inputs
A B C D E F G H I
1
Fiscal
Year
TSS Rate
($/MWh)
Aurora Flat
Annual Block
Market
Forecast
($/MWh)
Augmentation
Price ($/MWh)
Augmentation
Amount
(MWh)
Remarketing
Value
($/MWh)
Available Non-
Federal
Resource
Remarketing
(MWh)
Vintage.1
(VR1-2014)
Remarketing
(MWh)
Vintage.2
(VR1-2016)
Remarketing
(MWh)
2 FY2016 0.14$ 24.29$ 27.47$ - $ 27.47 40,758 69,499 35,136
3 FY2017 0.14$ 26.43$ 29.63$ 709,560 $ 29.63 21,961 72,419 44,913
BP-16-FS-BPA-01A Page 111
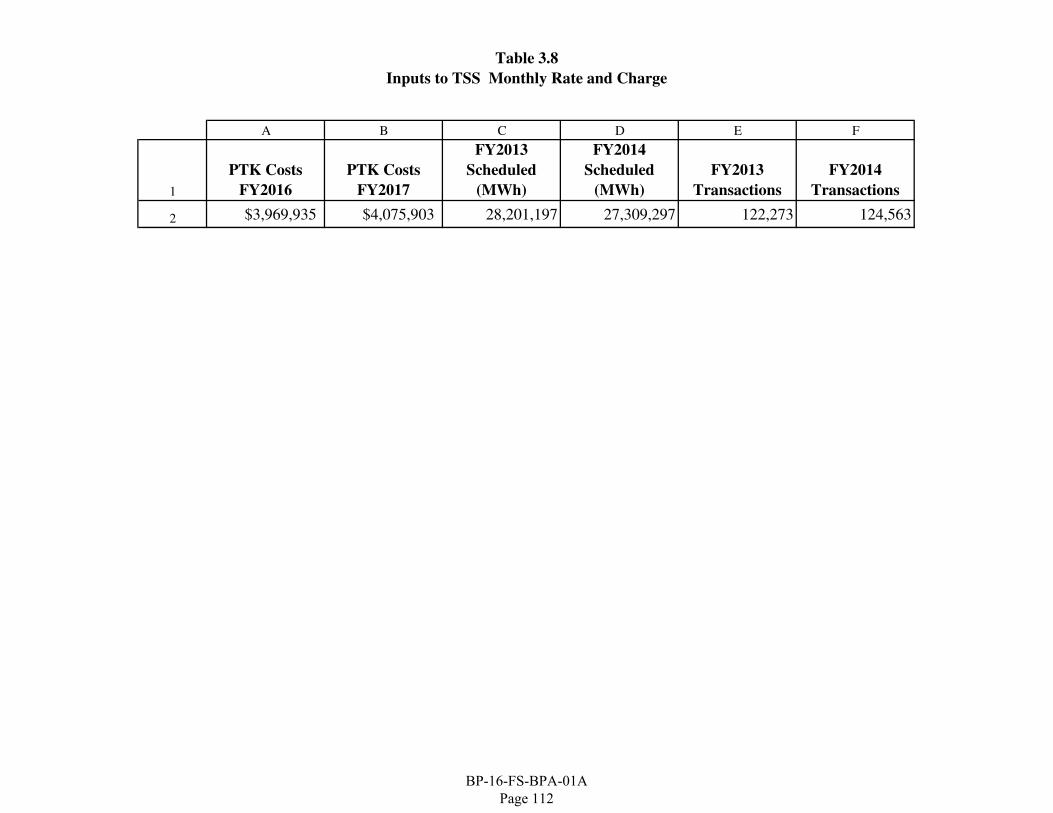
Table 3.8
Inputs to TSS Monthly Rate and Charge
A B C D E F
1
PTK Costs
FY2016
PTK Costs
FY2017
FY2013
Scheduled
(MWh)
FY2014
Scheduled
(MWh)
FY2013
Transactions
FY2014
Transactions
2 $3,969,935 $4,075,903 28,201,197 27,309,297 122,273 124,563
BP-16-FS-BPA-01A Page 112
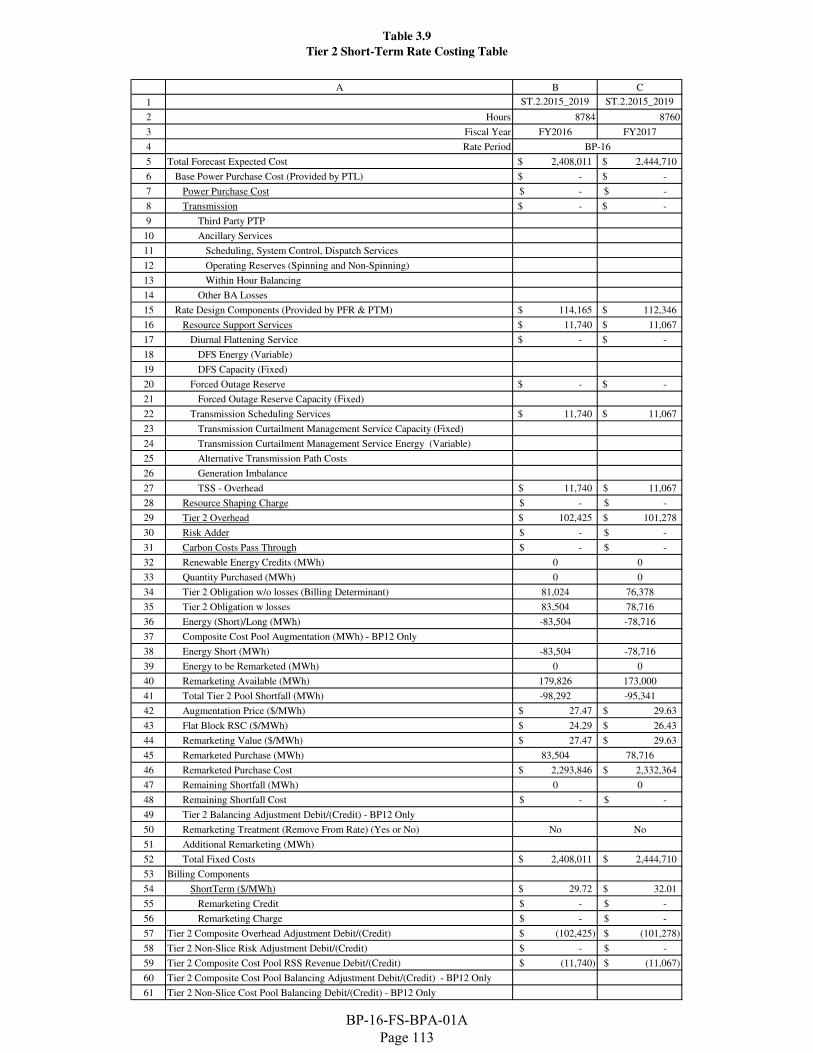
Table 3.9
Tier 2 Short-Term Rate Costing Table
A B C
1 ST.2.2015_2019 ST.2.2015_2019
2 Hours 8784 8760
3 Fiscal Year FY2016 FY2017
4 Rate Period
5 Total Forecast Expected Cost 2,408,011$ 2,444,710$
6 Base Power Purchase Cost (Provided by PTL) -$ -$
7 Power Purchase Cost -$ -$
8 Transmission -$ -$
9 Third Party PTP
10 Ancillary Services
11 Scheduling, System Control, Dispatch Services
12 Operating Reserves (Spinning and Non-Spinning)
13 Within Hour Balancing
14 Other BA Losses
15 Rate Design Components (Provided by PFR & PTM) 114,165$ 112,346$
16 Resource Support Services 11,740$ 11,067$
17 Diurnal Flattening Service -$ -$
18 DFS Energy (Variable)
19 DFS Capacity (Fixed)
20 Forced Outage Reserve -$ -$
21 Forced Outage Reserve Capacity (Fixed)
22 Transmission Scheduling Services 11,740$ 11,067$
23 Transmission Curtailment Management Service Capacity (Fixed)
24 Transmission Curtailment Management Service Energy (Variable)
25 Alternative Transmission Path Costs
26 Generation Imbalance
27 TSS - Overhead 11,740$ 11,067$
28 Resource Shaping Charge -$ -$
29 Tier 2 Overhead 102,425$ 101,278$
30 Risk Adder -$ -$
31 Carbon Costs Pass Through -$ -$
32 Renewable Energy Credits (MWh) 0 0
33 Quantity Purchased (MWh) 0 0
34 Tier 2 Obligation w/o losses (Billing Determinant) 81,024 76,378
35 Tier 2 Obligation w losses 83,504 78,716
36 Energy (Short)/Long (MWh) -83,504 -78,716
37 Composite Cost Pool Augmentation (MWh) - BP12 Only
38 Energy Short (MWh) -83,504 -78,716
39 Energy to be Remarketed (MWh) 0 0
40 Remarketing Available (MWh) 179,826 173,000
41 Total Tier 2 Pool Shortfall (MWh) -98,292 -95,341
42 Augmentation Price ($/MWh) 27.47$ 29.63$
43 Flat Block RSC ($/MWh) 24.29$ 26.43$
44 Remarketing Value ($/MWh) 27.47$ 29.63$
45 Remarketed Purchase (MWh) 83,504 78,716
46 Remarketed Purchase Cost 2,293,846$ 2,332,364$
47 Remaining Shortfall (MWh) 0 0
48 Remaining Shortfall Cost -$ -$
49 Tier 2 Balancing Adjustment Debit/(Credit) - BP12 Only
50 Remarketing Treatment (Remove From Rate) (Yes or No) No No
51 Additional Remarketing (MWh)
52 Total Fixed Costs 2,408,011$ 2,444,710$
53 Billing Components
54 ShortTerm ($/MWh) 29.72$ 32.01$
55 Remarketing Credit -$ -$
56 Remarketing Charge -$ -$
57 Tier 2 Composite Overhead Adjustment Debit/(Credit) (102,425)$ (101,278)$
58 Tier 2 Non-Slice Risk Adjustment Debit/(Credit) -$ -$
59 Tier 2 Composite Cost Pool RSS Revenue Debit/(Credit) (11,740)$ (11,067)$
60 Tier 2 Composite Cost Pool Balancing Adjustment Debit/(Credit) - BP12 Only
61 Tier 2 Non-Slice Cost Pool Balancing Debit/(Credit) - BP12 Only
BP-16
BP-16-FS-BPA-01A Page 113
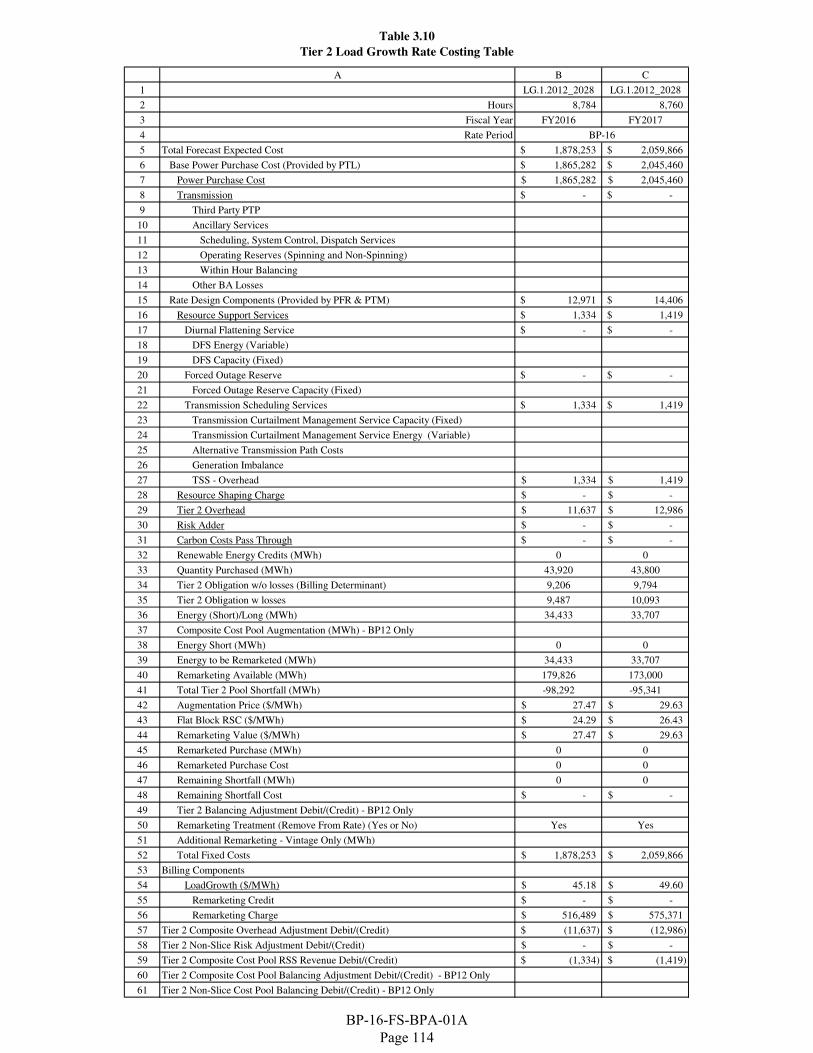
Table 3.10
Tier 2 Load Growth Rate Costing Table
A B C
1 LG.1.2012_2028 LG.1.2012_2028
2 Hours 8,784 8,760
3 Fiscal Year FY2016 FY2017
4 Rate Period
5 Total Forecast Expected Cost 1,878,253$ 2,059,866$
6 Base Power Purchase Cost (Provided by PTL) 1,865,282$ 2,045,460$
7 Power Purchase Cost 1,865,282$ 2,045,460$
8 Transmission -$ -$
9 Third Party PTP
10 Ancillary Services
11 Scheduling, System Control, Dispatch Services
12 Operating Reserves (Spinning and Non-Spinning)
13 Within Hour Balancing
14 Other BA Losses
15 Rate Design Components (Provided by PFR & PTM) 12,971$ 14,406$
16 Resource Support Services 1,334$ 1,419$
17 Diurnal Flattening Service -$ -$
18 DFS Energy (Variable)
19 DFS Capacity (Fixed)
20 Forced Outage Reserve -$ -$
21 Forced Outage Reserve Capacity (Fixed)
22 Transmission Scheduling Services 1,334$ 1,419$
23 Transmission Curtailment Management Service Capacity (Fixed)
24 Transmission Curtailment Management Service Energy (Variable)
25 Alternative Transmission Path Costs
26 Generation Imbalance
27 TSS - Overhead 1,334$ 1,419$
28 Resource Shaping Charge -$ -$
29 Tier 2 Overhead 11,637$ 12,986$
30 Risk Adder -$ -$
31 Carbon Costs Pass Through -$ -$
32 Renewable Energy Credits (MWh) 0 0
33 Quantity Purchased (MWh) 43,920 43,800
34 Tier 2 Obligation w/o losses (Billing Determinant) 9,206 9,794
35 Tier 2 Obligation w losses 9,487 10,093
36 Energy (Short)/Long (MWh) 34,433 33,707
37 Composite Cost Pool Augmentation (MWh) - BP12 Only
38 Energy Short (MWh) 0 0
39 Energy to be Remarketed (MWh) 34,433 33,707
40 Remarketing Available (MWh) 179,826 173,000
41 Total Tier 2 Pool Shortfall (MWh) -98,292 -95,341
42 Augmentation Price ($/MWh) 27.47$ 29.63$
43 Flat Block RSC ($/MWh) 24.29$ 26.43$
44 Remarketing Value ($/MWh) 27.47$ 29.63$
45 Remarketed Purchase (MWh) 0 0
46 Remarketed Purchase Cost 0 0
47 Remaining Shortfall (MWh) 0 0
48 Remaining Shortfall Cost -$ -$
49 Tier 2 Balancing Adjustment Debit/(Credit) - BP12 Only
50 Remarketing Treatment (Remove From Rate) (Yes or No) Yes Yes
51 Additional Remarketing - Vintage Only (MWh)
52 Total Fixed Costs 1,878,253$ 2,059,866$
53 Billing Components
54 LoadGrowth ($/MWh) 45.18$ 49.60$
55 Remarketing Credit -$ -$
56 Remarketing Charge 516,489$ 575,371$
57 Tier 2 Composite Overhead Adjustment Debit/(Credit) (11,637)$ (12,986)$
58 Tier 2 Non-Slice Risk Adjustment Debit/(Credit) -$ -$
59 Tier 2 Composite Cost Pool RSS Revenue Debit/(Credit) (1,334)$ (1,419)$
60 Tier 2 Composite Cost Pool Balancing Adjustment Debit/(Credit) - BP12 Only
61 Tier 2 Non-Slice Cost Pool Balancing Debit/(Credit) - BP12 Only
BP-16
BP-16-FS-BPA-01A Page 114
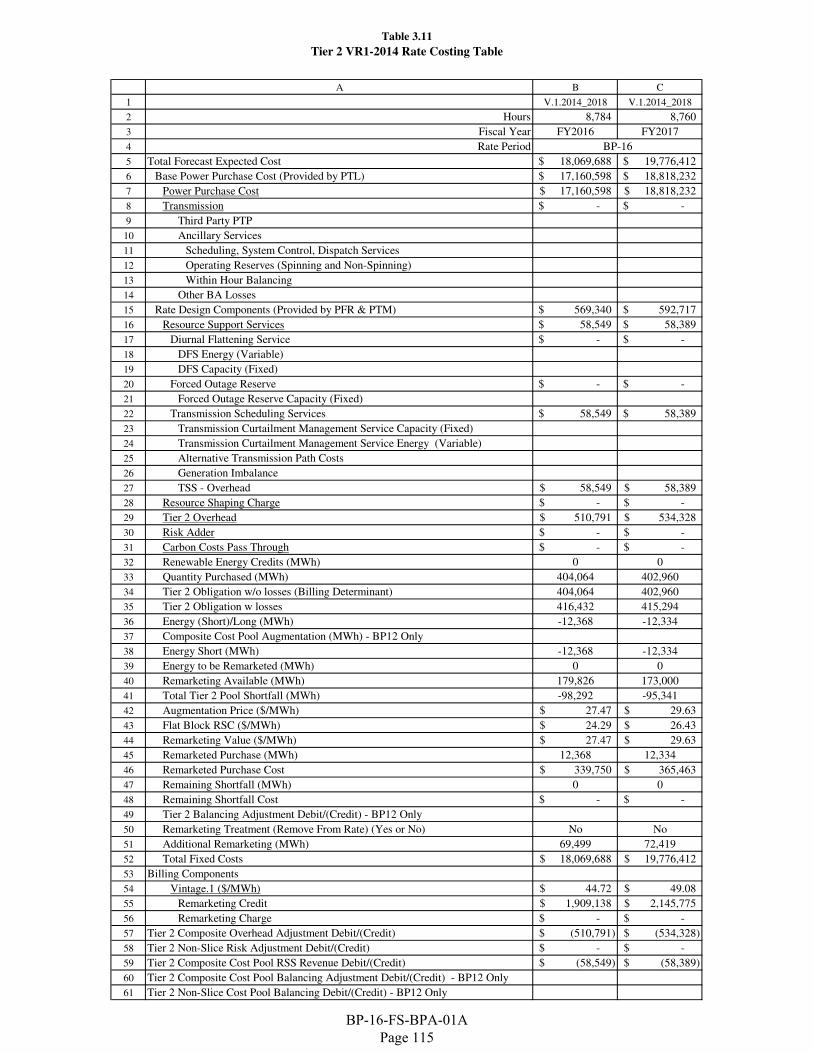
Table 3.11
Tier 2 VR1-2014 Rate Costing Table
A B C
1 V.1.2014_2018 V.1.2014_2018
2 Hours 8,784 8,760
3 Fiscal Year FY2016 FY2017
4 Rate Period
5 Total Forecast Expected Cost 18,069,688$ 19,776,412$
6 Base Power Purchase Cost (Provided by PTL) 17,160,598$ 18,818,232$
7 Power Purchase Cost 17,160,598$ 18,818,232$
8 Transmission -$ -$
9 Third Party PTP
10 Ancillary Services
11 Scheduling, System Control, Dispatch Services
12 Operating Reserves (Spinning and Non-Spinning)
13 Within Hour Balancing
14 Other BA Losses
15 Rate Design Components (Provided by PFR & PTM) 569,340$ 592,717$
16 Resource Support Services 58,549$ 58,389$
17 Diurnal Flattening Service -$ -$
18 DFS Energy (Variable)
19 DFS Capacity (Fixed)
20 Forced Outage Reserve -$ -$
21 Forced Outage Reserve Capacity (Fixed)
22 Transmission Scheduling Services 58,549$ 58,389$
23 Transmission Curtailment Management Service Capacity (Fixed)
24 Transmission Curtailment Management Service Energy (Variable)
25 Alternative Transmission Path Costs
26 Generation Imbalance
27 TSS - Overhead 58,549$ 58,389$
28 Resource Shaping Charge -$ -$
29 Tier 2 Overhead 510,791$ 534,328$
30 Risk Adder -$ -$
31 Carbon Costs Pass Through -$ -$
32 Renewable Energy Credits (MWh) 0 0
33 Quantity Purchased (MWh) 404,064 402,960
34 Tier 2 Obligation w/o losses (Billing Determinant) 404,064 402,960
35 Tier 2 Obligation w losses 416,432 415,294
36 Energy (Short)/Long (MWh) -12,368 -12,334
37 Composite Cost Pool Augmentation (MWh) - BP12 Only
38 Energy Short (MWh) -12,368 -12,334
39 Energy to be Remarketed (MWh) 0 0
40 Remarketing Available (MWh) 179,826 173,000
41 Total Tier 2 Pool Shortfall (MWh) -98,292 -95,341
42 Augmentation Price ($/MWh) 27.47$ 29.63$
43 Flat Block RSC ($/MWh) 24.29$ 26.43$
44 Remarketing Value ($/MWh) 27.47$ 29.63$
45 Remarketed Purchase (MWh) 12,368 12,334
46 Remarketed Purchase Cost 339,750$ 365,463$
47 Remaining Shortfall (MWh) 0 0
48 Remaining Shortfall Cost -$ -$
49 Tier 2 Balancing Adjustment Debit/(Credit) - BP12 Only
50 Remarketing Treatment (Remove From Rate) (Yes or No) No No
51 Additional Remarketing (MWh) 69,499 72,419
52 Total Fixed Costs 18,069,688$ 19,776,412$
53 Billing Components
54 Vintage.1 ($/MWh) 44.72$ 49.08$
55 Remarketing Credit 1,909,138$ 2,145,775$
56 Remarketing Charge -$ -$
57 Tier 2 Composite Overhead Adjustment Debit/(Credit) (510,791)$ (534,328)$
58 Tier 2 Non-Slice Risk Adjustment Debit/(Credit) -$ -$
59 Tier 2 Composite Cost Pool RSS Revenue Debit/(Credit) (58,549)$ (58,389)$
60 Tier 2 Composite Cost Pool Balancing Adjustment Debit/(Credit) - BP12 Only
61 Tier 2 Non-Slice Cost Pool Balancing Debit/(Credit) - BP12 Only
BP-16
BP-16-FS-BPA-01A Page 115
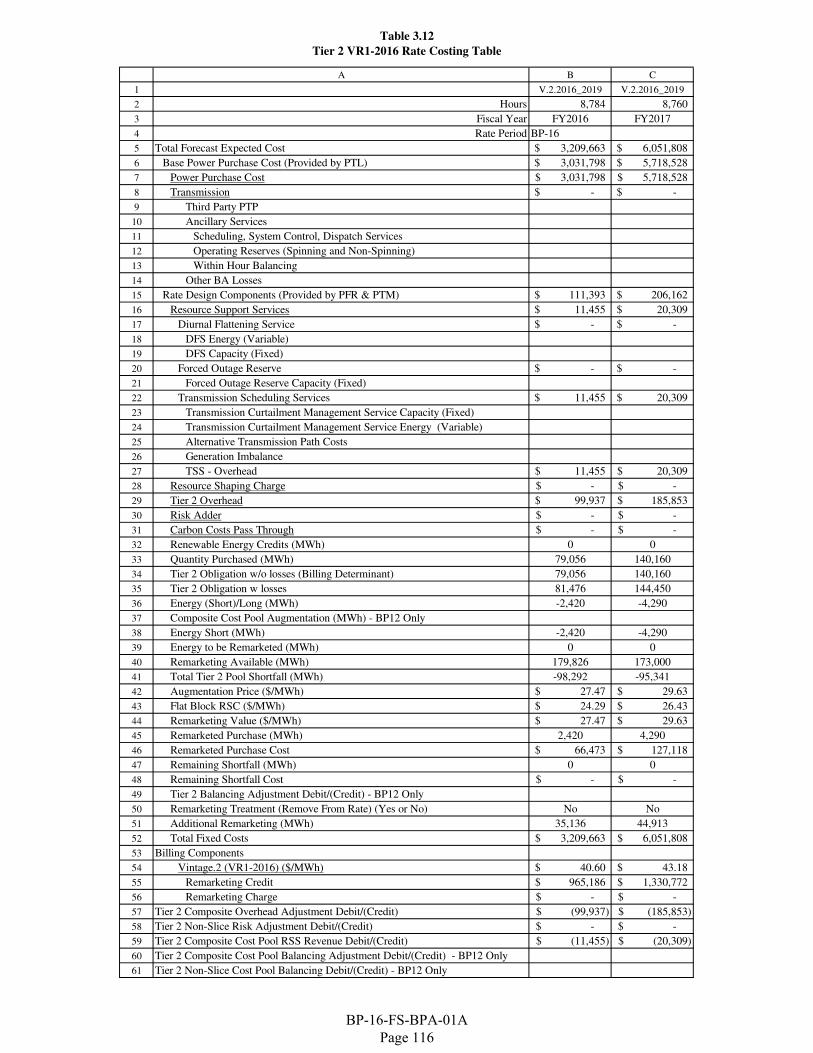
Table 3.12
Tier 2 VR1-2016 Rate Costing Table
A B C
1 V.2.2016_2019 V.2.2016_2019
2 Hours 8,784 8,760
3 Fiscal Year FY2016 FY2017
4 Rate Period BP-16
5 Total Forecast Expected Cost 3,209,663$ 6,051,808$
6 Base Power Purchase Cost (Provided by PTL) 3,031,798$ 5,718,528$
7 Power Purchase Cost 3,031,798$ 5,718,528$
8 Transmission -$ -$
9 Third Party PTP
10 Ancillary Services
11 Scheduling, System Control, Dispatch Services
12 Operating Reserves (Spinning and Non-Spinning)
13 Within Hour Balancing
14 Other BA Losses
15 Rate Design Components (Provided by PFR & PTM) 111,393$ 206,162$
16 Resource Support Services 11,455$ 20,309$
17 Diurnal Flattening Service -$ -$
18 DFS Energy (Variable)
19 DFS Capacity (Fixed)
20 Forced Outage Reserve -$ -$
21 Forced Outage Reserve Capacity (Fixed)
22 Transmission Scheduling Services 11,455$ 20,309$
23 Transmission Curtailment Management Service Capacity (Fixed)
24 Transmission Curtailment Management Service Energy (Variable)
25 Alternative Transmission Path Costs
26 Generation Imbalance
27 TSS - Overhead 11,455$ 20,309$
28 Resource Shaping Charge -$ -$
29 Tier 2 Overhead 99,937$ 185,853$
30 Risk Adder -$ -$
31 Carbon Costs Pass Through -$ -$
32 Renewable Energy Credits (MWh) 0 0
33 Quantity Purchased (MWh) 79,056 140,160
34 Tier 2 Obligation w/o losses (Billing Determinant) 79,056 140,160
35 Tier 2 Obligation w losses 81,476 144,450
36 Energy (Short)/Long (MWh) -2,420 -4,290
37 Composite Cost Pool Augmentation (MWh) - BP12 Only
38 Energy Short (MWh) -2,420 -4,290
39 Energy to be Remarketed (MWh) 0 0
40 Remarketing Available (MWh) 179,826 173,000
41 Total Tier 2 Pool Shortfall (MWh) -98,292 -95,341
42 Augmentation Price ($/MWh) 27.47$ 29.63$
43 Flat Block RSC ($/MWh) 24.29$ 26.43$
44 Remarketing Value ($/MWh) 27.47$ 29.63$
45 Remarketed Purchase (MWh) 2,420 4,290
46 Remarketed Purchase Cost 66,473$ 127,118$
47 Remaining Shortfall (MWh) 0 0
48 Remaining Shortfall Cost -$ -$
49 Tier 2 Balancing Adjustment Debit/(Credit) - BP12 Only
50 Remarketing Treatment (Remove From Rate) (Yes or No) No No
51 Additional Remarketing (MWh) 35,136 44,913
52 Total Fixed Costs 3,209,663$ 6,051,808$
53 Billing Components
54 Vintage.2 (VR1-2016) ($/MWh) 40.60$ 43.18$
55 Remarketing Credit 965,186$ 1,330,772$
56 Remarketing Charge -$ -$
57 Tier 2 Composite Overhead Adjustment Debit/(Credit) (99,937)$ (185,853)$
58 Tier 2 Non-Slice Risk Adjustment Debit/(Credit) -$ -$
59 Tier 2 Composite Cost Pool RSS Revenue Debit/(Credit) (11,455)$ (20,309)$
60 Tier 2 Composite Cost Pool Balancing Adjustment Debit/(Credit) - BP12 Only
61 Tier 2 Non-Slice Cost Pool Balancing Debit/(Credit) - BP12 Only
BP-16-FS-BPA-01A Page 116
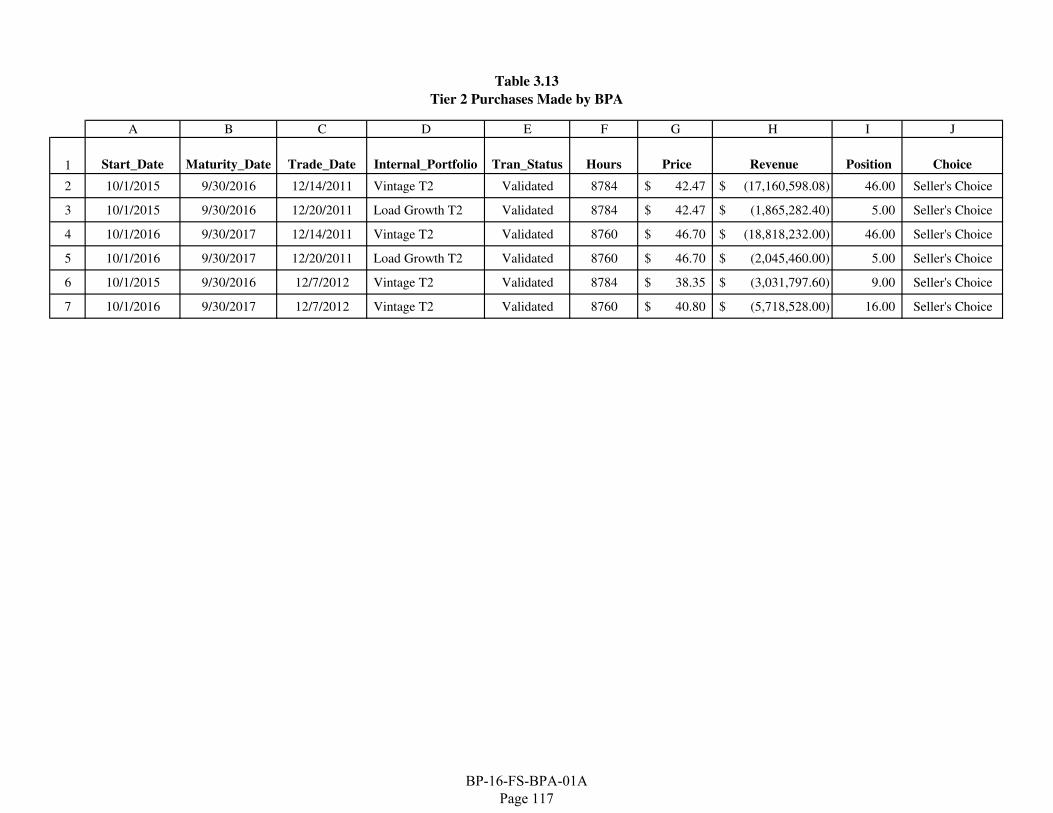
Table 3.13
Tier 2 Purchases Made by BPA
A B C D E F G H I J
1 Start_Date Maturity_Date Trade_Date Internal_Portfolio Tran_Status Hours Price Revenue Position Choice
2 10/1/2015 9/30/2016 12/14/2011 Vintage T2 Validated 8784 42.47$ (17,160,598.08)$ 46.00 Seller's Choice
3 10/1/2015 9/30/2016 12/20/2011 Load Growth T2 Validated 8784 42.47$ (1,865,282.40)$ 5.00 Seller's Choice
4 10/1/2016 9/30/2017 12/14/2011 Vintage T2 Validated 8760 46.70$ (18,818,232.00)$ 46.00 Seller's Choice
5 10/1/2016 9/30/2017 12/20/2011 Load Growth T2 Validated 8760 46.70$ (2,045,460.00)$ 5.00 Seller's Choice
6 10/1/2015 9/30/2016 12/7/2012 Vintage T2 Validated 8784 38.35$ (3,031,797.60)$ 9.00 Seller's Choice
7 10/1/2016 9/30/2017 12/7/2012 Vintage T2 Validated 8760 40.80$ (5,718,528.00)$ 16.00 Seller's Choice
BP-16-FS-BPA-01A Page 117
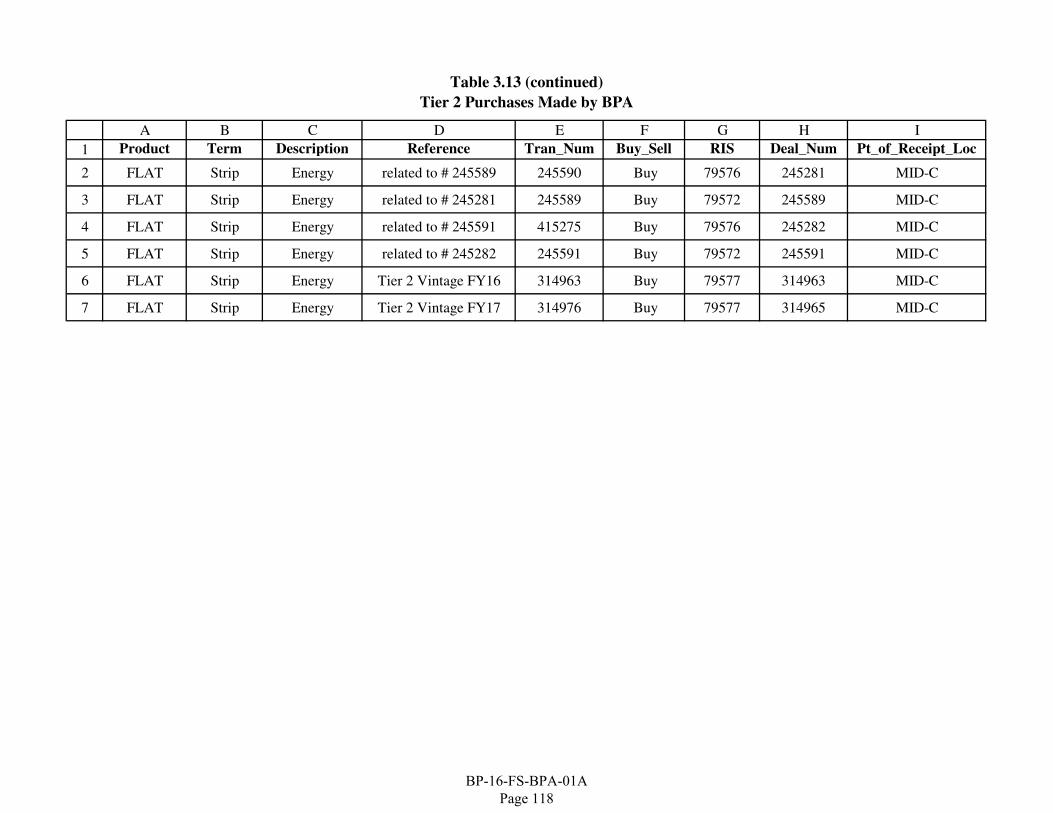
Table 3.13 (continued)
Tier 2 Purchases Made by BPA
A B C D E F G H I
1 Product Term Description Reference Tran_Num Buy_Sell RIS Deal_Num Pt_of_Receipt_Loc
2 FLAT Strip Energy related to # 245589 245590 Buy 79576 245281 MID-C
3 FLAT Strip Energy related to # 245281 245589 Buy 79572 245589 MID-C
4 FLAT Strip Energy related to # 245591 415275 Buy 79576 245282 MID-C
5 FLAT Strip Energy related to # 245282 245591 Buy 79572 245591 MID-C
6 FLAT Strip Energy Tier 2 Vintage FY16 314963 Buy 79577 314963 MID-C
7 FLAT Strip Energy Tier 2 Vintage FY17 314976 Buy 79577 314965 MID-C
BP-16-FS-BPA-01A Page 118
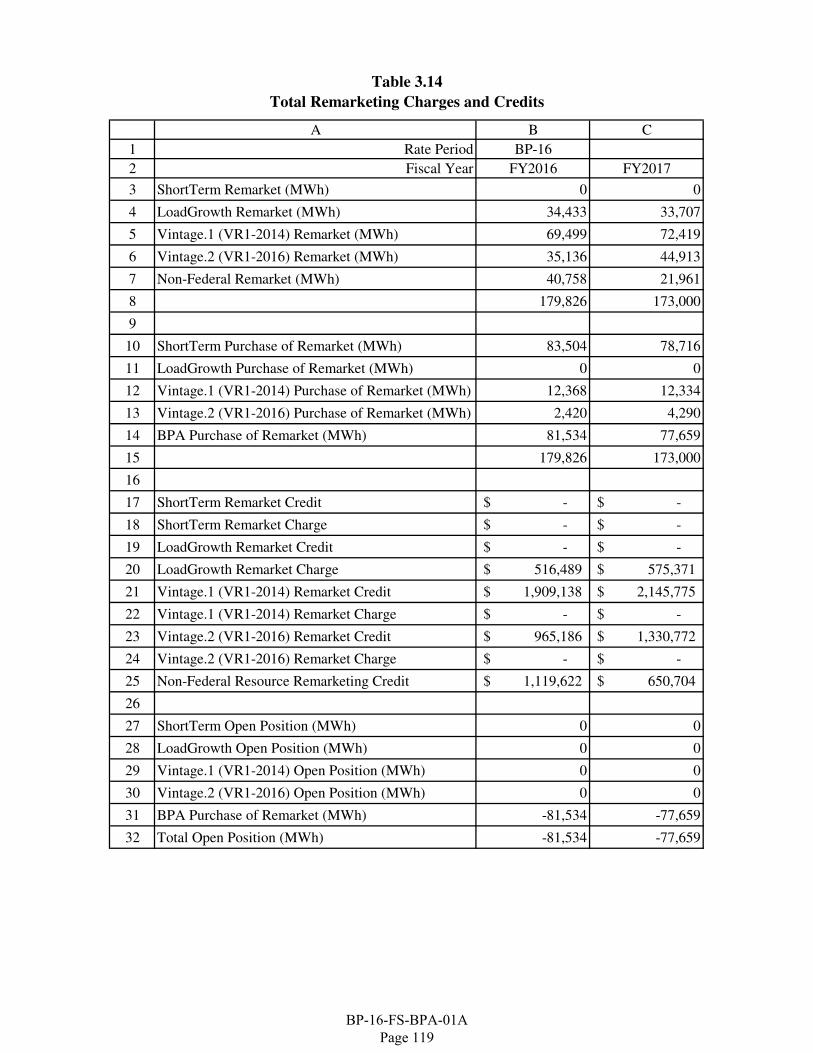
Table 3.14
Total Remarketing Charges and Credits
A B C
1 Rate Period BP-16
2 Fiscal Year FY2016 FY2017
3 ShortTerm Remarket (MWh) 0 0
4 LoadGrowth Remarket (MWh) 34,433 33,707
5 Vintage.1 (VR1-2014) Remarket (MWh) 69,499 72,419
6 Vintage.2 (VR1-2016) Remarket (MWh) 35,136 44,913
7 Non-Federal Remarket (MWh) 40,758 21,961
8 179,826 173,000
9
10 ShortTerm Purchase of Remarket (MWh) 83,504 78,716
11 LoadGrowth Purchase of Remarket (MWh) 0 0
12 Vintage.1 (VR1-2014) Purchase of Remarket (MWh) 12,368 12,334
13 Vintage.2 (VR1-2016) Purchase of Remarket (MWh) 2,420 4,290
14 BPA Purchase of Remarket (MWh) 81,534 77,659
15 179,826 173,000
16
17 ShortTerm Remarket Credit -$ -$
18 ShortTerm Remarket Charge -$ -$
19 LoadGrowth Remarket Credit -$ -$
20 LoadGrowth Remarket Charge 516,489$ 575,371$
21 Vintage.1 (VR1-2014) Remarket Credit 1,909,138$ 2,145,775$
22 Vintage.1 (VR1-2014) Remarket Charge -$ -$
23 Vintage.2 (VR1-2016) Remarket Credit 965,186$ 1,330,772$
24 Vintage.2 (VR1-2016) Remarket Charge -$ -$
25 Non-Federal Resource Remarketing Credit 1,119,622$ 650,704$
26
27 ShortTerm Open Position (MWh) 0 0
28 LoadGrowth Open Position (MWh) 0 0
29 Vintage.1 (VR1-2014) Open Position (MWh) 0 0
30 Vintage.2 (VR1-2016) Open Position (MWh) 0 0
31 BPA Purchase of Remarket (MWh) -81,534 -77,659
32 Total Open Position (MWh) -81,534 -77,659
BP-16-FS-BPA-01A Page 119
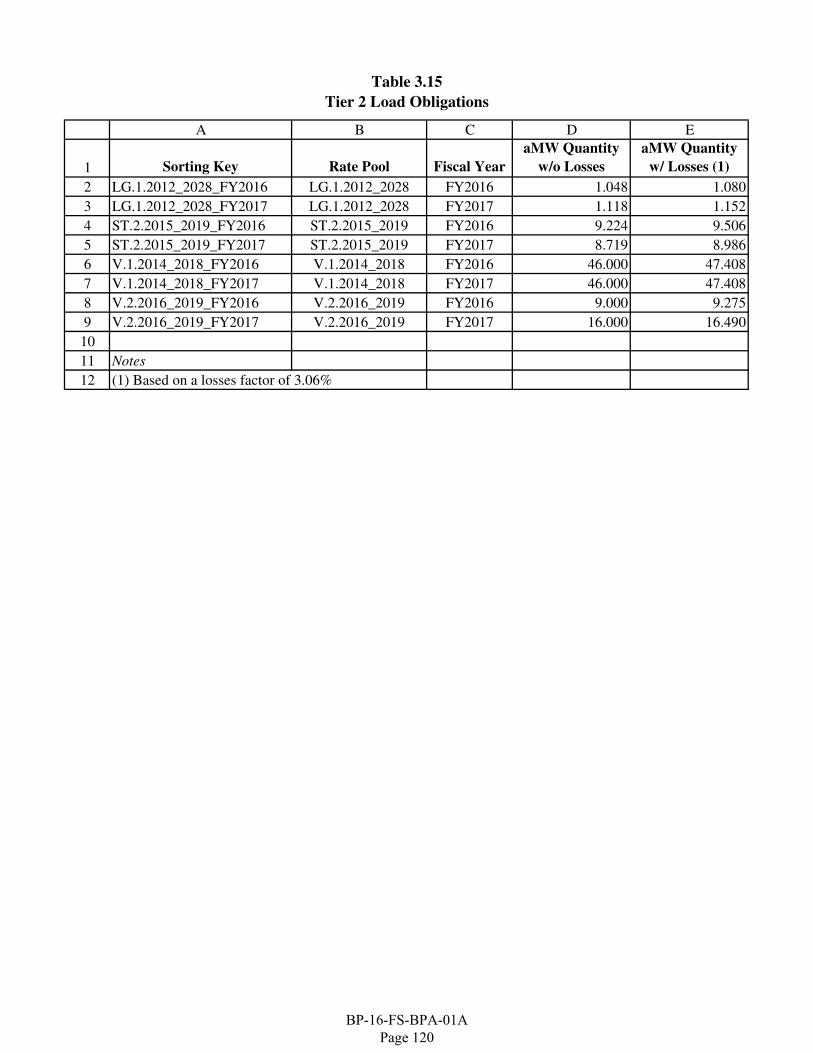
Table 3.15
Tier 2 Load Obligations
A B C D E
1 Sorting Key Rate Pool Fiscal Year
aMW Quantity
w/o Losses
aMW Quantity
w/ Losses (1)
2 LG.1.2012_2028_FY2016 LG.1.2012_2028 FY2016 1.048 1.080
3 LG.1.2012_2028_FY2017 LG.1.2012_2028 FY2017 1.118 1.152
4 ST.2.2015_2019_FY2016 ST.2.2015_2019 FY2016 9.224 9.506
5 ST.2.2015_2019_FY2017 ST.2.2015_2019 FY2017 8.719 8.986
6 V.1.2014_2018_FY2016 V.1.2014_2018 FY2016 46.000 47.408
7 V.1.2014_2018_FY2017 V.1.2014_2018 FY2017 46.000 47.408
8 V.2.2016_2019_FY2016 V.2.2016_2019 FY2016 9.000 9.275
9 V.2.2016_2019_FY2017 V.2.2016_2019 FY2017 16.000 16.490
10
11 Notes
12 (1) Based on a losses factor of 3.06%
BP-16-FS-BPA-01A Page 120
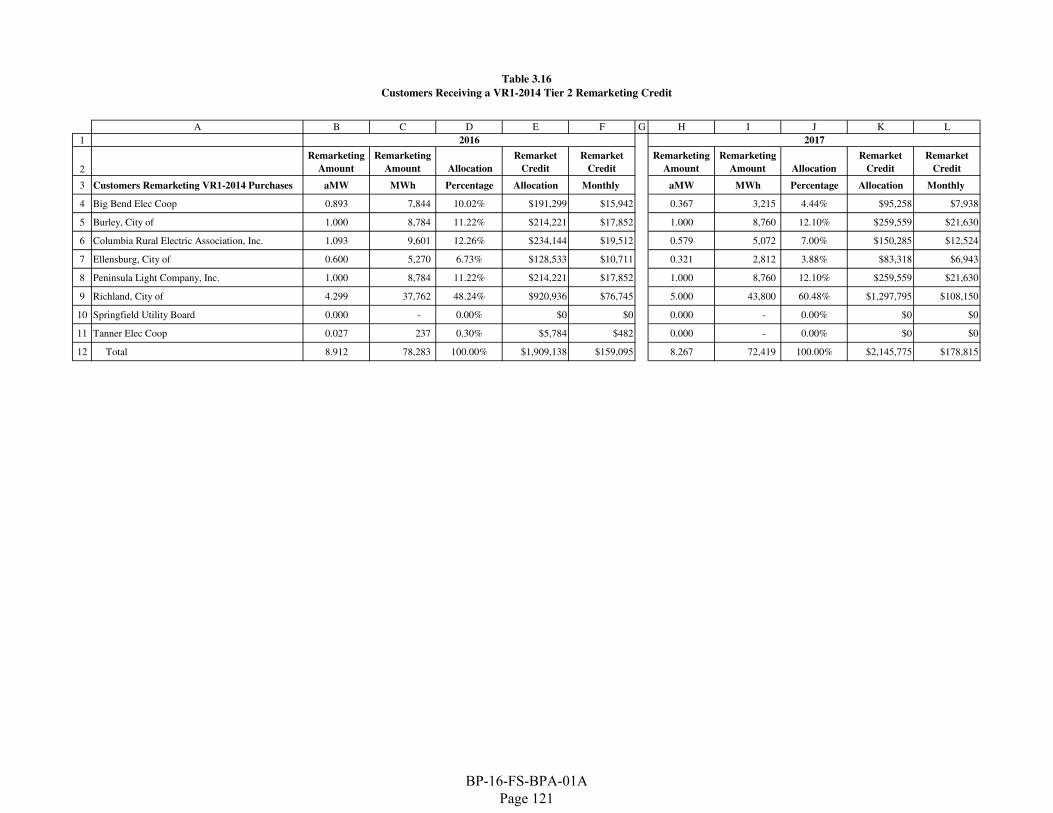
Table 3.16
Customers Receiving a VR1-2014 Tier 2 Remarketing Credit
A B C D E F G H I J K L
1
2
Remarketing
Amount
Remarketing
Amount Allocation
Remarket
Credit
Remarket
Credit
Remarketing
Amount
Remarketing
Amount Allocation
Remarket
Credit
Remarket
Credit
3 Customers Remarketing VR1-2014 Purchases aMW MWh Percentage Allocation Monthly aMW MWh Percentage Allocation Monthly
4 Big Bend Elec Coop 0.893 7,844 10.02% $191,299 $15,942 0.367 3,215 4.44% $95,258 $7,938
5 Burley, City of 1.000 8,784 11.22% $214,221 $17,852 1.000 8,760 12.10% $259,559 $21,630
6 Columbia Rural Electric Association, Inc. 1.093 9,601 12.26% $234,144 $19,512 0.579 5,072 7.00% $150,285 $12,524
7 Ellensburg, City of 0.600 5,270 6.73% $128,533 $10,711 0.321 2,812 3.88% $83,318 $6,943
8 Peninsula Light Company, Inc. 1.000 8,784 11.22% $214,221 $17,852 1.000 8,760 12.10% $259,559 $21,630
9 Richland, City of 4.299 37,762 48.24% $920,936 $76,745 5.000 43,800 60.48% $1,297,795 $108,150
10 Springfield Utility Board 0.000 - 0.00% $0 $0 0.000 - 0.00% $0 $0
11 Tanner Elec Coop 0.027 237 0.30% $5,784 $482 0.000 - 0.00% $0 $0
12 Total 8.912 78,283 100.00% $1,909,138 $159,095 8.267 72,419 100.00% $2,145,775 $178,815
2016 2017
BP-16-FS-BPA-01A Page 121
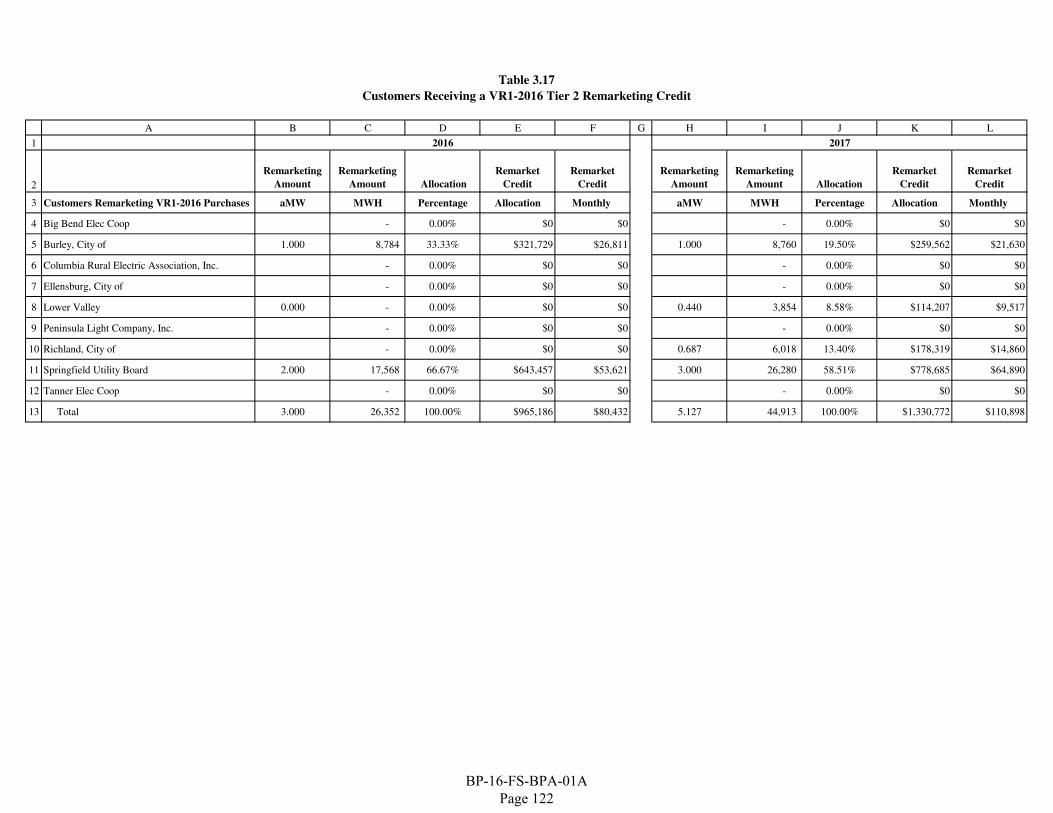
Table 3.17
Customers Receiving a VR1-2016 Tier 2 Remarketing Credit
A B C D E F G H I J K L
1
2
Remarketing
Amount
Remarketing
Amount Allocation
Remarket
Credit
Remarket
Credit
Remarketing
Amount
Remarketing
Amount Allocation
Remarket
Credit
Remarket
Credit
3 Customers Remarketing VR1-2016 Purchases aMW MWH Percentage Allocation Monthly aMW MWH Percentage Allocation Monthly
4 Big Bend Elec Coop - 0.00% $0 $0 - 0.00% $0 $0
5 Burley, City of 1.000 8,784 33.33% $321,729 $26,811 1.000 8,760 19.50% $259,562 $21,630
6 Columbia Rural Electric Association, Inc. - 0.00% $0 $0 - 0.00% $0 $0
7 Ellensburg, City of - 0.00% $0 $0 - 0.00% $0 $0
8 Lower Valley 0.000 - 0.00% $0 $0 0.440 3,854 8.58% $114,207 $9,517
9 Peninsula Light Company, Inc. - 0.00% $0 $0 - 0.00% $0 $0
10 Richland, City of - 0.00% $0 $0 0.687 6,018 13.40% $178,319 $14,860
11 Springfield Utility Board 2.000 17,568 66.67% $643,457 $53,621 3.000 26,280 58.51% $778,685 $64,890
12 Tanner Elec Coop - 0.00% $0 $0 - 0.00% $0 $0
13 Total 3.000 26,352 100.00% $965,186 $80,432 5.127 44,913 100.00% $1,330,772 $110,898
2016 2017
BP-16-FS-BPA-01A Page 122
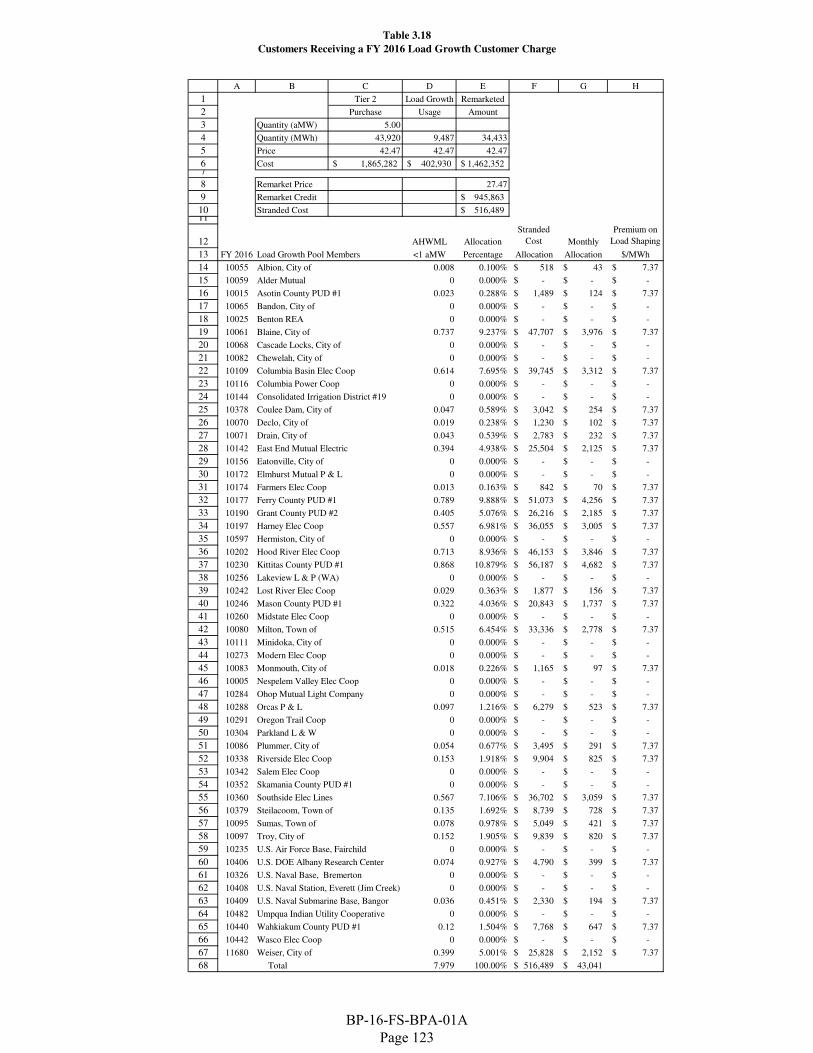
Table 3.18
Customers Receiving a FY 2016 Load Growth Customer Charge
A B C D E F G H
1 Tier 2 Load Growth Remarketed
2 Purchase Usage Amount
3 Quantity (aMW) 5.00
4 Quantity (MWh) 43,920 9,487 34,433
5 Price 42.47 42.47 42.47
6 Cost 1,865,282$ 402,930$ 1,462,352$ 7
8 Remarket Price 27.47
9 Remarket Credit 945,863$
10 Stranded Cost 516,489$ 11
12 AHWML Allocation
Stranded
Cost Monthly
Premium on
Load Shaping
13 FY 2016 Load Growth Pool Members <1 aMW Percentage Allocation Allocation $/MWh
14 10055 Albion, City of 0.008 0.100% 518$ 43$ 7.37$
15 10059 Alder Mutual 0 0.000% -$ -$ -$
16 10015 Asotin County PUD #1 0.023 0.288% 1,489$ 124$ 7.37$
17 10065 Bandon, City of 0 0.000% -$ -$ -$
18 10025 Benton REA 0 0.000% -$ -$ -$
19 10061 Blaine, City of 0.737 9.237% 47,707$ 3,976$ 7.37$
20 10068 Cascade Locks, City of 0 0.000% -$ -$ -$
21 10082 Chewelah, City of 0 0.000% -$ -$ -$
22 10109 Columbia Basin Elec Coop 0.614 7.695% 39,745$ 3,312$ 7.37$
23 10116 Columbia Power Coop 0 0.000% -$ -$ -$
24 10144 Consolidated Irrigation District #19 0 0.000% -$ -$ -$
25 10378 Coulee Dam, City of 0.047 0.589% 3,042$ 254$ 7.37$
26 10070 Declo, City of 0.019 0.238% 1,230$ 102$ 7.37$
27 10071 Drain, City of 0.043 0.539% 2,783$ 232$ 7.37$
28 10142 East End Mutual Electric 0.394 4.938% 25,504$ 2,125$ 7.37$
29 10156 Eatonville, City of 0 0.000% -$ -$ -$
30 10172 Elmhurst Mutual P & L 0 0.000% -$ -$ -$
31 10174 Farmers Elec Coop 0.013 0.163% 842$ 70$ 7.37$
32 10177 Ferry County PUD #1 0.789 9.888% 51,073$ 4,256$ 7.37$
33 10190 Grant County PUD #2 0.405 5.076% 26,216$ 2,185$ 7.37$
34 10197 Harney Elec Coop 0.557 6.981% 36,055$ 3,005$ 7.37$
35 10597 Hermiston, City of 0 0.000% -$ -$ -$
36 10202 Hood River Elec Coop 0.713 8.936% 46,153$ 3,846$ 7.37$
37 10230 Kittitas County PUD #1 0.868 10.879% 56,187$ 4,682$ 7.37$
38 10256 Lakeview L & P (WA) 0 0.000% -$ -$ -$
39 10242 Lost River Elec Coop 0.029 0.363% 1,877$ 156$ 7.37$
40 10246 Mason County PUD #1 0.322 4.036% 20,843$ 1,737$ 7.37$
41 10260 Midstate Elec Coop 0 0.000% -$ -$ -$
42 10080 Milton, Town of 0.515 6.454% 33,336$ 2,778$ 7.37$
43 10111 Minidoka, City of 0 0.000% -$ -$ -$
44 10273 Modern Elec Coop 0 0.000% -$ -$ -$
45 10083 Monmouth, City of 0.018 0.226% 1,165$ 97$ 7.37$
46 10005 Nespelem Valley Elec Coop 0 0.000% -$ -$ -$
47 10284 Ohop Mutual Light Company 0 0.000% -$ -$ -$
48 10288 Orcas P & L 0.097 1.216% 6,279$ 523$ 7.37$
49 10291 Oregon Trail Coop 0 0.000% -$ -$ -$
50 10304 Parkland L & W 0 0.000% -$ -$ -$
51 10086 Plummer, City of 0.054 0.677% 3,495$ 291$ 7.37$
52 10338 Riverside Elec Coop 0.153 1.918% 9,904$ 825$ 7.37$
53 10342 Salem Elec Coop 0 0.000% -$ -$ -$
54 10352 Skamania County PUD #1 0 0.000% -$ -$ -$
55 10360 Southside Elec Lines 0.567 7.106% 36,702$ 3,059$ 7.37$
56 10379 Steilacoom, Town of 0.135 1.692% 8,739$ 728$ 7.37$
57 10095 Sumas, Town of 0.078 0.978% 5,049$ 421$ 7.37$
58 10097 Troy, City of 0.152 1.905% 9,839$ 820$ 7.37$
59 10235 U.S. Air Force Base, Fairchild 0 0.000% -$ -$ -$
60 10406 U.S. DOE Albany Research Center 0.074 0.927% 4,790$ 399$ 7.37$
61 10326 U.S. Naval Base, Bremerton 0 0.000% -$ -$ -$
62 10408 U.S. Naval Station, Everett (Jim Creek) 0 0.000% -$ -$ -$
63 10409 U.S. Naval Submarine Base, Bangor 0.036 0.451% 2,330$ 194$ 7.37$
64 10482 Umpqua Indian Utility Cooperative 0 0.000% -$ -$ -$
65 10440 Wahkiakum County PUD #1 0.12 1.504% 7,768$ 647$ 7.37$
66 10442 Wasco Elec Coop 0 0.000% -$ -$ -$
67 11680 Weiser, City of 0.399 5.001% 25,828$ 2,152$ 7.37$
68 Total 7.979 100.00% 516,489$ 43,041$
BP-16-FS-BPA-01A Page 123
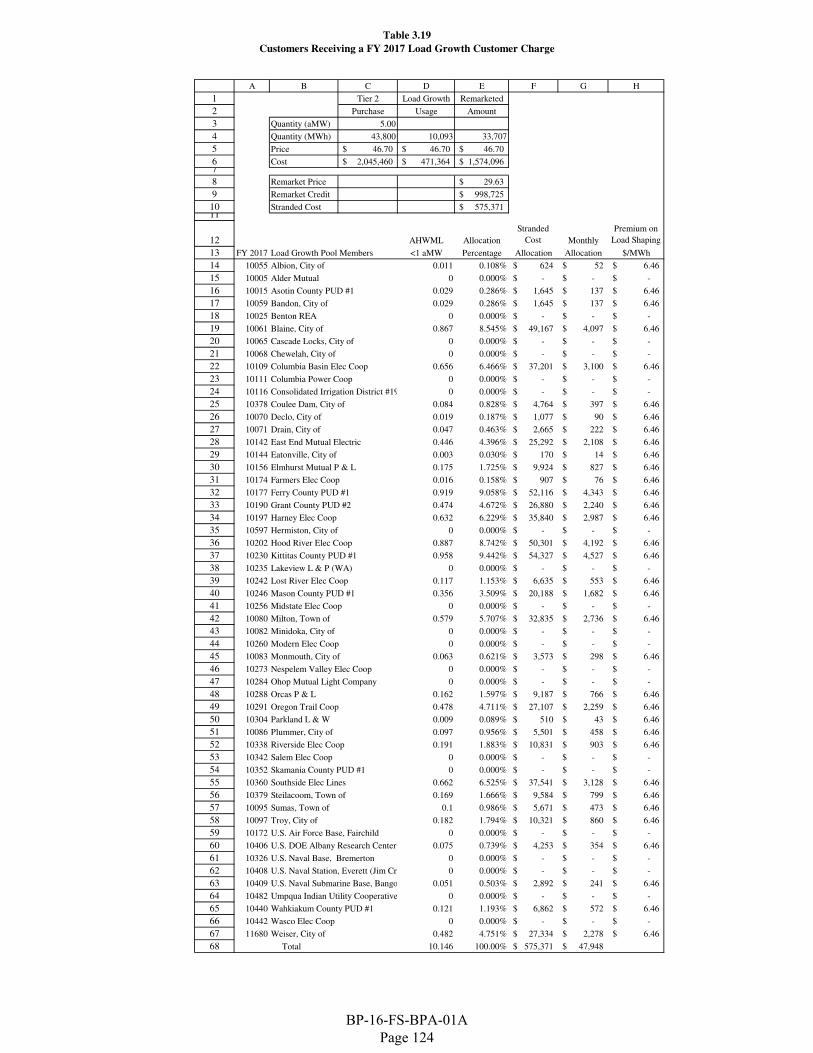
Table 3.19
Customers Receiving a FY 2017 Load Growth Customer Charge
A B C D E F G H
1 Tier 2 Load Growth Remarketed
2 Purchase Usage Amount
3 Quantity (aMW) 5.00
4 Quantity (MWh) 43,800 10,093 33,707
5 Price 46.70$ 46.70$ 46.70$
6 Cost 2,045,460$ 471,364$ 1,574,096$ 7
8 Remarket Price 29.63$
9 Remarket Credit 998,725$
10 Stranded Cost 575,371$ 11
12 AHWML Allocation
Stranded
Cost Monthly
Premium on
Load Shaping
13 FY 2017 Load Growth Pool Members <1 aMW Percentage Allocation Allocation $/MWh
14 10055 Albion, City of 0.011 0.108% 624$ 52$ 6.46$
15 10005 Alder Mutual 0 0.000% -$ -$ -$
16 10015 Asotin County PUD #1 0.029 0.286% 1,645$ 137$ 6.46$
17 10059 Bandon, City of 0.029 0.286% 1,645$ 137$ 6.46$
18 10025 Benton REA 0 0.000% -$ -$ -$
19 10061 Blaine, City of 0.867 8.545% 49,167$ 4,097$ 6.46$
20 10065 Cascade Locks, City of 0 0.000% -$ -$ -$
21 10068 Chewelah, City of 0 0.000% -$ -$ -$
22 10109 Columbia Basin Elec Coop 0.656 6.466% 37,201$ 3,100$ 6.46$
23 10111 Columbia Power Coop 0 0.000% -$ -$ -$
24 10116 Consolidated Irrigation District #19 0 0.000% -$ -$ -$
25 10378 Coulee Dam, City of 0.084 0.828% 4,764$ 397$ 6.46$
26 10070 Declo, City of 0.019 0.187% 1,077$ 90$ 6.46$
27 10071 Drain, City of 0.047 0.463% 2,665$ 222$ 6.46$
28 10142 East End Mutual Electric 0.446 4.396% 25,292$ 2,108$ 6.46$
29 10144 Eatonville, City of 0.003 0.030% 170$ 14$ 6.46$
30 10156 Elmhurst Mutual P & L 0.175 1.725% 9,924$ 827$ 6.46$
31 10174 Farmers Elec Coop 0.016 0.158% 907$ 76$ 6.46$
32 10177 Ferry County PUD #1 0.919 9.058% 52,116$ 4,343$ 6.46$
33 10190 Grant County PUD #2 0.474 4.672% 26,880$ 2,240$ 6.46$
34 10197 Harney Elec Coop 0.632 6.229% 35,840$ 2,987$ 6.46$
35 10597 Hermiston, City of 0 0.000% -$ -$ -$
36 10202 Hood River Elec Coop 0.887 8.742% 50,301$ 4,192$ 6.46$
37 10230 Kittitas County PUD #1 0.958 9.442% 54,327$ 4,527$ 6.46$
38 10235 Lakeview L & P (WA) 0 0.000% -$ -$ -$
39 10242 Lost River Elec Coop 0.117 1.153% 6,635$ 553$ 6.46$
40 10246 Mason County PUD #1 0.356 3.509% 20,188$ 1,682$ 6.46$
41 10256 Midstate Elec Coop 0 0.000% -$ -$ -$
42 10080 Milton, Town of 0.579 5.707% 32,835$ 2,736$ 6.46$
43 10082 Minidoka, City of 0 0.000% -$ -$ -$
44 10260 Modern Elec Coop 0 0.000% -$ -$ -$
45 10083 Monmouth, City of 0.063 0.621% 3,573$ 298$ 6.46$
46 10273 Nespelem Valley Elec Coop 0 0.000% -$ -$ -$
47 10284 Ohop Mutual Light Company 0 0.000% -$ -$ -$
48 10288 Orcas P & L 0.162 1.597% 9,187$ 766$ 6.46$
49 10291 Oregon Trail Coop 0.478 4.711% 27,107$ 2,259$ 6.46$
50 10304 Parkland L & W 0.009 0.089% 510$ 43$ 6.46$
51 10086 Plummer, City of 0.097 0.956% 5,501$ 458$ 6.46$
52 10338 Riverside Elec Coop 0.191 1.883% 10,831$ 903$ 6.46$
53 10342 Salem Elec Coop 0 0.000% -$ -$ -$
54 10352 Skamania County PUD #1 0 0.000% -$ -$ -$
55 10360 Southside Elec Lines 0.662 6.525% 37,541$ 3,128$ 6.46$
56 10379 Steilacoom, Town of 0.169 1.666% 9,584$ 799$ 6.46$
57 10095 Sumas, Town of 0.1 0.986% 5,671$ 473$ 6.46$
58 10097 Troy, City of 0.182 1.794% 10,321$ 860$ 6.46$
59 10172 U.S. Air Force Base, Fairchild 0 0.000% -$ -$ -$
60 10406 U.S. DOE Albany Research Center 0.075 0.739% 4,253$ 354$ 6.46$
61 10326 U.S. Naval Base, Bremerton 0 0.000% -$ -$ -$
62 10408 U.S. Naval Station, Everett (Jim Creek) 0 0.000% -$ -$ -$
63 10409 U.S. Naval Submarine Base, Bangor 0.051 0.503% 2,892$ 241$ 6.46$
64 10482 Umpqua Indian Utility Cooperative 0 0.000% -$ -$ -$
65 10440 Wahkiakum County PUD #1 0.121 1.193% 6,862$ 572$ 6.46$
66 10442 Wasco Elec Coop 0 0.000% -$ -$ -$
67 11680 Weiser, City of 0.482 4.751% 27,334$ 2,278$ 6.46$
68 Total 10.146 100.00% 575,371$ 47,948$
BP-16-FS-BPA-01A Page 124
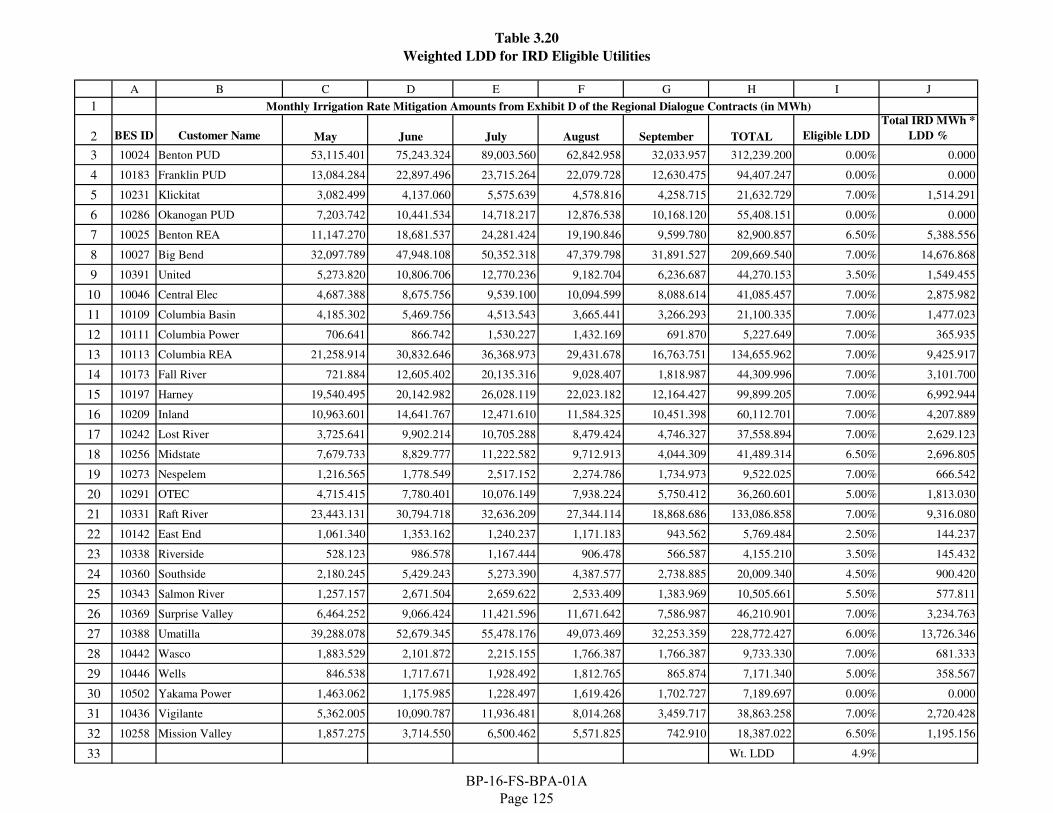
Table 3.20
Weighted LDD for IRD Eligible Utilities
A B C D E F G H I J
1 Monthly Irrigation Rate Mitigation Amounts from Exhibit D of the Regional Dialogue Contracts (in MWh)
2 BES ID Customer Name May June July August September TOTAL Eligible LDD
Total IRD MWh *
LDD %
3 10024 Benton PUD 53,115.401 75,243.324 89,003.560 62,842.958 32,033.957 312,239.200 0.00% 0.000
4 10183 Franklin PUD 13,084.284 22,897.496 23,715.264 22,079.728 12,630.475 94,407.247 0.00% 0.000
5 10231 Klickitat 3,082.499 4,137.060 5,575.639 4,578.816 4,258.715 21,632.729 7.00% 1,514.291
6 10286 Okanogan PUD 7,203.742 10,441.534 14,718.217 12,876.538 10,168.120 55,408.151 0.00% 0.000
7 10025 Benton REA 11,147.270 18,681.537 24,281.424 19,190.846 9,599.780 82,900.857 6.50% 5,388.556
8 10027 Big Bend 32,097.789 47,948.108 50,352.318 47,379.798 31,891.527 209,669.540 7.00% 14,676.868
9 10391 United 5,273.820 10,806.706 12,770.236 9,182.704 6,236.687 44,270.153 3.50% 1,549.455
10 10046 Central Elec 4,687.388 8,675.756 9,539.100 10,094.599 8,088.614 41,085.457 7.00% 2,875.982
11 10109 Columbia Basin 4,185.302 5,469.756 4,513.543 3,665.441 3,266.293 21,100.335 7.00% 1,477.023
12 10111 Columbia Power 706.641 866.742 1,530.227 1,432.169 691.870 5,227.649 7.00% 365.935
13 10113 Columbia REA 21,258.914 30,832.646 36,368.973 29,431.678 16,763.751 134,655.962 7.00% 9,425.917
14 10173 Fall River 721.884 12,605.402 20,135.316 9,028.407 1,818.987 44,309.996 7.00% 3,101.700
15 10197 Harney 19,540.495 20,142.982 26,028.119 22,023.182 12,164.427 99,899.205 7.00% 6,992.944
16 10209 Inland 10,963.601 14,641.767 12,471.610 11,584.325 10,451.398 60,112.701 7.00% 4,207.889
17 10242 Lost River 3,725.641 9,902.214 10,705.288 8,479.424 4,746.327 37,558.894 7.00% 2,629.123
18 10256 Midstate 7,679.733 8,829.777 11,222.582 9,712.913 4,044.309 41,489.314 6.50% 2,696.805
19 10273 Nespelem 1,216.565 1,778.549 2,517.152 2,274.786 1,734.973 9,522.025 7.00% 666.542
20 10291 OTEC 4,715.415 7,780.401 10,076.149 7,938.224 5,750.412 36,260.601 5.00% 1,813.030
21 10331 Raft River 23,443.131 30,794.718 32,636.209 27,344.114 18,868.686 133,086.858 7.00% 9,316.080
22 10142 East End 1,061.340 1,353.162 1,240.237 1,171.183 943.562 5,769.484 2.50% 144.237
23 10338 Riverside 528.123 986.578 1,167.444 906.478 566.587 4,155.210 3.50% 145.432
24 10360 Southside 2,180.245 5,429.243 5,273.390 4,387.577 2,738.885 20,009.340 4.50% 900.420
25 10343 Salmon River 1,257.157 2,671.504 2,659.622 2,533.409 1,383.969 10,505.661 5.50% 577.811
26 10369 Surprise Valley 6,464.252 9,066.424 11,421.596 11,671.642 7,586.987 46,210.901 7.00% 3,234.763
27 10388 Umatilla 39,288.078 52,679.345 55,478.176 49,073.469 32,253.359 228,772.427 6.00% 13,726.346
28 10442 Wasco 1,883.529 2,101.872 2,215.155 1,766.387 1,766.387 9,733.330 7.00% 681.333
29 10446 Wells 846.538 1,717.671 1,928.492 1,812.765 865.874 7,171.340 5.00% 358.567
30 10502 Yakama Power 1,463.062 1,175.985 1,228.497 1,619.426 1,702.727 7,189.697 0.00% 0.000
31 10436 Vigilante 5,362.005 10,090.787 11,936.481 8,014.268 3,459.717 38,863.258 7.00% 2,720.428
32 10258 Mission Valley 1,857.275 3,714.550 6,500.462 5,571.825 742.910 18,387.022 6.50% 1,195.156
33 Wt. LDD 4.9%
BP-16-FS-BPA-01A Page 125
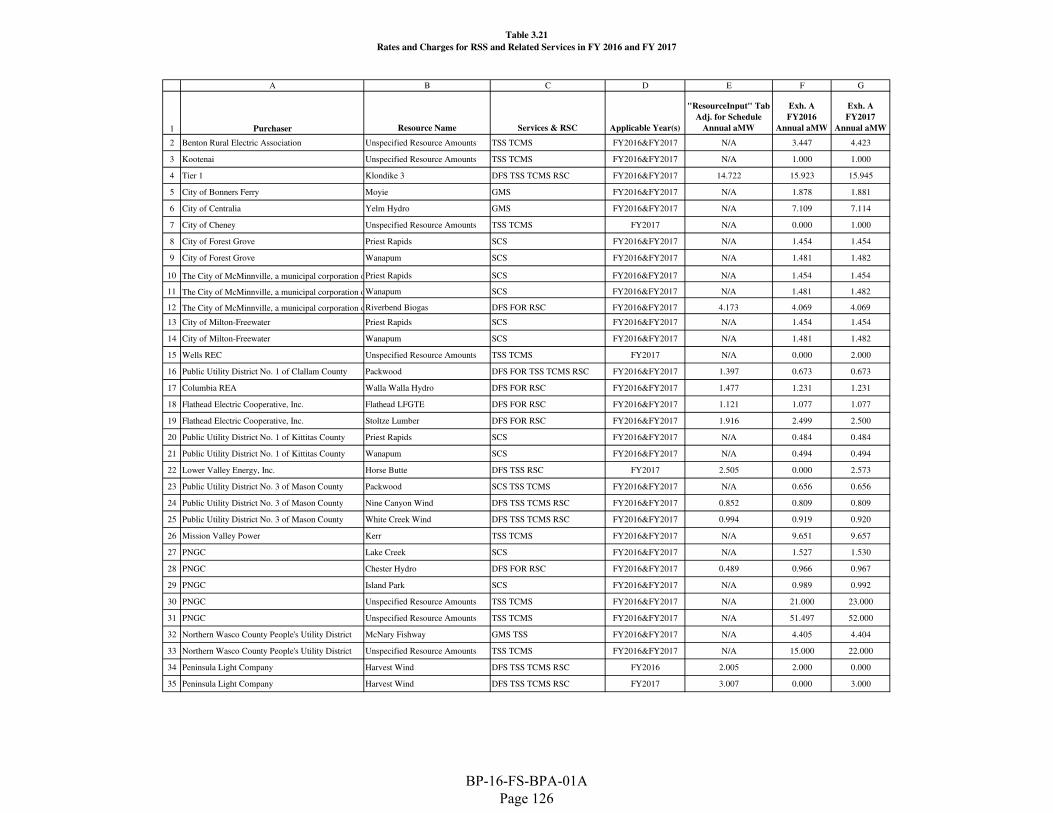
Table 3.21
Rates and Charges for RSS and Related Services in FY 2016 and FY 2017
A B C D E F G
1 Purchaser Resource Name Services & RSC Applicable Year(s)
"ResourceInput" Tab
Adj. for Schedule
Annual aMW
Exh. A
FY2016
Annual aMW
Exh. A
FY2017
Annual aMW
2 Benton Rural Electric Association Unspecified Resource Amounts TSS TCMS FY2016&FY2017 N/A 3.447 4.423
3 Kootenai Unspecified Resource Amounts TSS TCMS FY2016&FY2017 N/A 1.000 1.000
4 Tier 1 Klondike 3 DFS TSS TCMS RSC FY2016&FY2017 14.722 15.923 15.945
5 City of Bonners Ferry Moyie GMS FY2016&FY2017 N/A 1.878 1.881
6 City of Centralia Yelm Hydro GMS FY2016&FY2017 N/A 7.109 7.114
7 City of Cheney Unspecified Resource Amounts TSS TCMS FY2017 N/A 0.000 1.000
8 City of Forest Grove Priest Rapids SCS FY2016&FY2017 N/A 1.454 1.454
9 City of Forest Grove Wanapum SCS FY2016&FY2017 N/A 1.481 1.482
10 The City of McMinnville, a municipal corporation of the State of Oregon, acting by and through its Water and Light CommissionPriest Rapids SCS FY2016&FY2017 N/A 1.454 1.454
11 The City of McMinnville, a municipal corporation of the State of Oregon, acting by and through its Water and Light CommissionWanapum SCS FY2016&FY2017 N/A 1.481 1.482
12 The City of McMinnville, a municipal corporation of the State of Oregon, acting by and through its Water and Light CommissionRiverbend Biogas DFS FOR RSC FY2016&FY2017 4.173 4.069 4.069
13 City of Milton-Freewater Priest Rapids SCS FY2016&FY2017 N/A 1.454 1.454
14 City of Milton-Freewater Wanapum SCS FY2016&FY2017 N/A 1.481 1.482
15 Wells REC Unspecified Resource Amounts TSS TCMS FY2017 N/A 0.000 2.000
16 Public Utility District No. 1 of Clallam County Packwood DFS FOR TSS TCMS RSC FY2016&FY2017 1.397 0.673 0.673
17 Columbia REA Walla Walla Hydro DFS FOR RSC FY2016&FY2017 1.477 1.231 1.231
18 Flathead Electric Cooperative, Inc. Flathead LFGTE DFS FOR RSC FY2016&FY2017 1.121 1.077 1.077
19 Flathead Electric Cooperative, Inc. Stoltze Lumber DFS FOR RSC FY2016&FY2017 1.916 2.499 2.500
20 Public Utility District No. 1 of Kittitas County Priest Rapids SCS FY2016&FY2017 N/A 0.484 0.484
21 Public Utility District No. 1 of Kittitas County Wanapum SCS FY2016&FY2017 N/A 0.494 0.494
22 Lower Valley Energy, Inc. Horse Butte DFS TSS RSC FY2017 2.505 0.000 2.573
23 Public Utility District No. 3 of Mason County Packwood SCS TSS TCMS FY2016&FY2017 N/A 0.656 0.656
24 Public Utility District No. 3 of Mason County Nine Canyon Wind DFS TSS TCMS RSC FY2016&FY2017 0.852 0.809 0.809
25 Public Utility District No. 3 of Mason County White Creek Wind DFS TSS TCMS RSC FY2016&FY2017 0.994 0.919 0.920
26 Mission Valley Power Kerr TSS TCMS FY2016&FY2017 N/A 9.651 9.657
27 PNGC Lake Creek SCS FY2016&FY2017 N/A 1.527 1.530
28 PNGC Chester Hydro DFS FOR RSC FY2016&FY2017 0.489 0.966 0.967
29 PNGC Island Park SCS FY2016&FY2017 N/A 0.989 0.992
30 PNGC Unspecified Resource Amounts TSS TCMS FY2016&FY2017 N/A 21.000 23.000
31 PNGC Unspecified Resource Amounts TSS TCMS FY2016&FY2017 N/A 51.497 52.000
32 Northern Wasco County People's Utility District McNary Fishway GMS TSS FY2016&FY2017 N/A 4.405 4.404
33 Northern Wasco County People's Utility District Unspecified Resource Amounts TSS TCMS FY2016&FY2017 N/A 15.000 22.000
34 Peninsula Light Company Harvest Wind DFS TSS TCMS RSC FY2016 2.005 2.000 0.000
35 Peninsula Light Company Harvest Wind DFS TSS TCMS RSC FY2017 3.007 0.000 3.000
BP-16-FS-BPA-01A Page 126
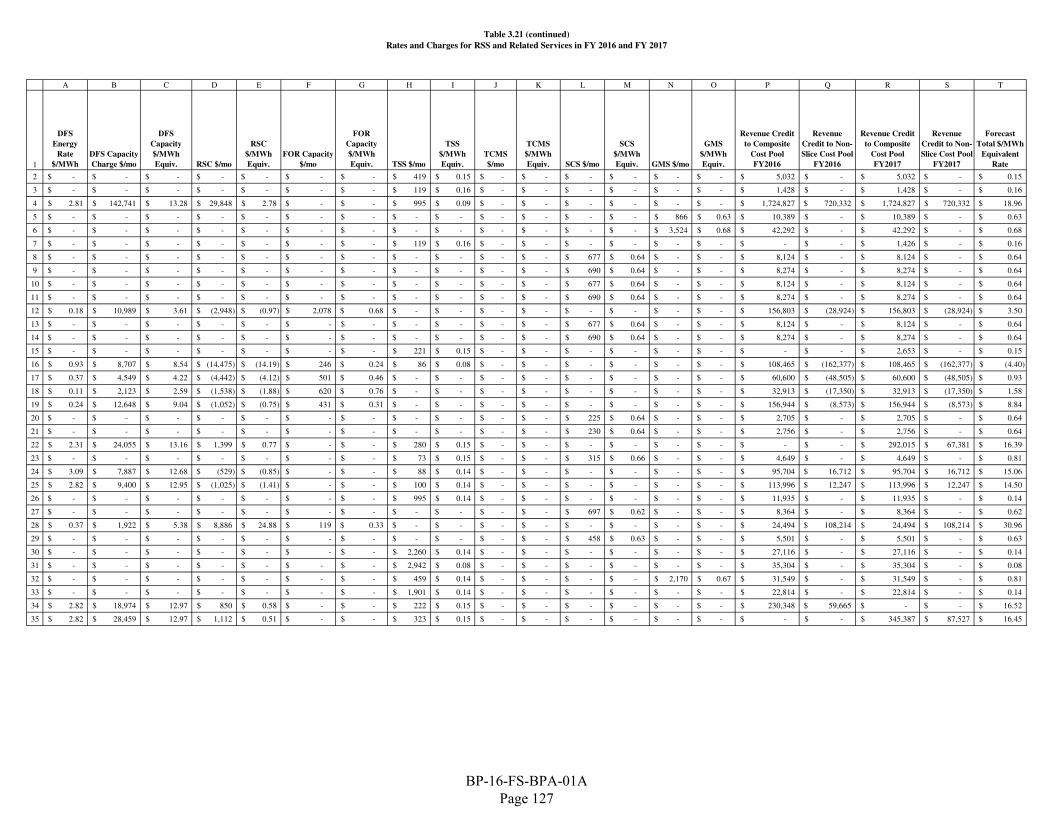
Table 3.21 (continued)
Rates and Charges for RSS and Related Services in FY 2016 and FY 2017
A B C D E F G H I J K L M N O P Q R S T
1
DFS
Energy
Rate
$/MWh
DFS Capacity
Charge $/mo
DFS
Capacity
$/MWh
Equiv. RSC $/mo
RSC
$/MWh
Equiv.
FOR Capacity
$/mo
FOR
Capacity
$/MWh
Equiv. TSS $/mo
TSS
$/MWh
Equiv.
TCMS
$/mo
TCMS
$/MWh
Equiv. SCS $/mo
SCS
$/MWh
Equiv. GMS $/mo
GMS
$/MWh
Equiv.
Revenue Credit
to Composite
Cost Pool
FY2016
Revenue
Credit to Non-
Slice Cost Pool
FY2016
Revenue Credit
to Composite
Cost Pool
FY2017
Revenue
Credit to Non-
Slice Cost Pool
FY2017
Forecast
Total $/MWh
Equivalent
Rate
2 -$ -$ -$ -$ -$ -$ -$ 419$ 0.15$ -$ -$ -$ -$ -$ -$ 5,032$ -$ 5,032$ -$ 0.15$
3 -$ -$ -$ -$ -$ -$ -$ 119$ 0.16$ -$ -$ -$ -$ -$ -$ 1,428$ -$ 1,428$ -$ 0.16$
4 2.81$ 142,741$ 13.28$ 29,848$ 2.78$ -$ -$ 995$ 0.09$ -$ -$ -$ -$ -$ -$ 1,724,827$ 720,332$ 1,724,827$ 720,332$ 18.96$
5 -$ -$ -$ -$ -$ -$ -$ -$ -$ -$ -$ -$ -$ 866$ 0.63$ 10,389$ -$ 10,389$ -$ 0.63$
6 -$ -$ -$ -$ -$ -$ -$ -$ -$ -$ -$ -$ -$ 3,524$ 0.68$ 42,292$ -$ 42,292$ -$ 0.68$
7 -$ -$ -$ -$ -$ -$ -$ 119$ 0.16$ -$ -$ -$ -$ -$ -$ -$ -$ 1,426$ -$ 0.16$
8 -$ -$ -$ -$ -$ -$ -$ -$ -$ -$ -$ 677$ 0.64$ -$ -$ 8,124$ -$ 8,124$ -$ 0.64$
9 -$ -$ -$ -$ -$ -$ -$ -$ -$ -$ -$ 690$ 0.64$ -$ -$ 8,274$ -$ 8,274$ -$ 0.64$
10 -$ -$ -$ -$ -$ -$ -$ -$ -$ -$ -$ 677$ 0.64$ -$ -$ 8,124$ -$ 8,124$ -$ 0.64$
11 -$ -$ -$ -$ -$ -$ -$ -$ -$ -$ -$ 690$ 0.64$ -$ -$ 8,274$ -$ 8,274$ -$ 0.64$
12 0.18$ 10,989$ 3.61$ (2,948)$ (0.97)$ 2,078$ 0.68$ -$ -$ -$ -$ -$ -$ -$ -$ 156,803$ (28,924)$ 156,803$ (28,924)$ 3.50$
13 -$ -$ -$ -$ -$ -$ -$ -$ -$ -$ -$ 677$ 0.64$ -$ -$ 8,124$ -$ 8,124$ -$ 0.64$
14 -$ -$ -$ -$ -$ -$ -$ -$ -$ -$ -$ 690$ 0.64$ -$ -$ 8,274$ -$ 8,274$ -$ 0.64$
15 -$ -$ -$ -$ -$ -$ -$ 221$ 0.15$ -$ -$ -$ -$ -$ -$ -$ -$ 2,653$ -$ 0.15$
16 0.93$ 8,707$ 8.54$ (14,475)$ (14.19)$ 246$ 0.24$ 86$ 0.08$ -$ -$ -$ -$ -$ -$ 108,465$ (162,377)$ 108,465$ (162,377)$ (4.40)$
17 0.37$ 4,549$ 4.22$ (4,442)$ (4.12)$ 501$ 0.46$ -$ -$ -$ -$ -$ -$ -$ -$ 60,600$ (48,505)$ 60,600$ (48,505)$ 0.93$
18 0.11$ 2,123$ 2.59$ (1,538)$ (1.88)$ 620$ 0.76$ -$ -$ -$ -$ -$ -$ -$ -$ 32,913$ (17,350)$ 32,913$ (17,350)$ 1.58$
19 0.24$ 12,648$ 9.04$ (1,052)$ (0.75)$ 431$ 0.31$ -$ -$ -$ -$ -$ -$ -$ -$ 156,944$ (8,573)$ 156,944$ (8,573)$ 8.84$
20 -$ -$ -$ -$ -$ -$ -$ -$ -$ -$ -$ 225$ 0.64$ -$ -$ 2,705$ -$ 2,705$ -$ 0.64$
21 -$ -$ -$ -$ -$ -$ -$ -$ -$ -$ -$ 230$ 0.64$ -$ -$ 2,756$ -$ 2,756$ -$ 0.64$
22 2.31$ 24,055$ 13.16$ 1,399$ 0.77$ -$ -$ 280$ 0.15$ -$ -$ -$ -$ -$ -$ -$ -$ 292,015$ 67,381$ 16.39$
23 -$ -$ -$ -$ -$ -$ -$ 73$ 0.15$ -$ -$ 315$ 0.66$ -$ -$ 4,649$ -$ 4,649$ -$ 0.81$
24 3.09$ 7,887$ 12.68$ (529)$ (0.85)$ -$ -$ 88$ 0.14$ -$ -$ -$ -$ -$ -$ 95,704$ 16,712$ 95,704$ 16,712$ 15.06$
25 2.82$ 9,400$ 12.95$ (1,025)$ (1.41)$ -$ -$ 100$ 0.14$ -$ -$ -$ -$ -$ -$ 113,996$ 12,247$ 113,996$ 12,247$ 14.50$
26 -$ -$ -$ -$ -$ -$ -$ 995$ 0.14$ -$ -$ -$ -$ -$ -$ 11,935$ -$ 11,935$ -$ 0.14$
27 -$ -$ -$ -$ -$ -$ -$ -$ -$ -$ -$ 697$ 0.62$ -$ -$ 8,364$ -$ 8,364$ -$ 0.62$
28 0.37$ 1,922$ 5.38$ 8,886$ 24.88$ 119$ 0.33$ -$ -$ -$ -$ -$ -$ -$ -$ 24,494$ 108,214$ 24,494$ 108,214$ 30.96$
29 -$ -$ -$ -$ -$ -$ -$ -$ -$ -$ -$ 458$ 0.63$ -$ -$ 5,501$ -$ 5,501$ -$ 0.63$
30 -$ -$ -$ -$ -$ -$ -$ 2,260$ 0.14$ -$ -$ -$ -$ -$ -$ 27,116$ -$ 27,116$ -$ 0.14$
31 -$ -$ -$ -$ -$ -$ -$ 2,942$ 0.08$ -$ -$ -$ -$ -$ -$ 35,304$ -$ 35,304$ -$ 0.08$
32 -$ -$ -$ -$ -$ -$ -$ 459$ 0.14$ -$ -$ -$ -$ 2,170$ 0.67$ 31,549$ -$ 31,549$ -$ 0.81$
33 -$ -$ -$ -$ -$ -$ -$ 1,901$ 0.14$ -$ -$ -$ -$ -$ -$ 22,814$ -$ 22,814$ -$ 0.14$
34 2.82$ 18,974$ 12.97$ 850$ 0.58$ -$ -$ 222$ 0.15$ -$ -$ -$ -$ -$ -$ 230,348$ 59,665$ -$ -$ 16.52$
35 2.82$ 28,459$ 12.97$ 1,112$ 0.51$ -$ -$ 323$ 0.15$ -$ -$ -$ -$ -$ -$ -$ -$ 345,387$ 87,527$ 16.45$
BP-16-FS-BPA-01A Page 127
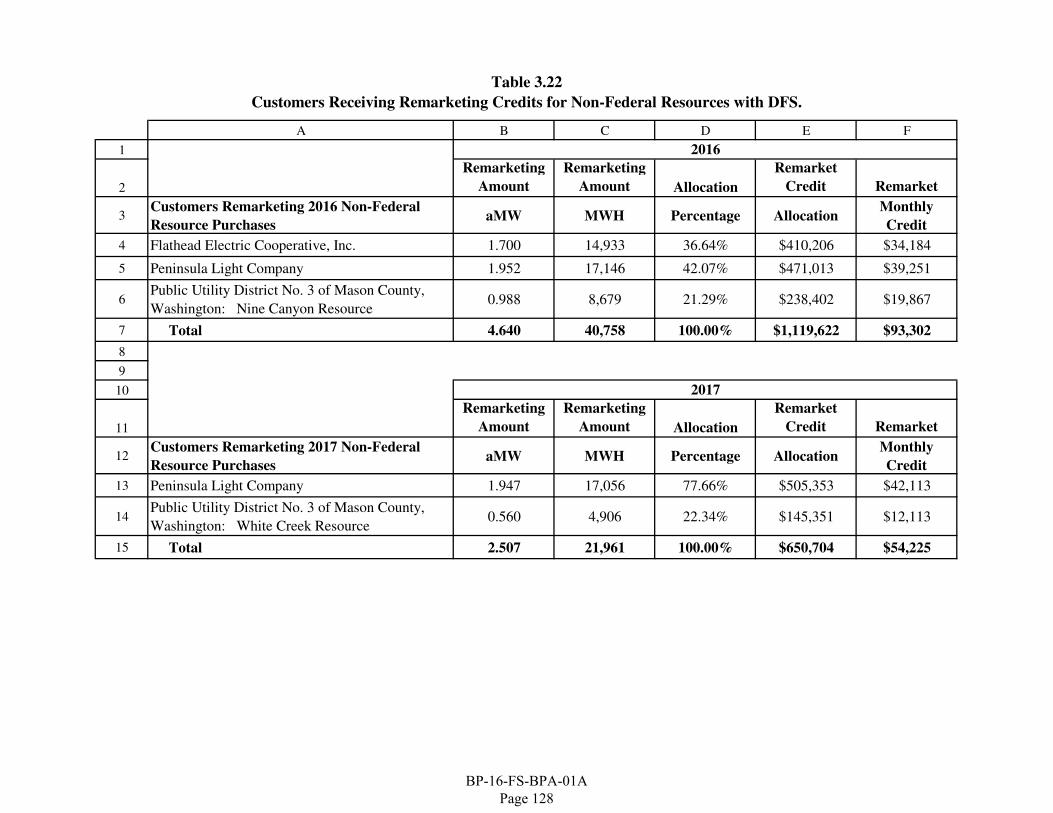
Table 3.22
Customers Receiving Remarketing Credits for Non-Federal Resources with DFS.
A B C D E F
1
2
Remarketing
Amount
Remarketing
Amount Allocation
Remarket
Credit Remarket
3Customers Remarketing 2016 Non-Federal
Resource PurchasesaMW MWH Percentage Allocation
Monthly
Credit
4 Flathead Electric Cooperative, Inc. 1.700 14,933 36.64% $410,206 $34,184
5 Peninsula Light Company 1.952 17,146 42.07% $471,013 $39,251
6Public Utility District No. 3 of Mason County,
Washington: Nine Canyon Resource0.988 8,679 21.29% $238,402 $19,867
7 Total 4.640 40,758 100.00% $1,119,622 $93,302
8
9
10
11
Remarketing
Amount
Remarketing
Amount Allocation
Remarket
Credit Remarket
12Customers Remarketing 2017 Non-Federal
Resource PurchasesaMW MWH Percentage Allocation
Monthly
Credit
13 Peninsula Light Company 1.947 17,056 77.66% $505,353 $42,113
14Public Utility District No. 3 of Mason County,
Washington: White Creek Resource0.560 4,906 22.34% $145,351 $12,113
15 Total 2.507 21,961 100.00% $650,704 $54,225
2016
2017
BP-16-FS-BPA-01A Page 128
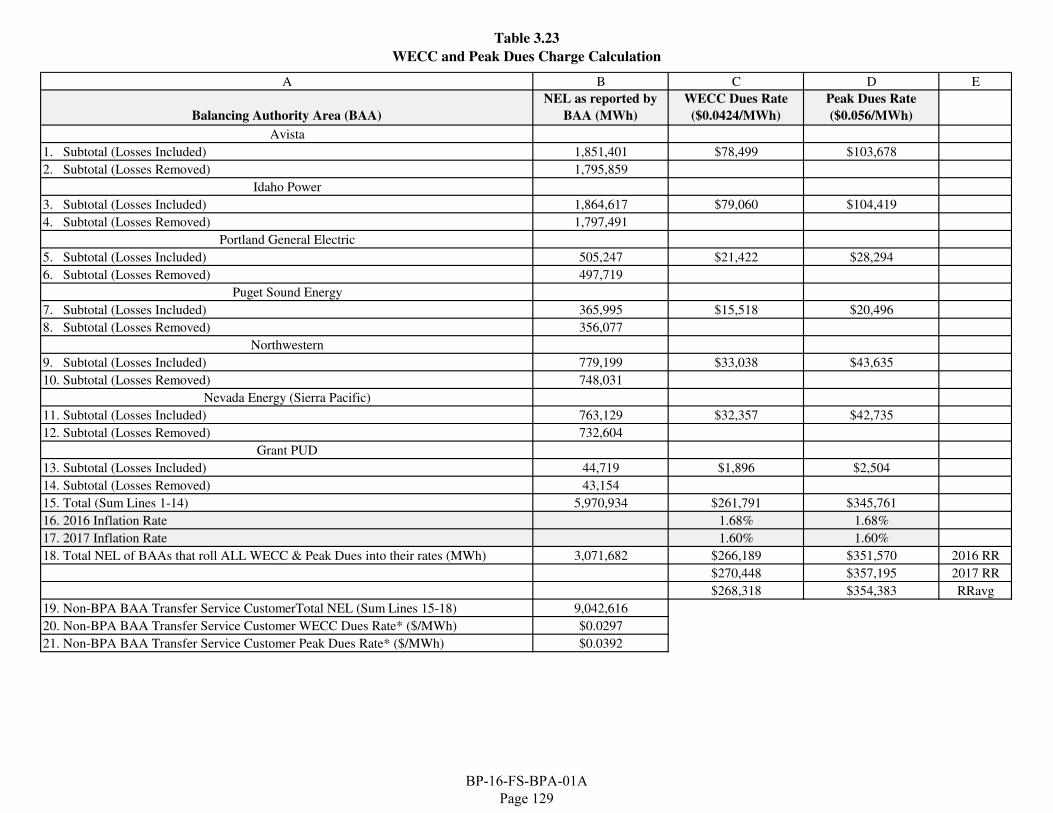
Table 3.23
WECC and Peak Dues Charge Calculation
A B C D E
Balancing Authority Area (BAA)
NEL as reported by
BAA (MWh)
WECC Dues Rate
($0.0424/MWh)
Peak Dues Rate
($0.056/MWh)
Avista
1. Subtotal (Losses Included) 1,851,401 $78,499 $103,678
2. Subtotal (Losses Removed) 1,795,859
Idaho Power
3. Subtotal (Losses Included) 1,864,617 $79,060 $104,419
4. Subtotal (Losses Removed) 1,797,491
Portland General Electric
5. Subtotal (Losses Included) 505,247 $21,422 $28,294
6. Subtotal (Losses Removed) 497,719
Puget Sound Energy
7. Subtotal (Losses Included) 365,995 $15,518 $20,496
8. Subtotal (Losses Removed) 356,077
Northwestern
9. Subtotal (Losses Included) 779,199 $33,038 $43,635
10. Subtotal (Losses Removed) 748,031
Nevada Energy (Sierra Pacific)
11. Subtotal (Losses Included) 763,129 $32,357 $42,735
12. Subtotal (Losses Removed) 732,604
Grant PUD
13. Subtotal (Losses Included) 44,719 $1,896 $2,504
14. Subtotal (Losses Removed) 43,154
15. Total (Sum Lines 1-14) 5,970,934 $261,791 $345,761
16. 2016 Inflation Rate 1.68% 1.68%
17. 2017 Inflation Rate 1.60% 1.60%
18. Total NEL of BAAs that roll ALL WECC & Peak Dues into their rates (MWh) 3,071,682 $266,189 $351,570 2016 RR
$270,448 $357,195 2017 RR
$268,318 $354,383 RRavg
19. Non-BPA BAA Transfer Service CustomerTotal NEL (Sum Lines 15-18) 9,042,616
20. Non-BPA BAA Transfer Service Customer WECC Dues Rate* ($/MWh) $0.0297
21. Non-BPA BAA Transfer Service Customer Peak Dues Rate* ($/MWh) $0.0392
BP-16-FS-BPA-01A Page 129
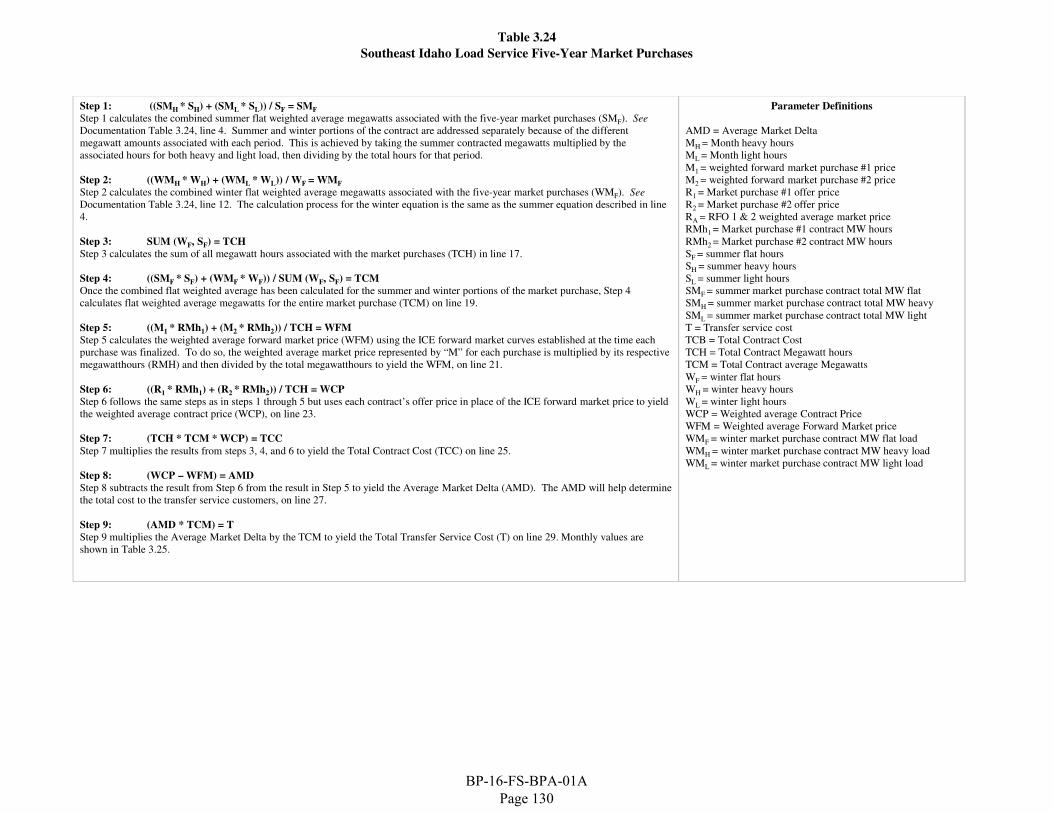
Table 3.24
Southeast Idaho Load Service Five-Year Market Purchases
Step 1: ((SMH * SH) + (SML * SL)) / SF = SMF
Step 1 calculates the combined summer flat weighted average megawatts associated with the five-year market purchases (SMF). See
Documentation Table 3.24, line 4. Summer and winter portions of the contract are addressed separately because of the different
megawatt amounts associated with each period. This is achieved by taking the summer contracted megawatts multiplied by the
associated hours for both heavy and light load, then dividing by the total hours for that period.
Step 2: ((WMH * WH) + (WML * WL)) / WF = WMF
Step 2 calculates the combined winter flat weighted average megawatts associated with the five-year market purchases (WMF). See
Documentation Table 3.24, line 12. The calculation process for the winter equation is the same as the summer equation described in line
4.
Step 3: SUM (WF, SF) = TCH
Step 3 calculates the sum of all megawatt hours associated with the market purchases (TCH) in line 17.
Step 4: ((SMF * SF) + (WMF * WF)) / SUM (WF, SF) = TCM
Once the combined flat weighted average has been calculated for the summer and winter portions of the market purchase, Step 4
calculates flat weighted average megawatts for the entire market purchase (TCM) on line 19.
Step 5: ((M1 * RMh1) + (M2 * RMh2)) / TCH = WFM
Step 5 calculates the weighted average forward market price (WFM) using the ICE forward market curves established at the time each
purchase was finalized. To do so, the weighted average market price represented by “M” for each purchase is multiplied by its respective
megawatthours (RMH) and then divided by the total megawatthours to yield the WFM, on line 21.
Step 6: ((R1 * RMh1) + (R2 * RMh2)) / TCH = WCP
Step 6 follows the same steps as in steps 1 through 5 but uses each contract’s offer price in place of the ICE forward market price to yield
the weighted average contract price (WCP), on line 23.
Step 7: (TCH * TCM * WCP) = TCC
Step 7 multiplies the results from steps 3, 4, and 6 to yield the Total Contract Cost (TCC) on line 25.
Step 8: (WCP – WFM) = AMD
Step 8 subtracts the result from Step 6 from the result in Step 5 to yield the Average Market Delta (AMD). The AMD will help determine
the total cost to the transfer service customers, on line 27.
Step 9: (AMD * TCM) = T
Step 9 multiplies the Average Market Delta by the TCM to yield the Total Transfer Service Cost (T) on line 29. Monthly values are
shown in Table 3.25.
Parameter Definitions
AMD = Average Market Delta
MH = Month heavy hours
ML = Month light hours
M1 = weighted forward market purchase #1 price
M2 = weighted forward market purchase #2 price
R1 = Market purchase #1 offer price
R2 = Market purchase #2 offer price
RA = RFO 1 & 2 weighted average market price
RMh1 = Market purchase #1 contract MW hours
RMh2 = Market purchase #2 contract MW hours
SF = summer flat hours
SH = summer heavy hours
SL = summer light hours
SMF = summer market purchase contract total MW flat
SMH = summer market purchase contract total MW heavy
SML = summer market purchase contract total MW light
T = Transfer service cost
TCB = Total Contract Cost
TCH = Total Contract Megawatt hours
TCM = Total Contract average Megawatts
WF = winter flat hours
WH = winter heavy hours
WL = winter light hours
WCP = Weighted average Contract Price
WFM = Weighted average Forward Market price
WMF = winter market purchase contract MW flat load
WMH = winter market purchase contract MW heavy load
WML = winter market purchase contract MW light load
BP-16-FS-BPA-01A Page 130
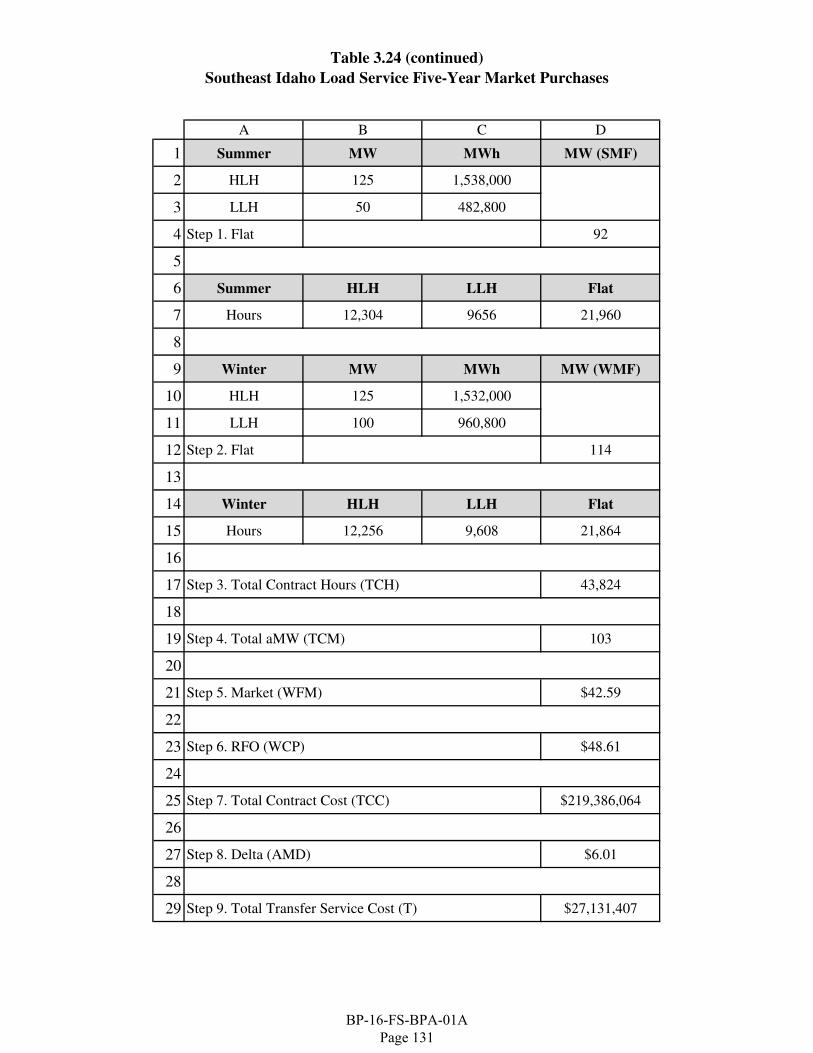
Table 3.24 (continued)
Southeast Idaho Load Service Five-Year Market Purchases
A B C D
1 Summer MW MWh MW (SMF)
2 HLH 125 1,538,000
3 LLH 50 482,800
4 Step 1. Flat 92
5
6 Summer HLH LLH Flat
7 Hours 12,304 9656 21,960
8
9 Winter MW MWh MW (WMF)
10 HLH 125 1,532,000
11 LLH 100 960,800
12 Step 2. Flat 114
13
14 Winter HLH LLH Flat
15 Hours 12,256 9,608 21,864
16
17 Step 3. Total Contract Hours (TCH) 43,824
18
19 Step 4. Total aMW (TCM) 103
20
21 Step 5. Market (WFM) $42.59
22
23 Step 6. RFO (WCP) $48.61
24
25 Step 7. Total Contract Cost (TCC) $219,386,064
26
27 Step 8. Delta (AMD) $6.01
28
29 Step 9. Total Transfer Service Cost (T) $27,131,407
BP-16-FS-BPA-01A Page 131
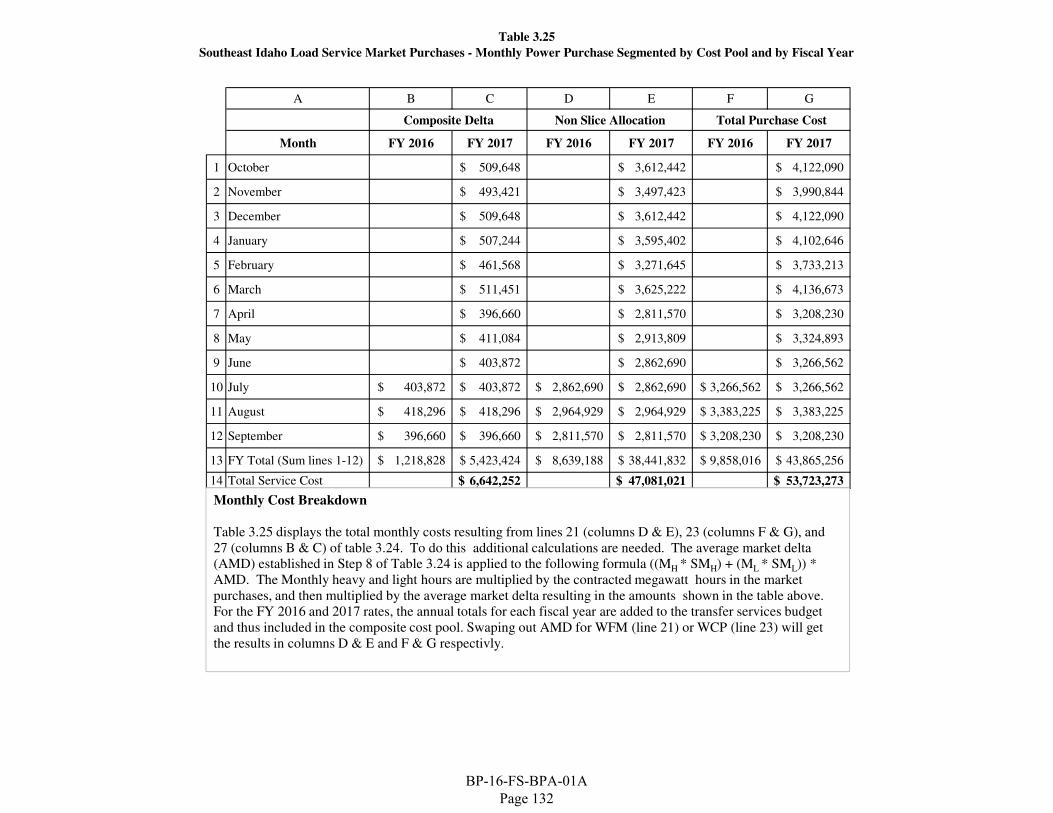
Table 3.25
Southeast Idaho Load Service Market Purchases - Monthly Power Purchase Segmented by Cost Pool and by Fiscal Year
A B C D E F G
Composite Delta Non Slice Allocation Total Purchase Cost
Month FY 2016 FY 2017 FY 2016 FY 2017 FY 2016 FY 2017
1 October 509,648$ 3,612,442$ 4,122,090$
2 November 493,421$ 3,497,423$ 3,990,844$
3 December 509,648$ 3,612,442$ 4,122,090$
4 January 507,244$ 3,595,402$ 4,102,646$
5 February 461,568$ 3,271,645$ 3,733,213$
6 March 511,451$ 3,625,222$ 4,136,673$
7 April 396,660$ 2,811,570$ 3,208,230$
8 May 411,084$ 2,913,809$ 3,324,893$
9 June 403,872$ 2,862,690$ 3,266,562$
10 July 403,872$ 403,872$ 2,862,690$ 2,862,690$ 3,266,562$ 3,266,562$
11 August 418,296$ 418,296$ 2,964,929$ 2,964,929$ 3,383,225$ 3,383,225$
12 September 396,660$ 396,660$ 2,811,570$ 2,811,570$ 3,208,230$ 3,208,230$
13 FY Total (Sum lines 1-12) 1,218,828$ 5,423,424$ 8,639,188$ 38,441,832$ 9,858,016$ 43,865,256$
14 Total Service Cost 6,642,252$ 47,081,021$ 53,723,273$
Monthly Cost Breakdown
Table 3.25 displays the total monthly costs resulting from lines 21 (columns D & E), 23 (columns F & G), and
27 (columns B & C) of table 3.24. To do this additional calculations are needed. The average market delta
(AMD) established in Step 8 of Table 3.24 is applied to the following formula ((MH * SMH) + (ML * SML)) *
AMD. The Monthly heavy and light hours are multiplied by the contracted megawatt hours in the market
purchases, and then multiplied by the average market delta resulting in the amounts shown in the table above.
For the FY 2016 and 2017 rates, the annual totals for each fiscal year are added to the transfer services budget
and thus included in the composite cost pool. Swaping out AMD for WFM (line 21) or WCP (line 23) will get
the results in columns D & E and F & G respectivly.
BP-16-FS-BPA-01A Page 132

SECTION 4: REVENUE FORECAST
BP-16-FS-BPA-01A Page 133
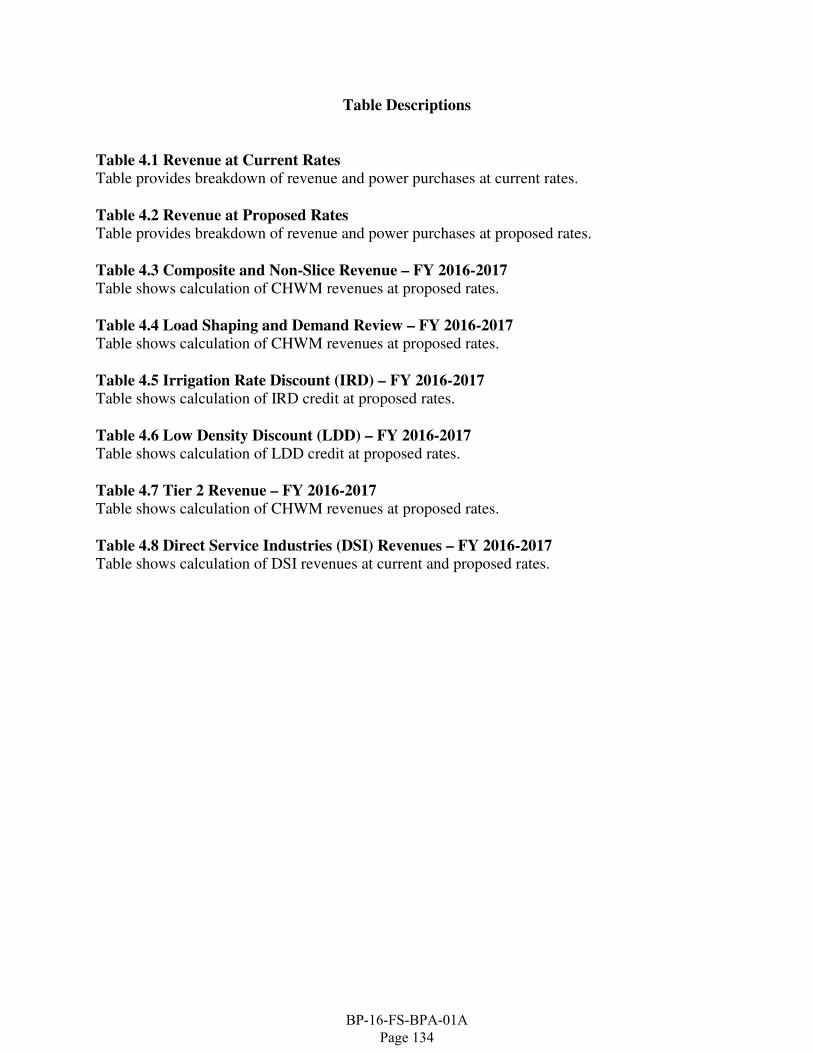
Table Descriptions
Table 4.1 Revenue at Current Rates
Table provides breakdown of revenue and power purchases at current rates.
Table 4.2 Revenue at Proposed Rates
Table provides breakdown of revenue and power purchases at proposed rates.
Table 4.3 Composite and Non-Slice Revenue – FY 2016-2017
Table shows calculation of CHWM revenues at proposed rates.
Table 4.4 Load Shaping and Demand Review – FY 2016-2017
Table shows calculation of CHWM revenues at proposed rates.
Table 4.5 Irrigation Rate Discount (IRD) – FY 2016-2017
Table shows calculation of IRD credit at proposed rates.
Table 4.6 Low Density Discount (LDD) – FY 2016-2017
Table shows calculation of LDD credit at proposed rates.
Table 4.7 Tier 2 Revenue – FY 2016-2017
Table shows calculation of CHWM revenues at proposed rates.
Table 4.8 Direct Service Industries (DSI) Revenues – FY 2016-2017
Table shows calculation of DSI revenues at current and proposed rates.
BP-16-FS-BPA-01A Page 134
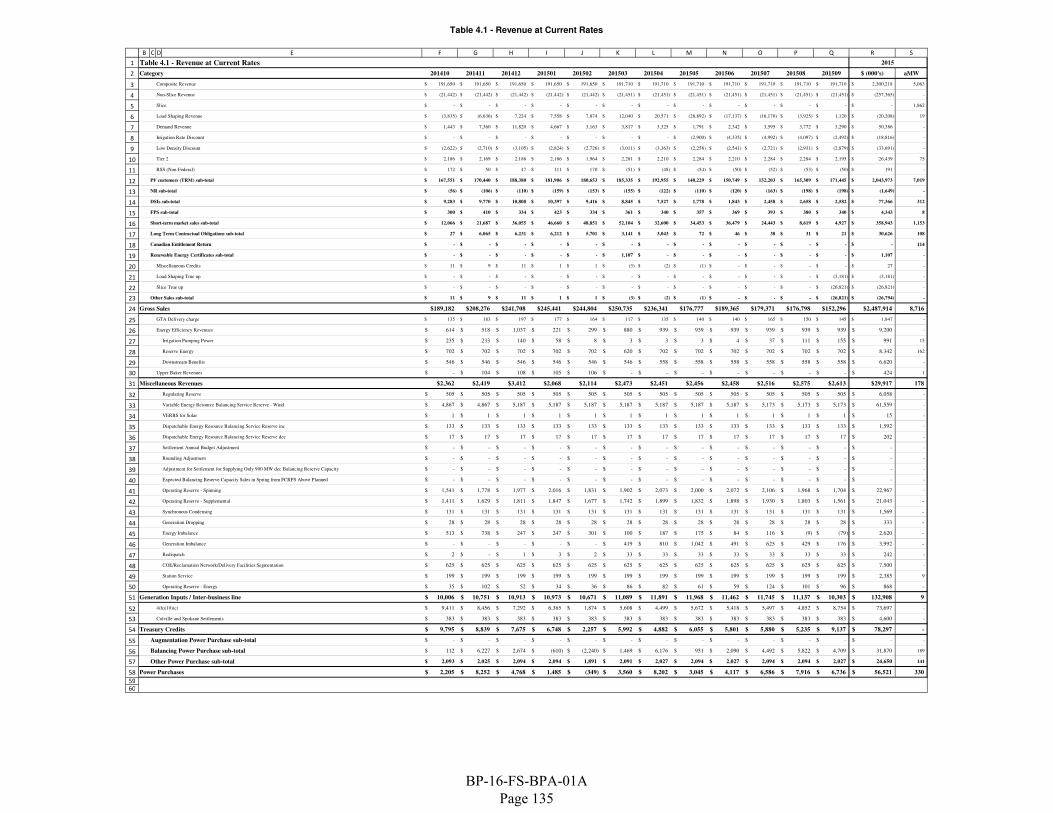
Table 4.1 - Revenue at Current Rates
1
2
3
4
5
6
7
8
9
10
11
12
13
14
15
16
17
18
19
20
21
22
23
24
25
26
27
28
29
30
31
32
33
34
35
36
37
38
39
40
41
42
43
44
45
46
47
48
49
50
51
52
53
54
55
56
57
58
59
60
B C D E F G H I J K L M N O P Q R S
Table 4.1 - Revenue at Current Rates 2015 2015
Category 201410 201411 201412 201501 201502 201503 201504 201505 201506 201507 201508 201509 $ (000's) aMW
Composite Revenue 191,650$ 191,650$ 191,650$ 191,650$ 191,650$ 191,710$ 191,710$ 191,710$ 191,710$ 191,710$ 191,710$ 191,710$ 2,300,218$ 5,063
Non-Slice Revenue (21,442)$ (21,442)$ (21,442)$ (21,442)$ (21,442)$ (21,451)$ (21,451)$ (21,451)$ (21,451)$ (21,451)$ (21,451)$ (21,451)$ (257,365)$ -
Slice -$ -$ -$ -$ -$ -$ -$ -$ -$ -$ -$ -$ -$ 1,862
Load Shaping Revenue (3,835)$ (6,636)$ 7,224$ 7,558$ 7,874$ 12,040$ 20,571$ (28,892)$ (17,137)$ (16,170)$ (3,925)$ 1,120$ (20,208)$ 19
Demand Revenue 1,443$ 7,360$ 11,820$ 4,667$ 3,163$ 3,817$ 3,325$ 1,791$ 2,342$ 3,595$ 3,772$ 3,290$ 50,386$ -
Irrigation Rate Discount -$ -$ -$ -$ -$ -$ -$ (2,900)$ (4,335)$ (4,992)$ (4,097)$ (2,492)$ (18,816)$ -
Low Density Discount (2,622)$ (2,710)$ (3,105)$ (2,824)$ (2,726)$ (3,011)$ (3,363)$ (2,258)$ (2,541)$ (2,721)$ (2,931)$ (2,879)$ (33,691)$ -
Tier 2 2,186$ 2,169$ 2,186$ 2,186$ 1,964$ 2,281$ 2,210$ 2,284$ 2,210$ 2,284$ 2,284$ 2,195$ 26,439$ 75
RSS (Non-Federal) 172$ 50$ 47$ 111$ 170$ (51)$ (48)$ (54)$ (50)$ (52)$ (53)$ (50)$ 191$ -
PF customers (TRM) sub-total 167,551$ 170,440$ 188,380$ 181,906$ 180,653$ 185,335$ 192,955$ 140,229$ 150,749$ 152,203$ 165,309$ 171,445$ 2,043,973$ 7,019
NR sub-total (56)$ (106)$ (110)$ (159)$ (153)$ (155)$ (122)$ (110)$ (120)$ (163)$ (198)$ (198)$ (1,649)$ -
DSIs sub-total 9,283$ 9,770$ 10,808$ 10,397$ 9,416$ 8,845$ 7,527$ 1,778$ 1,843$ 2,458$ 2,658$ 2,582$ 77,366$ 312
FPS sub-total 300$ 410$ 334$ 423$ 334$ 361$ 340$ 357$ 369$ 393$ 380$ 340$ 4,343$ 8
Short-term market sales sub-total 12,066$ 21,687$ 36,055$ 46,660$ 48,851$ 52,104$ 32,600$ 34,453$ 36,479$ 24,443$ 8,619$ 4,927$ 358,943$ 1,153
Long Term Contractual Obligations sub-total 27$ 6,065$ 6,231$ 6,212$ 5,701$ 3,141$ 3,043$ 72$ 46$ 38$ 31$ 21$ 30,626$ 108
Canadian Entitlement Return -$ -$ -$ -$ -$ -$ -$ -$ -$ -$ -$ -$ -$ 114
Renewable Energy Certificates sub-total -$ -$ -$ -$ -$ 1,107$ -$ -$ -$ -$ -$ -$ 1,107$ -
Miscellaneous Credits 11$ 9$ 11$ 1$ 1$ (3)$ (2)$ (1)$ -$ -$ -$ -$ 27$ -
Load Shaping True up -$ -$ -$ -$ -$ -$ -$ -$ -$ -$ -$ (3,181)$ (3,181)$ -
Slice True up -$ -$ -$ -$ -$ -$ -$ -$ -$ -$ -$ (26,821)$ (26,821)$ -
Other Sales sub-total 11$ 9$ 11$ 1$ 1$ (3)$ (2)$ (1)$ -$ -$ -$ (26,821)$ (26,794)$ -
Gross Sales $189,182 $208,276 $241,708 $245,441 $244,804 $250,735 $236,341 $176,777 $189,365 $179,371 $176,798 $152,296 $2,487,914 8,716
GTA Delivery charge 135$ 183$ 197$ 177$ 164$ 117$ 135$ 140$ 140$ 165$ 150$ 145$ 1,847$ -
Energy Efficiency Revenues 614$ 518$ 1,037$ 221$ 299$ 880$ 939$ 939$ 939$ 939$ 939$ 939$ 9,200$ -
Irrigation Pumping Power 235$ 233$ 140$ 58$ 8$ 3$ 3$ 3$ 4$ 37$ 111$ 155$ 991$ 15
Reserve Energy 702$ 702$ 702$ 702$ 702$ 620$ 702$ 702$ 702$ 702$ 702$ 702$ 8,342$ 162
Downstream Benefits 546$ 546$ 546$ 546$ 546$ 546$ 558$ 558$ 558$ 558$ 558$ 558$ 6,620$ -
Upper Baker Revenues -$ 104$ 108$ 105$ 106$ -$ -$ -$ -$ -$ -$ -$ 424$ 1
Miscellaneous Revenues $2,362 $2,419 $3,412 $2,068 $2,114 $2,473 $2,451 $2,456 $2,458 $2,516 $2,575 $2,613 $29,917 178
Regulating Reserve 505$ 505$ 505$ 505$ 505$ 505$ 505$ 505$ 505$ 505$ 505$ 505$ 6,058$ -
Variable Energy Resource Balancing Service Reserve - Wind 4,867$ 4,867$ 5,187$ 5,187$ 5,187$ 5,187$ 5,187$ 5,187$ 5,187$ 5,173$ 5,173$ 5,173$ 61,559$ -
VERBS for Solar 1$ 1$ 1$ 1$ 1$ 1$ 1$ 1$ 1$ 1$ 1$ 1$ 15$ -
Dispatchable Energy Resource Balancing Service Reserve inc 133$ 133$ 133$ 133$ 133$ 133$ 133$ 133$ 133$ 133$ 133$ 133$ 1,592$ -
Dispatchable Energy Resource Balancing Service Reserve dec 17$ 17$ 17$ 17$ 17$ 17$ 17$ 17$ 17$ 17$ 17$ 17$ 202$ -
Settlement Annual Budget Adjustment -$ -$ -$ -$ -$ -$ -$ -$ -$ -$ -$ -$ -$ -
Rounding Adjustment -$ -$ -$ -$ -$ -$ -$ -$ -$ -$ -$ -$ -$ -
Adjustment for Settlement for Supplying Only 900 MW dec Balancing Reserve Capacity -$ -$ -$ -$ -$ -$ -$ -$ -$ -$ -$ -$ -$ -
Expected Balancing Reserve Capacity Sales in Spring from FCRPS Above Planned -$ -$ -$ -$ -$ -$ -$ -$ -$ -$ -$ -$ -$ -
Operating Reserve - Spinning 1,541$ 1,778$ 1,977$ 2,016$ 1,831$ 1,902$ 2,073$ 2,000$ 2,072$ 2,106$ 1,968$ 1,704$ 22,967$ -
Operating Reserve - Supplemental 1,411$ 1,629$ 1,811$ 1,847$ 1,677$ 1,742$ 1,899$ 1,832$ 1,898$ 1,930$ 1,803$ 1,561$ 21,043$ -
Synchronous Condensing 131$ 131$ 131$ 131$ 131$ 131$ 131$ 131$ 131$ 131$ 131$ 131$ 1,569$ -
Generation Dropping 28$ 28$ 28$ 28$ 28$ 28$ 28$ 28$ 28$ 28$ 28$ 28$ 333$ -
Energy Imbalance 513$ 738$ 247$ 247$ 301$ 100$ 187$ 175$ 84$ 116$ (9)$ (79)$ 2,620$ -
Generation Imbalance -$ -$ -$ -$ -$ 419$ 810$ 1,042$ 491$ 625$ 429$ 176$ 3,992$ -
Redispatch 2$ -$ 1$ 3$ 2$ 33$ 33$ 33$ 33$ 33$ 33$ 33$ 242$ -
COE/Reclamation Network/Delivery Facilities Segmentation 625$ 625$ 625$ 625$ 625$ 625$ 625$ 625$ 625$ 625$ 625$ 625$ 7,500$ -
Station Service 199$ 199$ 199$ 199$ 199$ 199$ 199$ 199$ 199$ 199$ 199$ 199$ 2,385$ 9
Operating Reserve - Energy 35$ 102$ 52$ 34$ 36$ 86$ 82$ 61$ 59$ 124$ 101$ 96$ 868$ -
Generation Inputs / Inter-business line 10,006$ 10,751$ 10,913$ 10,973$ 10,671$ 11,089$ 11,891$ 11,968$ 11,462$ 11,745$ 11,137$ 10,303$ 132,908$ 9
4(h)(10)(c) 9,411$ 8,456$ 7,292$ 6,365$ 1,874$ 5,608$ 4,499$ 5,672$ 5,418$ 5,497$ 4,852$ 8,754$ 73,697$ -
Colville and Spokane Settlements 383$ 383$ 383$ 383$ 383$ 383$ 383$ 383$ 383$ 383$ 383$ 383$ 4,600$ -
Treasury Credits 9,795$ 8,839$ 7,675$ 6,748$ 2,257$ 5,992$ 4,882$ 6,055$ 5,801$ 5,880$ 5,235$ 9,137$ 78,297$ -
Augmentation Power Purchase sub-total -$ -$ -$ -$ -$ -$ -$ -$ -$ -$ -$ -$ -$ -
Balancing Power Purchase sub-total 112$ 6,227$ 2,674$ (610)$ (2,240)$ 1,469$ 6,176$ 951$ 2,090$ 4,492$ 5,822$ 4,709$ 31,870$ 189
Other Power Purchase sub-total 2,093$ 2,025$ 2,094$ 2,094$ 1,891$ 2,091$ 2,027$ 2,094$ 2,027$ 2,094$ 2,094$ 2,027$ 24,650$ 141
Power Purchases 2,205$ 8,252$ 4,768$ 1,485$ (349)$ 3,560$ 8,202$ 3,045$ 4,117$ 6,586$ 7,916$ 6,736$ 56,521$ 330
BP-16-FS-BPA-01A Page 135

Table 4.1 - Revenue at Current Rates
1
2
3
4
5
6
7
8
9
10
11
12
13
14
15
16
17
18
19
20
21
22
23
24
25
26
27
28
29
30
31
32
33
34
35
36
37
38
39
40
41
42
43
44
45
46
47
48
49
50
51
52
53
54
55
56
57
58
59
60
B C D E
Table 4.1 - Revenue at Current Rates
Category
Composite Revenue
Non-Slice Revenue
Slice
Load Shaping Revenue
Demand Revenue
Irrigation Rate Discount
Low Density Discount
Tier 2
RSS (Non-Federal)
PF customers (TRM) sub-total
NR sub-total
DSIs sub-total
FPS sub-total
Short-term market sales sub-total
Long Term Contractual Obligations sub-total
Canadian Entitlement Return
Renewable Energy Certificates sub-total
Miscellaneous Credits
Load Shaping True up
Slice True up
Other Sales sub-total
Gross Sales
GTA Delivery charge
Energy Efficiency Revenues
Irrigation Pumping Power
Reserve Energy
Downstream Benefits
Upper Baker Revenues
Miscellaneous Revenues
Regulating Reserve
Variable Energy Resource Balancing Service Reserve - Wind
VERBS for Solar
Dispatchable Energy Resource Balancing Service Reserve inc
Dispatchable Energy Resource Balancing Service Reserve dec
Settlement Annual Budget Adjustment
Rounding Adjustment
Adjustment for Settlement for Supplying Only 900 MW dec Balancing Reserve Capacity
Expected Balancing Reserve Capacity Sales in Spring from FCRPS Above Planned
Operating Reserve - Spinning
Operating Reserve - Supplemental
Synchronous Condensing
Generation Dropping
Energy Imbalance
Generation Imbalance
Redispatch
COE/Reclamation Network/Delivery Facilities Segmentation
Station Service
Operating Reserve - Energy
Generation Inputs / Inter-business line
4(h)(10)(c)
Colville and Spokane Settlements
Treasury Credits
Augmentation Power Purchase sub-total
Balancing Power Purchase sub-total
Other Power Purchase sub-total
Power Purchases
T U V W X Y Z AA AB AC AD AE AF AG
2016 2016
201510 201511 201512 201601 201602 201603 201604 201605 201606 201607 201608 201609 $ (000's) aMW
192,324$ 192,324$ 192,324$ 192,324$ 192,324$ 192,324$ 192,324$ 192,324$ 192,324$ 192,324$ 192,324$ 192,324$ 2,307,887$ 6,848
(21,548)$ (21,548)$ (21,548)$ (21,548)$ (21,548)$ (21,548)$ (21,548)$ (21,548)$ (21,548)$ (21,548)$ (21,548)$ (21,548)$ (258,576)$ -
-$ -$ -$ -$ -$ -$ -$ -$ -$ -$ -$ -$ -$ -
(3,907)$ (9,027)$ 16,892$ 33,851$ 23,831$ 3,559$ 6,415$ (30,276)$ (16,147)$ (430)$ (7,445)$ 3,570$ 20,886$ (9)
3,127$ 2,052$ 7,108$ 5,633$ 3,815$ 4,741$ 3,234$ 1,622$ 2,539$ 3,083$ 4,916$ 3,811$ 45,681$ -
(1,717)$ (1,717)$ (1,717)$ (1,717)$ (1,717)$ (1,717)$ (1,717)$ (1,717)$ (1,717)$ (1,717)$ (1,717)$ (1,717)$ (20,604)$ -
(3,192)$ (3,192)$ (3,192)$ (3,192)$ (3,192)$ (3,192)$ (3,192)$ (3,192)$ (3,192)$ (3,192)$ (3,192)$ (3,192)$ (38,300)$ -
1,986$ 1,986$ 1,986$ 1,986$ 1,986$ 1,986$ 1,986$ 1,986$ 1,986$ 1,986$ 1,986$ 1,986$ 23,833$ 68
111$ 111$ 111$ 111$ 111$ 111$ 111$ 111$ 111$ 111$ 111$ 111$ 1,329$ -
167,185$ 160,989$ 191,964$ 207,448$ 195,610$ 176,264$ 177,613$ 139,310$ 154,356$ 170,617$ 165,436$ 175,345$ 2,082,137$ 6,908
30$ 30$ 30$ 30$ 30$ 30$ 30$ 30$ 30$ 30$ 30$ 30$ 356$ 0
2,720$ 2,881$ 3,148$ 3,044$ 2,808$ 2,579$ 2,205$ 1,868$ 1,912$ 2,560$ 2,791$ 2,690$ 31,206$ 91
235$ 240$ 260$ 255$ 245$ 240$ 235$ 240$ 245$ 255$ 240$ 235$ 2,920$ 8
9,325$ 14,938$ 10,207$ 30,109$ 26,261$ 28,947$ 36,371$ 58,017$ 56,116$ 44,339$ 21,681$ 6,782$ 343,094$ 1,759
38$ 6,933$ 7,129$ 7,138$ 6,506$ 3,563$ 3,476$ 61$ 77$ 64$ 72$ 46$ 35,102$ 90
-$ -$ -$ -$ -$ -$ -$ -$ -$ -$ -$ -$ -$ 119
-$ -$ -$ -$ -$ 1,151$ -$ -$ -$ -$ -$ -$ 1,151$ -
-$ -$ -$ -$ -$ -$ -$ -$ -$ -$ -$ -$ -$ -
-$ -$ -$ -$ -$ -$ -$ -$ -$ -$ -$ -$ -$ -
-$ -$ -$ -$ -$ -$ -$ -$ -$ -$ -$ -$ -$ -
323$ 323$ 323$ 323$ 323$ 323$ 323$ 323$ 323$ 323$ 323$ 323$ 3,877$ -
$179,825 $186,304 $213,030 $248,316 $231,754 $213,066 $220,223 $199,819 $213,029 $218,158 $190,542 $185,420 $2,499,487 8,975
360$ 405$ 510$ 450$ 455$ 410$ 345$ 370$ 390$ 435$ 400$ 335$ 4,865$ -
1,250$ 1,250$ 1,250$ 1,250$ 1,250$ 1,250$ 1,250$ 1,250$ 1,250$ 1,250$ 1,250$ 1,250$ 15,000$ -
134$ 208$ 252$ 374$ 330$ 237$ 155$ 105$ 99$ 100$ 99$ 101$ 2,192$ 18
694$ 694$ 694$ 694$ 694$ 694$ 694$ 694$ 694$ 694$ 694$ 694$ 8,327$ 162
558$ 558$ 558$ 558$ 558$ 558$ 558$ 558$ 558$ 558$ 558$ 558$ 6,700$ -
-$ 103$ 117$ 114$ 117$ -$ -$ -$ -$ -$ -$ -$ 457$ 1
$2,996 $3,218 $3,381 $3,441 $3,404 $3,149 $3,002 $2,977 $2,992 $3,037 $3,001 $2,938 $37,541 180
519$ 519$ 519$ 519$ 519$ 519$ 519$ 519$ 519$ 519$ 519$ 519$ 6,224$ -
4,771$ 4,771$ 4,771$ 4,771$ 4,771$ 4,771$ 4,771$ 4,771$ 4,771$ 4,771$ 4,771$ 4,771$ 57,250$ -
7$ 7$ 7$ 7$ 7$ 7$ 7$ 7$ 7$ 7$ 7$ 7$ 86$ -
172$ 172$ 172$ 172$ 172$ 172$ 172$ 172$ 172$ 172$ 172$ 172$ 2,059$ -
33$ 33$ 33$ 33$ 33$ 33$ 33$ 33$ 33$ 33$ 33$ 33$ 391$ -
(1,267)$ (1,267)$ (1,267)$ (1,267)$ (1,267)$ (1,267)$ (1,267)$ (1,267)$ (1,267)$ (1,267)$ (1,267)$ (1,267)$ (15,200)$ -
2$ 2$ 2$ 2$ 2$ 2$ 2$ 2$ 2$ 2$ 2$ 2$ 26$ -
-$ -$ -$ -$ -$ -$ -$ -$ -$ -$ -$ -$ -$ -
333$ 333$ 333$ 333$ 333$ 333$ 333$ 333$ 333$ 333$ 333$ 333$ 4,000$ -
2,123$ 2,123$ 2,123$ 2,123$ 2,123$ 2,123$ 2,123$ 2,123$ 2,123$ 2,123$ 2,123$ 2,123$ 25,470$ -
1,946$ 1,946$ 1,946$ 1,946$ 1,946$ 1,946$ 1,946$ 1,946$ 1,946$ 1,946$ 1,946$ 1,946$ 23,348$ -
134$ 134$ 134$ 134$ 134$ 134$ 134$ 134$ 134$ 134$ 134$ 134$ 1,610$ -
35$ 35$ 35$ 35$ 35$ 35$ 35$ 35$ 35$ 35$ 35$ 35$ 415$ -
-$ -$ -$ -$ -$ -$ -$ -$ -$ -$ -$ -$ -$ -
-$ -$ -$ -$ -$ -$ -$ -$ -$ -$ -$ -$ -$ -
19$ 19$ 19$ 19$ 19$ 19$ 19$ 19$ 19$ 19$ 19$ 19$ 225$ -
614$ 614$ 614$ 614$ 614$ 614$ 614$ 614$ 614$ 614$ 614$ 614$ 7,367$ -
207$ 207$ 207$ 207$ 207$ 207$ 207$ 207$ 207$ 207$ 207$ 207$ 2,479$ 9
-$ -$ -$ -$ -$ -$ -$ -$ -$ -$ -$ -$ -$ -
9,646$ 9,646$ 9,646$ 9,646$ 9,646$ 9,646$ 9,646$ 9,646$ 9,646$ 9,646$ 9,646$ 9,646$ 115,750$ 9
8,246$ 6,644$ 9,118$ 10,257$ 8,370$ 7,632$ 6,894$ 6,364$ 7,074$ 6,183$ 5,868$ 8,458$ 91,107$ -
383$ 383$ 383$ 383$ 383$ 383$ 383$ 383$ 383$ 383$ 383$ 383$ 4,600$ -
8,629$ 7,027$ 9,502$ 10,641$ 8,753$ 8,015$ 7,277$ 6,747$ 7,457$ 6,566$ 6,252$ 8,841$ 95,707$ -
-$ -$ -$ -$ -$ -$ -$ -$ -$ -$ -$ -$ -$ -
1,223$ 1,654$ 3,089$ 2,609$ 930$ 161$ 36$ 19$ 19$ 246$ 892$ 3,753$ 14,631$ 121
1,868$ 1,811$ 1,868$ 1,868$ 1,748$ 1,866$ 1,808$ 1,868$ 1,808$ 4,754$ 4,859$ 4,643$ 30,769$ 60
3,091$ 3,465$ 4,957$ 4,477$ 2,678$ 2,027$ 1,844$ 1,887$ 1,827$ 5,000$ 5,751$ 8,396$ 45,400$ 181
BP-16-FS-BPA-01A Page 136
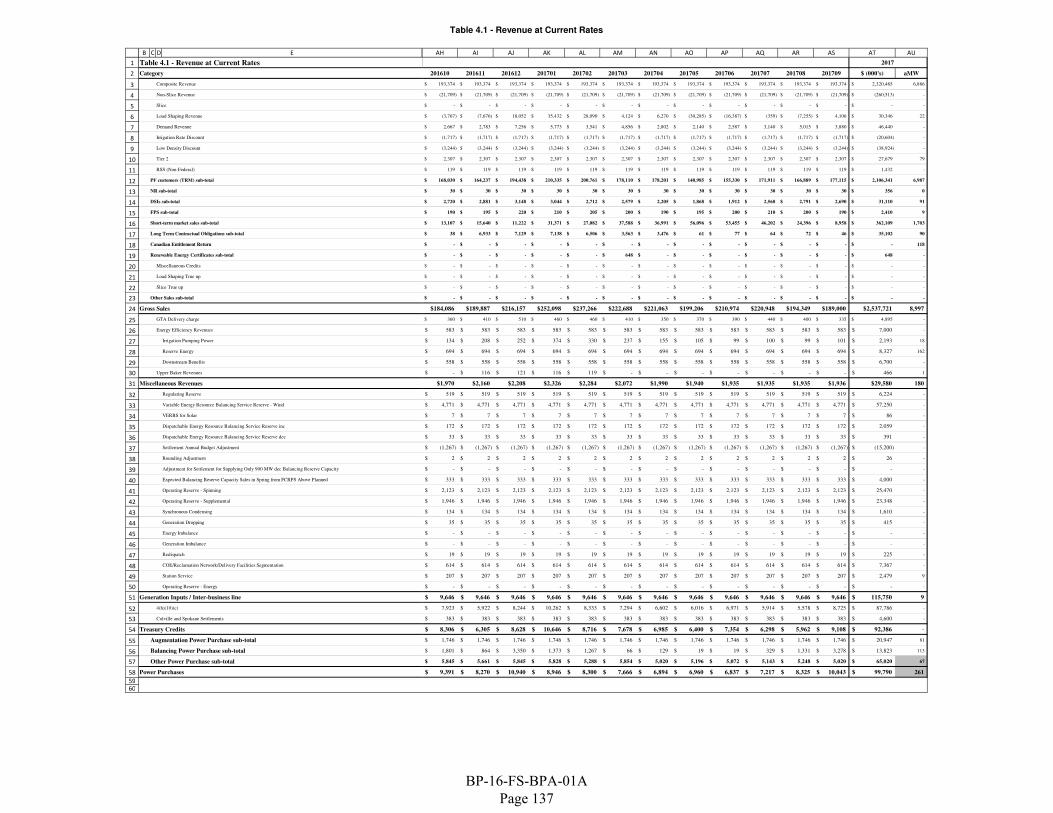
Table 4.1 - Revenue at Current Rates
1
2
3
4
5
6
7
8
9
10
11
12
13
14
15
16
17
18
19
20
21
22
23
24
25
26
27
28
29
30
31
32
33
34
35
36
37
38
39
40
41
42
43
44
45
46
47
48
49
50
51
52
53
54
55
56
57
58
59
60
B C D E
Table 4.1 - Revenue at Current Rates
Category
Composite Revenue
Non-Slice Revenue
Slice
Load Shaping Revenue
Demand Revenue
Irrigation Rate Discount
Low Density Discount
Tier 2
RSS (Non-Federal)
PF customers (TRM) sub-total
NR sub-total
DSIs sub-total
FPS sub-total
Short-term market sales sub-total
Long Term Contractual Obligations sub-total
Canadian Entitlement Return
Renewable Energy Certificates sub-total
Miscellaneous Credits
Load Shaping True up
Slice True up
Other Sales sub-total
Gross Sales
GTA Delivery charge
Energy Efficiency Revenues
Irrigation Pumping Power
Reserve Energy
Downstream Benefits
Upper Baker Revenues
Miscellaneous Revenues
Regulating Reserve
Variable Energy Resource Balancing Service Reserve - Wind
VERBS for Solar
Dispatchable Energy Resource Balancing Service Reserve inc
Dispatchable Energy Resource Balancing Service Reserve dec
Settlement Annual Budget Adjustment
Rounding Adjustment
Adjustment for Settlement for Supplying Only 900 MW dec Balancing Reserve Capacity
Expected Balancing Reserve Capacity Sales in Spring from FCRPS Above Planned
Operating Reserve - Spinning
Operating Reserve - Supplemental
Synchronous Condensing
Generation Dropping
Energy Imbalance
Generation Imbalance
Redispatch
COE/Reclamation Network/Delivery Facilities Segmentation
Station Service
Operating Reserve - Energy
Generation Inputs / Inter-business line
4(h)(10)(c)
Colville and Spokane Settlements
Treasury Credits
Augmentation Power Purchase sub-total
Balancing Power Purchase sub-total
Other Power Purchase sub-total
Power Purchases
AH AI AJ AK AL AM AN AO AP AQ AR AS AT AU
2017 2017
201610 201611 201612 201701 201702 201703 201704 201705 201706 201707 201708 201709 $ (000's) aMW
193,374$ 193,374$ 193,374$ 193,374$ 193,374$ 193,374$ 193,374$ 193,374$ 193,374$ 193,374$ 193,374$ 193,374$ 2,320,485$ 6,886
(21,709)$ (21,709)$ (21,709)$ (21,709)$ (21,709)$ (21,709)$ (21,709)$ (21,709)$ (21,709)$ (21,709)$ (21,709)$ (21,709)$ (260,513)$ -
-$ -$ -$ -$ -$ -$ -$ -$ -$ -$ -$ -$ -$ -
(3,767)$ (7,676)$ 18,052$ 35,432$ 28,090$ 4,124$ 6,270$ (30,285)$ (16,387)$ (359)$ (7,255)$ 4,106$ 30,346$ 22
2,667$ 2,783$ 7,256$ 5,773$ 3,541$ 4,856$ 2,802$ 2,140$ 2,587$ 3,140$ 5,015$ 3,880$ 46,440$ -
(1,717)$ (1,717)$ (1,717)$ (1,717)$ (1,717)$ (1,717)$ (1,717)$ (1,717)$ (1,717)$ (1,717)$ (1,717)$ (1,717)$ (20,604)$ -
(3,244)$ (3,244)$ (3,244)$ (3,244)$ (3,244)$ (3,244)$ (3,244)$ (3,244)$ (3,244)$ (3,244)$ (3,244)$ (3,244)$ (38,924)$ -
2,307$ 2,307$ 2,307$ 2,307$ 2,307$ 2,307$ 2,307$ 2,307$ 2,307$ 2,307$ 2,307$ 2,307$ 27,679$ 79
119$ 119$ 119$ 119$ 119$ 119$ 119$ 119$ 119$ 119$ 119$ 119$ 1,432$ -
168,030$ 164,237$ 194,438$ 210,335$ 200,761$ 178,110$ 178,201$ 140,985$ 155,330$ 171,911$ 166,889$ 177,115$ 2,106,341$ 6,987
30$ 30$ 30$ 30$ 30$ 30$ 30$ 30$ 30$ 30$ 30$ 30$ 356$ 0
2,720$ 2,881$ 3,148$ 3,044$ 2,712$ 2,579$ 2,205$ 1,868$ 1,912$ 2,560$ 2,791$ 2,690$ 31,110$ 91
190$ 195$ 220$ 210$ 205$ 200$ 190$ 195$ 200$ 210$ 200$ 190$ 2,410$ 9
13,107$ 15,640$ 11,222$ 31,371$ 27,082$ 37,588$ 36,991$ 56,096$ 53,455$ 46,202$ 24,396$ 8,958$ 362,109$ 1,703
38$ 6,933$ 7,129$ 7,138$ 6,506$ 3,563$ 3,476$ 61$ 77$ 64$ 72$ 46$ 35,102$ 90
-$ -$ -$ -$ -$ -$ -$ -$ -$ -$ -$ -$ -$ 118
-$ -$ -$ -$ -$ 648$ -$ -$ -$ -$ -$ -$ 648$ -
-$ -$ -$ -$ -$ -$ -$ -$ -$ -$ -$ -$ -$ -
-$ -$ -$ -$ -$ -$ -$ -$ -$ -$ -$ -$ -$ -
-$ -$ -$ -$ -$ -$ -$ -$ -$ -$ -$ -$ -$ -
-$ -$ -$ -$ -$ -$ -$ -$ -$ -$ -$ -$ -$ -
$184,086 $189,887 $216,157 $252,098 $237,266 $222,688 $221,063 $199,206 $210,974 $220,948 $194,349 $189,000 $2,537,721 8,997
360$ 410$ 510$ 460$ 460$ 410$ 350$ 370$ 390$ 440$ 400$ 335$ 4,895$ -
583$ 583$ 583$ 583$ 583$ 583$ 583$ 583$ 583$ 583$ 583$ 583$ 7,000$ -
134$ 208$ 252$ 374$ 330$ 237$ 155$ 105$ 99$ 100$ 99$ 101$ 2,193$ 18
694$ 694$ 694$ 694$ 694$ 694$ 694$ 694$ 694$ 694$ 694$ 694$ 8,327$ 162
558$ 558$ 558$ 558$ 558$ 558$ 558$ 558$ 558$ 558$ 558$ 558$ 6,700$ -
-$ 116$ 121$ 116$ 119$ -$ -$ -$ -$ -$ -$ -$ 466$ 1
$1,970 $2,160 $2,208 $2,326 $2,284 $2,072 $1,990 $1,940 $1,935 $1,935 $1,935 $1,936 $29,580 180
519$ 519$ 519$ 519$ 519$ 519$ 519$ 519$ 519$ 519$ 519$ 519$ 6,224$ -
4,771$ 4,771$ 4,771$ 4,771$ 4,771$ 4,771$ 4,771$ 4,771$ 4,771$ 4,771$ 4,771$ 4,771$ 57,250$ -
7$ 7$ 7$ 7$ 7$ 7$ 7$ 7$ 7$ 7$ 7$ 7$ 86$ -
172$ 172$ 172$ 172$ 172$ 172$ 172$ 172$ 172$ 172$ 172$ 172$ 2,059$ -
33$ 33$ 33$ 33$ 33$ 33$ 33$ 33$ 33$ 33$ 33$ 33$ 391$ -
(1,267)$ (1,267)$ (1,267)$ (1,267)$ (1,267)$ (1,267)$ (1,267)$ (1,267)$ (1,267)$ (1,267)$ (1,267)$ (1,267)$ (15,200)$ -
2$ 2$ 2$ 2$ 2$ 2$ 2$ 2$ 2$ 2$ 2$ 2$ 26$ -
-$ -$ -$ -$ -$ -$ -$ -$ -$ -$ -$ -$ -$ -
333$ 333$ 333$ 333$ 333$ 333$ 333$ 333$ 333$ 333$ 333$ 333$ 4,000$ -
2,123$ 2,123$ 2,123$ 2,123$ 2,123$ 2,123$ 2,123$ 2,123$ 2,123$ 2,123$ 2,123$ 2,123$ 25,470$ -
1,946$ 1,946$ 1,946$ 1,946$ 1,946$ 1,946$ 1,946$ 1,946$ 1,946$ 1,946$ 1,946$ 1,946$ 23,348$ -
134$ 134$ 134$ 134$ 134$ 134$ 134$ 134$ 134$ 134$ 134$ 134$ 1,610$ -
35$ 35$ 35$ 35$ 35$ 35$ 35$ 35$ 35$ 35$ 35$ 35$ 415$ -
-$ -$ -$ -$ -$ -$ -$ -$ -$ -$ -$ -$ -$ -
-$ -$ -$ -$ -$ -$ -$ -$ -$ -$ -$ -$ -$ -
19$ 19$ 19$ 19$ 19$ 19$ 19$ 19$ 19$ 19$ 19$ 19$ 225$ -
614$ 614$ 614$ 614$ 614$ 614$ 614$ 614$ 614$ 614$ 614$ 614$ 7,367$ -
207$ 207$ 207$ 207$ 207$ 207$ 207$ 207$ 207$ 207$ 207$ 207$ 2,479$ 9
-$ -$ -$ -$ -$ -$ -$ -$ -$ -$ -$ -$ -$ -
9,646$ 9,646$ 9,646$ 9,646$ 9,646$ 9,646$ 9,646$ 9,646$ 9,646$ 9,646$ 9,646$ 9,646$ 115,750$ 9
7,923$ 5,922$ 8,244$ 10,262$ 8,333$ 7,294$ 6,602$ 6,016$ 6,971$ 5,914$ 5,578$ 8,725$ 87,786$ -
383$ 383$ 383$ 383$ 383$ 383$ 383$ 383$ 383$ 383$ 383$ 383$ 4,600$ -
8,306$ 6,305$ 8,628$ 10,646$ 8,716$ 7,678$ 6,985$ 6,400$ 7,354$ 6,298$ 5,962$ 9,108$ 92,386$ -
1,746$ 1,746$ 1,746$ 1,746$ 1,746$ 1,746$ 1,746$ 1,746$ 1,746$ 1,746$ 1,746$ 1,746$ 20,947$ 81
1,801$ 864$ 3,350$ 1,373$ 1,267$ 66$ 129$ 19$ 19$ 329$ 1,331$ 3,278$ 13,823$ 113
5,845$ 5,661$ 5,845$ 5,828$ 5,288$ 5,854$ 5,020$ 5,196$ 5,072$ 5,143$ 5,248$ 5,020$ 65,020$ 67
9,391$ 8,270$ 10,940$ 8,946$ 8,300$ 7,666$ 6,894$ 6,960$ 6,837$ 7,217$ 8,325$ 10,043$ 99,790$ 261
BP-16-FS-BPA-01A Page 137

Table 4.2 - Revenue at Proposed Rates
1
2
3
4
5
6
7
8
9
10
11
12
13
14
15
16
17
18
19
20
21
22
23
24
25
26
27
28
29
30
31
32
33
34
35
36
37
38
39
40
41
42
43
44
45
46
47
48
49
50
51
52
53
54
55
56
57
58
B C D E F G H I J K L M N O P Q R S
Table 4.2 - Revenue at Proposed Rates 2015 2015
Category 201410 201411 201412 201501 201502 201503 201504 201505 201506 201507 201508 201509 $ (000's) aMW
Composite Revenue 191,650$ 191,650$ 191,650$ 191,650$ 191,650$ 191,710$ 191,710$ 191,710$ 191,710$ 191,710$ 191,710$ 191,710$ 2,300,218$ 5,063
Non-Slice Revenue (21,442)$ (21,442)$ (21,442)$ (21,442)$ (21,442)$ (21,451)$ (21,451)$ (21,451)$ (21,451)$ (21,451)$ (21,451)$ (21,451)$ (257,365)$ -
Slice -$ -$ -$ -$ -$ -$ -$ -$ -$ -$ -$ -$ -$ 1,862
Load Shaping Revenue (3,835)$ (6,636)$ 7,224$ 7,558$ 7,874$ 12,040$ 20,571$ (28,892)$ (17,137)$ (16,170)$ (3,925)$ 1,120$ (20,208)$ 19
Demand Revenue 1,443$ 7,360$ 11,820$ 4,667$ 3,163$ 3,817$ 3,325$ 1,791$ 2,342$ 3,595$ 3,772$ 3,290$ 50,386$ -
Irrigation Rate Discount -$ -$ -$ -$ -$ -$ -$ (2,900)$ (4,335)$ (4,992)$ (4,097)$ (2,492)$ (18,816)$ -
Low Density Discount (2,622)$ (2,710)$ (3,105)$ (2,824)$ (2,726)$ (3,011)$ (3,363)$ (2,258)$ (2,541)$ (2,721)$ (2,931)$ (2,879)$ (33,691)$ -
Tier 2 2,186$ 2,169$ 2,186$ 2,186$ 1,964$ 2,281$ 2,210$ 2,284$ 2,210$ 2,284$ 2,284$ 2,195$ 26,439$ 75
RSS (Non-Federal) 172$ 50$ 47$ 111$ 170$ (51)$ (48)$ (54)$ (50)$ (52)$ (53)$ (50)$ 191$ -
PF customers (TRM) sub-total 167,551$ 170,440$ 188,380$ 181,906$ 180,653$ 185,335$ 192,955$ 140,229$ 150,749$ 152,203$ 165,309$ 171,445$ 2,043,973$ 7,019
NR sub-total (56)$ (106)$ (110)$ (159)$ (153)$ (155)$ (122)$ (110)$ (120)$ (163)$ (198)$ (198)$ (1,649)$ -
DSIs sub-total 9,283$ 9,770$ 10,808$ 10,397$ 9,416$ 8,845$ 7,527$ 1,778$ 1,843$ 2,458$ 2,658$ 2,582$ 77,366$ 312
FPS sub-total 300$ 410$ 334$ 423$ 334$ 361$ 340$ 357$ 369$ 393$ 380$ 340$ 4,343$ 8
Short-term market sales sub-total 12,066$ 21,687$ 36,055$ 46,660$ 48,851$ 52,104$ 32,600$ 34,453$ 36,479$ 24,443$ 8,619$ 4,927$ 358,943$ 1,153
Long Term Contractual Obligations sub-total 27$ 6,065$ 6,231$ 6,212$ 5,701$ 3,141$ 3,043$ 72$ 46$ 38$ 31$ 21$ 30,626$ 108
Canadian Entitlement Return -$ -$ -$ -$ -$ -$ -$ -$ -$ -$ -$ -$ -$ 114
Renewable Energy Certificates sub-total -$ -$ -$ -$ -$ 1,107$ -$ -$ -$ -$ -$ -$ 1,107$ -
Miscellaneous Credits 11$ 9$ 11$ 1$ 1$ (3)$ (2)$ (1)$ -$ -$ -$ -$ 27$ -
Load Shaping True up -$ -$ -$ -$ -$ -$ -$ -$ -$ -$ -$ (3,181)$ (3,181)$ -
Slice True up -$ -$ -$ -$ -$ -$ -$ -$ -$ -$ -$ (26,821)$ (26,821)$ -
Other Sales sub-total 11$ 9$ 11$ 1$ 1$ (3)$ (2)$ (1)$ -$ -$ -$ (26,821)$ (26,794)$ -
Gross Sales $189,182 $208,276 $241,708 $245,441 $244,804 $250,735 $236,341 $176,777 $189,365 $179,371 $176,798 $152,296 $2,487,914 8,716
GTA Delivery charge 135$ 183$ 197$ 177$ 164$ 117$ 135$ 140$ 140$ 165$ 150$ 145$ 1,847$ -
Energy Efficiency Revenues 614$ 518$ 1,037$ 221$ 299$ 880$ 939$ 939$ 939$ 939$ 939$ 939$ 9,200$ -
Irrigation Pumping Power 235$ 233$ 140$ 58$ 8$ 3$ 3$ 3$ 4$ 37$ 111$ 155$ 991$ 15
Reserve Energy 702$ 702$ 702$ 702$ 702$ 620$ 702$ 702$ 702$ 702$ 702$ 702$ 8,342$ 162
Downstream Benefits 546$ 546$ 546$ 546$ 546$ 546$ 558$ 558$ 558$ 558$ 558$ 558$ 6,620$ -
Upper Baker Revenues -$ 104$ 108$ 105$ 106$ -$ -$ -$ -$ -$ -$ -$ 424$ 1
Miscellaneous Revenues $2,246 $2,304 $3,297 $1,953 $1,999 $2,358 $2,336 $2,341 $2,343 $2,400 $2,460 $2,498 $29,917 178
Regulating Reserve 505$ 505$ 505$ 505$ 505$ 505$ 505$ 505$ 505$ 505$ 505$ 505$ 6,058$ -
Variable Energy Resource Balancing Service Reserve - Wind 4,867$ 4,867$ 5,187$ 5,187$ 5,187$ 5,187$ 5,187$ 5,187$ 5,187$ 5,173$ 5,173$ 5,173$ 61,559$ -
VERBS for Solar 1$ 1$ 1$ 1$ 1$ 1$ 1$ 1$ 1$ 1$ 1$ 1$ 15$ -
Dispatchable Energy Resource Balancing Service Reserve inc 133$ 133$ 133$ 133$ 133$ 133$ 133$ 133$ 133$ 133$ 133$ 133$ 1,592$ -
Dispatchable Energy Resource Balancing Service Reserve dec 17$ 17$ 17$ 17$ 17$ 17$ 17$ 17$ 17$ 17$ 17$ 17$ 202$ -
Settlement Annual Budget Adjustment -$ -$ -$ -$ -$ -$ -$ -$ -$ -$ -$ -$ -$ -
Rounding Adjustment -$ -$ -$ -$ -$ -$ -$ -$ -$ -$ -$ -$ -$ -
Adjustment for Settlement for Supplying Only 900 MW dec Balancing Reserve Capacity -$ -$ -$ -$ -$ -$ -$ -$ -$ -$ -$ -$ -$ -
Expected Balancing Reserve Capacity Sales in Spring from FCRPS Above Planned -$ -$ -$ -$ -$ -$ -$ -$ -$ -$ -$ -$ -$ -
Operating Reserve - Spinning 1,541$ 1,778$ 1,977$ 2,016$ 1,831$ 1,902$ 2,073$ 2,000$ 2,072$ 2,106$ 1,968$ 1,704$ 22,967$ -
Operating Reserve - Supplemental 1,411$ 1,629$ 1,811$ 1,847$ 1,677$ 1,742$ 1,899$ 1,832$ 1,898$ 1,930$ 1,803$ 1,561$ 21,043$ -
Synchronous Condensing 131$ 131$ 131$ 131$ 131$ 131$ 131$ 131$ 131$ 131$ 131$ 131$ 1,569$ -
Generation Dropping 28$ 28$ 28$ 28$ 28$ 28$ 28$ 28$ 28$ 28$ 28$ 28$ 333$ -
Energy Imbalance 513$ 738$ 247$ 247$ 301$ 100$ 187$ 175$ 84$ 116$ (9)$ (79)$ 2,620$ -
Generation Imbalance -$ -$ -$ -$ -$ 419$ 810$ 1,042$ 491$ 625$ 429$ 176$ 3,992$ -
Redispatch 2$ -$ 1$ 3$ 2$ 33$ 33$ 33$ 33$ 33$ 33$ 33$ 242$ -
COE/Reclamation Network/Delivery Facilities Segmentation 625$ 625$ 625$ 625$ 625$ 625$ 625$ 625$ 625$ 625$ 625$ 625$ 7,500$ -
Station Service 199$ 199$ 199$ 199$ 199$ 199$ 199$ 199$ 199$ 199$ 199$ 199$ 2,385$ 9
Operating Reserve - Energy 35$ 102$ 52$ 34$ 36$ 86$ 82$ 61$ 59$ 124$ 101$ 96$ 868$ -
Generation Inputs / Inter-business line 10,006$ 10,751$ 10,913$ 10,973$ 10,671$ 11,089$ 11,891$ 11,968$ 11,462$ 11,745$ 11,137$ 10,303$ 132,908$ 9
4(h)(10)(c) 9,411$ 8,456$ 7,292$ 6,365$ 1,874$ 5,608$ 4,499$ 5,672$ 5,418$ 5,497$ 4,852$ 8,754$ 73,697$ -
Colville and Spokane Settlements 383$ 383$ 383$ 383$ 383$ 383$ 383$ 383$ 383$ 383$ 383$ 383$ 4,600$ -
Treasury Credits 9,795$ 8,839$ 7,675$ 6,748$ 2,257$ 5,992$ 4,882$ 6,055$ 5,801$ 5,880$ 5,235$ 9,137$ 78,297$ -
Augmentation Power Purchase sub-total -$ -$ -$ -$ -$ -$ -$ -$ -$ -$ -$ -$ -$ -
Balancing Power Purchase sub-total 112$ 6,227$ 2,674$ (610)$ (2,240)$ 1,469$ 6,176$ 951$ 2,090$ 4,492$ 5,822$ 4,709$ 31,870$ 189
Other Power Purchase sub-total 2,093$ 2,025$ 2,094$ 2,094$ 1,891$ 2,091$ 2,027$ 2,094$ 2,027$ 2,094$ 2,094$ 2,027$ 24,650$ 141
Power Purchases 2,205$ 8,252$ 4,768$ 1,485$ (349)$ 3,560$ 8,202$ 3,045$ 4,117$ 6,586$ 7,916$ 6,736$ 56,521$ 330
BP-16-FS-BPA-01A Page 138
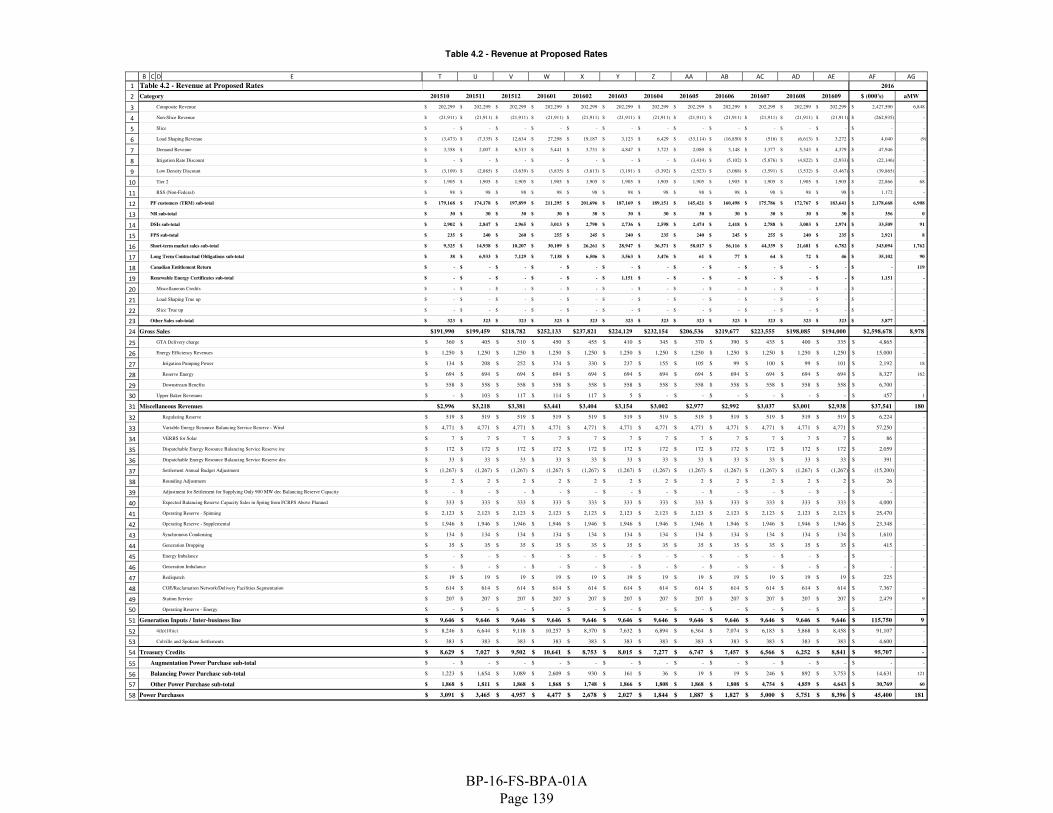
Table 4.2 - Revenue at Proposed Rates
1
2
3
4
5
6
7
8
9
10
11
12
13
14
15
16
17
18
19
20
21
22
23
24
25
26
27
28
29
30
31
32
33
34
35
36
37
38
39
40
41
42
43
44
45
46
47
48
49
50
51
52
53
54
55
56
57
58
B C D E
Table 4.2 - Revenue at Proposed Rates
Category
Composite Revenue
Non-Slice Revenue
Slice
Load Shaping Revenue
Demand Revenue
Irrigation Rate Discount
Low Density Discount
Tier 2
RSS (Non-Federal)
PF customers (TRM) sub-total
NR sub-total
DSIs sub-total
FPS sub-total
Short-term market sales sub-total
Long Term Contractual Obligations sub-total
Canadian Entitlement Return
Renewable Energy Certificates sub-total
Miscellaneous Credits
Load Shaping True up
Slice True up
Other Sales sub-total
Gross Sales
GTA Delivery charge
Energy Efficiency Revenues
Irrigation Pumping Power
Reserve Energy
Downstream Benefits
Upper Baker Revenues
Miscellaneous Revenues
Regulating Reserve
Variable Energy Resource Balancing Service Reserve - Wind
VERBS for Solar
Dispatchable Energy Resource Balancing Service Reserve inc
Dispatchable Energy Resource Balancing Service Reserve dec
Settlement Annual Budget Adjustment
Rounding Adjustment
Adjustment for Settlement for Supplying Only 900 MW dec Balancing Reserve Capacity
Expected Balancing Reserve Capacity Sales in Spring from FCRPS Above Planned
Operating Reserve - Spinning
Operating Reserve - Supplemental
Synchronous Condensing
Generation Dropping
Energy Imbalance
Generation Imbalance
Redispatch
COE/Reclamation Network/Delivery Facilities Segmentation
Station Service
Operating Reserve - Energy
Generation Inputs / Inter-business line
4(h)(10)(c)
Colville and Spokane Settlements
Treasury Credits
Augmentation Power Purchase sub-total
Balancing Power Purchase sub-total
Other Power Purchase sub-total
Power Purchases
T U V W X Y Z AA AB AC AD AE AF AG
2016 2016
201510 201511 201512 201601 201602 201603 201604 201605 201606 201607 201608 201609 $ (000's) aMW
202,299$ 202,299$ 202,299$ 202,299$ 202,299$ 202,299$ 202,299$ 202,299$ 202,299$ 202,299$ 202,299$ 202,299$ 2,427,590$ 6,848
(21,911)$ (21,911)$ (21,911)$ (21,911)$ (21,911)$ (21,911)$ (21,911)$ (21,911)$ (21,911)$ (21,911)$ (21,911)$ (21,911)$ (262,935)$ -
-$ -$ -$ -$ -$ -$ -$ -$ -$ -$ -$ -$ -$ -
(3,473)$ (7,335)$ 12,634$ 27,298$ 19,187$ 3,123$ 6,429$ (33,114)$ (16,850)$ (516)$ (6,613)$ 3,272$ 4,040$ (9)
3,358$ 2,007$ 6,513$ 5,441$ 3,731$ 4,847$ 3,723$ 2,080$ 3,148$ 3,377$ 5,343$ 4,379$ 47,946$ -
-$ -$ -$ -$ -$ -$ -$ (3,414)$ (5,102)$ (5,876)$ (4,822)$ (2,933)$ (22,146)$ -
(3,109)$ (2,885)$ (3,639)$ (3,835)$ (3,613)$ (3,191)$ (3,392)$ (2,523)$ (3,088)$ (3,591)$ (3,532)$ (3,467)$ (39,865)$ -
1,905$ 1,905$ 1,905$ 1,905$ 1,905$ 1,905$ 1,905$ 1,905$ 1,905$ 1,905$ 1,905$ 1,905$ 22,866$ 68
98$ 98$ 98$ 98$ 98$ 98$ 98$ 98$ 98$ 98$ 98$ 98$ 1,172$ -
179,168$ 174,178$ 197,899$ 211,295$ 201,696$ 187,169$ 189,151$ 145,421$ 160,498$ 175,786$ 172,767$ 183,641$ 2,178,668$ 6,908
30$ 30$ 30$ 30$ 30$ 30$ 30$ 30$ 30$ 30$ 30$ 30$ 356$ 0
2,902$ 2,847$ 2,965$ 3,013$ 2,790$ 2,736$ 2,598$ 2,474$ 2,418$ 2,788$ 3,003$ 2,974$ 33,509$ 91
235$ 240$ 260$ 255$ 245$ 240$ 235$ 240$ 245$ 255$ 240$ 235$ 2,921$ 8
9,325$ 14,938$ 10,207$ 30,109$ 26,261$ 28,947$ 36,371$ 58,017$ 56,116$ 44,339$ 21,681$ 6,782$ 343,094$ 1,762
38$ 6,933$ 7,129$ 7,138$ 6,506$ 3,563$ 3,476$ 61$ 77$ 64$ 72$ 46$ 35,102$ 90
-$ -$ -$ -$ -$ -$ -$ -$ -$ -$ -$ -$ -$ 119
-$ -$ -$ -$ -$ 1,151$ -$ -$ -$ -$ -$ -$ 1,151$ -
-$ -$ -$ -$ -$ -$ -$ -$ -$ -$ -$ -$ -$ -
-$ -$ -$ -$ -$ -$ -$ -$ -$ -$ -$ -$ -$ -
-$ -$ -$ -$ -$ -$ -$ -$ -$ -$ -$ -$ -$ -
323$ 323$ 323$ 323$ 323$ 323$ 323$ 323$ 323$ 323$ 323$ 323$ 3,877$ -
$191,990 $199,459 $218,782 $252,133 $237,821 $224,129 $232,154 $206,536 $219,677 $223,555 $198,085 $194,000 $2,598,678 8,978
360$ 405$ 510$ 450$ 455$ 410$ 345$ 370$ 390$ 435$ 400$ 335$ 4,865$ -
1,250$ 1,250$ 1,250$ 1,250$ 1,250$ 1,250$ 1,250$ 1,250$ 1,250$ 1,250$ 1,250$ 1,250$ 15,000$ -
134$ 208$ 252$ 374$ 330$ 237$ 155$ 105$ 99$ 100$ 99$ 101$ 2,192$ 18
694$ 694$ 694$ 694$ 694$ 694$ 694$ 694$ 694$ 694$ 694$ 694$ 8,327$ 162
558$ 558$ 558$ 558$ 558$ 558$ 558$ 558$ 558$ 558$ 558$ 558$ 6,700$ -
-$ 103$ 117$ 114$ 117$ 5$ -$ -$ -$ -$ -$ -$ 457$ 1
$2,996 $3,218 $3,381 $3,441 $3,404 $3,154 $3,002 $2,977 $2,992 $3,037 $3,001 $2,938 $37,541 180
519$ 519$ 519$ 519$ 519$ 519$ 519$ 519$ 519$ 519$ 519$ 519$ 6,224$ -
4,771$ 4,771$ 4,771$ 4,771$ 4,771$ 4,771$ 4,771$ 4,771$ 4,771$ 4,771$ 4,771$ 4,771$ 57,250$ -
7$ 7$ 7$ 7$ 7$ 7$ 7$ 7$ 7$ 7$ 7$ 7$ 86$ -
172$ 172$ 172$ 172$ 172$ 172$ 172$ 172$ 172$ 172$ 172$ 172$ 2,059$ -
33$ 33$ 33$ 33$ 33$ 33$ 33$ 33$ 33$ 33$ 33$ 33$ 391$ -
(1,267)$ (1,267)$ (1,267)$ (1,267)$ (1,267)$ (1,267)$ (1,267)$ (1,267)$ (1,267)$ (1,267)$ (1,267)$ (1,267)$ (15,200)$ -
2$ 2$ 2$ 2$ 2$ 2$ 2$ 2$ 2$ 2$ 2$ 2$ 26$ -
-$ -$ -$ -$ -$ -$ -$ -$ -$ -$ -$ -$ -$ -
333$ 333$ 333$ 333$ 333$ 333$ 333$ 333$ 333$ 333$ 333$ 333$ 4,000$ -
2,123$ 2,123$ 2,123$ 2,123$ 2,123$ 2,123$ 2,123$ 2,123$ 2,123$ 2,123$ 2,123$ 2,123$ 25,470$ -
1,946$ 1,946$ 1,946$ 1,946$ 1,946$ 1,946$ 1,946$ 1,946$ 1,946$ 1,946$ 1,946$ 1,946$ 23,348$ -
134$ 134$ 134$ 134$ 134$ 134$ 134$ 134$ 134$ 134$ 134$ 134$ 1,610$ -
35$ 35$ 35$ 35$ 35$ 35$ 35$ 35$ 35$ 35$ 35$ 35$ 415$ -
-$ -$ -$ -$ -$ -$ -$ -$ -$ -$ -$ -$ -$ -
-$ -$ -$ -$ -$ -$ -$ -$ -$ -$ -$ -$ -$ -
19$ 19$ 19$ 19$ 19$ 19$ 19$ 19$ 19$ 19$ 19$ 19$ 225$ -
614$ 614$ 614$ 614$ 614$ 614$ 614$ 614$ 614$ 614$ 614$ 614$ 7,367$ -
207$ 207$ 207$ 207$ 207$ 207$ 207$ 207$ 207$ 207$ 207$ 207$ 2,479$ 9
-$ -$ -$ -$ -$ -$ -$ -$ -$ -$ -$ -$ -$ -
9,646$ 9,646$ 9,646$ 9,646$ 9,646$ 9,646$ 9,646$ 9,646$ 9,646$ 9,646$ 9,646$ 9,646$ 115,750$ 9
8,246$ 6,644$ 9,118$ 10,257$ 8,370$ 7,632$ 6,894$ 6,364$ 7,074$ 6,183$ 5,868$ 8,458$ 91,107$ -
383$ 383$ 383$ 383$ 383$ 383$ 383$ 383$ 383$ 383$ 383$ 383$ 4,600$ -
8,629$ 7,027$ 9,502$ 10,641$ 8,753$ 8,015$ 7,277$ 6,747$ 7,457$ 6,566$ 6,252$ 8,841$ 95,707$ -
-$ -$ -$ -$ -$ -$ -$ -$ -$ -$ -$ -$ -$ -
1,223$ 1,654$ 3,089$ 2,609$ 930$ 161$ 36$ 19$ 19$ 246$ 892$ 3,753$ 14,631$ 121
1,868$ 1,811$ 1,868$ 1,868$ 1,748$ 1,866$ 1,808$ 1,868$ 1,808$ 4,754$ 4,859$ 4,643$ 30,769$ 60
3,091$ 3,465$ 4,957$ 4,477$ 2,678$ 2,027$ 1,844$ 1,887$ 1,827$ 5,000$ 5,751$ 8,396$ 45,400$ 181
BP-16-FS-BPA-01A Page 139
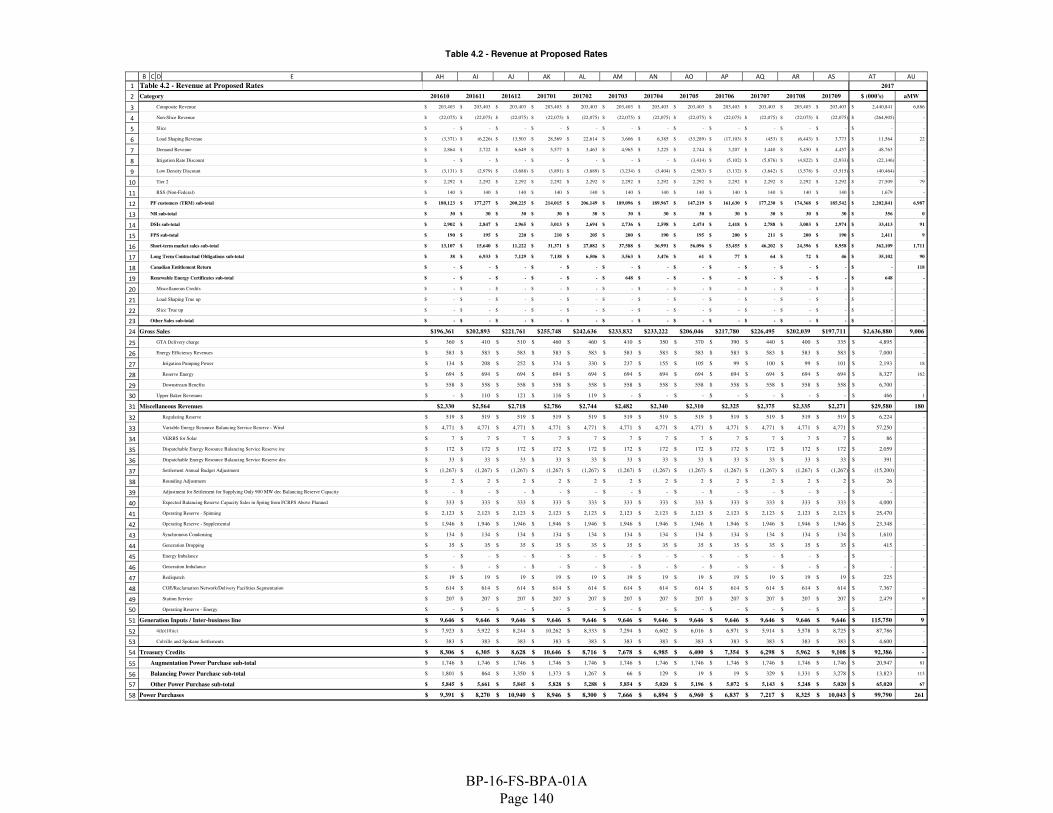
Table 4.2 - Revenue at Proposed Rates
1
2
3
4
5
6
7
8
9
10
11
12
13
14
15
16
17
18
19
20
21
22
23
24
25
26
27
28
29
30
31
32
33
34
35
36
37
38
39
40
41
42
43
44
45
46
47
48
49
50
51
52
53
54
55
56
57
58
B C D E
Table 4.2 - Revenue at Proposed Rates
Category
Composite Revenue
Non-Slice Revenue
Slice
Load Shaping Revenue
Demand Revenue
Irrigation Rate Discount
Low Density Discount
Tier 2
RSS (Non-Federal)
PF customers (TRM) sub-total
NR sub-total
DSIs sub-total
FPS sub-total
Short-term market sales sub-total
Long Term Contractual Obligations sub-total
Canadian Entitlement Return
Renewable Energy Certificates sub-total
Miscellaneous Credits
Load Shaping True up
Slice True up
Other Sales sub-total
Gross Sales
GTA Delivery charge
Energy Efficiency Revenues
Irrigation Pumping Power
Reserve Energy
Downstream Benefits
Upper Baker Revenues
Miscellaneous Revenues
Regulating Reserve
Variable Energy Resource Balancing Service Reserve - Wind
VERBS for Solar
Dispatchable Energy Resource Balancing Service Reserve inc
Dispatchable Energy Resource Balancing Service Reserve dec
Settlement Annual Budget Adjustment
Rounding Adjustment
Adjustment for Settlement for Supplying Only 900 MW dec Balancing Reserve Capacity
Expected Balancing Reserve Capacity Sales in Spring from FCRPS Above Planned
Operating Reserve - Spinning
Operating Reserve - Supplemental
Synchronous Condensing
Generation Dropping
Energy Imbalance
Generation Imbalance
Redispatch
COE/Reclamation Network/Delivery Facilities Segmentation
Station Service
Operating Reserve - Energy
Generation Inputs / Inter-business line
4(h)(10)(c)
Colville and Spokane Settlements
Treasury Credits
Augmentation Power Purchase sub-total
Balancing Power Purchase sub-total
Other Power Purchase sub-total
Power Purchases
AH AI AJ AK AL AM AN AO AP AQ AR AS AT AU
2017 2017
201610 201611 201612 201701 201702 201703 201704 201705 201706 201707 201708 201709 $ (000's) aMW
203,403$ 203,403$ 203,403$ 203,403$ 203,403$ 203,403$ 203,403$ 203,403$ 203,403$ 203,403$ 203,403$ 203,403$ 2,440,841$ 6,886
(22,075)$ (22,075)$ (22,075)$ (22,075)$ (22,075)$ (22,075)$ (22,075)$ (22,075)$ (22,075)$ (22,075)$ (22,075)$ (22,075)$ (264,905)$ -
-$ -$ -$ -$ -$ -$ -$ -$ -$ -$ -$ -$ -$ -
(3,371)$ (6,226)$ 13,503$ 28,569$ 22,614$ 3,606$ 6,385$ (33,289)$ (17,103)$ (453)$ (6,443)$ 3,773$ 11,564$ 22
2,864$ 2,722$ 6,649$ 5,577$ 3,463$ 4,965$ 3,225$ 2,744$ 3,207$ 3,440$ 5,450$ 4,457$ 48,763$ -
-$ -$ -$ -$ -$ -$ -$ (3,414)$ (5,102)$ (5,876)$ (4,822)$ (2,933)$ (22,146)$ -
(3,131)$ (2,979)$ (3,688)$ (3,891)$ (3,689)$ (3,234)$ (3,404)$ (2,583)$ (3,132)$ (3,642)$ (3,578)$ (3,515)$ (40,464)$ -
2,292$ 2,292$ 2,292$ 2,292$ 2,292$ 2,292$ 2,292$ 2,292$ 2,292$ 2,292$ 2,292$ 2,292$ 27,509$ 79
140$ 140$ 140$ 140$ 140$ 140$ 140$ 140$ 140$ 140$ 140$ 140$ 1,679$ -
180,123$ 177,277$ 200,225$ 214,015$ 206,149$ 189,096$ 189,967$ 147,219$ 161,630$ 177,230$ 174,368$ 185,542$ 2,202,841$ 6,987
30$ 30$ 30$ 30$ 30$ 30$ 30$ 30$ 30$ 30$ 30$ 30$ 356$ 0
2,902$ 2,847$ 2,965$ 3,013$ 2,694$ 2,736$ 2,598$ 2,474$ 2,418$ 2,788$ 3,003$ 2,974$ 33,413$ 91
190$ 195$ 220$ 210$ 205$ 200$ 190$ 195$ 200$ 211$ 200$ 190$ 2,411$ 9
13,107$ 15,640$ 11,222$ 31,371$ 27,082$ 37,588$ 36,991$ 56,096$ 53,455$ 46,202$ 24,396$ 8,958$ 362,109$ 1,711
38$ 6,933$ 7,129$ 7,138$ 6,506$ 3,563$ 3,476$ 61$ 77$ 64$ 72$ 46$ 35,102$ 90
-$ -$ -$ -$ -$ -$ -$ -$ -$ -$ -$ -$ -$ 118
-$ -$ -$ -$ -$ 648$ -$ -$ -$ -$ -$ -$ 648$ -
-$ -$ -$ -$ -$ -$ -$ -$ -$ -$ -$ -$ -$ -
-$ -$ -$ -$ -$ -$ -$ -$ -$ -$ -$ -$ -$ -
-$ -$ -$ -$ -$ -$ -$ -$ -$ -$ -$ -$ -$ -
-$ -$ -$ -$ -$ -$ -$ -$ -$ -$ -$ -$ -$ -
$196,361 $202,893 $221,761 $255,748 $242,636 $233,832 $233,222 $206,046 $217,780 $226,495 $202,039 $197,711 $2,636,880 9,006
360$ 410$ 510$ 460$ 460$ 410$ 350$ 370$ 390$ 440$ 400$ 335$ 4,895$ -
583$ 583$ 583$ 583$ 583$ 583$ 583$ 583$ 583$ 583$ 583$ 583$ 7,000$ -
134$ 208$ 252$ 374$ 330$ 237$ 155$ 105$ 99$ 100$ 99$ 101$ 2,193$ 18
694$ 694$ 694$ 694$ 694$ 694$ 694$ 694$ 694$ 694$ 694$ 694$ 8,327$ 162
558$ 558$ 558$ 558$ 558$ 558$ 558$ 558$ 558$ 558$ 558$ 558$ 6,700$ -
-$ 110$ 121$ 116$ 119$ -$ -$ -$ -$ -$ -$ -$ 466$ 1
$2,330 $2,564 $2,718 $2,786 $2,744 $2,482 $2,340 $2,310 $2,325 $2,375 $2,335 $2,271 $29,580 180
519$ 519$ 519$ 519$ 519$ 519$ 519$ 519$ 519$ 519$ 519$ 519$ 6,224$ -
4,771$ 4,771$ 4,771$ 4,771$ 4,771$ 4,771$ 4,771$ 4,771$ 4,771$ 4,771$ 4,771$ 4,771$ 57,250$ -
7$ 7$ 7$ 7$ 7$ 7$ 7$ 7$ 7$ 7$ 7$ 7$ 86$ -
172$ 172$ 172$ 172$ 172$ 172$ 172$ 172$ 172$ 172$ 172$ 172$ 2,059$ -
33$ 33$ 33$ 33$ 33$ 33$ 33$ 33$ 33$ 33$ 33$ 33$ 391$ -
(1,267)$ (1,267)$ (1,267)$ (1,267)$ (1,267)$ (1,267)$ (1,267)$ (1,267)$ (1,267)$ (1,267)$ (1,267)$ (1,267)$ (15,200)$ -
2$ 2$ 2$ 2$ 2$ 2$ 2$ 2$ 2$ 2$ 2$ 2$ 26$ -
-$ -$ -$ -$ -$ -$ -$ -$ -$ -$ -$ -$ -$ -
333$ 333$ 333$ 333$ 333$ 333$ 333$ 333$ 333$ 333$ 333$ 333$ 4,000$ -
2,123$ 2,123$ 2,123$ 2,123$ 2,123$ 2,123$ 2,123$ 2,123$ 2,123$ 2,123$ 2,123$ 2,123$ 25,470$ -
1,946$ 1,946$ 1,946$ 1,946$ 1,946$ 1,946$ 1,946$ 1,946$ 1,946$ 1,946$ 1,946$ 1,946$ 23,348$ -
134$ 134$ 134$ 134$ 134$ 134$ 134$ 134$ 134$ 134$ 134$ 134$ 1,610$ -
35$ 35$ 35$ 35$ 35$ 35$ 35$ 35$ 35$ 35$ 35$ 35$ 415$ -
-$ -$ -$ -$ -$ -$ -$ -$ -$ -$ -$ -$ -$ -
-$ -$ -$ -$ -$ -$ -$ -$ -$ -$ -$ -$ -$ -
19$ 19$ 19$ 19$ 19$ 19$ 19$ 19$ 19$ 19$ 19$ 19$ 225$ -
614$ 614$ 614$ 614$ 614$ 614$ 614$ 614$ 614$ 614$ 614$ 614$ 7,367$ -
207$ 207$ 207$ 207$ 207$ 207$ 207$ 207$ 207$ 207$ 207$ 207$ 2,479$ 9
-$ -$ -$ -$ -$ -$ -$ -$ -$ -$ -$ -$ -$ -
9,646$ 9,646$ 9,646$ 9,646$ 9,646$ 9,646$ 9,646$ 9,646$ 9,646$ 9,646$ 9,646$ 9,646$ 115,750$ 9
7,923$ 5,922$ 8,244$ 10,262$ 8,333$ 7,294$ 6,602$ 6,016$ 6,971$ 5,914$ 5,578$ 8,725$ 87,786$ -
383$ 383$ 383$ 383$ 383$ 383$ 383$ 383$ 383$ 383$ 383$ 383$ 4,600$ -
8,306$ 6,305$ 8,628$ 10,646$ 8,716$ 7,678$ 6,985$ 6,400$ 7,354$ 6,298$ 5,962$ 9,108$ 92,386$ -
1,746$ 1,746$ 1,746$ 1,746$ 1,746$ 1,746$ 1,746$ 1,746$ 1,746$ 1,746$ 1,746$ 1,746$ 20,947$ 81
1,801$ 864$ 3,350$ 1,373$ 1,267$ 66$ 129$ 19$ 19$ 329$ 1,331$ 3,278$ 13,823$ 113
5,845$ 5,661$ 5,845$ 5,828$ 5,288$ 5,854$ 5,020$ 5,196$ 5,072$ 5,143$ 5,248$ 5,020$ 65,020$ 67
9,391$ 8,270$ 10,940$ 8,946$ 8,300$ 7,666$ 6,894$ 6,960$ 6,837$ 7,217$ 8,325$ 10,043$ 99,790$ 261
BP-16-FS-BPA-01A Page 140
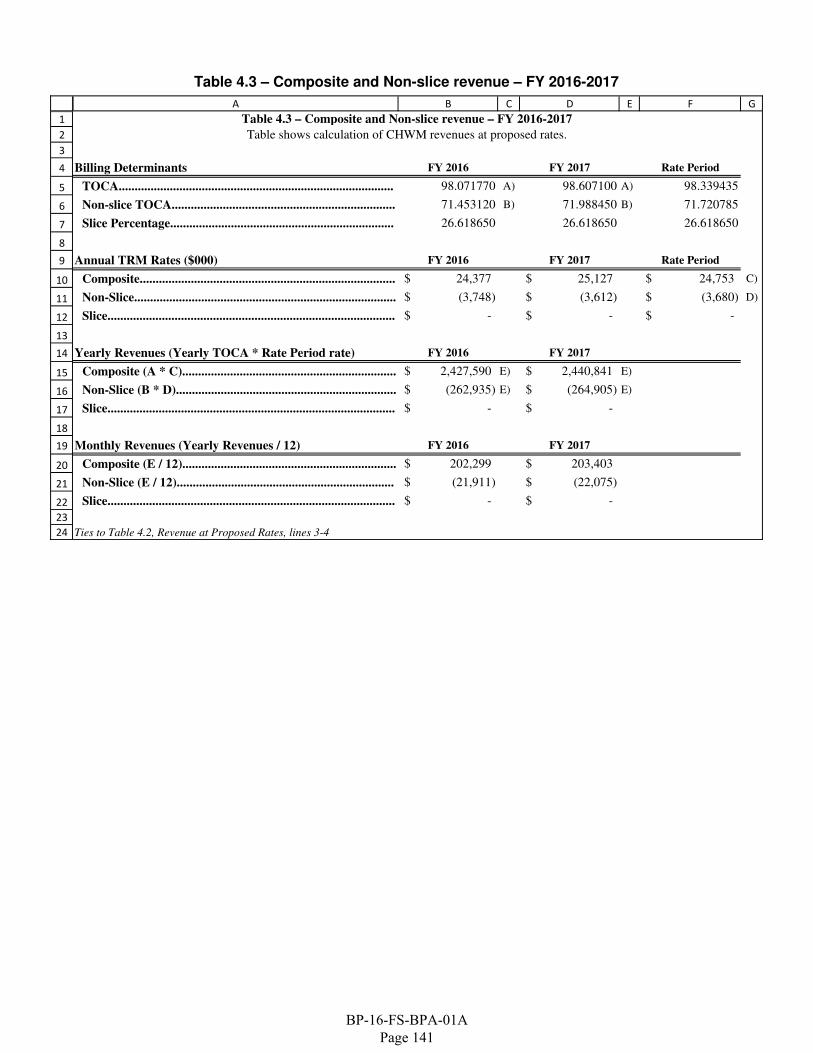
Table 4.3 – Composite and Non-slice revenue – FY 2016-2017
1
2
3
4
5
6
7
8
9
10
11
12
13
14
15
16
17
18
19
20
21
22
23
24
A B C D E F G
Billing Determinants FY 2016 FY 2017 Rate Period
TOCA...................................................................................... 98.071770 A) 98.607100 A) 98.339435
Non-slice TOCA...................................................................... 71.453120 B) 71.988450 B) 71.720785
Slice Percentage...................................................................... 26.618650 26.618650 26.618650
Annual TRM Rates ($000) FY 2016 FY 2017 Rate Period
Composite................................................................................ 24,377$ 25,127$ 24,753$ C)
Non-Slice.................................................................................. (3,748)$ (3,612)$ (3,680)$ D)
Slice.......................................................................................... -$ -$ -$
Yearly Revenues (Yearly TOCA * Rate Period rate) FY 2016 FY 2017
Composite (A * C)................................................................... 2,427,590$ E) 2,440,841$ E)
Non-Slice (B * D)..................................................................... (262,935)$ E) (264,905)$ E)
Slice.......................................................................................... -$ -$
Monthly Revenues (Yearly Revenues / 12) FY 2016 FY 2017
Composite (E / 12)................................................................... 202,299$ 203,403$
Non-Slice (E / 12).................................................................... (21,911)$ (22,075)$
Slice.......................................................................................... -$ -$
Ties to Table 4.2, Revenue at Proposed Rates, lines 3-4
Table 4.3 – Composite and Non-slice revenue – FY 2016-2017
Table shows calculation of CHWM revenues at proposed rates.
BP-16-FS-BPA-01A Page 141
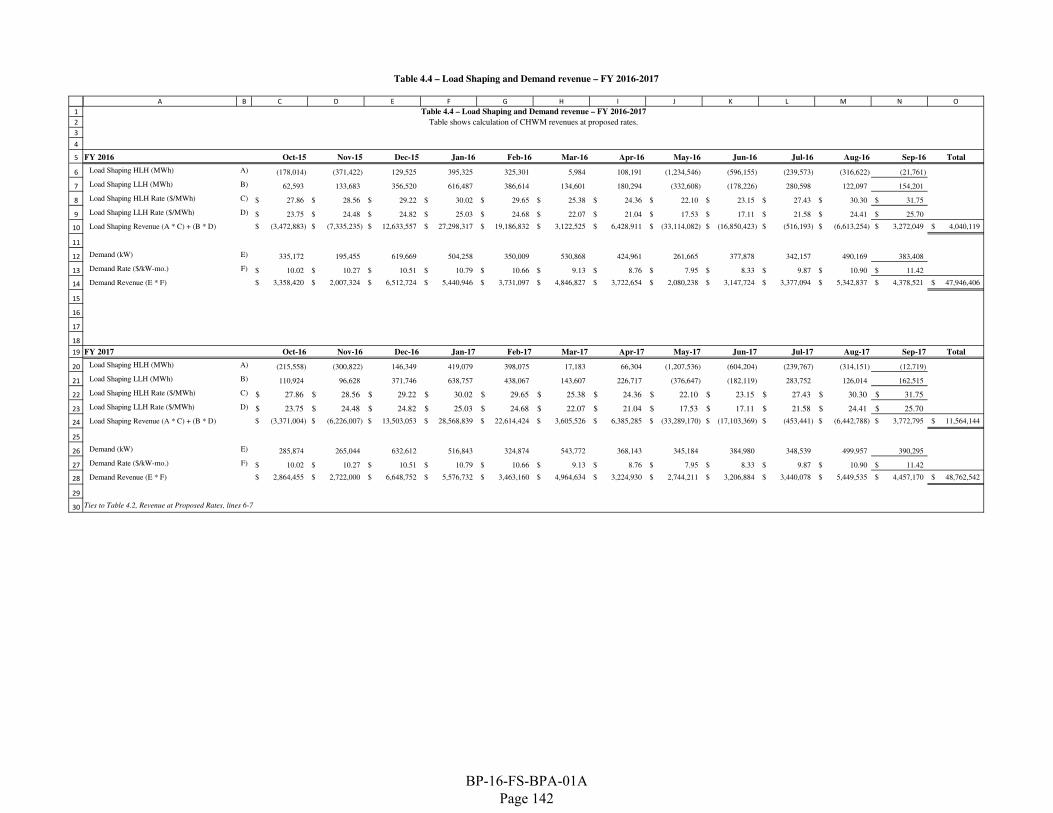
Table 4.4 – Load Shaping and Demand revenue – FY 2016-2017
1
2
3
4
5
6
7
8
9
10
11
12
13
14
15
16
17
18
19
20
21
22
23
24
25
26
27
28
29
30
A B C D E F G H I J K L M N O
FY 2016 Oct-15 Nov-15 Dec-15 Jan-16 Feb-16 Mar-16 Apr-16 May-16 Jun-16 Jul-16 Aug-16 Sep-16 Total
Load Shaping HLH (MWh) A) (178,014) (371,422) 129,525 395,325 325,301 5,984 108,191 (1,234,546) (596,155) (239,573) (316,622) (21,761)
Load Shaping LLH (MWh) B) 62,593 133,683 356,520 616,487 386,614 134,601 180,294 (332,608) (178,226) 280,598 122,097 154,201
Load Shaping HLH Rate ($/MWh) C) 27.86$ 28.56$ 29.22$ 30.02$ 29.65$ 25.38$ 24.36$ 22.10$ 23.15$ 27.43$ 30.30$ 31.75$
Load Shaping LLH Rate ($/MWh) D) 23.75$ 24.48$ 24.82$ 25.03$ 24.68$ 22.07$ 21.04$ 17.53$ 17.11$ 21.58$ 24.41$ 25.70$
Load Shaping Revenue (A * C) + (B * D) (3,472,883)$ (7,335,235)$ 12,633,557$ 27,298,317$ 19,186,832$ 3,122,525$ 6,428,911$ (33,114,082)$ (16,850,423)$ (516,193)$ (6,613,254)$ 3,272,049$ 4,040,119$
Demand (kW) E) 335,172 195,455 619,669 504,258 350,009 530,868 424,961 261,665 377,878 342,157 490,169 383,408
Demand Rate ($/kW-mo.) F) 10.02$ 10.27$ 10.51$ 10.79$ 10.66$ 9.13$ 8.76$ 7.95$ 8.33$ 9.87$ 10.90$ 11.42$
Demand Revenue (E * F) 3,358,420$ 2,007,324$ 6,512,724$ 5,440,946$ 3,731,097$ 4,846,827$ 3,722,654$ 2,080,238$ 3,147,724$ 3,377,094$ 5,342,837$ 4,378,521$ 47,946,406$
FY 2017 Oct-16 Nov-16 Dec-16 Jan-17 Feb-17 Mar-17 Apr-17 May-17 Jun-17 Jul-17 Aug-17 Sep-17 Total
Load Shaping HLH (MWh) A) (215,558) (300,822) 146,349 419,079 398,075 17,183 66,304 (1,207,536) (604,204) (239,767) (314,151) (12,719)
Load Shaping LLH (MWh) B) 110,924 96,628 371,746 638,757 438,067 143,607 226,717 (376,647) (182,119) 283,752 126,014 162,515
Load Shaping HLH Rate ($/MWh) C) 27.86$ 28.56$ 29.22$ 30.02$ 29.65$ 25.38$ 24.36$ 22.10$ 23.15$ 27.43$ 30.30$ 31.75$
Load Shaping LLH Rate ($/MWh) D) 23.75$ 24.48$ 24.82$ 25.03$ 24.68$ 22.07$ 21.04$ 17.53$ 17.11$ 21.58$ 24.41$ 25.70$
Load Shaping Revenue (A * C) + (B * D) (3,371,004)$ (6,226,007)$ 13,503,053$ 28,568,839$ 22,614,424$ 3,605,526$ 6,385,285$ (33,289,170)$ (17,103,369)$ (453,441)$ (6,442,788)$ 3,772,795$ 11,564,144$
Demand (kW) E) 285,874 265,044 632,612 516,843 324,874 543,772 368,143 345,184 384,980 348,539 499,957 390,295
Demand Rate ($/kW-mo.) F) 10.02$ 10.27$ 10.51$ 10.79$ 10.66$ 9.13$ 8.76$ 7.95$ 8.33$ 9.87$ 10.90$ 11.42$
Demand Revenue (E * F) 2,864,455$ 2,722,000$ 6,648,752$ 5,576,732$ 3,463,160$ 4,964,634$ 3,224,930$ 2,744,211$ 3,206,884$ 3,440,078$ 5,449,535$ 4,457,170$ 48,762,542$
Ties to Table 4.2, Revenue at Proposed Rates, lines 6-7
Table 4.4 – Load Shaping and Demand revenue – FY 2016-2017
Table shows calculation of CHWM revenues at proposed rates.
BP-16-FS-BPA-01A Page 142
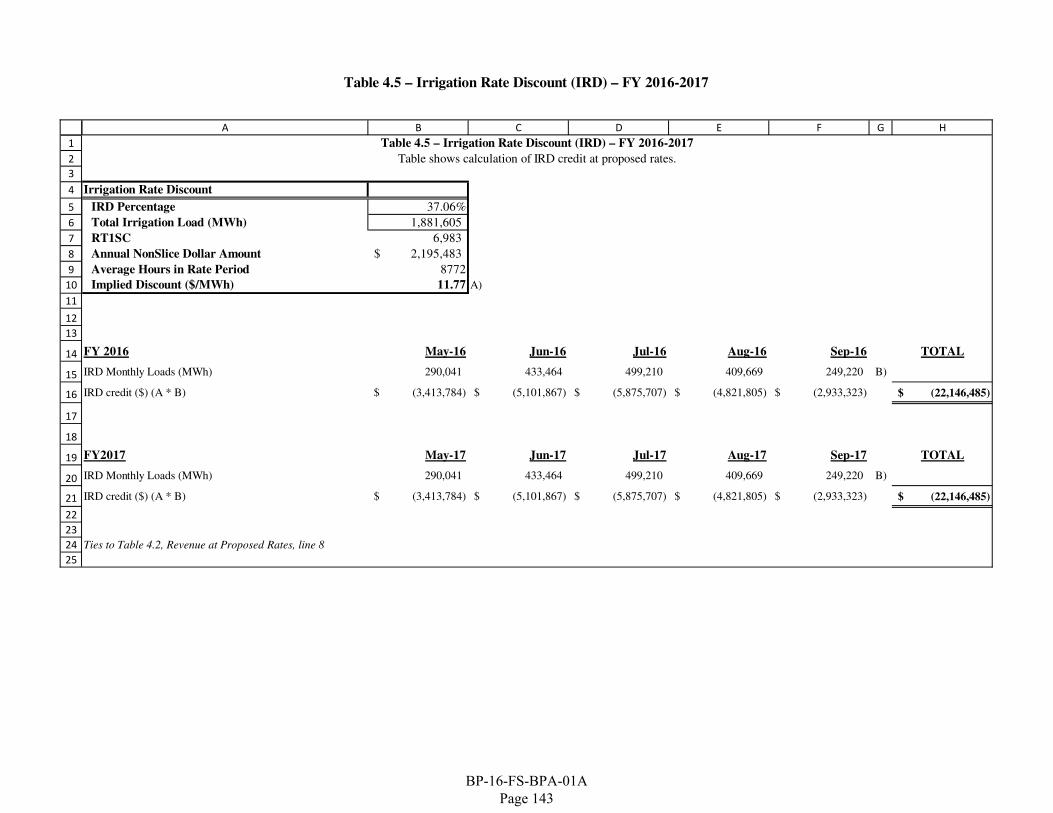
Table 4.5 – Irrigation Rate Discount (IRD) – FY 2016-2017
1
2
3
4
5
6
7
8
9
10
11
12
13
14
15
16
17
18
19
20
21
22
23
24
25
A B C D E F G H
Irrigation Rate Discount
IRD Percentage 37.06%
Total Irrigation Load (MWh) 1,881,605
RT1SC 6,983
Annual NonSlice Dollar Amount 2,195,483$
Average Hours in Rate Period 8772
Implied Discount ($/MWh) 11.77 A)
FY 2016 May-16 Jun-16 Jul-16 Aug-16 Sep-16 TOTAL
IRD Monthly Loads (MWh) 290,041 433,464 499,210 409,669 249,220 B)
IRD credit ($) (A * B) (3,413,784)$ (5,101,867)$ (5,875,707)$ (4,821,805)$ (2,933,323)$ (22,146,485)$
FY2017 May-17 Jun-17 Jul-17 Aug-17 Sep-17 TOTAL
IRD Monthly Loads (MWh) 290,041 433,464 499,210 409,669 249,220 B)
IRD credit ($) (A * B) (3,413,784)$ (5,101,867)$ (5,875,707)$ (4,821,805)$ (2,933,323)$ (22,146,485)$
Ties to Table 4.2, Revenue at Proposed Rates, line 8
Table 4.5 – Irrigation Rate Discount (IRD) – FY 2016-2017
Table shows calculation of IRD credit at proposed rates.
BP-16-FS-BPA-01A Page 143
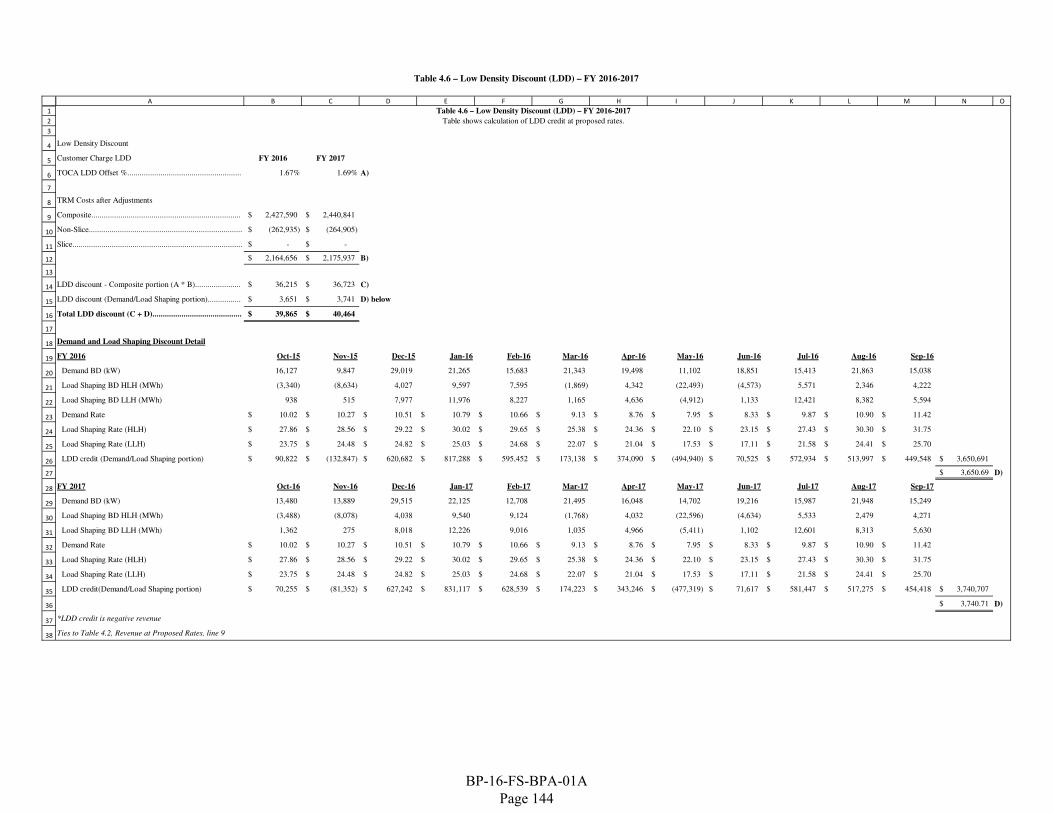
Table 4.6 – Low Density Discount (LDD) – FY 2016-2017
1
2
3
4
5
6
7
8
9
10
11
12
13
14
15
16
17
18
19
20
21
22
23
24
25
26
27
28
29
30
31
32
33
34
35
36
37
38
A B C D E F G H I J K L M N O
Low Density Discount
Customer Charge LDD FY 2016 FY 2017
TOCA LDD Offset %....................................................... 1.67% 1.69% A)
TRM Costs after Adjustments
Composite........................................................................ 2,427,590$ 2,440,841$
Non-Slice.......................................................................... (262,935)$ (264,905)$
Slice.................................................................................. -$ -$
2,164,656$ 2,175,937$ B)
LDD discount - Composite portion (A * B)...................... 36,215$ 36,723$ C)
LDD discount (Demand/Load Shaping portion)................ 3,651$ 3,741$ D) below
Total LDD discount (C + D)........................................... 39,865$ 40,464$
Demand and Load Shaping Discount Detail
FY 2016 Oct-15 Nov-15 Dec-15 Jan-16 Feb-16 Mar-16 Apr-16 May-16 Jun-16 Jul-16 Aug-16 Sep-16
Demand BD (kW) 16,127 9,847 29,019 21,265 15,683 21,343 19,498 11,102 18,851 15,413 21,863 15,038
Load Shaping BD HLH (MWh) (3,340) (8,634) 4,027 9,597 7,595 (1,869) 4,342 (22,493) (4,573) 5,571 2,346 4,222
Load Shaping BD LLH (MWh) 938 515 7,977 11,976 8,227 1,165 4,636 (4,912) 1,133 12,421 8,382 5,594
Demand Rate 10.02$ 10.27$ 10.51$ 10.79$ 10.66$ 9.13$ 8.76$ 7.95$ 8.33$ 9.87$ 10.90$ 11.42$
Load Shaping Rate (HLH) 27.86$ 28.56$ 29.22$ 30.02$ 29.65$ 25.38$ 24.36$ 22.10$ 23.15$ 27.43$ 30.30$ 31.75$
Load Shaping Rate (LLH) 23.75$ 24.48$ 24.82$ 25.03$ 24.68$ 22.07$ 21.04$ 17.53$ 17.11$ 21.58$ 24.41$ 25.70$
LDD credit (Demand/Load Shaping portion) 90,822$ (132,847)$ 620,682$ 817,288$ 595,452$ 173,138$ 374,090$ (494,940)$ 70,525$ 572,934$ 513,997$ 449,548$ 3,650,691$
3,650.69$ D)
FY 2017 Oct-16 Nov-16 Dec-16 Jan-17 Feb-17 Mar-17 Apr-17 May-17 Jun-17 Jul-17 Aug-17 Sep-17
Demand BD (kW) 13,480 13,889 29,515 22,125 12,708 21,495 16,048 14,702 19,216 15,987 21,948 15,249
Load Shaping BD HLH (MWh) (3,488) (8,078) 4,038 9,540 9,124 (1,768) 4,032 (22,596) (4,634) 5,533 2,479 4,271
Load Shaping BD LLH (MWh) 1,362 275 8,018 12,226 9,016 1,035 4,966 (5,411) 1,102 12,601 8,313 5,630
Demand Rate 10.02$ 10.27$ 10.51$ 10.79$ 10.66$ 9.13$ 8.76$ 7.95$ 8.33$ 9.87$ 10.90$ 11.42$
Load Shaping Rate (HLH) 27.86$ 28.56$ 29.22$ 30.02$ 29.65$ 25.38$ 24.36$ 22.10$ 23.15$ 27.43$ 30.30$ 31.75$
Load Shaping Rate (LLH) 23.75$ 24.48$ 24.82$ 25.03$ 24.68$ 22.07$ 21.04$ 17.53$ 17.11$ 21.58$ 24.41$ 25.70$
LDD credit(Demand/Load Shaping portion) 70,255$ (81,352)$ 627,242$ 831,117$ 628,539$ 174,223$ 343,246$ (477,319)$ 71,617$ 581,447$ 517,275$ 454,418$ 3,740,707$
3,740.71$ D)
*LDD credit is negative revenue
Ties to Table 4.2, Revenue at Proposed Rates, line 9
Table 4.6 – Low Density Discount (LDD) – FY 2016-2017
Table shows calculation of LDD credit at proposed rates.
BP-16-FS-BPA-01A Page 144
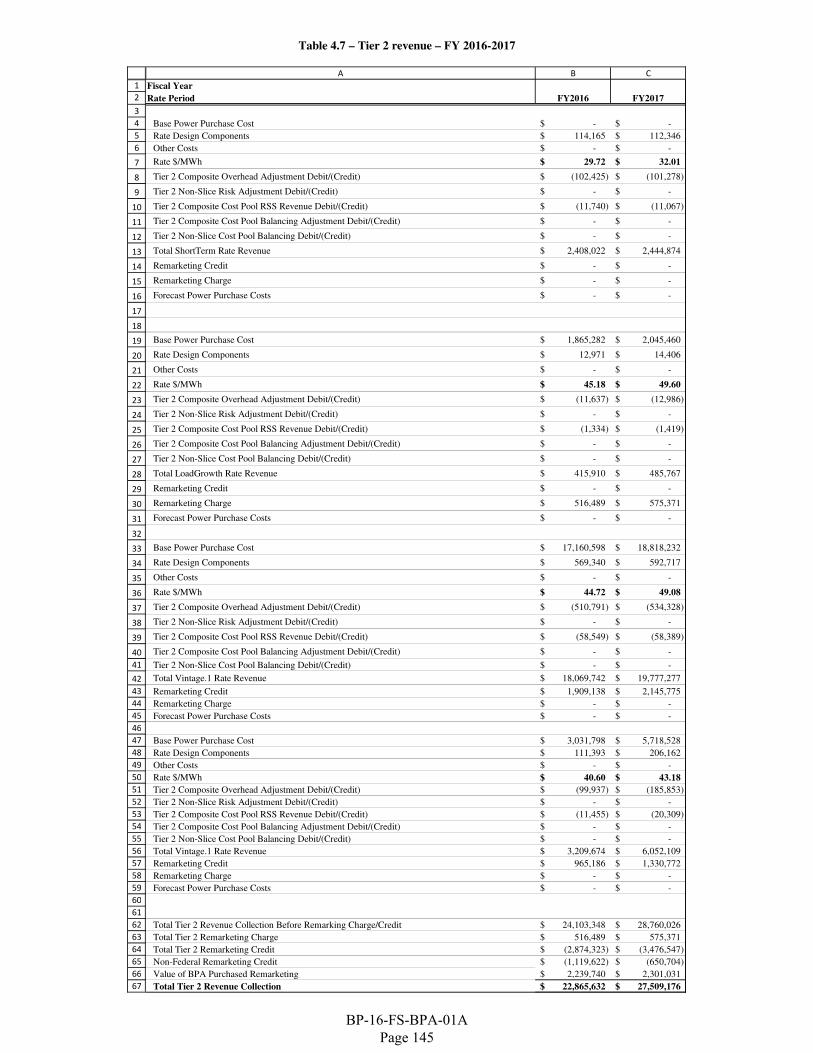
Table 4.7 – Tier 2 revenue – FY 2016-2017
1
2
3
4
5
6
7
8
9
10
11
12
13
14
15
16
17
18
19
20
21
22
23
24
25
26
27
28
29
30
31
32
33
34
35
36
37
38
39
40
41
42
43
44
45
46
47
48
49
50
51
52
53
54
55
56
57
58
59
60
61
62
63
64
65
66
67
A B C
Fiscal Year
Rate Period FY2016 FY2017
Base Power Purchase Cost -$ -$
Rate Design Components 114,165$ 112,346$
Other Costs -$ -$
Rate $/MWh 29.72$ 32.01$
Tier 2 Composite Overhead Adjustment Debit/(Credit) (102,425)$ (101,278)$
Tier 2 Non-Slice Risk Adjustment Debit/(Credit) -$ -$
Tier 2 Composite Cost Pool RSS Revenue Debit/(Credit) (11,740)$ (11,067)$
Tier 2 Composite Cost Pool Balancing Adjustment Debit/(Credit) -$ -$
Tier 2 Non-Slice Cost Pool Balancing Debit/(Credit) -$ -$
Total ShortTerm Rate Revenue 2,408,022$ 2,444,874$
Remarketing Credit -$ -$
Remarketing Charge -$ -$
Forecast Power Purchase Costs -$ -$
Base Power Purchase Cost 1,865,282$ 2,045,460$
Rate Design Components 12,971$ 14,406$
Other Costs -$ -$
Rate $/MWh 45.18$ 49.60$
Tier 2 Composite Overhead Adjustment Debit/(Credit) (11,637)$ (12,986)$
Tier 2 Non-Slice Risk Adjustment Debit/(Credit) -$ -$
Tier 2 Composite Cost Pool RSS Revenue Debit/(Credit) (1,334)$ (1,419)$
Tier 2 Composite Cost Pool Balancing Adjustment Debit/(Credit) -$ -$
Tier 2 Non-Slice Cost Pool Balancing Debit/(Credit) -$ -$
Total LoadGrowth Rate Revenue 415,910$ 485,767$
Remarketing Credit -$ -$
Remarketing Charge 516,489$ 575,371$
Forecast Power Purchase Costs -$ -$
Base Power Purchase Cost 17,160,598$ 18,818,232$
Rate Design Components 569,340$ 592,717$
Other Costs -$ -$
Rate $/MWh 44.72$ 49.08$
Tier 2 Composite Overhead Adjustment Debit/(Credit) (510,791)$ (534,328)$
Tier 2 Non-Slice Risk Adjustment Debit/(Credit) -$ -$
Tier 2 Composite Cost Pool RSS Revenue Debit/(Credit) (58,549)$ (58,389)$
Tier 2 Composite Cost Pool Balancing Adjustment Debit/(Credit) -$ -$
Tier 2 Non-Slice Cost Pool Balancing Debit/(Credit) -$ -$
Total Vintage.1 Rate Revenue 18,069,742$ 19,777,277$
Remarketing Credit 1,909,138$ 2,145,775$
Remarketing Charge -$ -$
Forecast Power Purchase Costs -$ -$
Base Power Purchase Cost 3,031,798$ 5,718,528$
Rate Design Components 111,393$ 206,162$
Other Costs -$ -$
Rate $/MWh 40.60$ 43.18$
Tier 2 Composite Overhead Adjustment Debit/(Credit) (99,937)$ (185,853)$
Tier 2 Non-Slice Risk Adjustment Debit/(Credit) -$ -$
Tier 2 Composite Cost Pool RSS Revenue Debit/(Credit) (11,455)$ (20,309)$
Tier 2 Composite Cost Pool Balancing Adjustment Debit/(Credit) -$ -$
Tier 2 Non-Slice Cost Pool Balancing Debit/(Credit) -$ -$
Total Vintage.1 Rate Revenue 3,209,674$ 6,052,109$
Remarketing Credit 965,186$ 1,330,772$
Remarketing Charge -$ -$
Forecast Power Purchase Costs -$ -$
Total Tier 2 Revenue Collection Before Remarking Charge/Credit 24,103,348$ 28,760,026$
Total Tier 2 Remarketing Charge 516,489$ 575,371$
Total Tier 2 Remarketing Credit (2,874,323)$ (3,476,547)$
Non-Federal Remarketing Credit (1,119,622)$ (650,704)$
Value of BPA Purchased Remarketing 2,239,740$ 2,301,031$
Total Tier 2 Revenue Collection 22,865,632$ 27,509,176$
BP-16-FS-BPA-01A Page 145
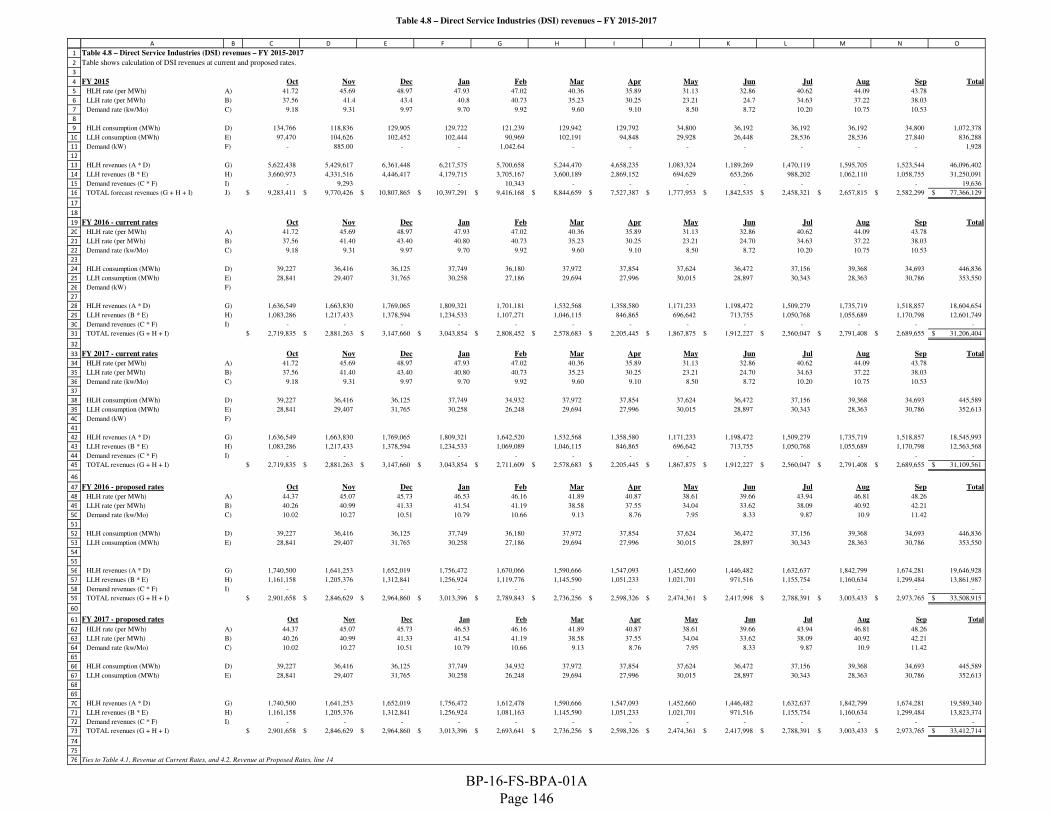
Table 4.8 – Direct Service Industries (DSI) revenues – FY 2015-2017
1
2
3
4
5
6
7
8
9
10
11
12
13
14
15
16
17
18
19
20
21
22
23
24
25
26
27
28
29
30
31
32
33
34
35
36
37
38
39
40
41
42
43
44
45
46
47
48
49
50
51
52
53
54
55
56
57
58
59
60
61
62
63
64
65
66
67
68
69
70
71
72
73
74
75
76
A B C D E F G H I J K L M N O
Table 4.8 – Direct Service Industries (DSI) revenues – FY 2015-2017
Table shows calculation of DSI revenues at current and proposed rates.
FY 2015 Oct Nov Dec Jan Feb Mar Apr May Jun Jul Aug Sep Total
HLH rate (per MWh) A) 41.72 45.69 48.97 47.93 47.02 40.36 35.89 31.13 32.86 40.62 44.09 43.78
LLH rate (per MWh) B) 37.56 41.4 43.4 40.8 40.73 35.23 30.25 23.21 24.7 34.63 37.22 38.03
Demand rate (kw/Mo) C) 9.18 9.31 9.97 9.70 9.92 9.60 9.10 8.50 8.72 10.20 10.75 10.53
HLH consumption (MWh) D) 134,766 118,836 129,905 129,722 121,239 129,942 129,792 34,800 36,192 36,192 36,192 34,800 1,072,378
LLH consumption (MWh) E) 97,470 104,626 102,452 102,444 90,969 102,191 94,848 29,928 26,448 28,536 28,536 27,840 836,288
Demand (kW) F) - 885.00 - - 1,042.64 - - - - - - - 1,928
HLH revenues (A * D) G) 5,622,438 5,429,617 6,361,448 6,217,575 5,700,658 5,244,470 4,658,235 1,083,324 1,189,269 1,470,119 1,595,705 1,523,544 46,096,402
LLH revenues (B * E) H) 3,660,973 4,331,516 4,446,417 4,179,715 3,705,167 3,600,189 2,869,152 694,629 653,266 988,202 1,062,110 1,058,755 31,250,091
Demand revenues (C * F) I) - 9,293 - 10,343 - - - - - - - 19,636
TOTAL forecast revenues (G + H + I) J) 9,283,411$ 9,770,426$ 10,807,865$ 10,397,291$ 9,416,168$ 8,844,659$ 7,527,387$ 1,777,953$ 1,842,535$ 2,458,321$ 2,657,815$ 2,582,299$ 77,366,129$
FY 2016 - current rates Oct Nov Dec Jan Feb Mar Apr May Jun Jul Aug Sep Total
HLH rate (per MWh) A) 41.72 45.69 48.97 47.93 47.02 40.36 35.89 31.13 32.86 40.62 44.09 43.78
LLH rate (per MWh) B) 37.56 41.40 43.40 40.80 40.73 35.23 30.25 23.21 24.70 34.63 37.22 38.03
Demand rate (kw/Mo) C) 9.18 9.31 9.97 9.70 9.92 9.60 9.10 8.50 8.72 10.20 10.75 10.53
HLH consumption (MWh) D) 39,227 36,416 36,125 37,749 36,180 37,972 37,854 37,624 36,472 37,156 39,368 34,693 446,836
LLH consumption (MWh) E) 28,841 29,407 31,765 30,258 27,186 29,694 27,996 30,015 28,897 30,343 28,363 30,786 353,550
Demand (kW) F)
HLH revenues (A * D) G) 1,636,549 1,663,830 1,769,065 1,809,321 1,701,181 1,532,568 1,358,580 1,171,233 1,198,472 1,509,279 1,735,719 1,518,857 18,604,654
LLH revenues (B * E) H) 1,083,286 1,217,433 1,378,594 1,234,533 1,107,271 1,046,115 846,865 696,642 713,755 1,050,768 1,055,689 1,170,798 12,601,749
Demand revenues (C * F) I) - - - - - - - - - - - - -
TOTAL revenues (G + H + I) 2,719,835$ 2,881,263$ 3,147,660$ 3,043,854$ 2,808,452$ 2,578,683$ 2,205,445$ 1,867,875$ 1,912,227$ 2,560,047$ 2,791,408$ 2,689,655$ 31,206,404$
FY 2017 - current rates Oct Nov Dec Jan Feb Mar Apr May Jun Jul Aug Sep Total
HLH rate (per MWh) A) 41.72 45.69 48.97 47.93 47.02 40.36 35.89 31.13 32.86 40.62 44.09 43.78
LLH rate (per MWh) B) 37.56 41.40 43.40 40.80 40.73 35.23 30.25 23.21 24.70 34.63 37.22 38.03
Demand rate (kw/Mo) C) 9.18 9.31 9.97 9.70 9.92 9.60 9.10 8.50 8.72 10.20 10.75 10.53
HLH consumption (MWh) D) 39,227 36,416 36,125 37,749 34,932 37,972 37,854 37,624 36,472 37,156 39,368 34,693 445,589
LLH consumption (MWh) E) 28,841 29,407 31,765 30,258 26,248 29,694 27,996 30,015 28,897 30,343 28,363 30,786 352,613
Demand (kW) F)
HLH revenues (A * D) G) 1,636,549 1,663,830 1,769,065 1,809,321 1,642,520 1,532,568 1,358,580 1,171,233 1,198,472 1,509,279 1,735,719 1,518,857 18,545,993
LLH revenues (B * E) H) 1,083,286 1,217,433 1,378,594 1,234,533 1,069,089 1,046,115 846,865 696,642 713,755 1,050,768 1,055,689 1,170,798 12,563,568
Demand revenues (C * F) I) - - - - - - - - - - - - -
TOTAL revenues (G + H + I) 2,719,835$ 2,881,263$ 3,147,660$ 3,043,854$ 2,711,609$ 2,578,683$ 2,205,445$ 1,867,875$ 1,912,227$ 2,560,047$ 2,791,408$ 2,689,655$ 31,109,561$
FY 2016 - proposed rates Oct Nov Dec Jan Feb Mar Apr May Jun Jul Aug Sep Total
HLH rate (per MWh) A) 44.37 45.07 45.73 46.53 46.16 41.89 40.87 38.61 39.66 43.94 46.81 48.26
LLH rate (per MWh) B) 40.26 40.99 41.33 41.54 41.19 38.58 37.55 34.04 33.62 38.09 40.92 42.21
Demand rate (kw/Mo) C) 10.02 10.27 10.51 10.79 10.66 9.13 8.76 7.95 8.33 9.87 10.9 11.42
HLH consumption (MWh) D) 39,227 36,416 36,125 37,749 36,180 37,972 37,854 37,624 36,472 37,156 39,368 34,693 446,836
LLH consumption (MWh) E) 28,841 29,407 31,765 30,258 27,186 29,694 27,996 30,015 28,897 30,343 28,363 30,786 353,550
HLH revenues (A * D) G) 1,740,500 1,641,253 1,652,019 1,756,472 1,670,066 1,590,666 1,547,093 1,452,660 1,446,482 1,632,637 1,842,799 1,674,281 19,646,928
LLH revenues (B * E) H) 1,161,158 1,205,376 1,312,841 1,256,924 1,119,776 1,145,590 1,051,233 1,021,701 971,516 1,155,754 1,160,634 1,299,484 13,861,987
Demand revenues (C * F) I) - - - - - - - - - - - - -
TOTAL revenues (G + H + I) 2,901,658$ 2,846,629$ 2,964,860$ 3,013,396$ 2,789,843$ 2,736,256$ 2,598,326$ 2,474,361$ 2,417,998$ 2,788,391$ 3,003,433$ 2,973,765$ 33,508,915$
FY 2017 - proposed rates Oct Nov Dec Jan Feb Mar Apr May Jun Jul Aug Sep Total
HLH rate (per MWh) A) 44.37 45.07 45.73 46.53 46.16 41.89 40.87 38.61 39.66 43.94 46.81 48.26
LLH rate (per MWh) B) 40.26 40.99 41.33 41.54 41.19 38.58 37.55 34.04 33.62 38.09 40.92 42.21
Demand rate (kw/Mo) C) 10.02 10.27 10.51 10.79 10.66 9.13 8.76 7.95 8.33 9.87 10.9 11.42
HLH consumption (MWh) D) 39,227 36,416 36,125 37,749 34,932 37,972 37,854 37,624 36,472 37,156 39,368 34,693 445,589
LLH consumption (MWh) E) 28,841 29,407 31,765 30,258 26,248 29,694 27,996 30,015 28,897 30,343 28,363 30,786 352,613
HLH revenues (A * D) G) 1,740,500 1,641,253 1,652,019 1,756,472 1,612,478 1,590,666 1,547,093 1,452,660 1,446,482 1,632,637 1,842,799 1,674,281 19,589,340
LLH revenues (B * E) H) 1,161,158 1,205,376 1,312,841 1,256,924 1,081,163 1,145,590 1,051,233 1,021,701 971,516 1,155,754 1,160,634 1,299,484 13,823,374
Demand revenues (C * F) I) - - - - - - - - - - - - -
TOTAL revenues (G + H + I) 2,901,658$ 2,846,629$ 2,964,860$ 3,013,396$ 2,693,641$ 2,736,256$ 2,598,326$ 2,474,361$ 2,417,998$ 2,788,391$ 3,003,433$ 2,973,765$ 33,412,714$
Ties to Table 4.1, Revenue at Current Rates, and 4.2, Revenue at Proposed Rates, line 14
BP-16-FS-BPA-01A Page 146

SECTION 5: RATE SCHEDULES
No Documentation
BP-16-FS-BPA-01A Page 147

This page intentionally left blank
BP-16-FS-BPA-01A Page 148
SECTION 6: GENERAL RATE SCHEDULE PROVISIONS
No Documentation
BP-16-FS-BPA-01A Page 149

This page intentionally left blank
BP-16-FS-BPA-01A Page 150

SECTION 7: SLICE
No Documentation
BP-16-FS-BPA-01A Page 151

This page intentionally left blank
BP-16-FS-BPA-01A Page 152

SECTION 8: AVERAGE SYSTEM COSTS
BP-16-FS-BPA-01A Page 153
Table Descriptions
Table 8.1 IOUs Residential Loads and COUs Forecast Exchange Loads (MWh)
Table lists the monthly two-year average IOU Residential Loads based on actual loads as
submitted by Exchanging Utilities, and the monthly Forecast COU Exchange Loads.
Table 8.2 Forecast Average System Costs (ASCs)
Table lists the Fiscal Year Forecasted ASCs in $/MWh as determined through the ASC review.
BP-16-FS-BPA-01A Page 154
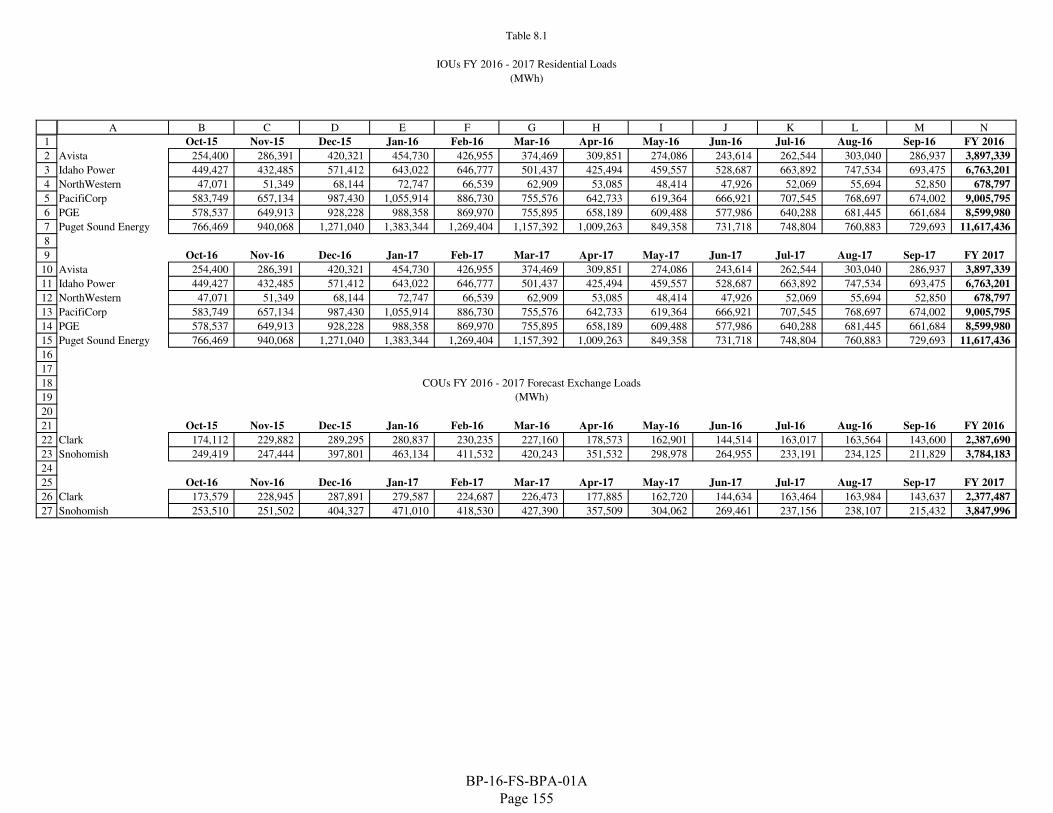
Table 8.1
IOUs FY 2016 - 2017 Residential Loads
(MWh)
1
2
3
4
5
6
7
8
9
10
11
12
13
14
15
16
17
18
19
20
21
22
23
24
25
26
27
A B C D E F G H I J K L M N
Oct-15 Nov-15 Dec-15 Jan-16 Feb-16 Mar-16 Apr-16 May-16 Jun-16 Jul-16 Aug-16 Sep-16 FY 2016
Avista 254,400 286,391 420,321 454,730 426,955 374,469 309,851 274,086 243,614 262,544 303,040 286,937 3,897,339
Idaho Power 449,427 432,485 571,412 643,022 646,777 501,437 425,494 459,557 528,687 663,892 747,534 693,475 6,763,201
NorthWestern 47,071 51,349 68,144 72,747 66,539 62,909 53,085 48,414 47,926 52,069 55,694 52,850 678,797
PacifiCorp 583,749 657,134 987,430 1,055,914 886,730 755,576 642,733 619,364 666,921 707,545 768,697 674,002 9,005,795
PGE 578,537 649,913 928,228 988,358 869,970 755,895 658,189 609,488 577,986 640,288 681,445 661,684 8,599,980
Puget Sound Energy 766,469 940,068 1,271,040 1,383,344 1,269,404 1,157,392 1,009,263 849,358 731,718 748,804 760,883 729,693 11,617,436
Oct-16 Nov-16 Dec-16 Jan-17 Feb-17 Mar-17 Apr-17 May-17 Jun-17 Jul-17 Aug-17 Sep-17 FY 2017
Avista 254,400 286,391 420,321 454,730 426,955 374,469 309,851 274,086 243,614 262,544 303,040 286,937 3,897,339
Idaho Power 449,427 432,485 571,412 643,022 646,777 501,437 425,494 459,557 528,687 663,892 747,534 693,475 6,763,201
NorthWestern 47,071 51,349 68,144 72,747 66,539 62,909 53,085 48,414 47,926 52,069 55,694 52,850 678,797
PacifiCorp 583,749 657,134 987,430 1,055,914 886,730 755,576 642,733 619,364 666,921 707,545 768,697 674,002 9,005,795
PGE 578,537 649,913 928,228 988,358 869,970 755,895 658,189 609,488 577,986 640,288 681,445 661,684 8,599,980
Puget Sound Energy 766,469 940,068 1,271,040 1,383,344 1,269,404 1,157,392 1,009,263 849,358 731,718 748,804 760,883 729,693 11,617,436
Oct-15 Nov-15 Dec-15 Jan-16 Feb-16 Mar-16 Apr-16 May-16 Jun-16 Jul-16 Aug-16 Sep-16 FY 2016
Clark 174,112 229,882 289,295 280,837 230,235 227,160 178,573 162,901 144,514 163,017 163,564 143,600 2,387,690
Snohomish 249,419 247,444 397,801 463,134 411,532 420,243 351,532 298,978 264,955 233,191 234,125 211,829 3,784,183
Oct-16 Nov-16 Dec-16 Jan-17 Feb-17 Mar-17 Apr-17 May-17 Jun-17 Jul-17 Aug-17 Sep-17 FY 2017
Clark 173,579 228,945 287,891 279,587 224,687 226,473 177,885 162,720 144,634 163,464 163,984 143,637 2,377,487
Snohomish 253,510 251,502 404,327 471,010 418,530 427,390 357,509 304,062 269,461 237,156 238,107 215,432 3,847,996
COUs FY 2016 - 2017 Forecast Exchange Loads
(MWh)
BP-16-FS-BPA-01A Page 155
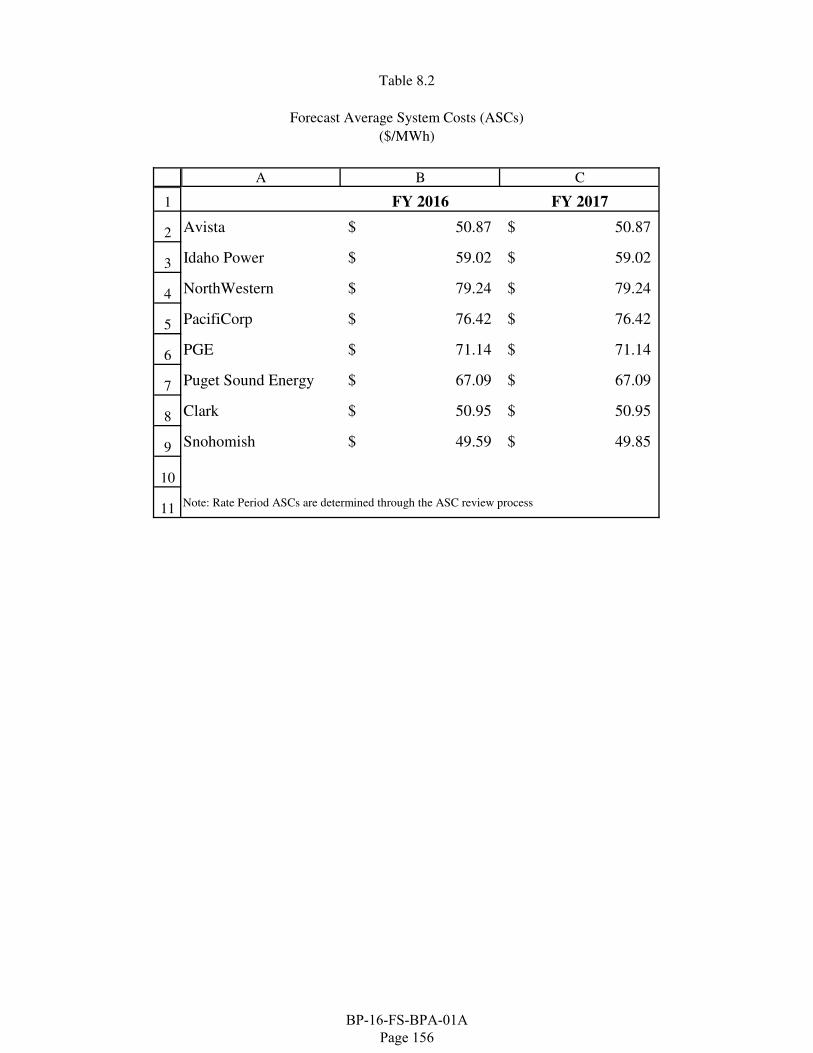
Table 8.2
Forecast Average System Costs (ASCs)
($/MWh)
1
2
3
4
5
6
7
8
9
10
11
A B C
FY 2016 FY 2017
Avista 50.87$ 50.87$
Idaho Power 59.02$ 59.02$
NorthWestern 79.24$ 79.24$
PacifiCorp 76.42$ 76.42$
PGE 71.14$ 71.14$
Puget Sound Energy 67.09$ 67.09$
Clark 50.95$ 50.95$
Snohomish 49.59$ 49.85$
Note: Rate Period ASCs are determined through the ASC review process
BP-16-FS-BPA-01A Page 156

BONNEVILLE POW ER ADMINISTRATION July 2015