Embed Size (px)
Citation preview
Power System Network Model / Application Maintenance
Cuong M. Tang, [email protected]
© San Diego Gas & Electric 2013 1
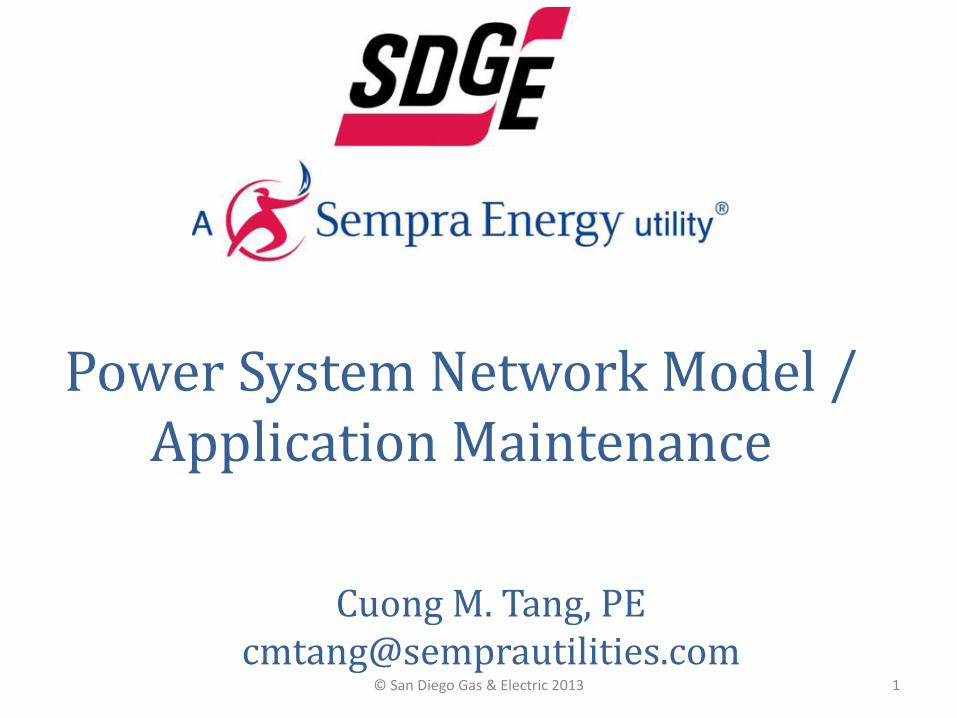
Maintenance Background…
• Southern California Edison– 50,000 mi2 service territory– 14 million + people– Peak Load 20,000+ MW
• Network Model– 1600+ Buses– 30000+ Breakers/Disconnects– 2000+ Lines– 1700+ Loads– 700+ Transformers– 250+ Generators– 500+ Shunts/Reactors
© San Diego Gas & Electric 2013 2
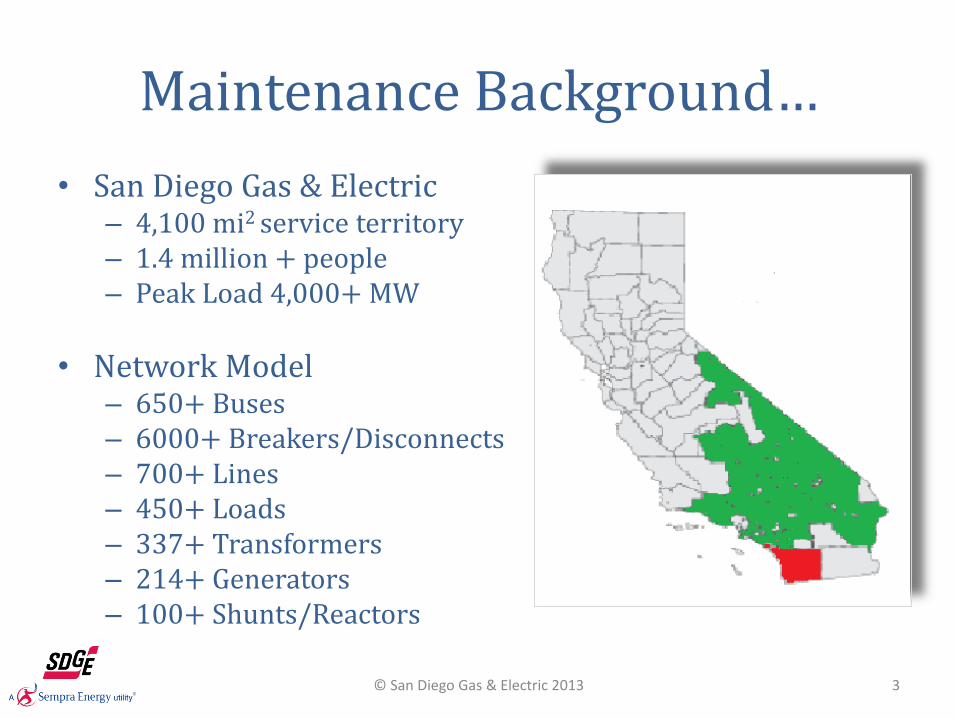
Maintenance Background…
• San Diego Gas & Electric– 4,100 mi2 service territory– 1.4 million + people– Peak Load 4,000+ MW
• Network Model– 650+ Buses– 6000+ Breakers/Disconnects– 700+ Lines– 450+ Loads– 337+ Transformers– 214+ Generators– 100+ Shunts/Reactors
© San Diego Gas & Electric 2013 3
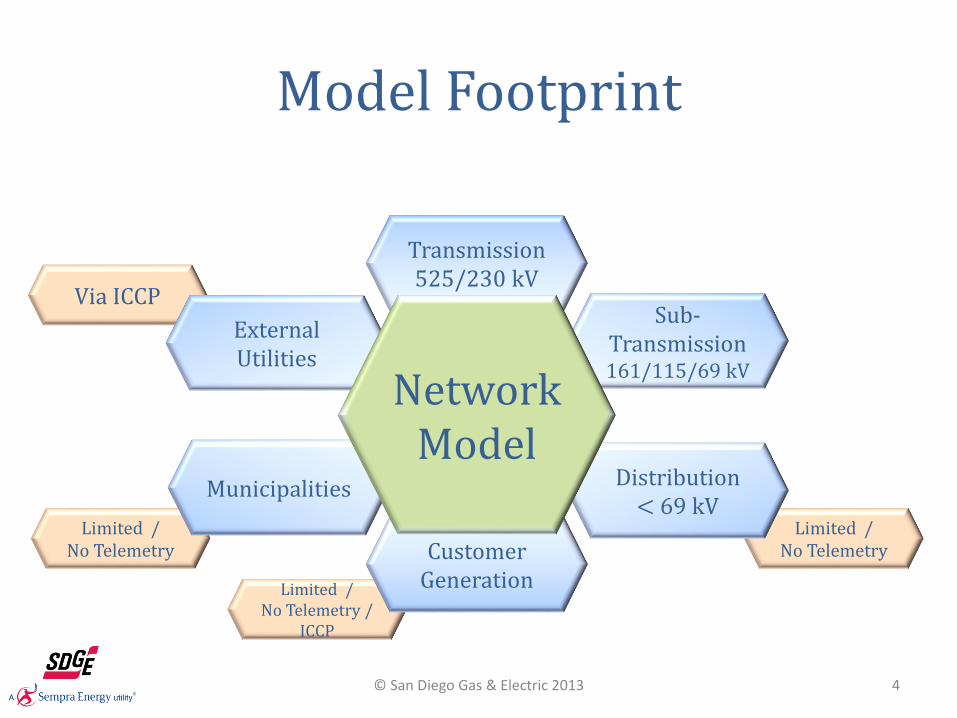
Limited / No Telemetry /
ICCP
Limited / No Telemetry
Limited / No Telemetry
Sub-Transmission161/115/69 kV
Municipalities Distribution < 69 kV
Model Footprint
Customer Generation
Transmission525/230 kV
Via ICCP
External Utilities
Network Model
© San Diego Gas & Electric 2013 4
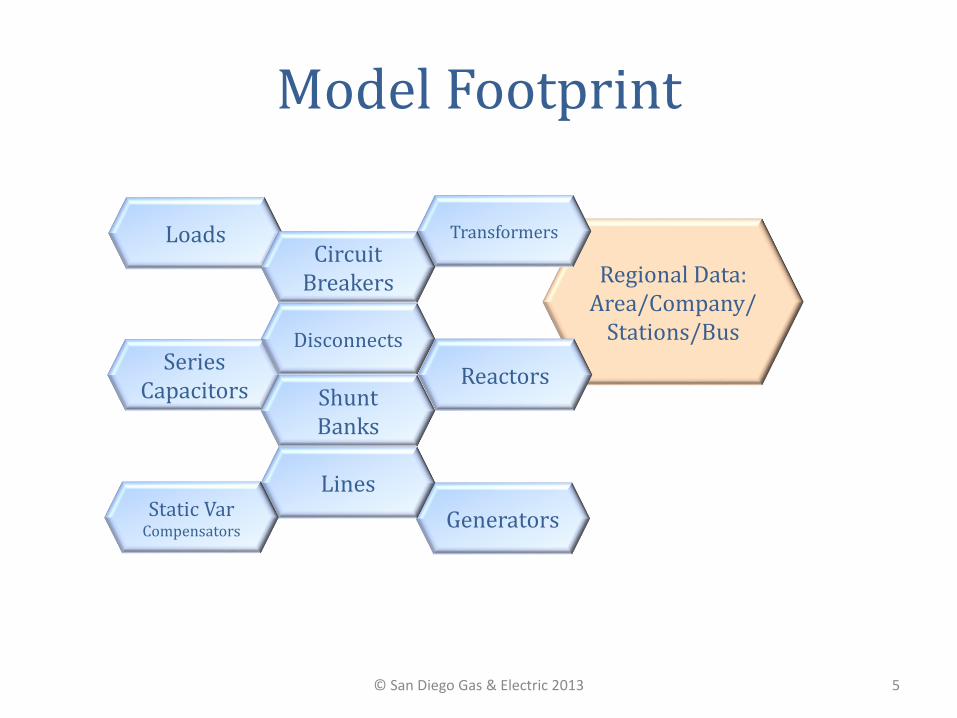
Regional Data:Area/Company/
Stations/Bus
Model Footprint
TransformersLoadsCircuit
Breakers
Series Capacitors
Disconnects
Generators
Shunt Banks
Lines
Reactors
Static Var Compensators
© San Diego Gas & Electric 2013 5
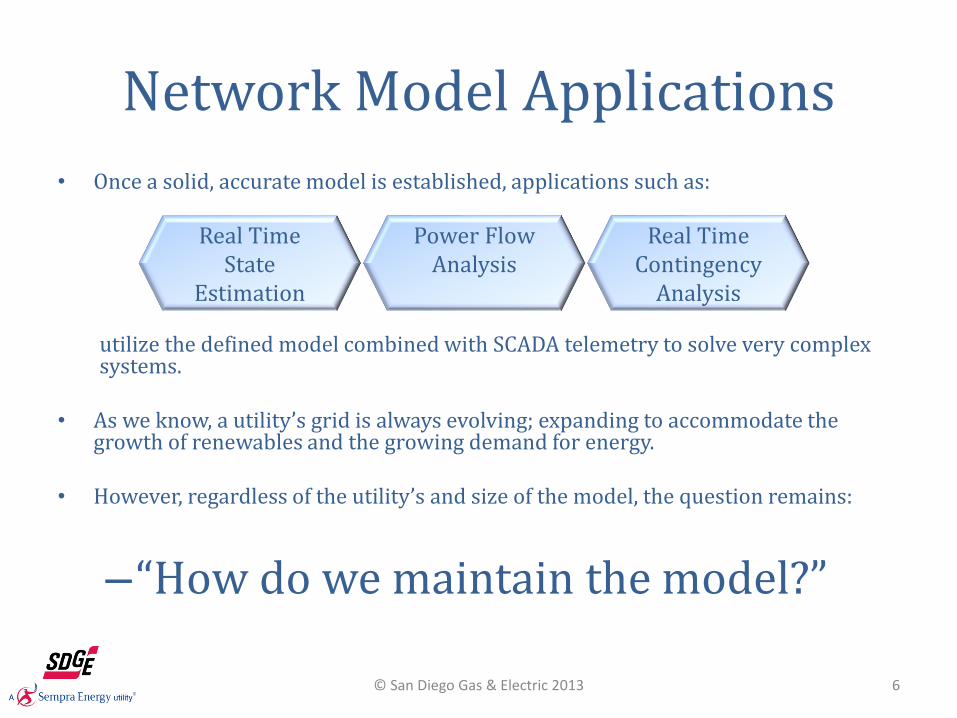
Network Model Applications
• Once a solid, accurate model is established, applications such as:
utilize the defined model combined with SCADA telemetry to solve very complex systems.
• As we know, a utility’s grid is always evolving; expanding to accommodate the growth of renewables and the growing demand for energy.
• However, regardless of the utility’s and size of the model, the question remains:
–“How do we maintain the model?”
Real Time Contingency
Analysis
Power FlowAnalysis
Real Time State
Estimation
© San Diego Gas & Electric 2013 6
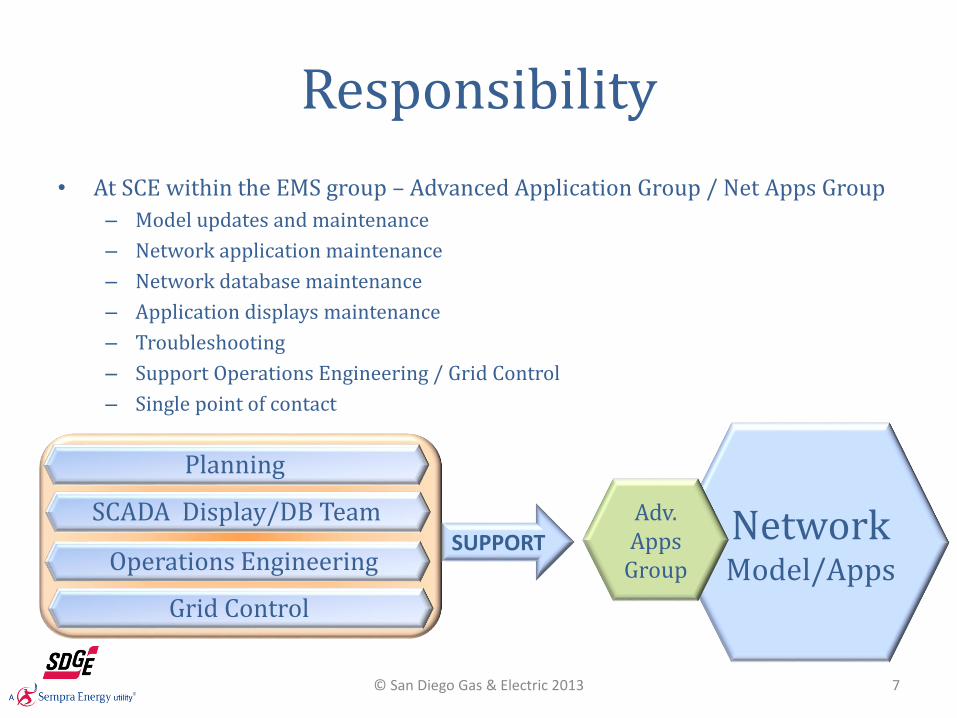
• At SCE within the EMS group – Advanced Application Group / Net Apps Group
– Model updates and maintenance
– Network application maintenance
– Network database maintenance
– Application displays maintenance
– Troubleshooting
– Support Operations Engineering / Grid Control
– Single point of contact
SUPPORT
Responsibility
Network Model/Apps
Planning
Operations Engineering
Grid Control
Adv. Apps
Group
SCADA Display/DB Team
© San Diego Gas & Electric 2013 7
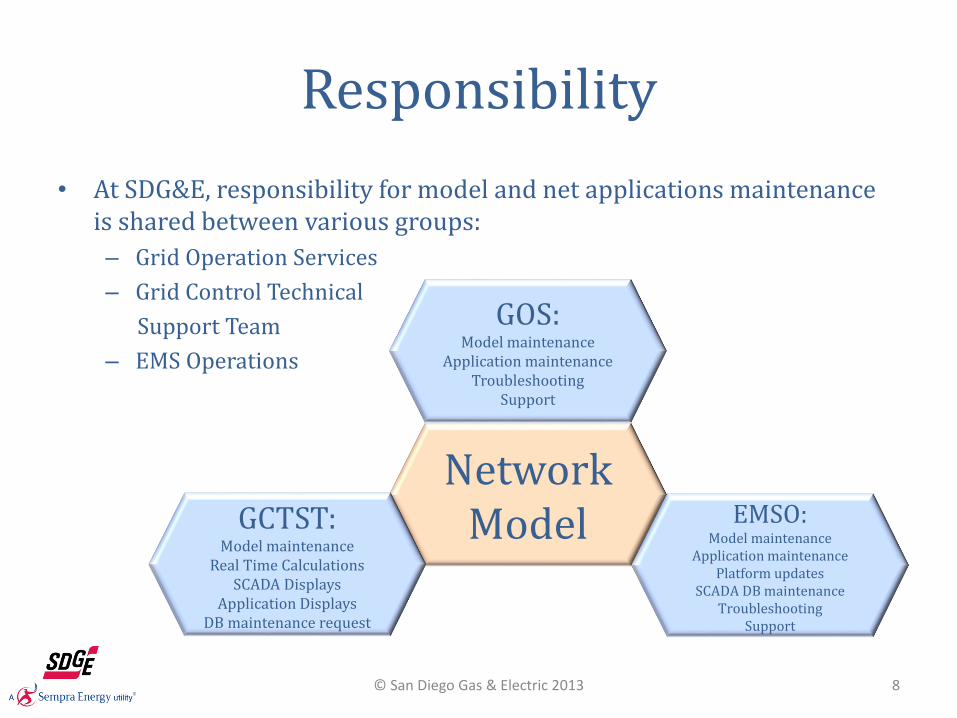
• At SDG&E, responsibility for model and net applications maintenance is shared between various groups:
– Grid Operation Services
– Grid Control Technical
Support Team
– EMS Operations
Network Model EMSO:
Model maintenanceApplication maintenance
Platform updatesSCADA DB maintenance
TroubleshootingSupport
GCTST:Model maintenance
Real Time CalculationsSCADA Displays
Application DisplaysDB maintenance request
GOS:Model maintenance
Application maintenanceTroubleshooting
Support
Responsibility
© San Diego Gas & Electric 2013 8
Responsibility
• Regardless of how your company maintenance process is structured it is important to remember that support is needed by the various groups:
• Planning• Operation Engineering• SCADA Team• Grid Operations• Network Team
• It is best practice to have one entity, person or group, be responsible for the model and net apps as a primary function.
© San Diego Gas & Electric 2013 9
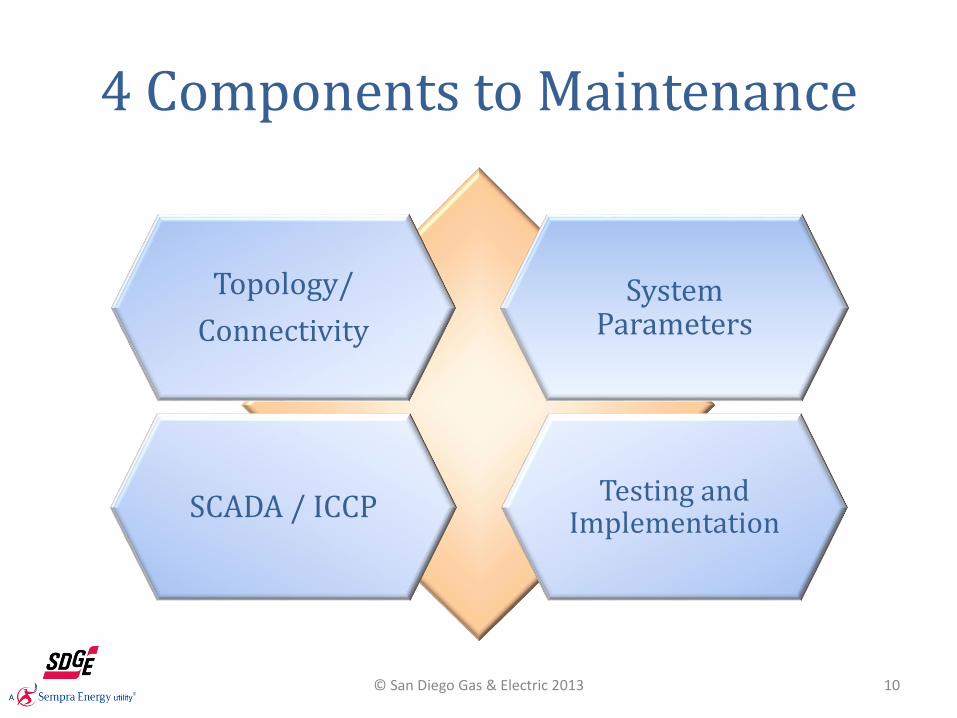
4 Components to Maintenance
Topology/
Connectivity
System Parameters
SCADA / ICCPTesting and
Implementation
© San Diego Gas & Electric 2013 10

Topology/Connectivity
• Substation reconfigurations• Branch reconfigurations• New equipment
– Internal Area• Work is typically scheduled with advance notification.
– External Area• No visibility on configuration changes• Unless notified, configuration changes are “stumbled”
upon.
© San Diego Gas & Electric 2013 11
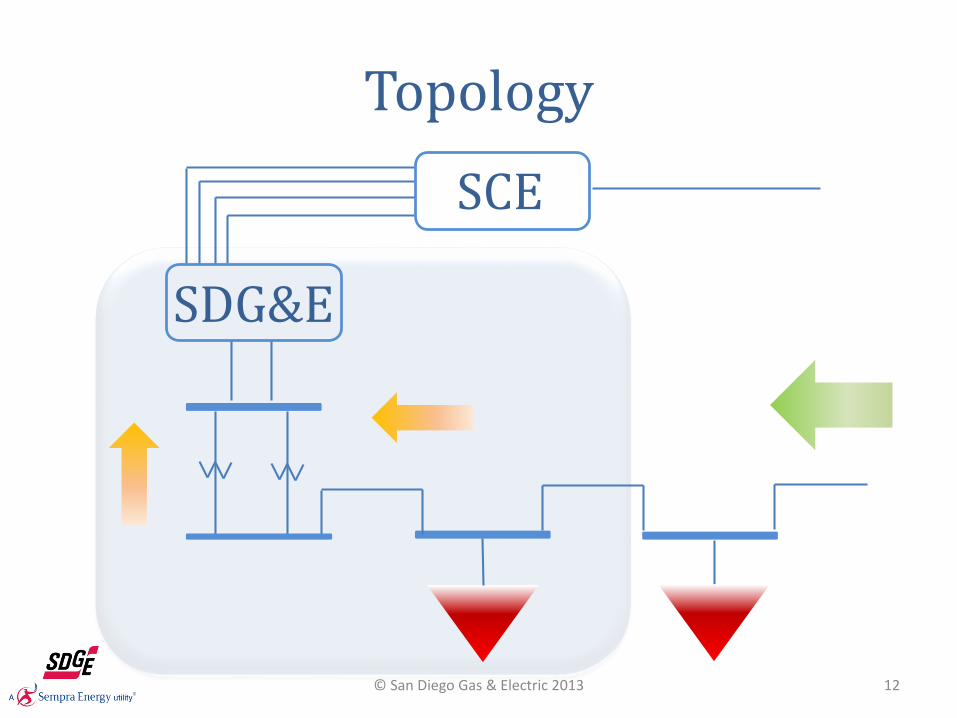
SDG&E
Topology
SCE
© San Diego Gas & Electric 2013 12
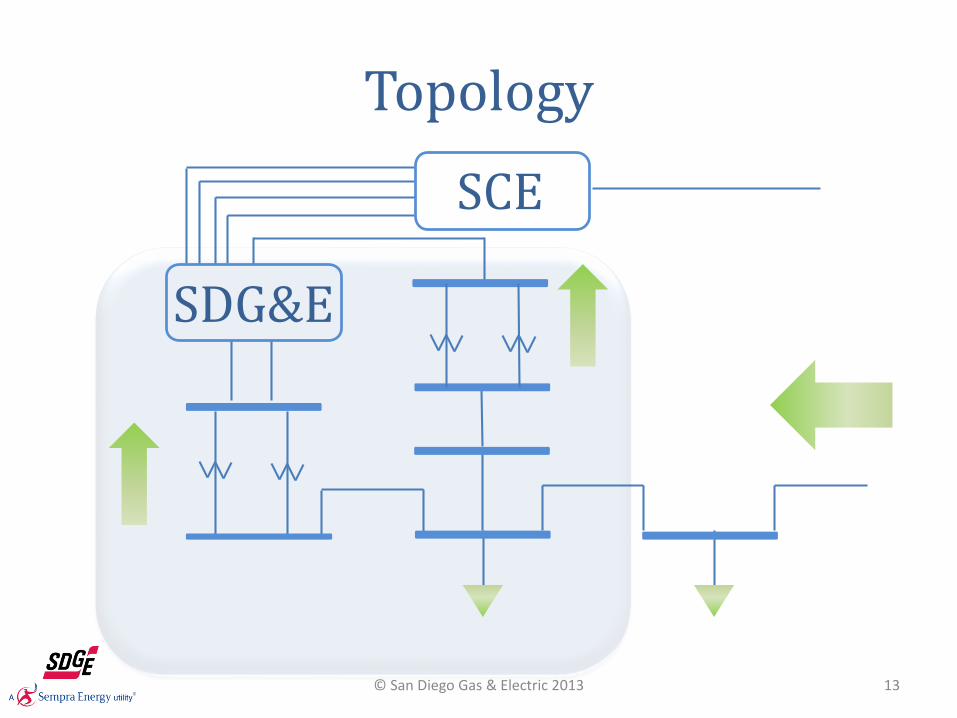
Topology
SDG&E
SCE
© San Diego Gas & Electric 2013 13
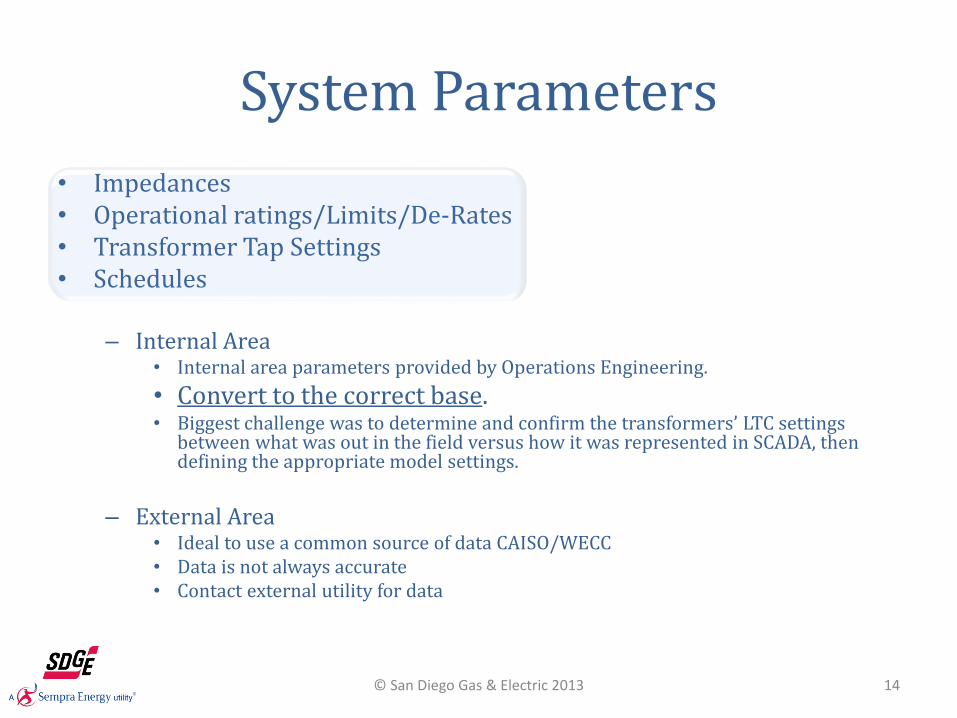
System Parameters
• Impedances• Operational ratings/Limits/De-Rates• Transformer Tap Settings• Schedules
– Internal Area • Internal area parameters provided by Operations Engineering.
• Convert to the correct base.• Biggest challenge was to determine and confirm the transformers’ LTC settings
between what was out in the field versus how it was represented in SCADA, then defining the appropriate model settings.
– External Area• Ideal to use a common source of data CAISO/WECC• Data is not always accurate• Contact external utility for data
© San Diego Gas & Electric 2013 14

System Parameters
– Tap Settings:• How are the tap settings defined in the EMS?
– 8L-8R
– 16L-16R
– 1-17
– 1-33
– Transformer nominal voltages versus base voltages.• 525/220 kV vs. 500/230 kV.
• Will affect tap step sizing.
16L15L14L13L12L11L10L9L8L7L6L5L4L3L2L1LNL
NNR1R2R3R4R5R6R7R8R9R
10R11R12R13R14R15R
16R© San Diego Gas & Electric 2013 15
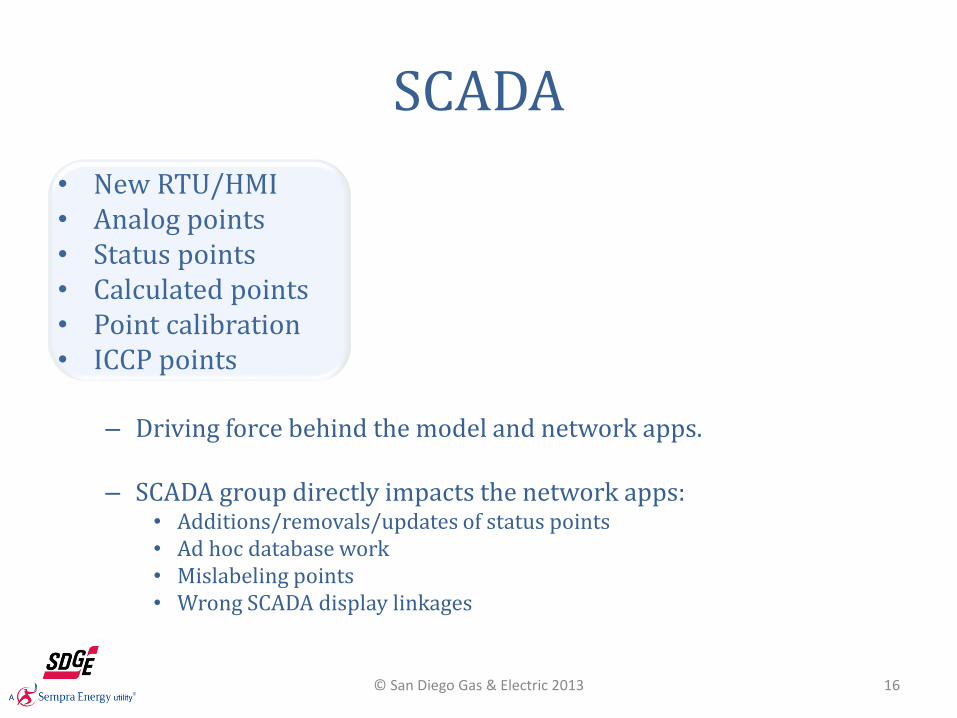
• New RTU/HMI• Analog points• Status points• Calculated points• Point calibration• ICCP points
– Driving force behind the model and network apps.
– SCADA group directly impacts the network apps:• Additions/removals/updates of status points• Ad hoc database work• Mislabeling points• Wrong SCADA display linkages
SCADA
© San Diego Gas & Electric 2013 16

– Several transactions take place before the metered value can be associated to the model:• Adding necessary field equipment.• Configuring the RTU/HMI.• Adding points to SCADA Database.• Linking points to SCADA display.
– Correctly linking points to the SCADA display is extremely important.• Comparison of Substation Drawing versus SCADA display.• Incorrectly linked points may require further investigation/field
confirmation.• Adverse effect especially for state estimation.
– Naming convention• Can aid in determining positioning of CB’s / Disconnects in the substation.
SCADA
© San Diego Gas & Electric 2013 17
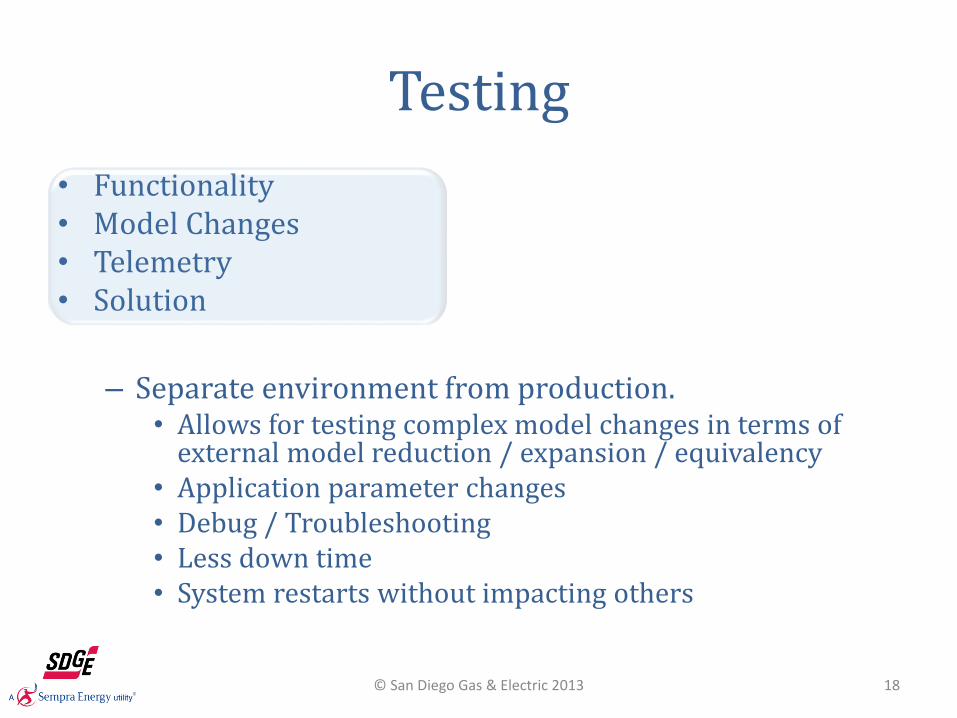
• Functionality• Model Changes • Telemetry • Solution
– Separate environment from production.• Allows for testing complex model changes in terms of
external model reduction / expansion / equivalency• Application parameter changes • Debug / Troubleshooting• Less down time• System restarts without impacting others
Testing
© San Diego Gas & Electric 2013 18

Testing
– Test Environment Challenges:
• Fully functional applications
• Latest SCADA database
• Live data feed
• Quarterly sync with production or as needed
© San Diego Gas & Electric 2013 19

Things to Remember
• The network model is point driven. It has to be implemented in parallel with SCADA or ICCP data implementation or after. Best practice is to make sure the SCADA/ICCP database is finalized, in production, and the points are scanning correctly before proceeding with model updates.
• More detail may yield a better solution but may complicate maintenance. Apply model reduction/equivalency where feasible, especially in areas with little observability.
• Consider the impact of including or excluding the modeling of circuit breaker disconnects. This will impact your solution.
• Take advantage of verification tools provided by vendors, or create your own scripts that check the integrity of the model.
© San Diego Gas & Electric 2013 20
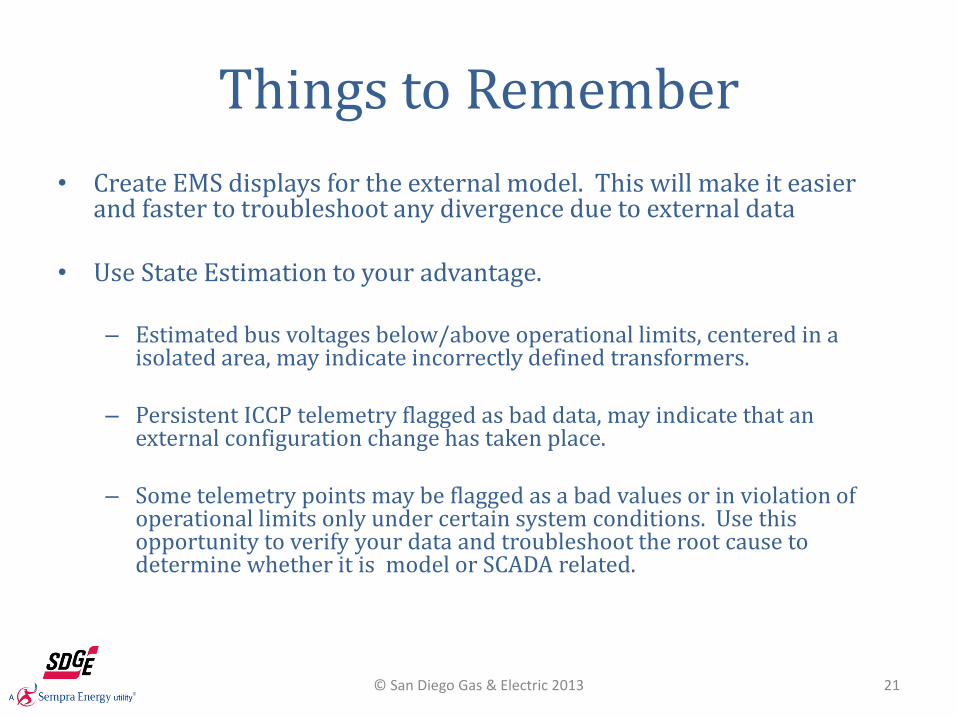
Things to Remember
• Create EMS displays for the external model. This will make it easier and faster to troubleshoot any divergence due to external data
• Use State Estimation to your advantage.
– Estimated bus voltages below/above operational limits, centered in a isolated area, may indicate incorrectly defined transformers.
– Persistent ICCP telemetry flagged as bad data, may indicate that an external configuration change has taken place.
– Some telemetry points may be flagged as a bad values or in violation of operational limits only under certain system conditions. Use this opportunity to verify your data and troubleshoot the root cause to determine whether it is model or SCADA related.
© San Diego Gas & Electric 2013 21

External Model Replacement and Maintenance
Presented by Les Jarriel ([email protected])
Power Software & Consulting Inc.
Power Software & Consulting - Confidential 22
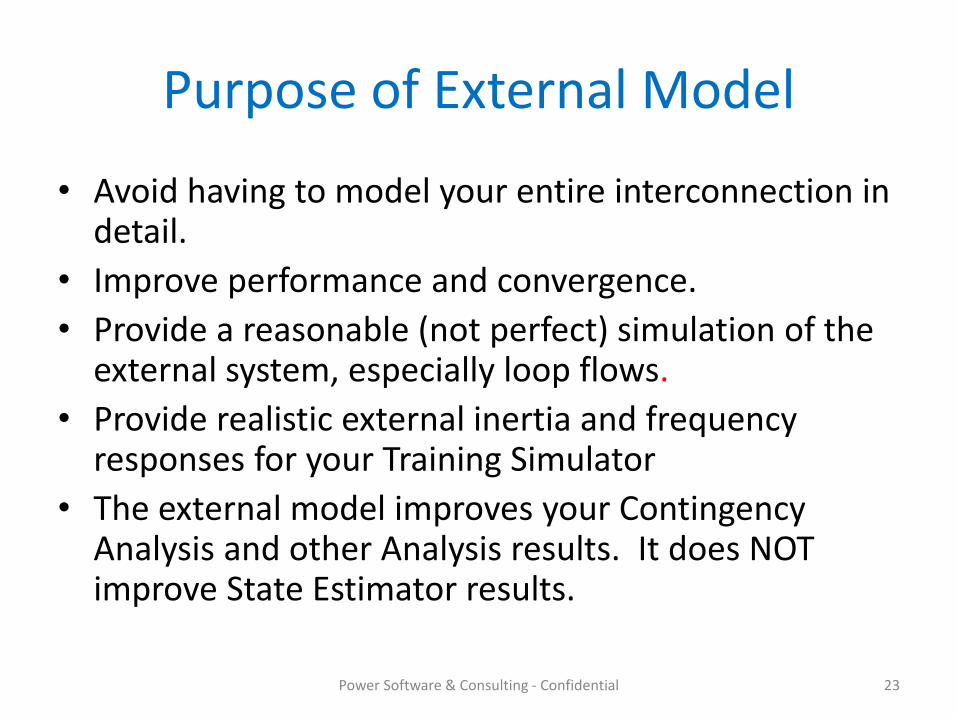
Purpose of External Model
• Avoid having to model your entire interconnection in detail.
• Improve performance and convergence.
• Provide a reasonable (not perfect) simulation of the external system, especially loop flows.
• Provide realistic external inertia and frequency responses for your Training Simulator
• The external model improves your Contingency Analysis and other Analysis results. It does NOT improve State Estimator results.
Power Software & Consulting - Confidential 23

External Model
Power Software & Consulting - Confidential 24
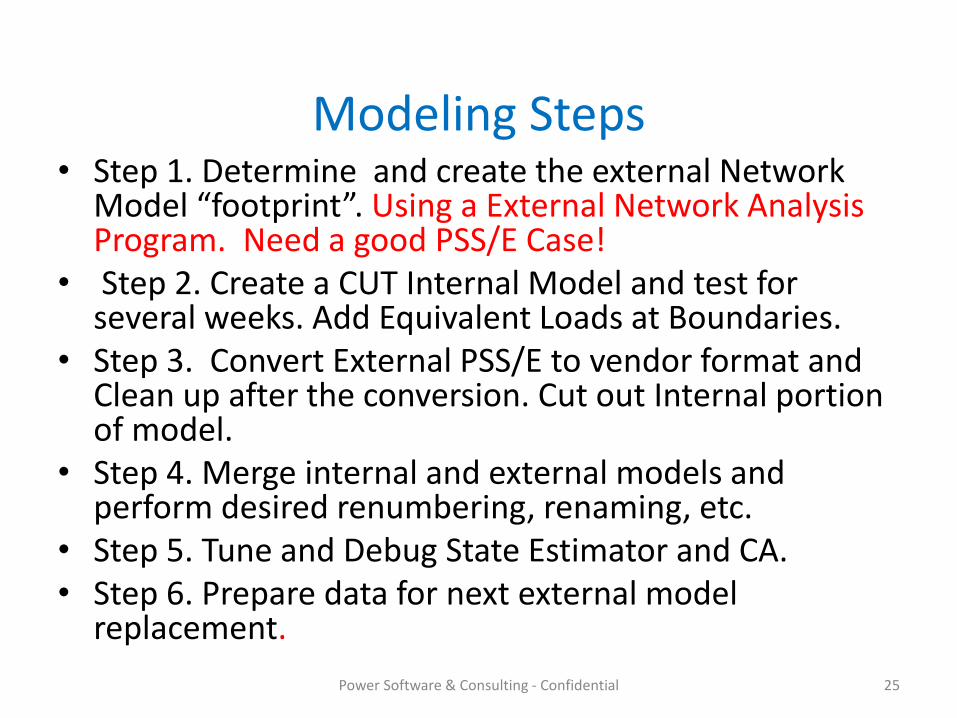
Modeling Steps• Step 1. Determine and create the external Network
Model “footprint”. Using a External Network Analysis Program. Need a good PSS/E Case!
• Step 2. Create a CUT Internal Model and test for several weeks. Add Equivalent Loads at Boundaries.
• Step 3. Convert External PSS/E to vendor format and Clean up after the conversion. Cut out Internal portion of model.
• Step 4. Merge internal and external models and perform desired renumbering, renaming, etc.
• Step 5. Tune and Debug State Estimator and CA. • Step 6. Prepare data for next external model
replacement.
Power Software & Consulting - Confidential 25
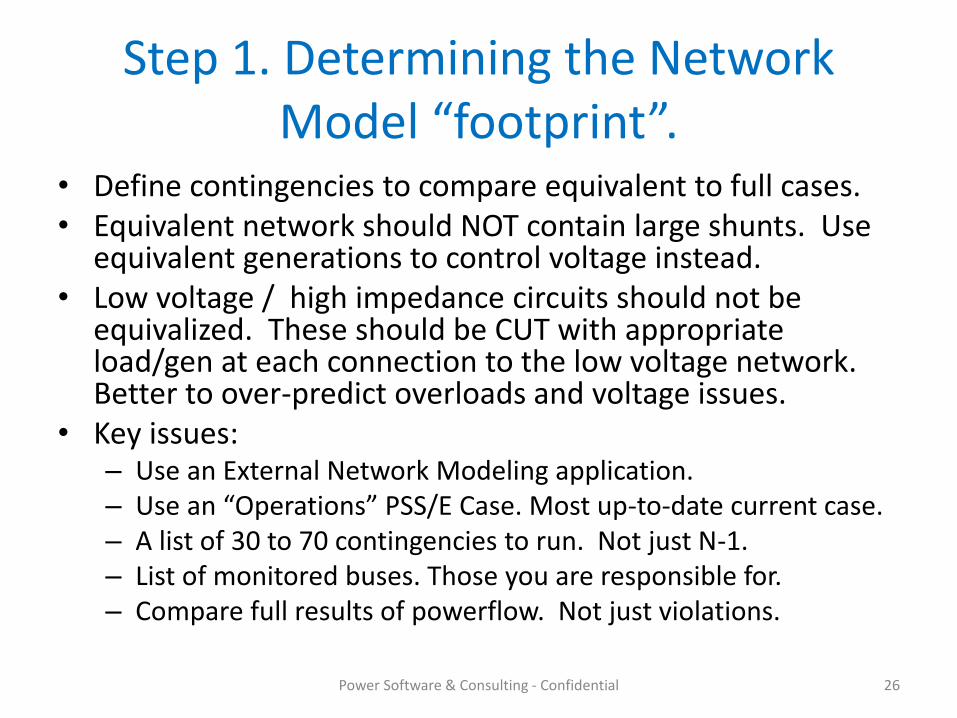
Step 1. Determining the Network Model “footprint”.
• Define contingencies to compare equivalent to full cases. • Equivalent network should NOT contain large shunts. Use
equivalent generations to control voltage instead. • Low voltage / high impedance circuits should not be
equivalized. These should be CUT with appropriate load/gen at each connection to the low voltage network. Better to over-predict overloads and voltage issues.
• Key issues: – Use an External Network Modeling application. – Use an “Operations” PSS/E Case. Most up-to-date current case. – A list of 30 to 70 contingencies to run. Not just N-1. – List of monitored buses. Those you are responsible for. – Compare full results of powerflow. Not just violations.
Power Software & Consulting - Confidential 26

Sample Sensitivity Results
Power Software & Consulting - Confidential 27
Reduction Case: C:\UserFiles\Jobfiles\ABCompany\pti\Summer2011-v32.raw
Timestamp: 04/28/2011 11:00:13
External Bus Retention Sensitivities reported in percent rating
Rank
Bus
No. Bus Name kV
Area
Name
%
Error
From-bus
name
To-bus
name Contingency Name
13 4700 EXT_BUS_11 230 Comp_A 41.53 INT_BUS_A INT_BUS_B LOSS OF GEN 1 AND 2
12 4780 EXT_BUS_12 230 Comp_A 41.53 INT_BUS_A INT_BUS_B LOSS OF GEN 1 AND 2
27 4865 EXT_BUS_13 230 Comp_A 29.38 INT_BUS_A INT_BUS_B LOSS OF GEN 1 AND 2
46 4612 EXT_BUS_14 230 Comp_A 20.74 INT_BUS_Z INT_BUS_X LOSS OF GEN 1 AND 2
45 4735 EXT_BUS_15 230 Comp_A 20.74 INT_BUS_Z INT_BUS_X LOSS OF GEN 1 AND 2
49 4985 EXT_BUS_16 230 Comp_A 18.2 INT_BUS_Z INT_BUS_X LOSS OF GEN 1 AND 2
96 4690 EXT_BUS_17 69 Comp_A 8.68 INT_BUS_C INT_BUS_B BUS_11-BUS12_230
105 4635 EXT_BUS_18 138 Comp_A 7.76 INT_BUS_C INT_BUS_B BUS_11-BUS12_230
104 4860 EXT_BUS_19 138 Comp_A 7.76 INT_BUS_C INT_BUS_B BUS_11-BUS12_230
125 4695 EXT_BUS_20 138 Comp_A 6.4 INT_BUS_Z INT_BUS_D BUS_11-BUS12_230
182 4850 EXT_BUS_21 138 Comp_A 3.87 INT_BUS_Z INT_BUS_D BUS_11-BUS12_230
193 4755 EXT_BUS_22 69 Comp_A 3.6 INT_BUS_Z INT_BUS_D BUS_11-BUS12_230
192 4790 EXT_BUS_23 69 Comp_A 3.6 INT_BUS_Z INT_BUS_D BUS_11-BUS12_230
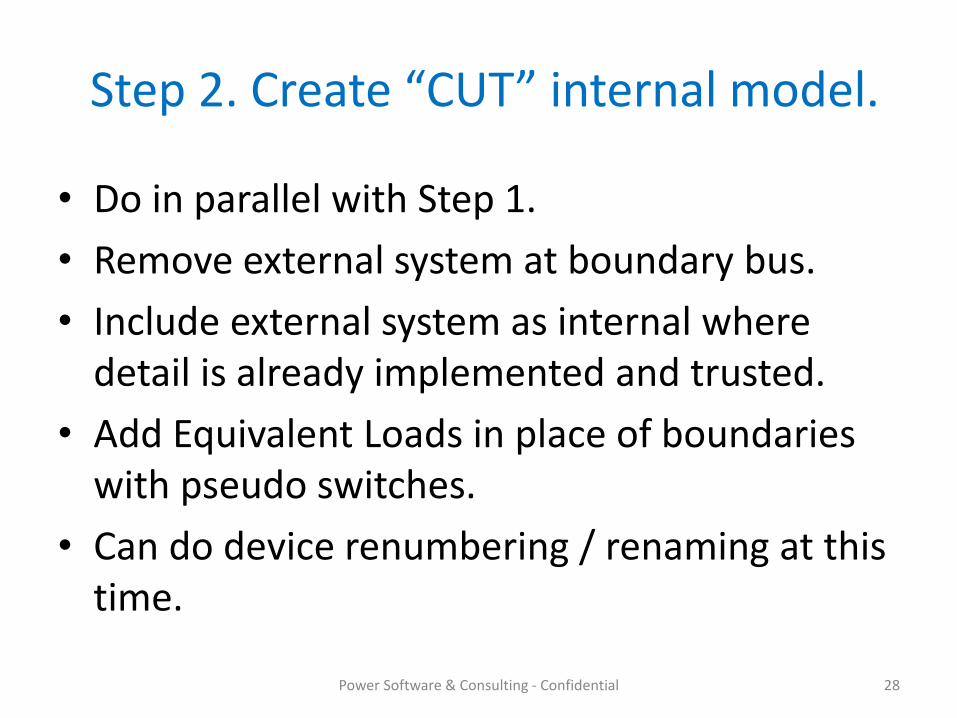
Step 2. Create “CUT” internal model.
• Do in parallel with Step 1.
• Remove external system at boundary bus.
• Include external system as internal where detail is already implemented and trusted.
• Add Equivalent Loads in place of boundaries with pseudo switches.
• Can do device renumbering / renaming at this time.
Power Software & Consulting - Confidential 28
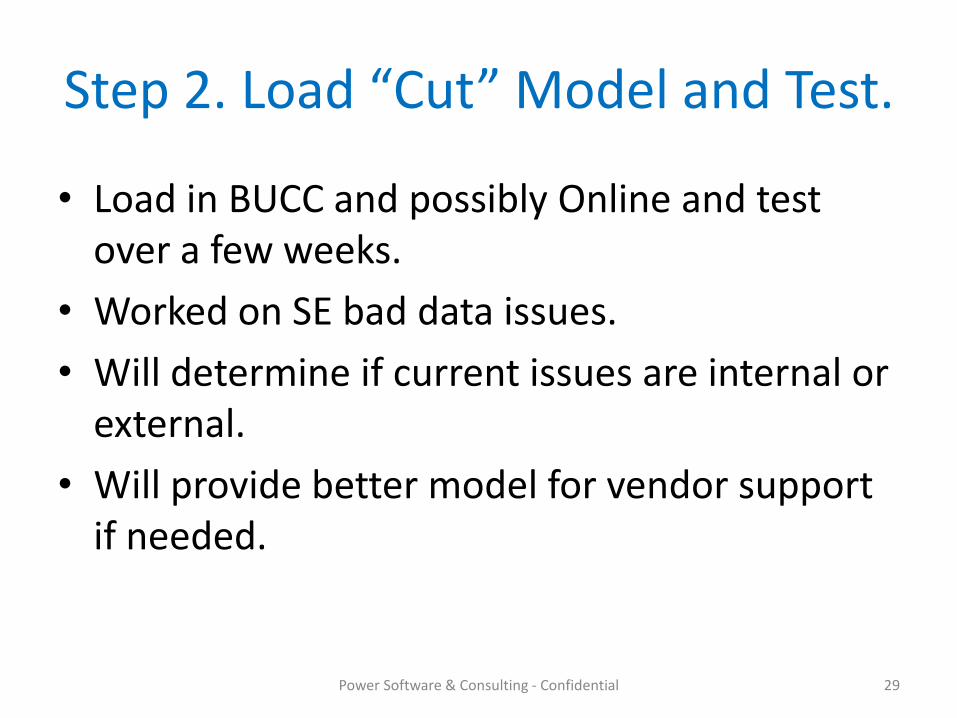
Step 2. Load “Cut” Model and Test.
• Load in BUCC and possibly Online and test over a few weeks.
• Worked on SE bad data issues.
• Will determine if current issues are internal or external.
• Will provide better model for vendor support if needed.
Power Software & Consulting - Confidential 29

Step 3. Clean up after the PSSE to Vendor conversion.
• Typically there are many issues that should be addressed after doing this conversion so the model will require the least amount of manual modification. Some of the issues to possibly address:
– Change bus and device numbers to get better ordering on the displays. Do this for internal also.
– Create appropriate branch names with from/to stations.
– Group buses into stations.
– Replace small or zero impedance branches with pseudo switch or appropriate device.
– Remove or adjust sigma’s created by the conversion.
– Any generator / transformer / shunt issues that need to be cleaned up?
• Perform minimal testing of external as needed.
Power Software & Consulting - Confidential 30
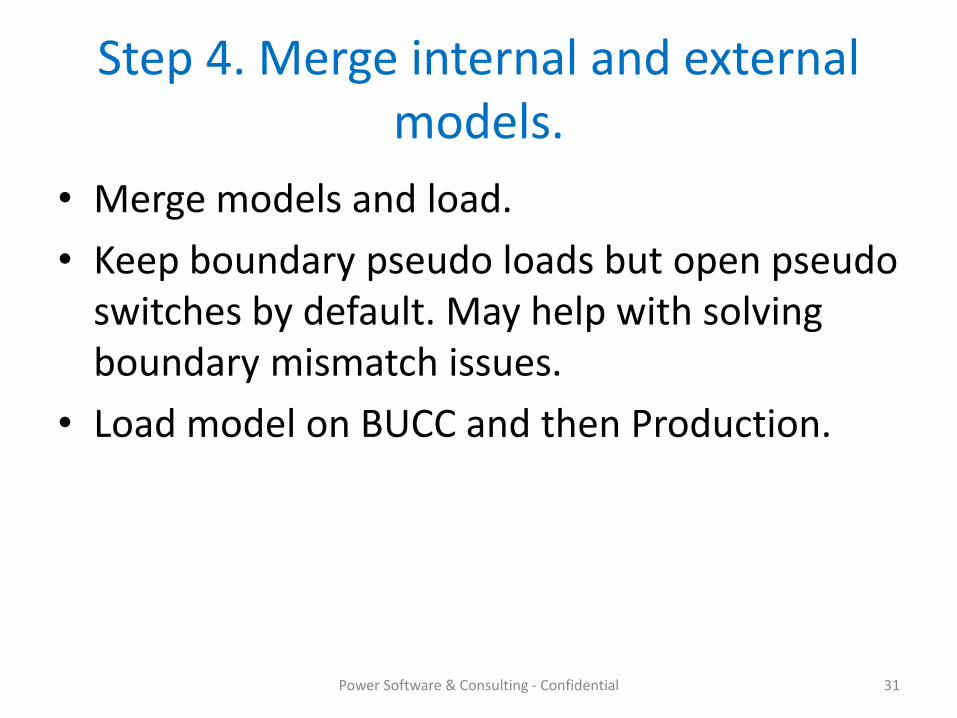
Step 4. Merge internal and external models.
• Merge models and load.
• Keep boundary pseudo loads but open pseudo switches by default. May help with solving boundary mismatch issues.
• Load model on BUCC and then Production.
Power Software & Consulting - Confidential 31

Step 5. Tune and Debug State Estimator.
• Test State Estimator and Contingency Analysis.
• A lot of SE tuning will have been done in the “Cut” internal model effort.
• Add back in missing details and telemetry in the external model as needed.
• Test CA Cases against planned outages.
Power Software & Consulting - Confidential 32

Step 6. Prepare data for next external model replacement.
• Retain model sensitivity information from the external model replacement.
• Update external model status and reference in the vendor database if available.
• Create procedures to determine if external model needs replacement.
– Based on changes in sensitivities.
– Based on changes in accuracy analysis of full model to reduced model using the same retention statuses.
Power Software & Consulting - Confidential 33
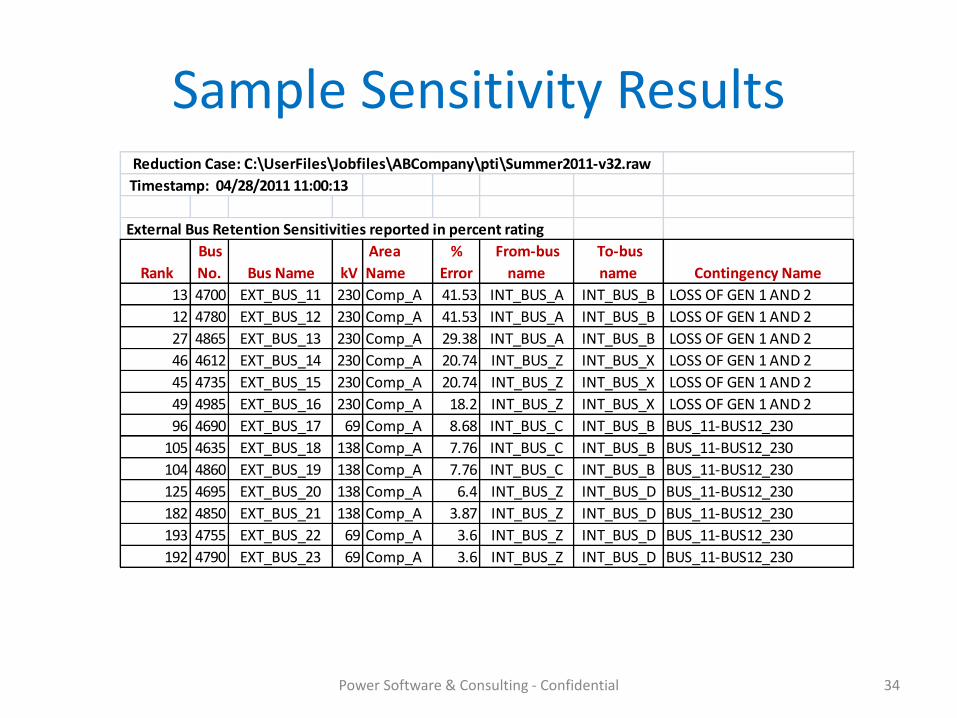
Sample Sensitivity Results
Power Software & Consulting - Confidential 34
Reduction Case: C:\UserFiles\Jobfiles\ABCompany\pti\Summer2011-v32.raw
Timestamp: 04/28/2011 11:00:13
External Bus Retention Sensitivities reported in percent rating
Rank
Bus
No. Bus Name kV
Area
Name
%
Error
From-bus
name
To-bus
name Contingency Name
13 4700 EXT_BUS_11 230 Comp_A 41.53 INT_BUS_A INT_BUS_B LOSS OF GEN 1 AND 2
12 4780 EXT_BUS_12 230 Comp_A 41.53 INT_BUS_A INT_BUS_B LOSS OF GEN 1 AND 2
27 4865 EXT_BUS_13 230 Comp_A 29.38 INT_BUS_A INT_BUS_B LOSS OF GEN 1 AND 2
46 4612 EXT_BUS_14 230 Comp_A 20.74 INT_BUS_Z INT_BUS_X LOSS OF GEN 1 AND 2
45 4735 EXT_BUS_15 230 Comp_A 20.74 INT_BUS_Z INT_BUS_X LOSS OF GEN 1 AND 2
49 4985 EXT_BUS_16 230 Comp_A 18.2 INT_BUS_Z INT_BUS_X LOSS OF GEN 1 AND 2
96 4690 EXT_BUS_17 69 Comp_A 8.68 INT_BUS_C INT_BUS_B BUS_11-BUS12_230
105 4635 EXT_BUS_18 138 Comp_A 7.76 INT_BUS_C INT_BUS_B BUS_11-BUS12_230
104 4860 EXT_BUS_19 138 Comp_A 7.76 INT_BUS_C INT_BUS_B BUS_11-BUS12_230
125 4695 EXT_BUS_20 138 Comp_A 6.4 INT_BUS_Z INT_BUS_D BUS_11-BUS12_230
182 4850 EXT_BUS_21 138 Comp_A 3.87 INT_BUS_Z INT_BUS_D BUS_11-BUS12_230
193 4755 EXT_BUS_22 69 Comp_A 3.6 INT_BUS_Z INT_BUS_D BUS_11-BUS12_230
192 4790 EXT_BUS_23 69 Comp_A 3.6 INT_BUS_Z INT_BUS_D BUS_11-BUS12_230
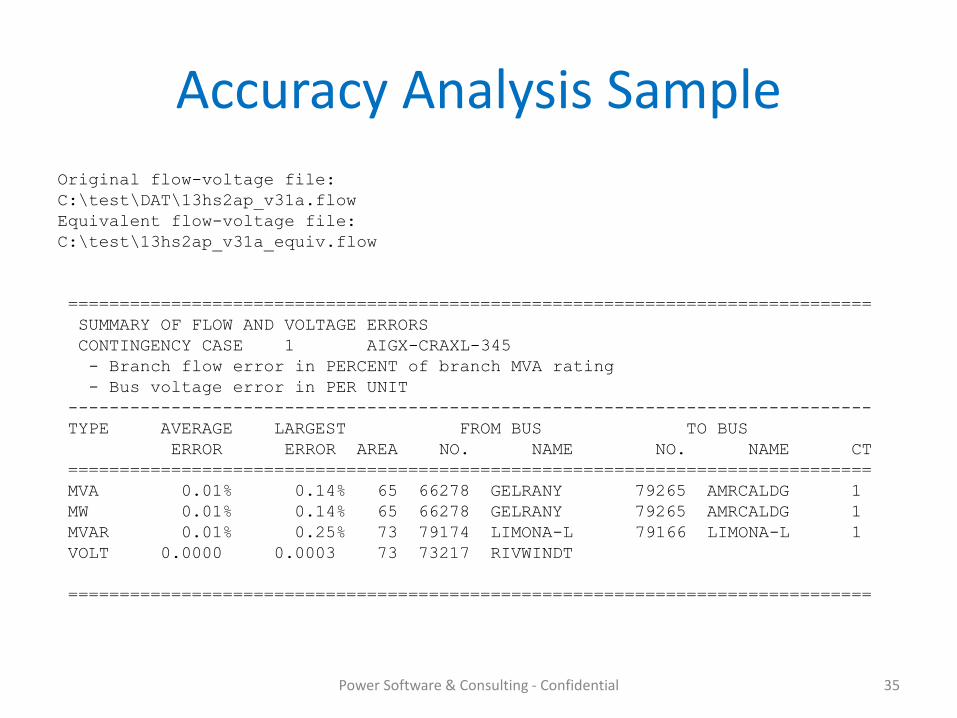
Accuracy Analysis Sample
Original flow-voltage file:
C:\test\DAT\13hs2ap_v31a.flow
Equivalent flow-voltage file:
C:\test\13hs2ap_v31a_equiv.flow
==============================================================================
SUMMARY OF FLOW AND VOLTAGE ERRORS
CONTINGENCY CASE 1 AIGX-CRAXL-345
- Branch flow error in PERCENT of branch MVA rating
- Bus voltage error in PER UNIT
------------------------------------------------------------------------------
TYPE AVERAGE LARGEST FROM BUS TO BUS
ERROR ERROR AREA NO. NAME NO. NAME CT
==============================================================================
MVA 0.01% 0.14% 65 66278 GELRANY 79265 AMRCALDG 1
MW 0.01% 0.14% 65 66278 GELRANY 79265 AMRCALDG 1
MVAR 0.01% 0.25% 73 79174 LIMONA-L 79166 LIMONA-L 1
VOLT 0.0000 0.0003 73 73217 RIVWINDT
==============================================================================
Power Software & Consulting - Confidential 35
Other Suggestions.
• Look at emergency versus operating limits and extreme contingencies.
• What should voltage limits be set to? • Use PSS/E Summer case to get summer limits. • Adjust node numbers or names and create process to
do so. (So busbars and connections to devices are clearly identified).
• Customize displays for Network Applications. • Compare results with what the ISO or RC is getting or
other companies.• Auto Save RT cases hourly for 3-21 days.
Power Software & Consulting - Confidential 36

Thank You.Cuong M Tang, PE
Power Software & Consulting, Inc.Les Jarriel, PE
© San Diego Gas & Electric 2013 37