Embed Size (px)
DESCRIPTION
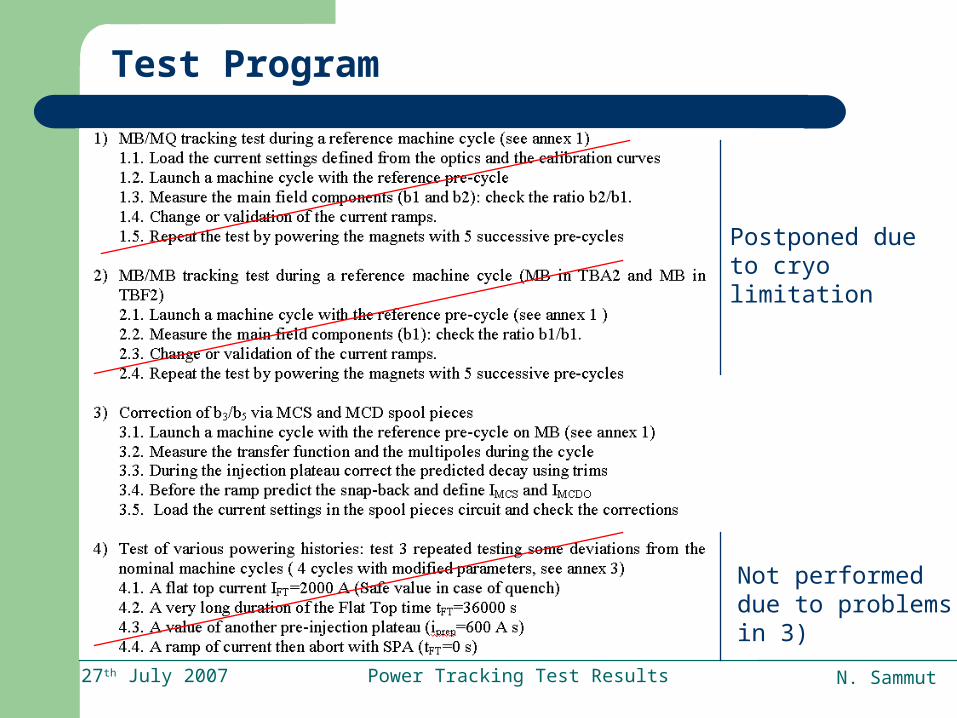
Power Tracking Test Results. N. Sammut. With several inputs from M. Lamont, M. Strzelczyk. And inputs from W. Venturini, L. Bottura, S.Sanfilippo, L. Walckiers, S.Bouchenoua, G.Deferne, J. Miles, R. Mompo. AB-OP. Test Program. Postponed due to cryo limitation. - PowerPoint PPT Presentation
Citation preview

27th July 2007
Power Tracking Test Results
N. Sammut
And inputs from W. Venturini, L. Bottura, S.Sanfilippo,
L. Walckiers, S.Bouchenoua, G.Deferne, J. Miles, R. Mompo
AB-OP
With several inputs from M. Lamont, M. Strzelczyk
27th July 2007 Power Tracking Test Results N. Sammut
Postponed due to cryo limitation
Test Program
Not performed due to problems in 3)
27th July 2007 Power Tracking Test Results N. Sammut
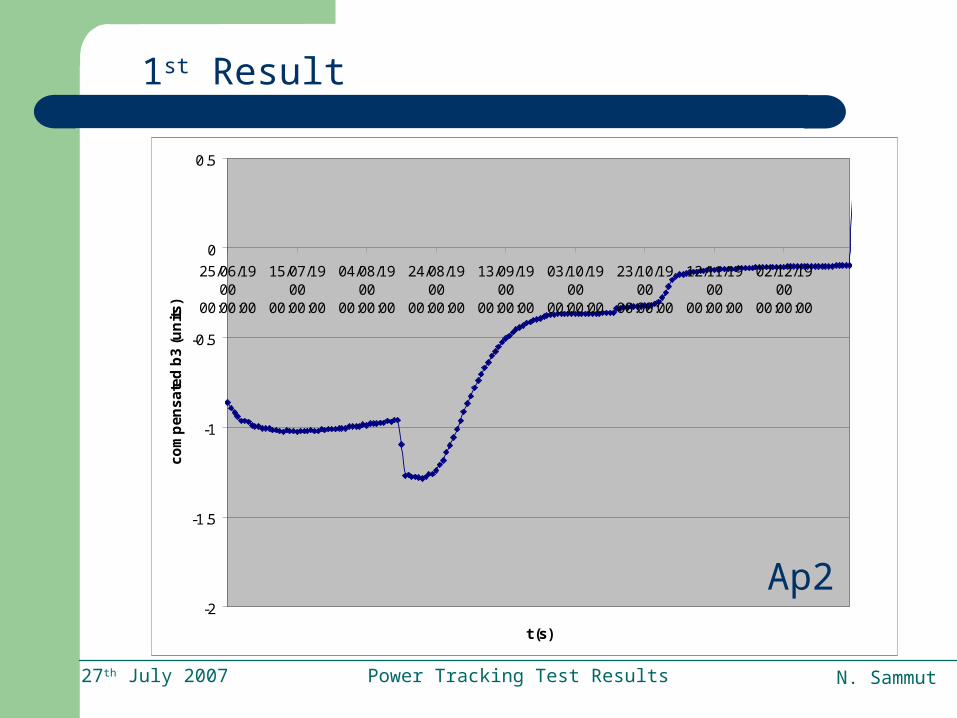
1st Result
-2
-1.5
-1
-0.5
0
0.5
25/06/1900
00:00:00
15/07/1900
00:00:00
04/08/1900
00:00:00
24/08/1900
00:00:00
13/09/1900
00:00:00
03/10/1900
00:00:00
23/10/1900
00:00:00
12/11/1900
00:00:00
02/12/1900
00:00:00
t (s)
co
mp
en
sa
ted
b3
(u
nit
s)
Ap2
27th July 2007 Power Tracking Test Results N. Sammut
-1
-0.8
-0.6
-0.4
-0.2
0
0.2
0.4
0.6
0.8
1
04/07/190000:00:00
23/08/190000:00:00
12/10/190000:00:00
01/12/190000:00:00
20/01/190100:00:00
11/03/190100:00:00
time (s)
com
pen
sate
d b
3(u
nit
s)
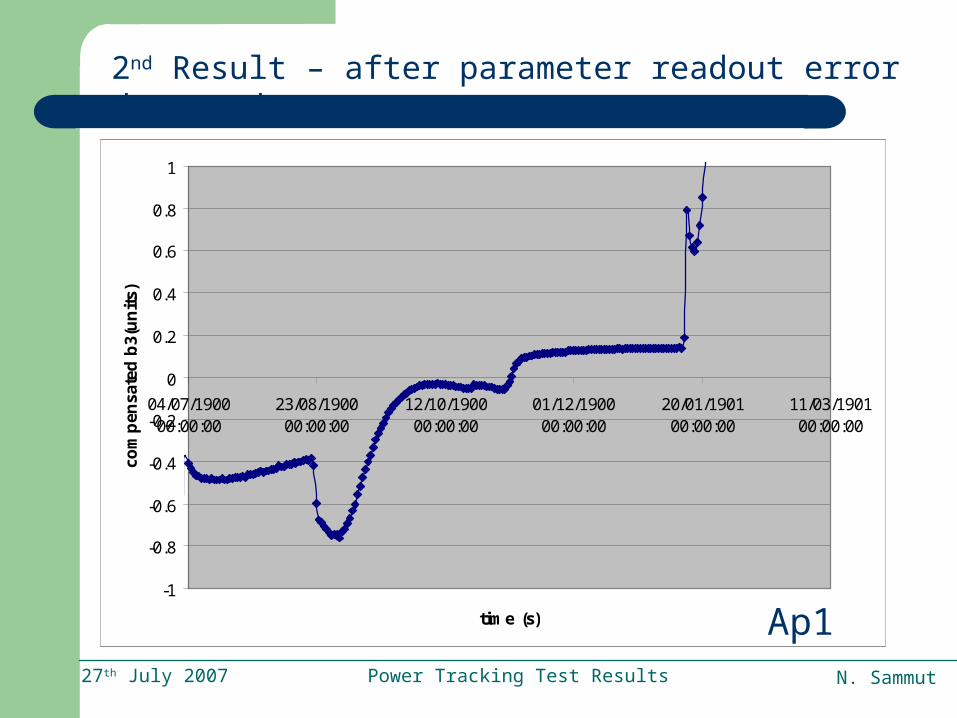
2nd Result – after parameter readout error detected
Ap1
27th July 2007 Power Tracking Test Results N. Sammut
-1
-0.8
-0.6
-0.4
-0.2
0
0.2
0 10 20 30 40 50 60 70 80 90
t (s)
b3
(un
its)
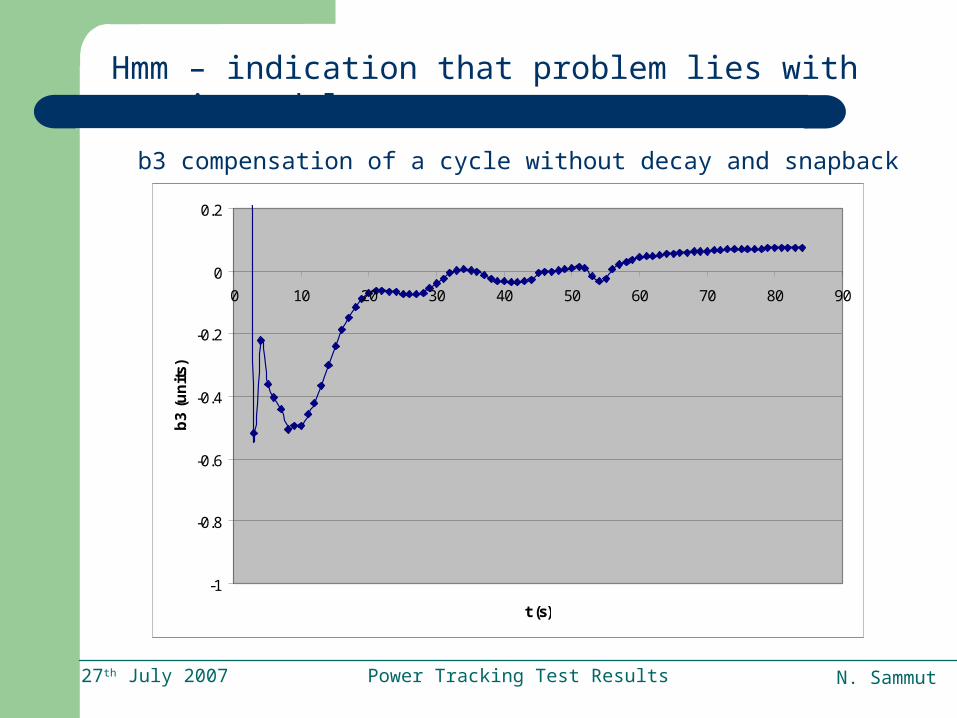
Hmm – indication that problem lies with static model
b3 compensation of a cycle without decay and snapback
27th July 2007 Power Tracking Test Results N. Sammut
-7.2
-7
-6.8
-6.6
-6.4
-6.2
-6
-30 -10 10 30 50 70 90 110 130 150 170
t (s)
b3
(un
its)
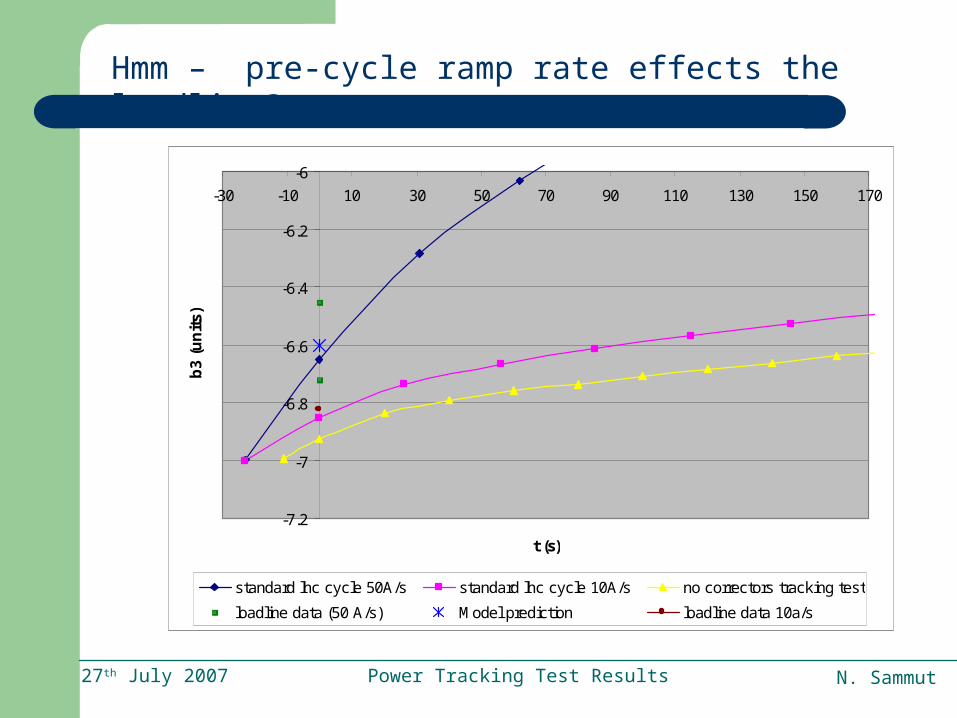
standard lhc cycle 50A/s standard lhc cycle 10A/s no correctors tracking test
loadline data (50 A/s) Model prediction loadline data 10a/s
Hmm – pre-cycle ramp rate effects the loadline?
27th July 2007 Power Tracking Test Results N. Sammut
-0.8
-0.6
-0.4
-0.2
0
0.2
0.4
0.6
-500 0 500 1000 1500 2000 2500 3000 3500 4000
t (s)
b3
(un
its)
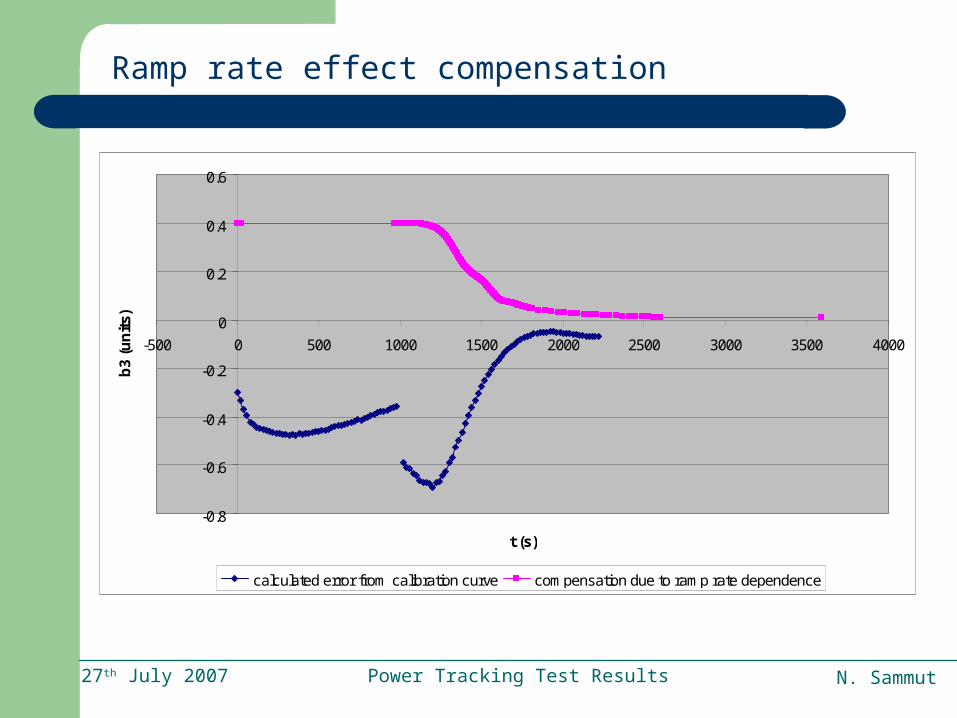
calculated error from calibration curve compensation due to ramp rate dependence
Ramp rate effect compensation
27th July 2007 Power Tracking Test Results N. Sammut
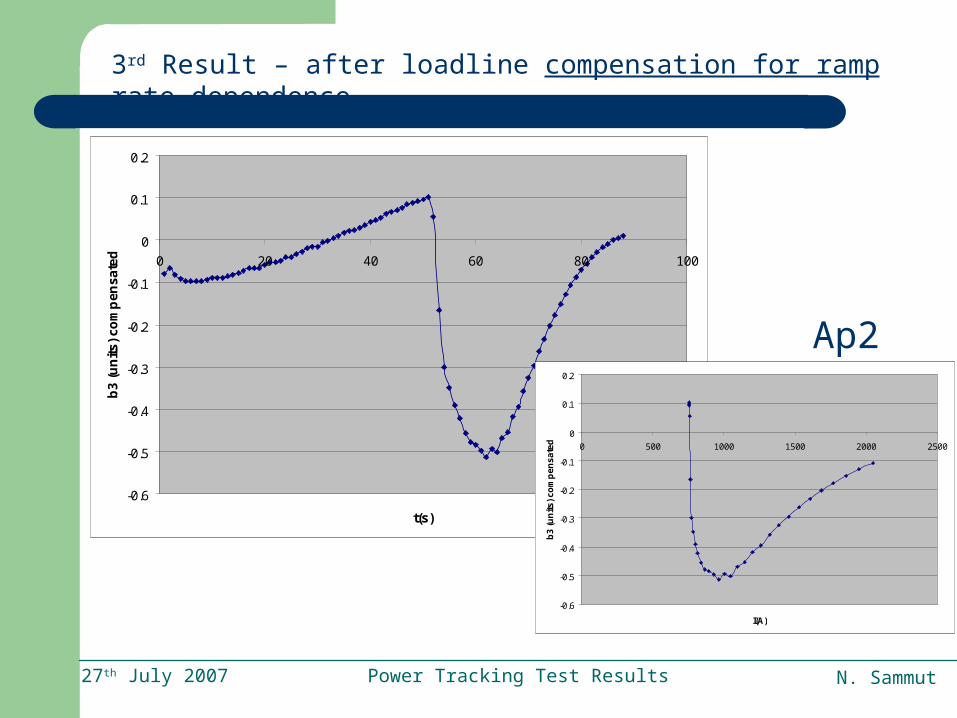
3rd Result – after loadline compensation for ramp rate dependence
-0.6
-0.5
-0.4
-0.3
-0.2
-0.1
0
0.1
0.2
0 20 40 60 80 100
t(s)
b3
(u
nit
s)
co
mp
en
sa
ted
-0.6
-0.5
-0.4
-0.3
-0.2
-0.1
0
0.1
0.2
0 500 1000 1500 2000 2500
I(A)
b3
(u
nit
s)
co
mp
en
sa
ted
Ap2
27th July 2007 Power Tracking Test Results N. Sammut
-0.3
-0.2
-0.1
0
0.1
0.2
0.3
0.4
0.5
0.6
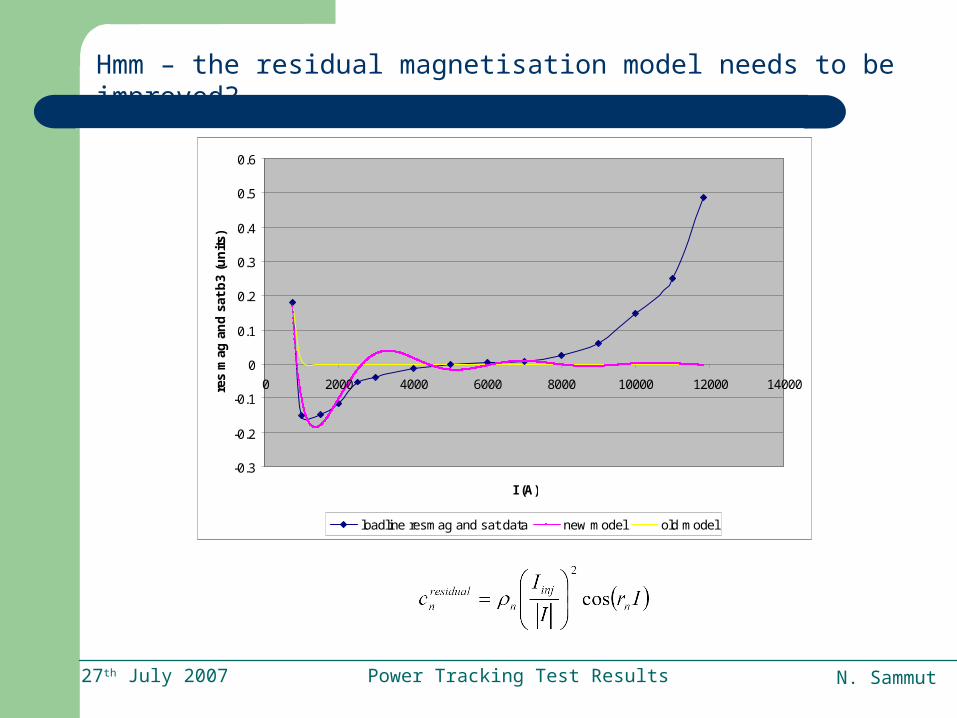
0 2000 4000 6000 8000 10000 12000 14000
I (A)
res
mag
an
d s
at b
3 (u
nit
s)
loadline resmag and sat data new model old model
Hmm – the residual magnetisation model needs to be improved?
27th July 2007 Power Tracking Test Results N. Sammut
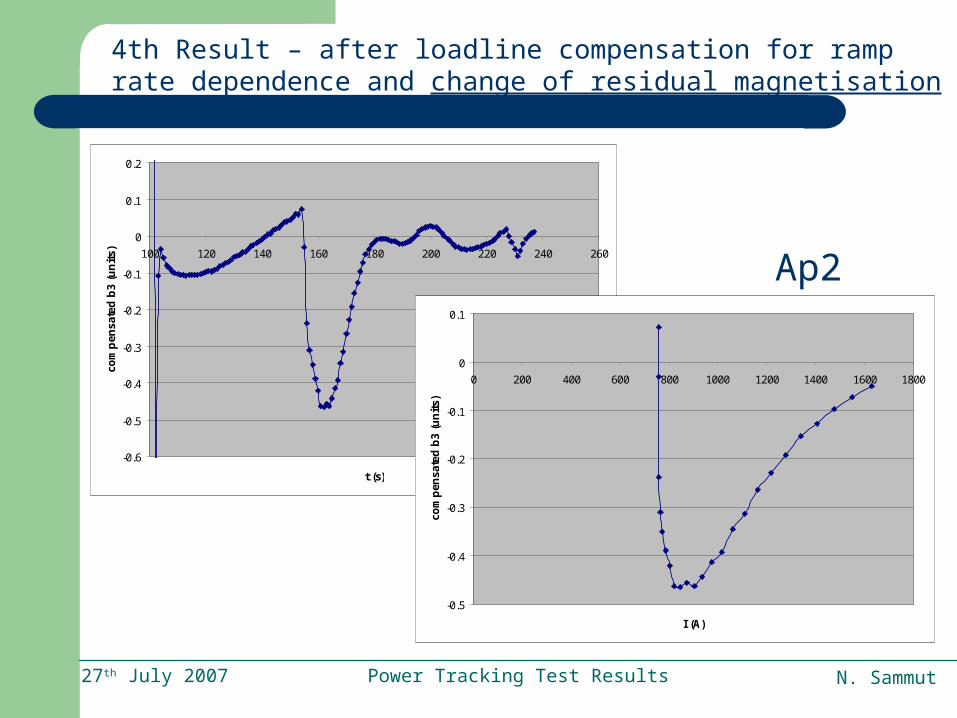
-0.6
-0.5
-0.4
-0.3
-0.2
-0.1
0
0.1
0.2
100 120 140 160 180 200 220 240 260
t (s)
com
pen
sate
d b
3 (u
nit
s)
-0.5
-0.4
-0.3
-0.2
-0.1
0
0.1
0 200 400 600 800 1000 1200 1400 1600 1800
I (A)
com
pen
sate
d b
3 (u
nit
s)
4th Result – after loadline compensation for ramp rate dependence and change of residual magnetisation model
Ap2
27th July 2007 Power Tracking Test Results N. Sammut
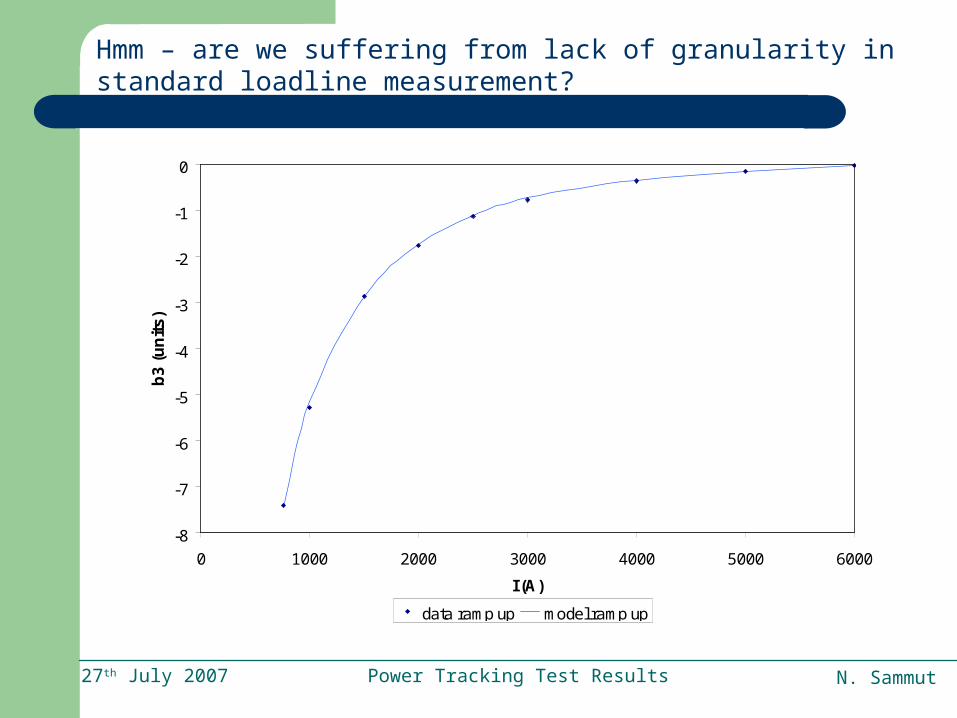
Hmm – are we suffering from lack of granularity in standard loadline measurement?
-8
-7
-6
-5
-4
-3
-2
-1
0
0 1000 2000 3000 4000 5000 6000
I (A)
b3
(u
nit
s)
data ramp up model ramp up
27th July 2007 Power Tracking Test Results N. Sammut
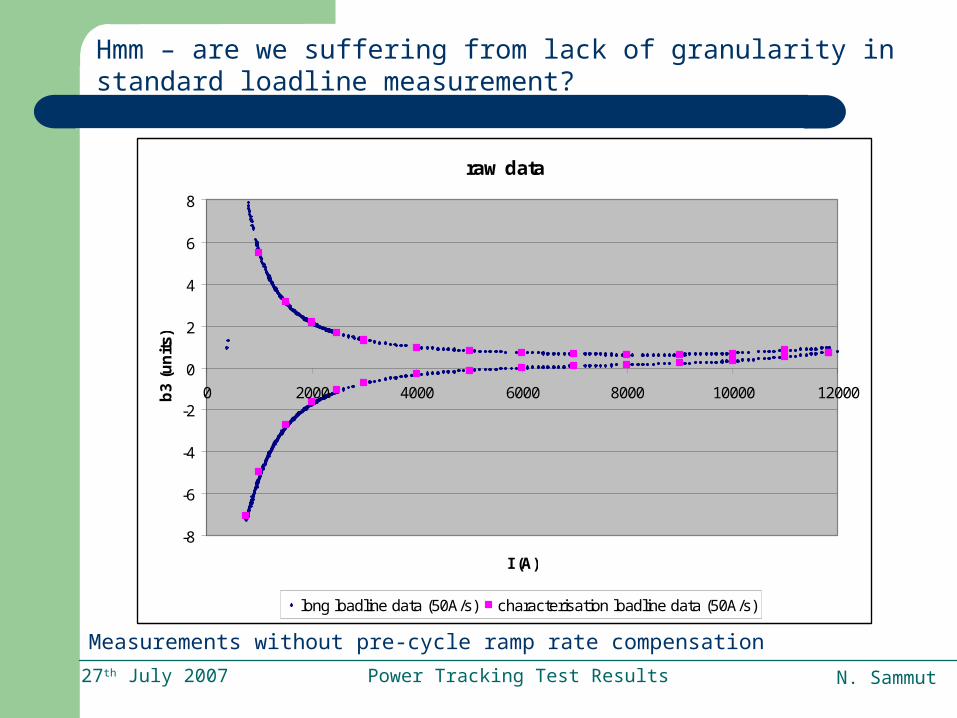
Hmm – are we suffering from lack of granularity in standard loadline measurement?
Measurements without pre-cycle ramp rate compensation
raw data
-8
-6
-4
-2
0
2
4
6
8
0 2000 4000 6000 8000 10000 12000
I (A)
b3
(un
its)
long loadline data (50A/s) characterisation loadline data (50A/s)
27th July 2007 Power Tracking Test Results N. Sammut
-0.4
-0.3
-0.2
-0.1
0
0.1
0.2
0.3
0.4
0.5
0.6
0 2000 4000 6000 8000 10000 12000 14000
I(A)
b3
res
mag
sat
(un
its)
Series1
Series2
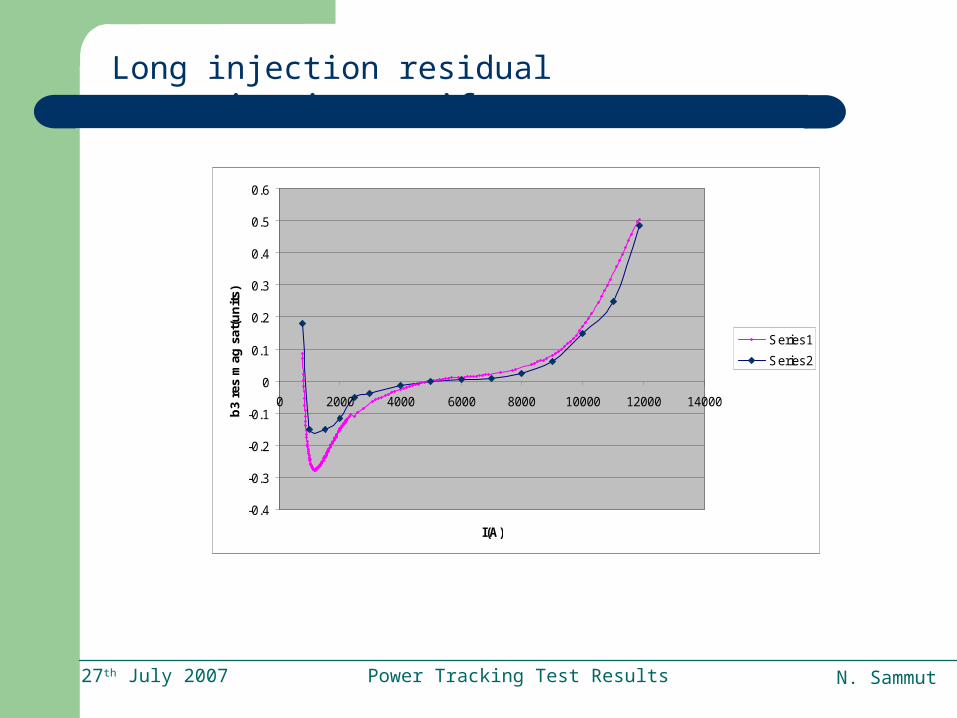
Long injection residual magnetization artifact
27th July 2007 Power Tracking Test Results N. Sammut
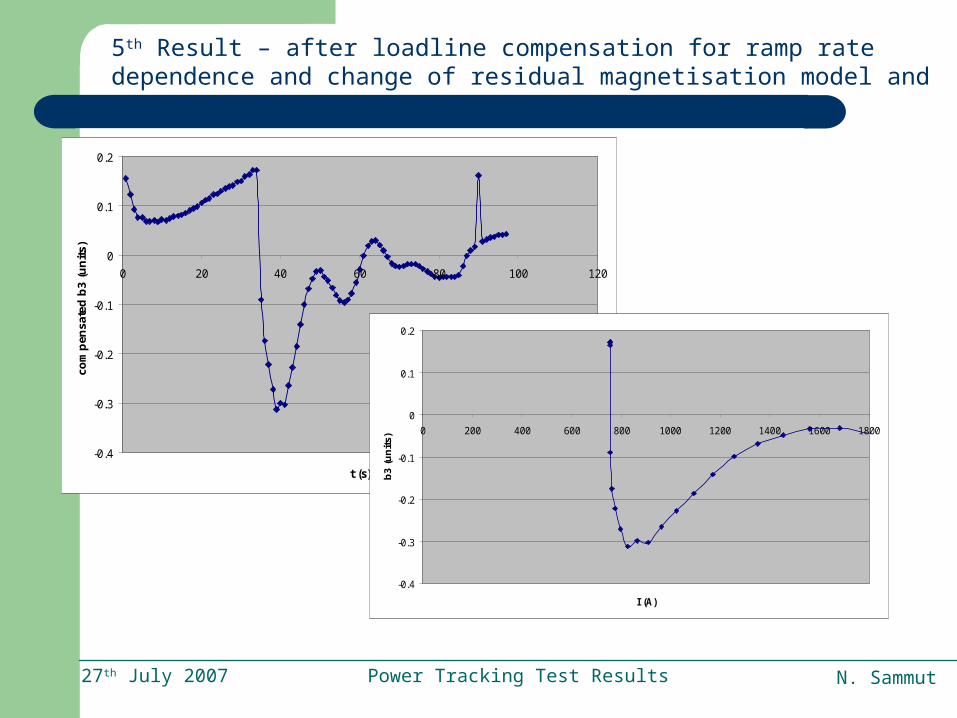
5th Result – after loadline compensation for ramp rate dependence and change of residual magnetisation model and increased points for loadline
-0.4
-0.3
-0.2
-0.1
0
0.1
0.2
0 20 40 60 80 100 120
t (s)
com
pen
sate
d b
3 (u
nit
s)
-0.4
-0.3
-0.2
-0.1
0
0.1
0.2
0 200 400 600 800 1000 1200 1400 1600 1800
I (A)
b3
(un
its)
27th July 2007 Power Tracking Test Results N. Sammut
-0.1
-0.05
0
0.05
0.1
0.15
0 2000 4000 6000 8000 10000 12000 14000
I (A)m
od
el v
s d
ata
erro
r b
3 (u
nit
s)
-0.4
-0.3
-0.2
-0.1
0
0.1
0.2
0 200 400 600 800 1000 1200 1400 1600 1800
I (A)
b3
(un
its)
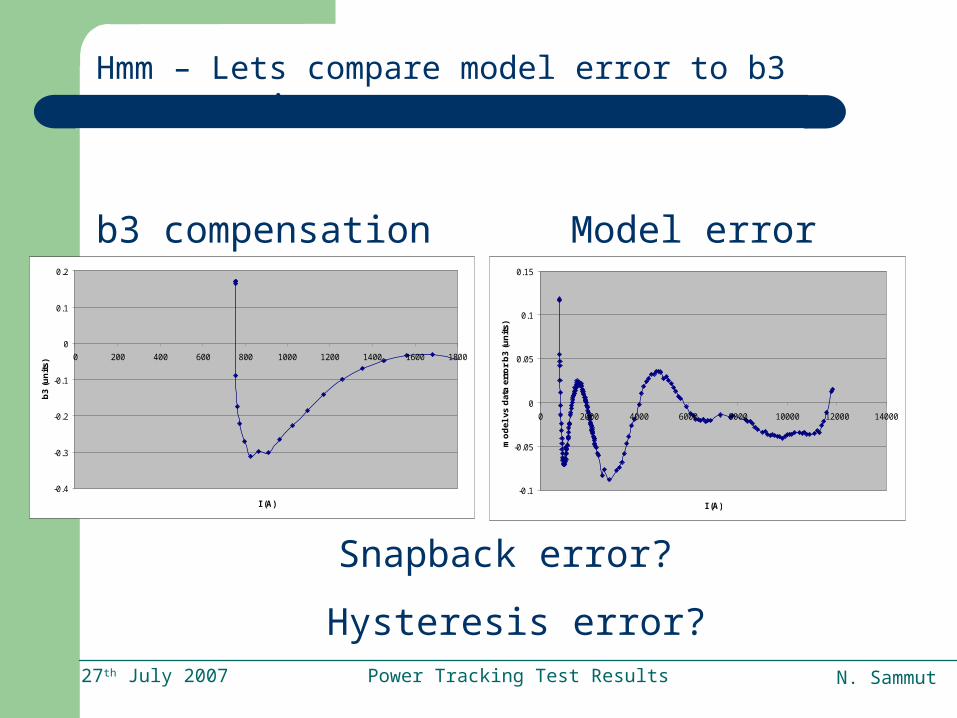
Hmm – Lets compare model error to b3 compensation
b3 compensation Model error
Snapback error?
Hysteresis error?
27th July 2007 Power Tracking Test Results N. Sammut
-8
-7.5
-7
-6.5
-6
-5.5
-5
-4.5
-4
700 750 800 850 900 950 1000 1050 1100
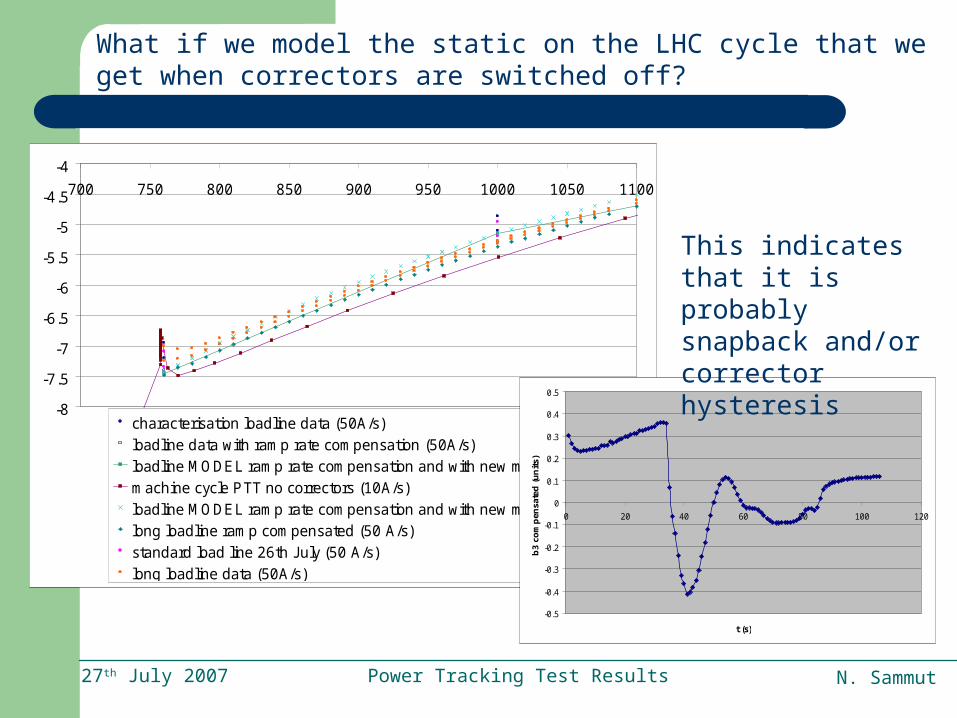
characterisation loadline data (50A/s)loadline data with ramp rate compensation (50A/s)loadline MODEL ramp rate compensation and with new model (50 A/s)machine cycle PTT no correctors (10A/s)loadline MODEL ramp rate compensation and with new model (50 A/s)long loadline ramp compensated (50 A/s)standard load line 26th July (50 A/s)long loadline data (50A/s)
What if we model the static on the LHC cycle that we get when correctors are switched off?
-0.5
-0.4
-0.3
-0.2
-0.1
0
0.1
0.2
0.3
0.4
0.5
0 20 40 60 80 100 120
t (s)
b3
com
pen
sate
d (
un
its)
This indicates that it is probably snapback and/or corrector hysteresis
27th July 2007 Power Tracking Test Results N. Sammut
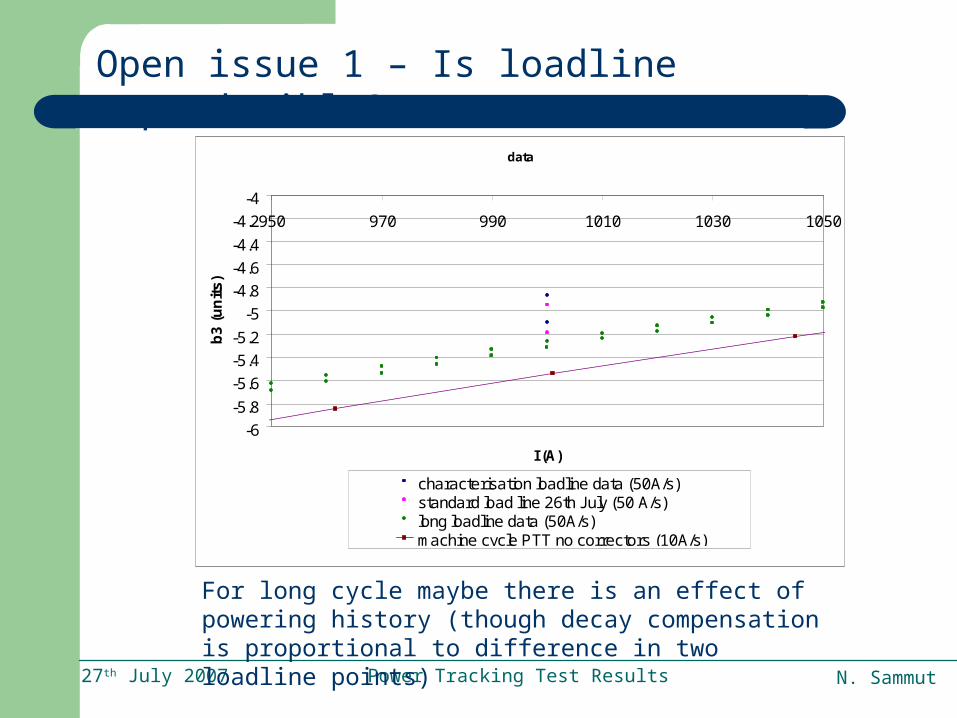
Open issue 1 – Is loadline reproducible?
data
-6
-5.8
-5.6
-5.4
-5.2
-5
-4.8
-4.6
-4.4
-4.2
-4
950 970 990 1010 1030 1050
I (A)
b3
(u
nit
s)
characterisation loadline data (50A/s)standard load line 26th July (50 A/s)long loadline data (50A/s)machine cycle PTT no correctors (10A/s)
For long cycle maybe there is an effect of powering history (though decay compensation is proportional to difference in two loadline points)
27th July 2007 Power Tracking Test Results N. Sammut
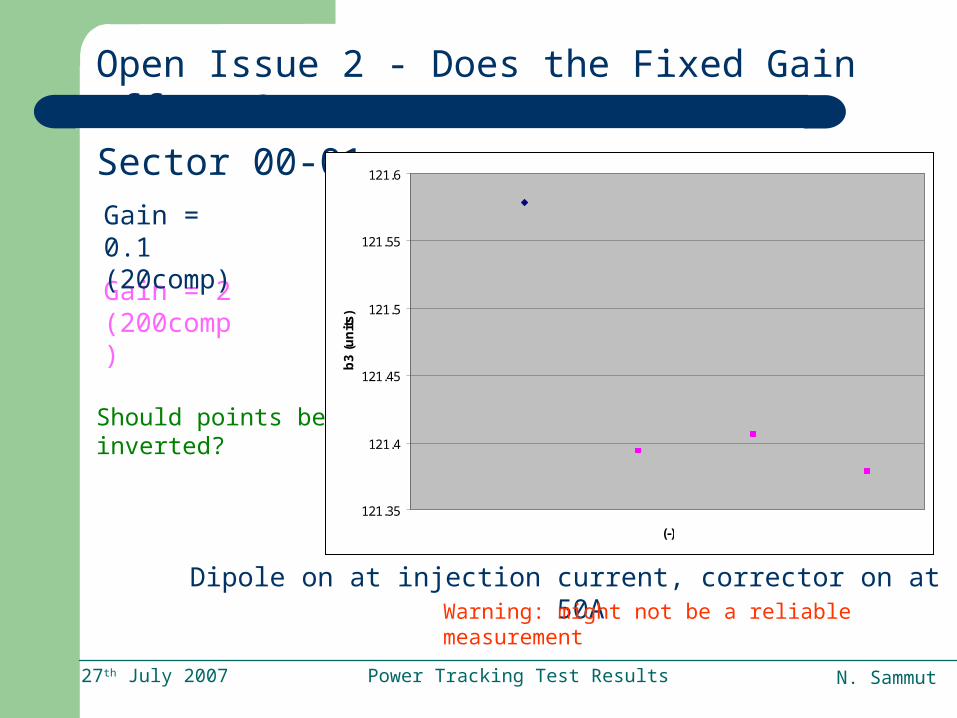
Open Issue 2 - Does the Fixed Gain effect ?
Dipole on at injection current, corrector on at ~ 50A
Sector 00-01
Gain = 2 (200comp)
Gain = 0.1 (20comp)
121.35
121.4
121.45
121.5
121.55
121.6
(-)
b3
(un
its)
Warning: might not be a reliable measurement
Should points be inverted?
27th July 2007 Power Tracking Test Results N. Sammut
-0.04800
-0.04700
-0.04600
-0.04500
-0.04400
-0.04300
-0.04200
-0.04100
-0.04000
-0.03900
0 100 200 300 400 500 600
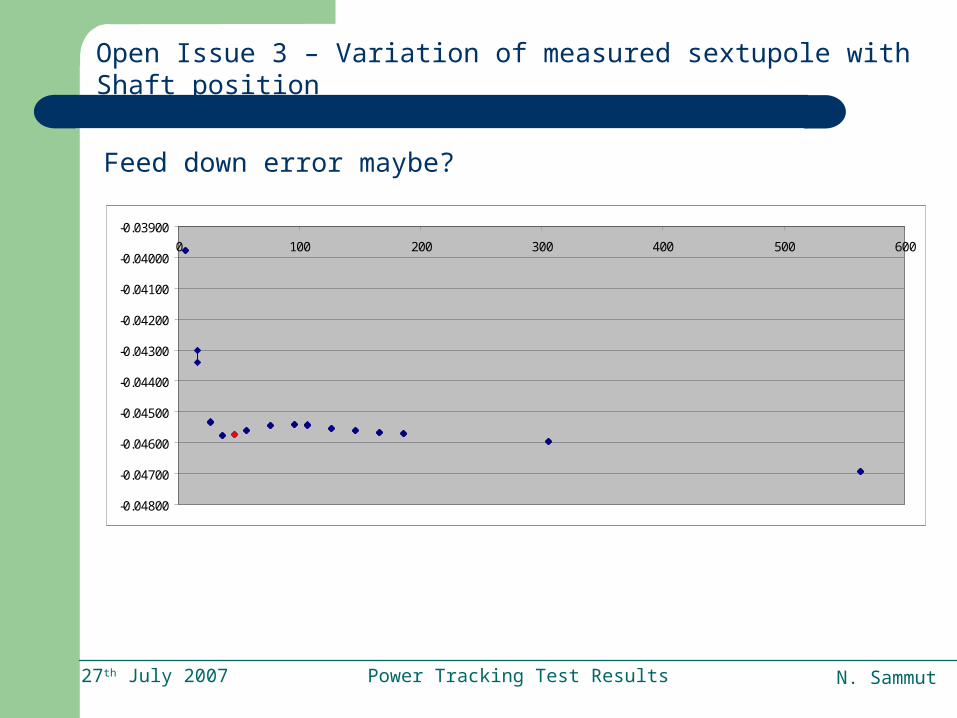
Open Issue 3 – Variation of measured sextupole with Shaft position
Feed down error maybe?
27th July 2007 Power Tracking Test Results N. Sammut
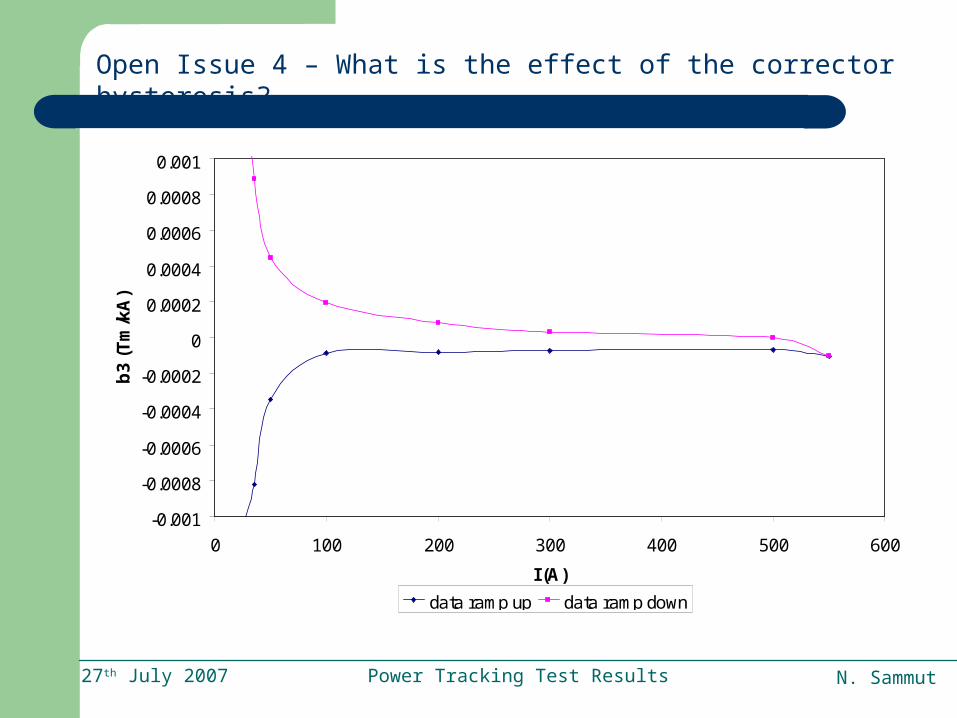
Open Issue 4 – What is the effect of the corrector hysteresis?
-0.001
-0.0008
-0.0006
-0.0004
-0.0002
0
0.0002
0.0004
0.0006
0.0008
0.001
0 100 200 300 400 500 600
I (A)
b3
(T
m/k
A)
data ramp up data ramp down
27th July 2007 Power Tracking Test Results N. Sammut
Other considerations
1) Is timing wrong? 1s = 0.015units of b3 change in dipole
2) Snapback correlation might be different for this magnet
3) Snapback correlation might be affected by the loadline not being reproducible. (Also loadline was not compensated for ramp rate)
27th July 2007 Power Tracking Test Results N. Sammut
Proposal
1) Fix Shafts that have problems with sectors
2) Perform detailed loadline on each magnet (including SSS) (debug cycle)
3) Investigate well the difference in loadline measurements
4) Investigate effect of fixed gains and preferably have system with variable gains
5) Investigate variation of sextupole with shaft position
6) Perform detailed hysteresis measurements of all corrector types and investigate importance of this effect
7) Investigate timing
8) Find better fit for Residual Magnetisation
9) Maybe also investigate decay as a function of injection current
10) System such that current is saved in measurement entries (ease analysis considerably)
11) Use FAME for next measurement after a detailed characterisation and cross calibration of the instrument
12) Perform snapback measurement using Hall probe too