Embed Size (px)
Citation preview
8-10-2013
Challenge the future
Delft University of Technology
CT4491 Lecture. Design Storms and hydrological models for urban drainage systems Marie-claire ten Veldhuis
2 CIE4491 Lecture. IDF curves and design storms
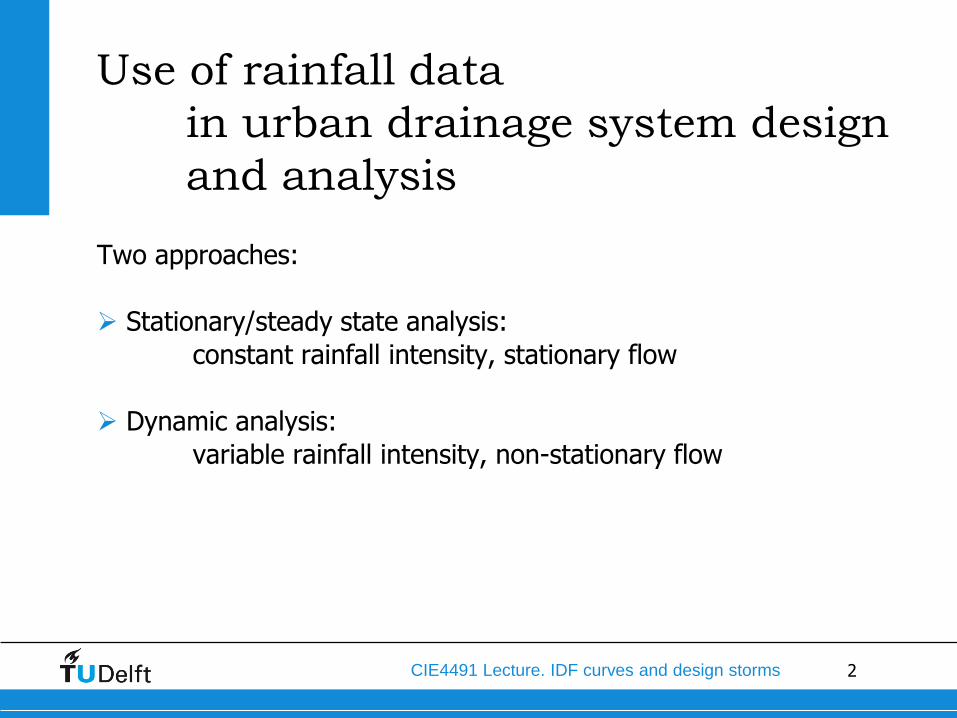
Use of rainfall data
in urban drainage system design
and analysis
Two approaches:
Stationary/steady state analysis:
constant rainfall intensity, stationary flow
Dynamic analysis:
variable rainfall intensity, non-stationary flow
3 CIE4491 Lecture. IDF curves and design storms
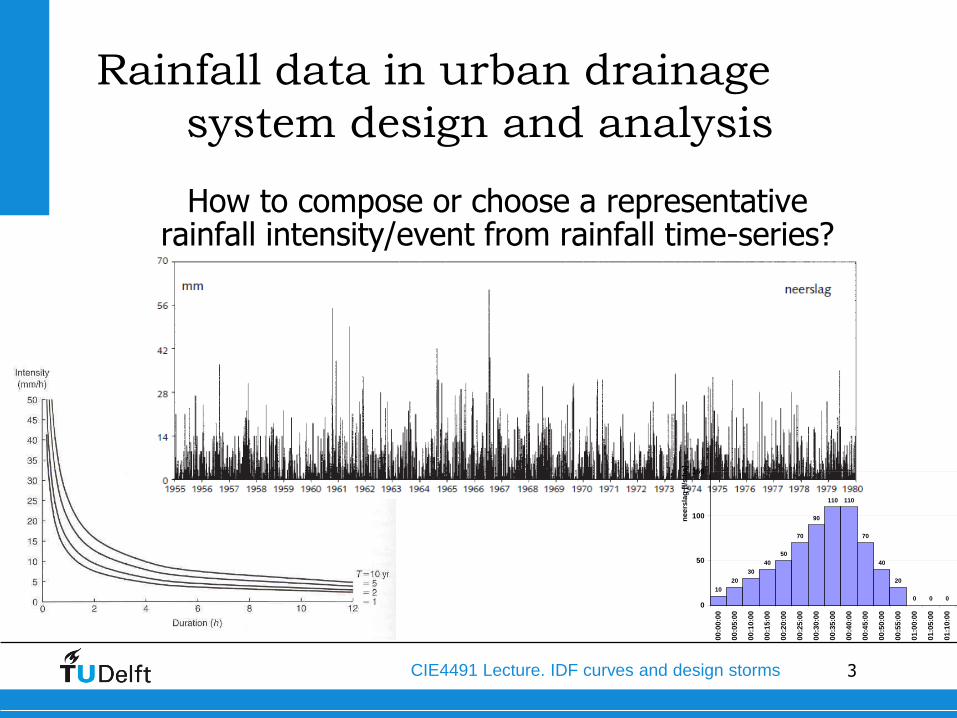
Rainfall data in urban drainage
system design and analysis
How to compose or choose a representative
rainfall intensity/event from rainfall time-series?
10
20
30
40
50
70
90
110 110
70
40
20
0 0 0 0 0 0 0 0 0 0 0 0 00
50
100
150
200
250
00
:00
:00
00
:05
:00
00
:10
:00
00
:15
:00
00
:20
:00
00
:25
:00
00
:30
:00
00
:35
:00
00
:40
:00
00
:45
:00
00
:50
:00
00
:55
:00
01
:00
:00
01
:05
:00
01
:10
:00
01
:15
:00
01
:20
:00
01
:25
:00
01
:30
:00
01
:35
:00
01
:40
:00
01
:45
:00
01
:50
:00
01
:55
:00
02
:00
:00
nee
rsla
g [
l/s
.ha
]
4 CIE4491 Lecture. IDF curves and design storms
Rainfall data in urban drainage
system design and analysis
for Design:
How to choose rainfall characteristics, representative of
a pre-defined protection level, over a system’s lifetime?
for Analysis:
How to find rainfall intensities characteristic of the
conditions we want to check performance for?
5 CIE4491 Lecture. IDF curves and design storms
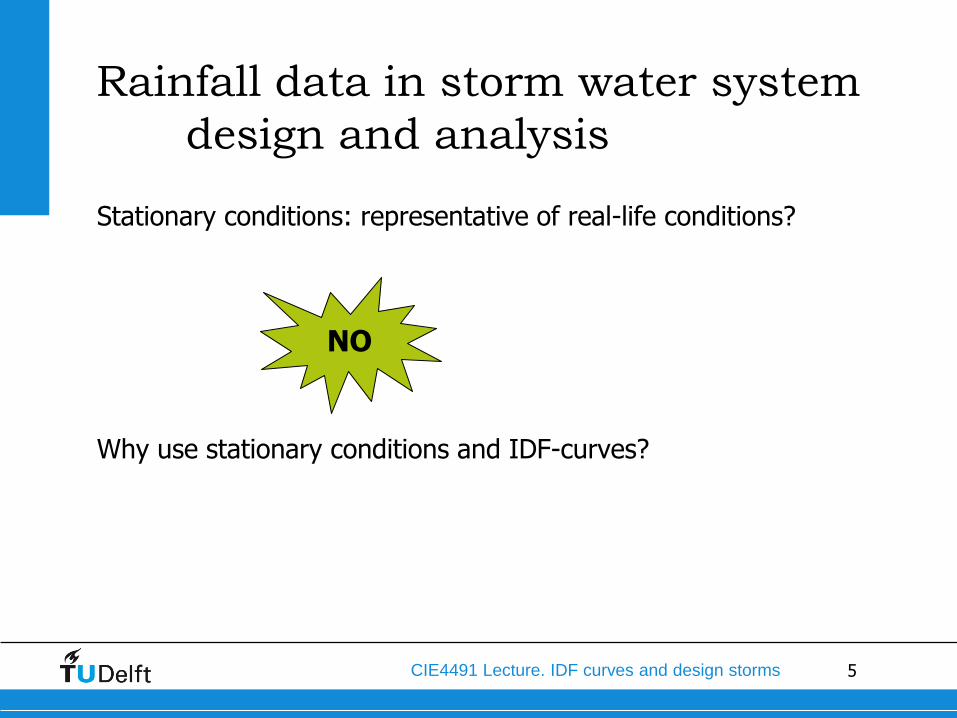
Rainfall data in storm water system
design and analysis
Stationary conditions: representative of real-life conditions?
Why use stationary conditions and IDF-curves?
NO
6 CIE4491 Lecture. IDF curves and design storms
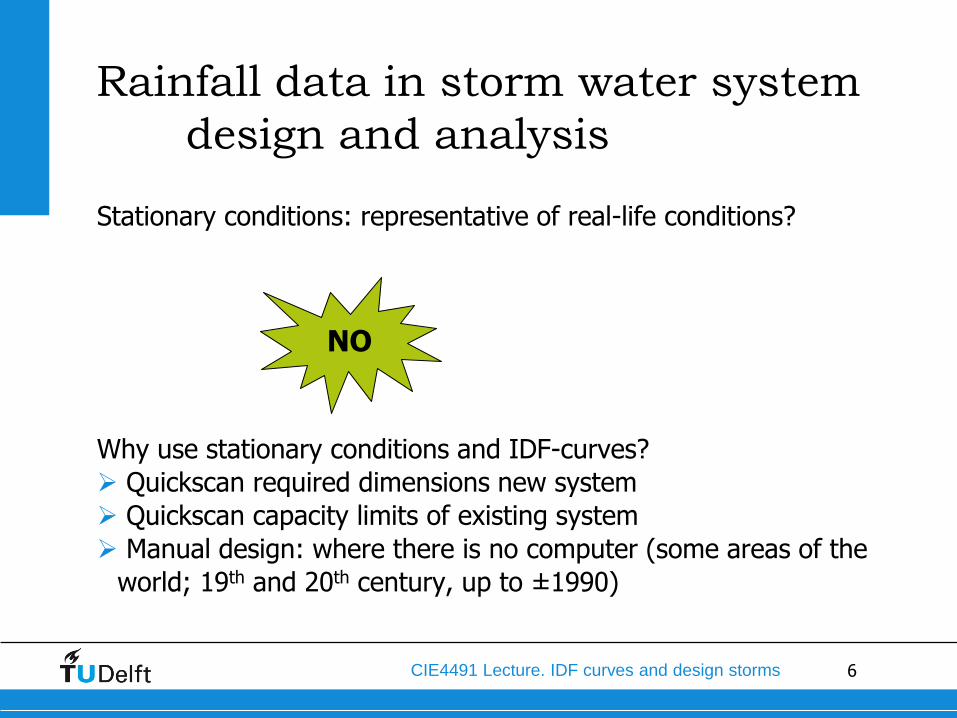
Rainfall data in storm water system
design and analysis
Stationary conditions: representative of real-life conditions?
Why use stationary conditions and IDF-curves?
Quickscan required dimensions new system
Quickscan capacity limits of existing system
Manual design: where there is no computer (some areas of the
world; 19th and 20th century, up to ±1990)
NO

7 CIE4491 Lecture. IDF curves and design storms
Rainfall data in storm water system
design and analysis
Stationary conditions: representative of real-life conditions?
Why use stationary conditions and IDF-curves?
Where there is a lack of data to build a proper model (many
areas worldwide, incl Europe!)
NO
8 CIE 4491. Lecture IDF curves and design storms | xx
Dynamic rainfall intensity for
stormwater design, design
storms
9 CIE4491 Lecture. IDF curves and design storms
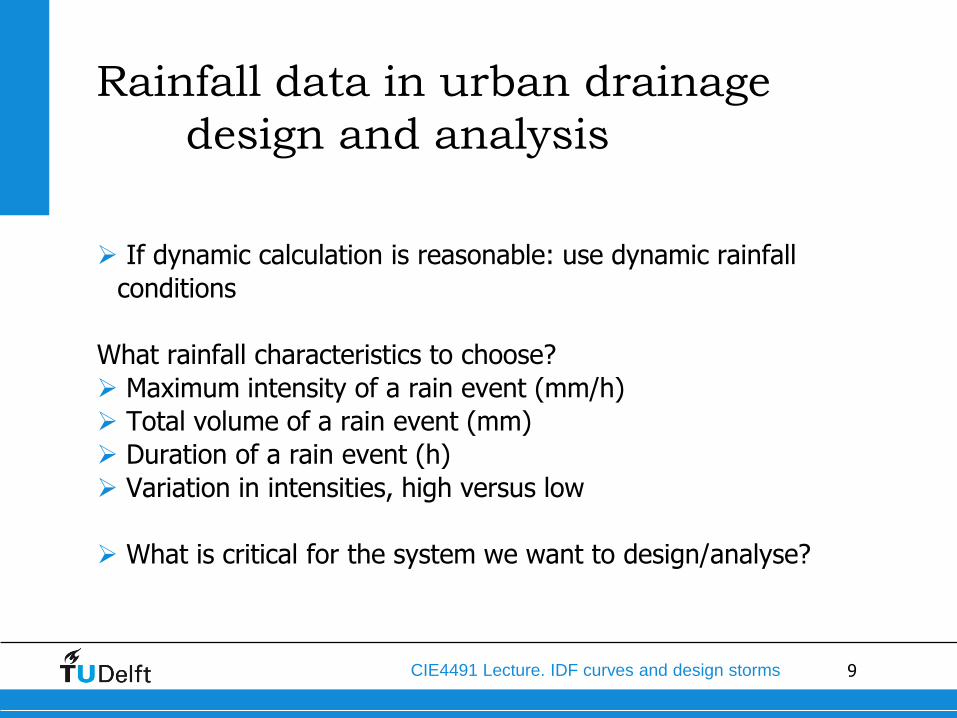
Rainfall data in urban drainage
design and analysis
If dynamic calculation is reasonable: use dynamic rainfall
conditions
What rainfall characteristics to choose?
Maximum intensity of a rain event (mm/h)
Total volume of a rain event (mm)
Duration of a rain event (h)
Variation in intensities, high versus low
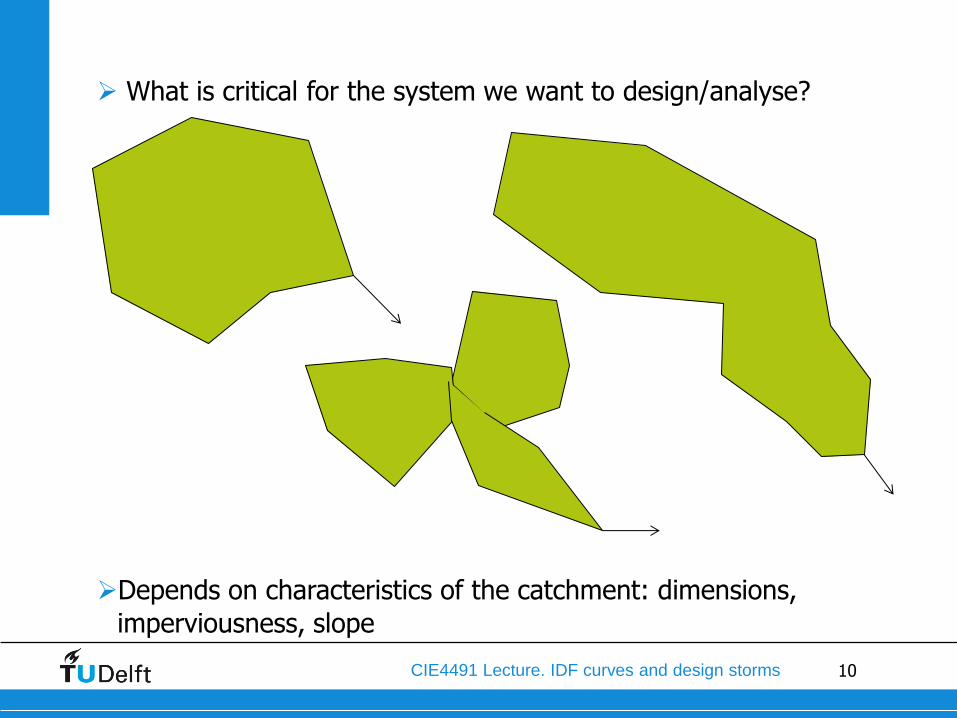
What is critical for the system we want to design/analyse?
10 CIE4491 Lecture. IDF curves and design storms
What is critical for the system we want to design/analyse?
Depends on characteristics of the catchment: dimensions,
imperviousness, slope
11 CIE4491 Lecture. IDF curves and design storms
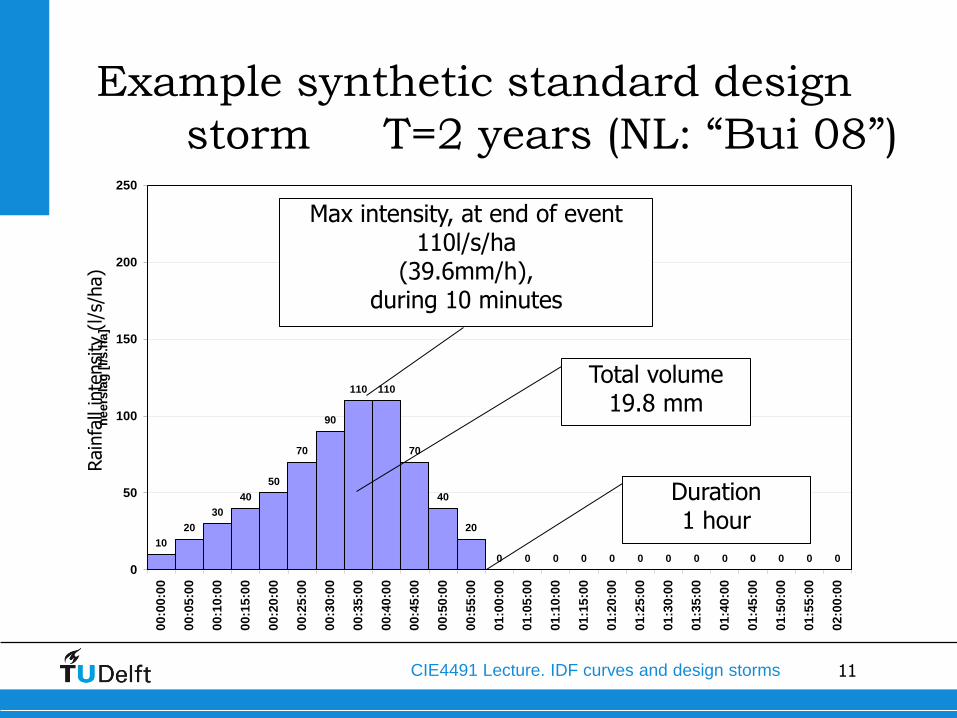
Example synthetic standard design
storm T=2 years (NL: “Bui 08”) Rain
fall
inte
nsi
ty (
l/s/
ha)
10
20
30
40
50
70
90
110 110
70
40
20
0 0 0 0 0 0 0 0 0 0 0 0 00
50
100
150
200
250
00
:00
:00
00
:05
:00
00
:10
:00
00
:15
:00
00
:20
:00
00
:25
:00
00
:30
:00
00
:35
:00
00
:40
:00
00
:45
:00
00
:50
:00
00
:55
:00
01
:00
:00
01
:05
:00
01
:10
:00
01
:15
:00
01
:20
:00
01
:25
:00
01
:30
:00
01
:35
:00
01
:40
:00
01
:45
:00
01
:50
:00
01
:55
:00
02
:00
:00
ne
ers
lag
[l/
s.h
a]
Max intensity, at end of event 110l/s/ha
(39.6mm/h), during 10 minutes
Total volume 19.8 mm
Duration 1 hour
12 CIE4491 Lecture. IDF curves and design storms
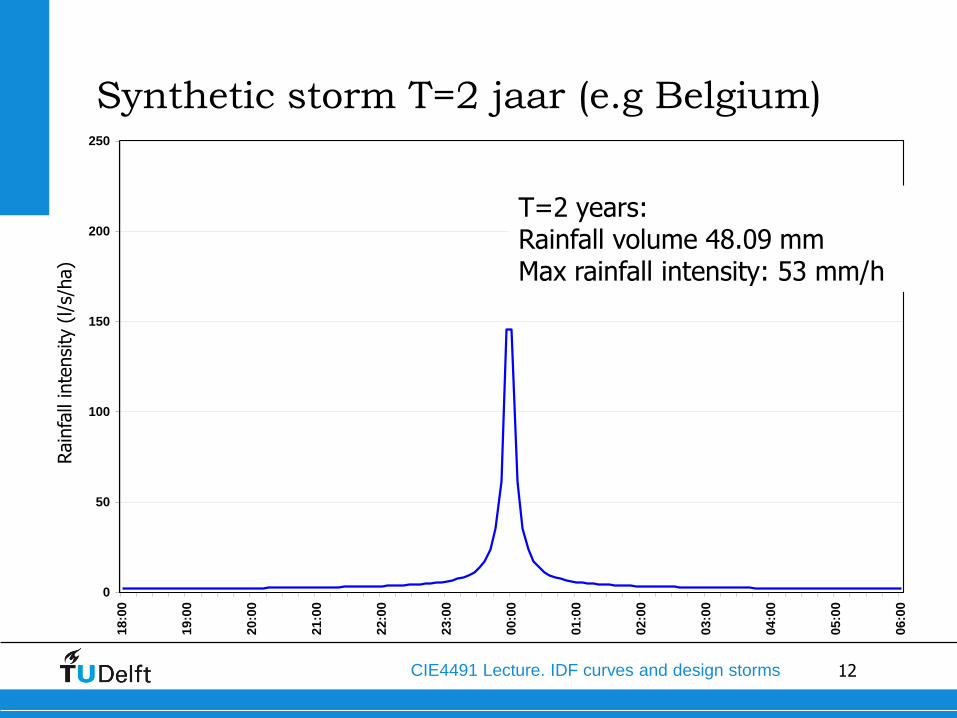
Synthetic storm T=2 jaar (e.g Belgium)
0
50
100
150
200
250
18:0
0
19:0
0
20:0
0
21:0
0
22:0
0
23:0
0
00:0
0
01:0
0
02:0
0
03:0
0
04:0
0
05:0
0
06:0
0
nee
rsla
g [
l/s
.ha
]Rain
fall
inte
nsi
ty (
l/s/
ha)
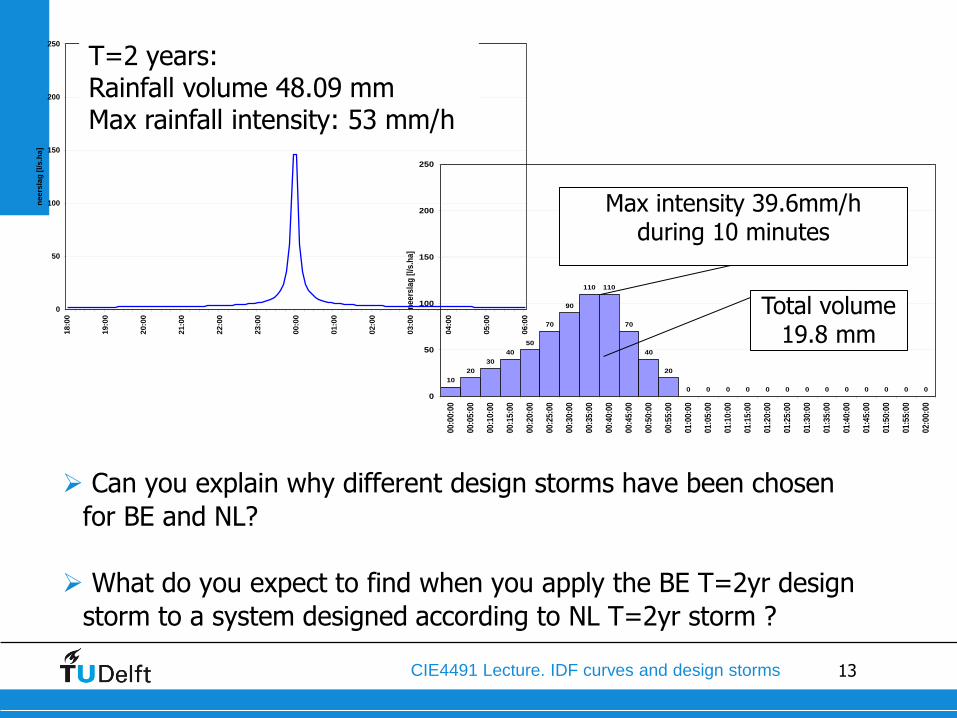
T=2 years: Rainfall volume 48.09 mm Max rainfall intensity: 53 mm/h
13 CIE4491 Lecture. IDF curves and design storms
Can you explain why different design storms have been chosen
for BE and NL?
What do you expect to find when you apply the BE T=2yr design
storm to a system designed according to NL T=2yr storm ?
10
20
30
40
50
70
90
110 110
70
40
20
0 0 0 0 0 0 0 0 0 0 0 0 00
50
100
150
200
250
00
:00
:00
00
:05
:00
00
:10
:00
00
:15
:00
00
:20
:00
00
:25
:00
00
:30
:00
00
:35
:00
00
:40
:00
00
:45
:00
00
:50
:00
00
:55
:00
01
:00
:00
01
:05
:00
01
:10
:00
01
:15
:00
01
:20
:00
01
:25
:00
01
:30
:00
01
:35
:00
01
:40
:00
01
:45
:00
01
:50
:00
01
:55
:00
02
:00
:00
ne
ers
lag
[l/
s.h
a]
Max intensity 39.6mm/h during 10 minutes
Total volume 19.8 mm
0
50
100
150
200
250
18:0
0
19:0
0
20:0
0
21:0
0
22:0
0
23:0
0
00:0
0
01:0
0
02:0
0
03:0
0
04:0
0
05:0
0
06:0
0
neers
lag
[l/
s.h
a]
T=2 years: Rainfall volume 48.09 mm Max rainfall intensity: 53 mm/h
14 CIE4491 Lecture. IDF curves and design storms
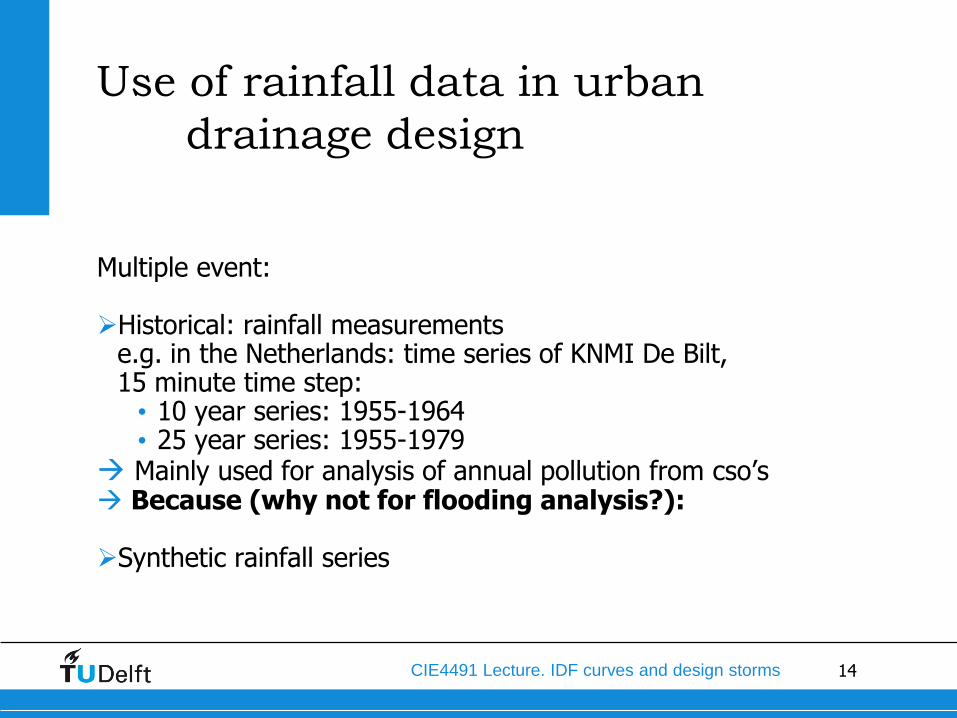
Use of rainfall data in urban
drainage design
Multiple event: Historical: rainfall measurements
e.g. in the Netherlands: time series of KNMI De Bilt, 15 minute time step: • 10 year series: 1955-1964 • 25 year series: 1955-1979
Mainly used for analysis of annual pollution from cso’s Because (why not for flooding analysis?):
Synthetic rainfall series
15 CIE4491 Lecture. IDF curves and design storms
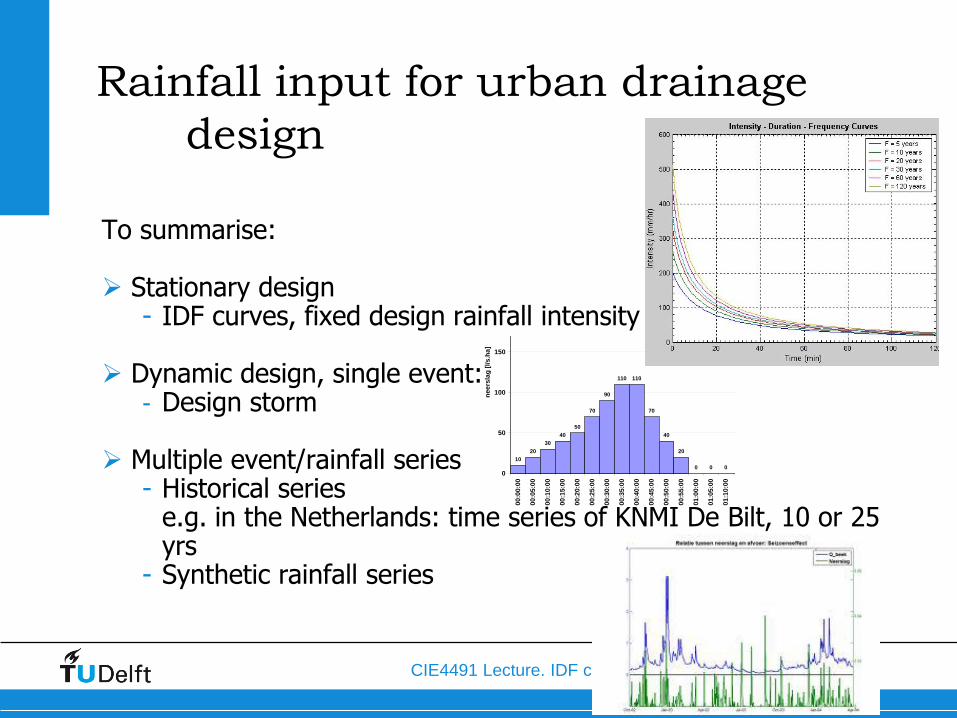
Rainfall input for urban drainage
design
To summarise: Stationary design
- IDF curves, fixed design rainfall intensity
Dynamic design, single event: - Design storm
Multiple event/rainfall series
- Historical series e.g. in the Netherlands: time series of KNMI De Bilt, 10 or 25 yrs
- Synthetic rainfall series
10
20
30
40
50
70
90
110 110
70
40
20
0 0 0 0 0 0 0 0 0 0 0 0 00
50
100
150
200
250
00
:00
:00
00
:05
:00
00
:10
:00
00
:15
:00
00
:20
:00
00
:25
:00
00
:30
:00
00
:35
:00
00
:40
:00
00
:45
:00
00
:50
:00
00
:55
:00
01
:00
:00
01
:05
:00
01
:10
:00
01
:15
:00
01
:20
:00
01
:25
:00
01
:30
:00
01
:35
:00
01
:40
:00
01
:45
:00
01
:50
:00
01
:55
:00
02
:00
:00
nee
rsla
g [
l/s
.ha
]
16 CIE4491 Lecture. IDF curves and design storms
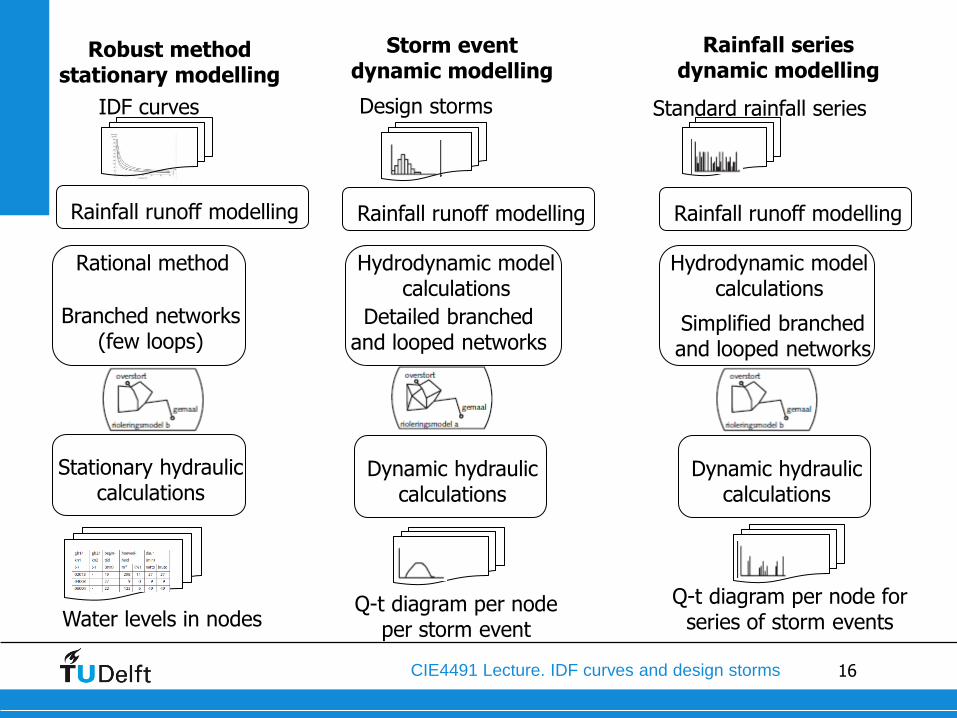
Storm event dynamic modelling
Rainfall series dynamic modelling
Robust method stationary modelling
Design storms Standard rainfall series IDF curves
Branched networks (few loops)
Rational method
Detailed branched and looped networks
Hydrodynamic model calculations
Hydrodynamic model calculations
Simplified branched and looped networks
Stationary hydraulic calculations
Dynamic hydraulic calculations
Dynamic hydraulic calculations
Water levels in nodes Q-t diagram per node
per storm event
Q-t diagram per node for series of storm events
Rainfall runoff modelling Rainfall runoff modelling Rainfall runoff modelling
17 CIE4491 Lecture. IDF curves and design storms
Rainfall-runoff processes,
urban hydrology
19 CIE4491 Lecture. IDF curves and design storms
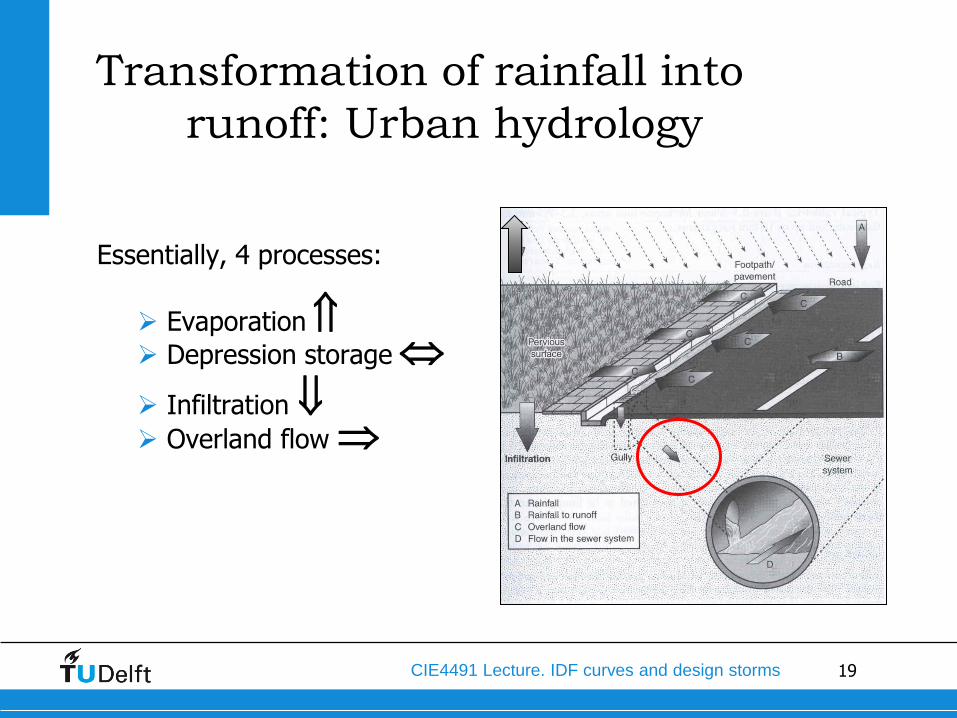
Transformation of rainfall into
runoff: Urban hydrology
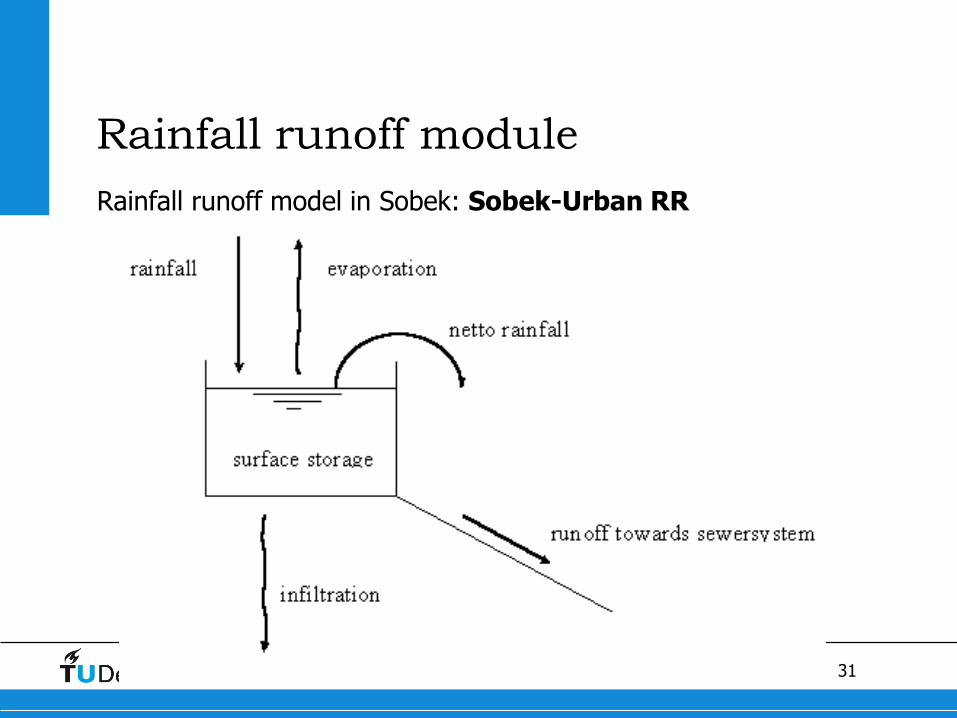
Essentially, 4 processes:
Evaporation Depression storage Infiltration Overland flow
20 CIE4491 Lecture. IDF curves and design storms
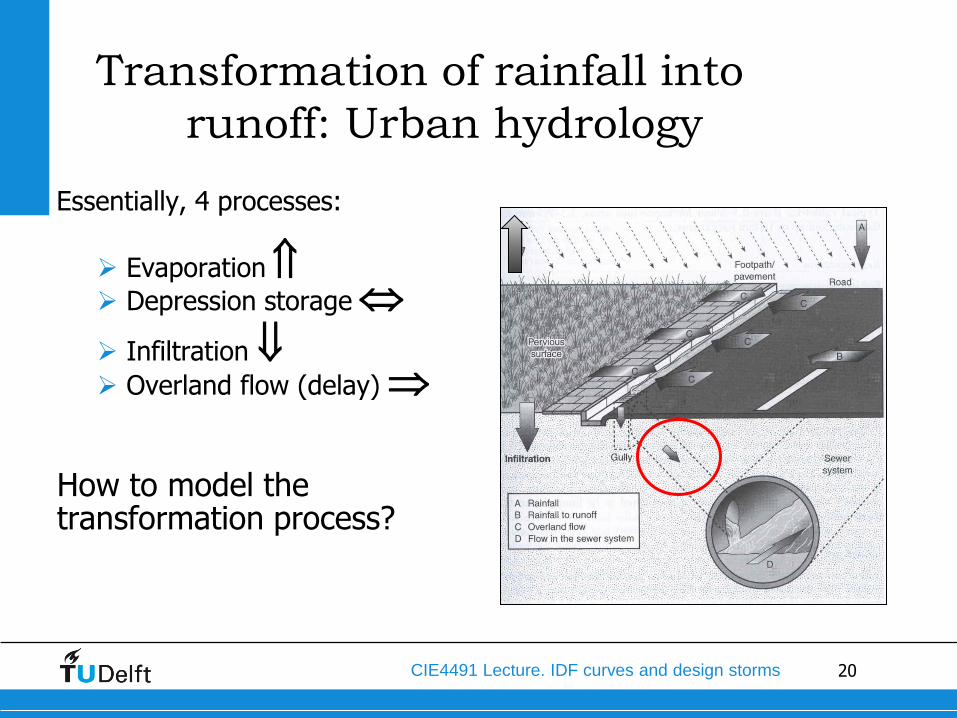
Transformation of rainfall into
runoff: Urban hydrology
Essentially, 4 processes:
Evaporation Depression storage Infiltration Overland flow (delay)
How to model the transformation process?
21 CIE4491 Lecture. IDF curves and design storms
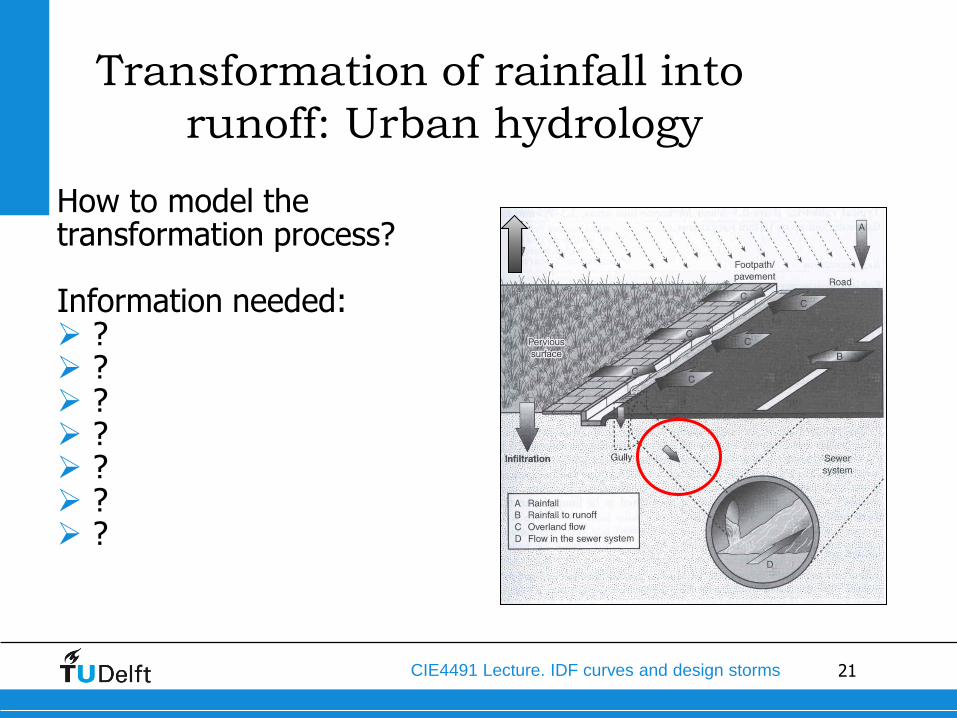
Transformation of rainfall into
runoff: Urban hydrology
How to model the transformation process? Information needed: ? ? ? ? ? ? ?
22 CIE4491 Lecture. IDF curves and design storms
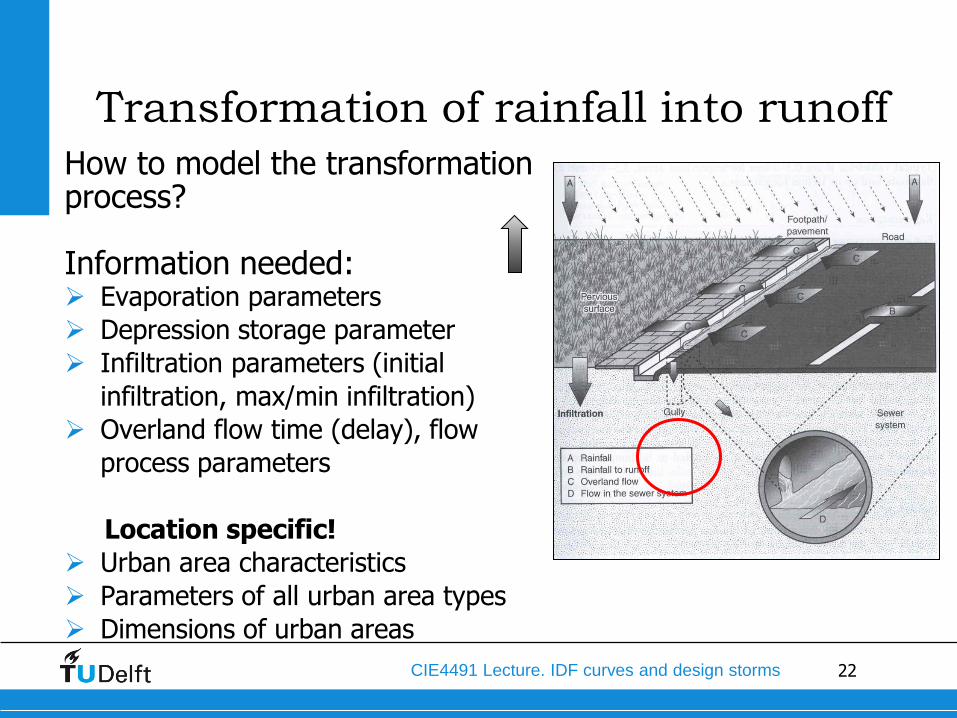
Transformation of rainfall into runoff
How to model the transformation process? Information needed: Evaporation parameters
Depression storage parameter
Infiltration parameters (initial
infiltration, max/min infiltration)
Overland flow time (delay), flow
process parameters
Location specific!
Urban area characteristics
Parameters of all urban area types
Dimensions of urban areas
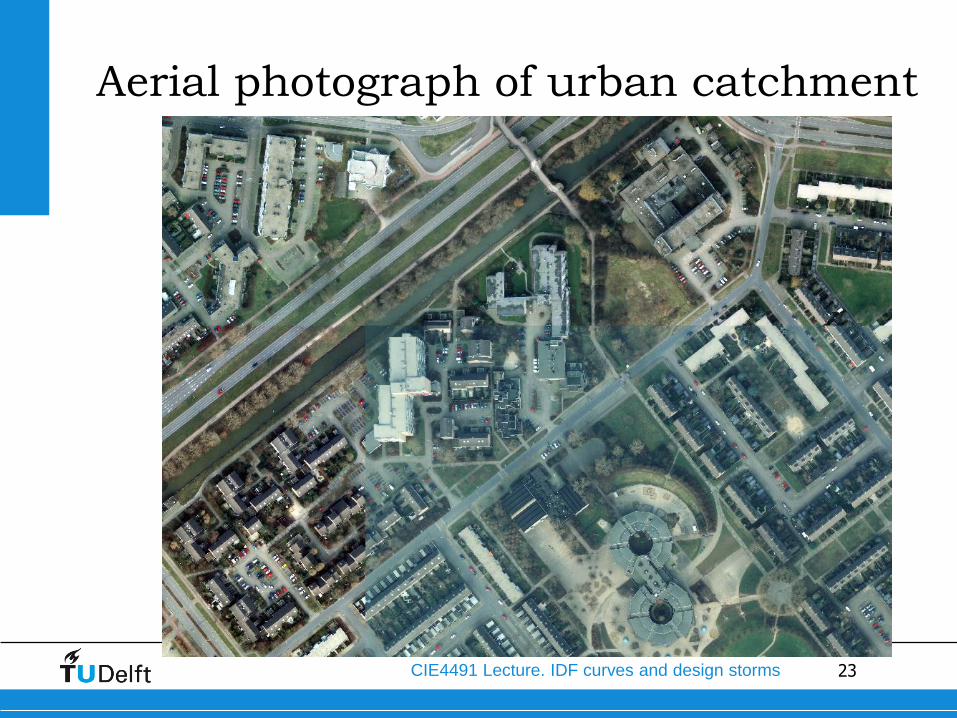
23 CIE4491 Lecture. IDF curves and design storms
Aerial photograph of urban catchment
24 CIE4491 Lecture. IDF curves and design storms
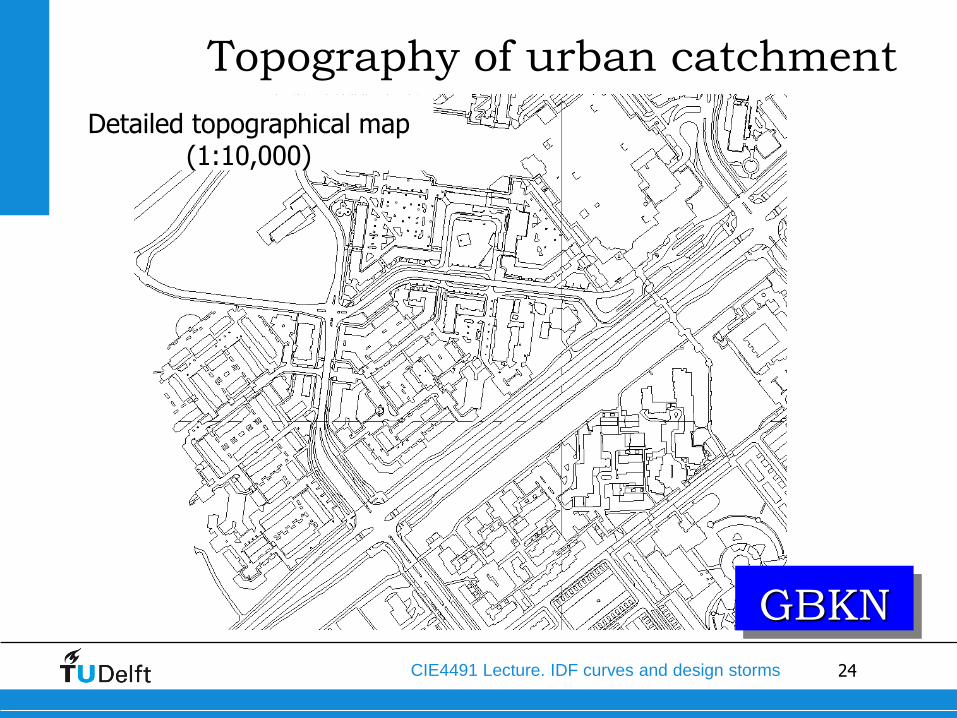
GBKN
Topography of urban catchment
Detailed topographical map (1:10,000)
25 CIE4491 Lecture. IDF curves and design storms
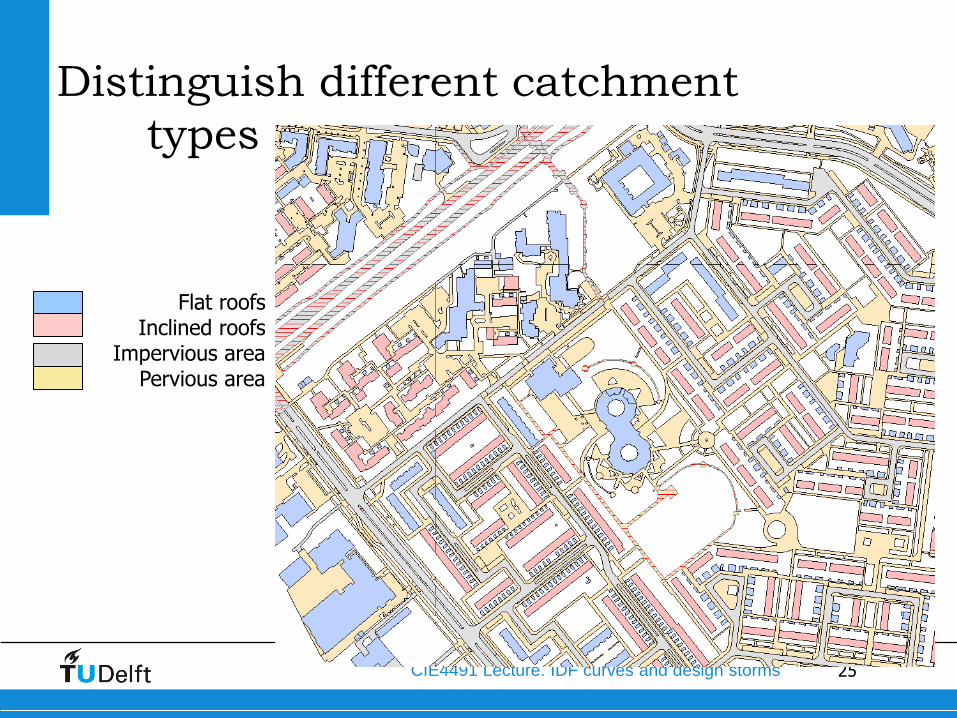
Distinguish different catchment
types
Flat roofs Inclined roofs
Impervious area Pervious area
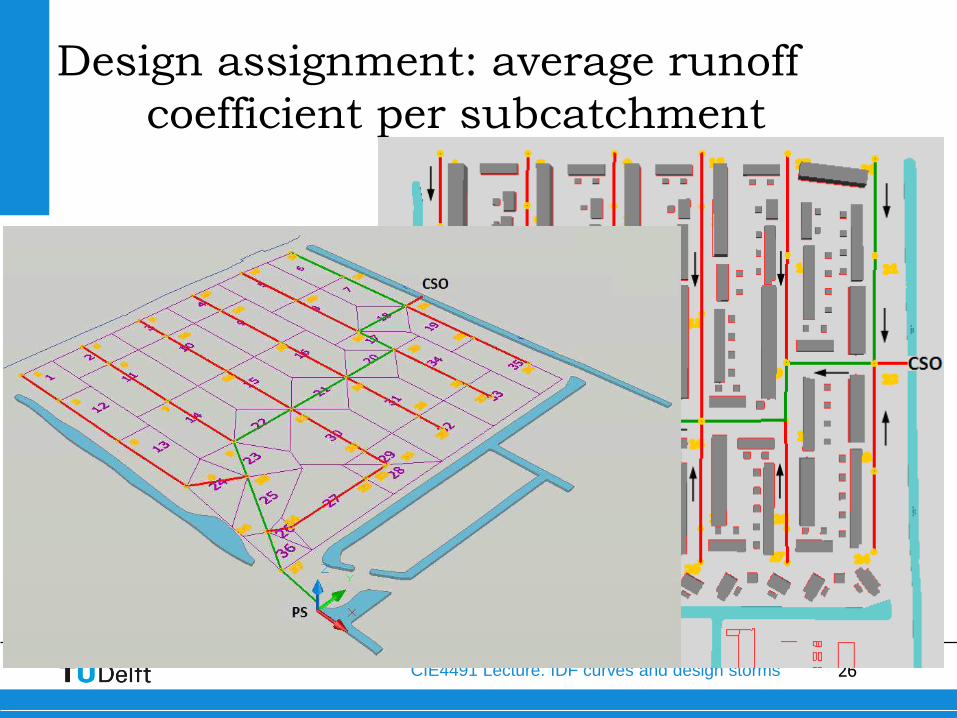
26 CIE4491 Lecture. IDF curves and design storms
Design assignment: average runoff
coefficient per subcatchment
27 CIE4491 Lecture. IDF curves and design storms
28 CIE4491 Lecture. IDF curves and design storms
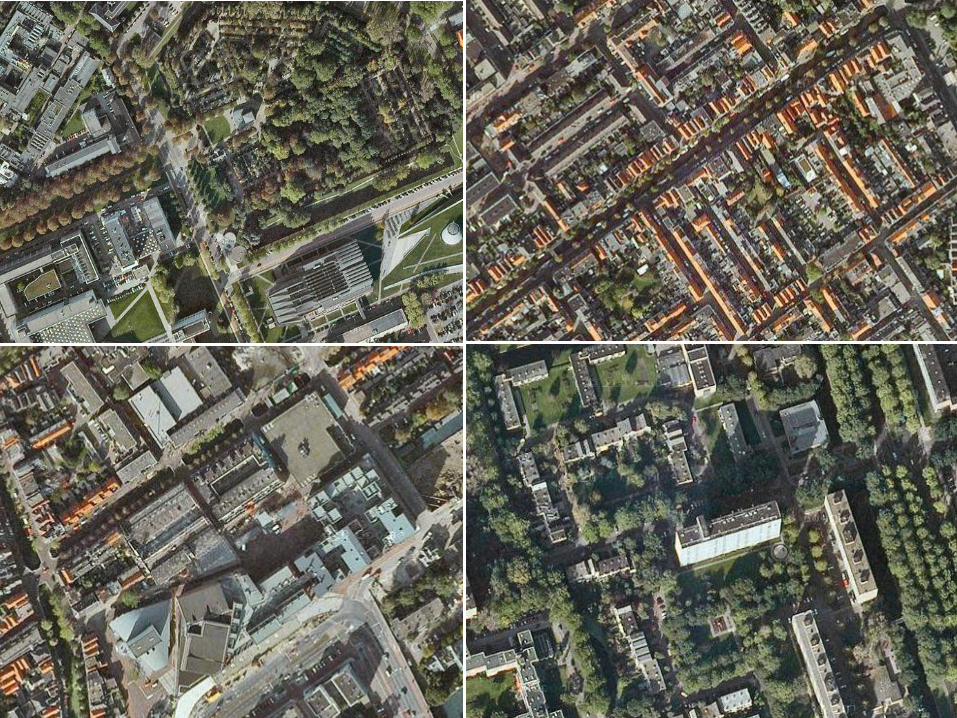
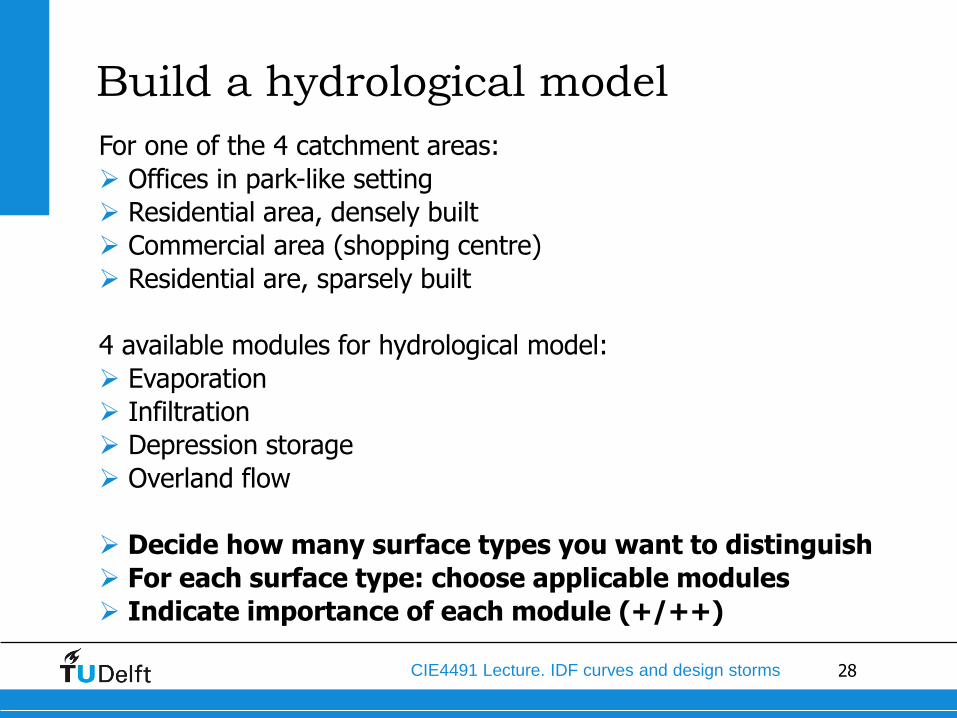
Build a hydrological model
For one of the 4 catchment areas:
Offices in park-like setting
Residential area, densely built
Commercial area (shopping centre)
Residential are, sparsely built
4 available modules for hydrological model:
Evaporation
Infiltration
Depression storage
Overland flow
Decide how many surface types you want to distinguish
For each surface type: choose applicable modules
Indicate importance of each module (+/++)
29 CIE4491 Lecture. IDF curves and design storms
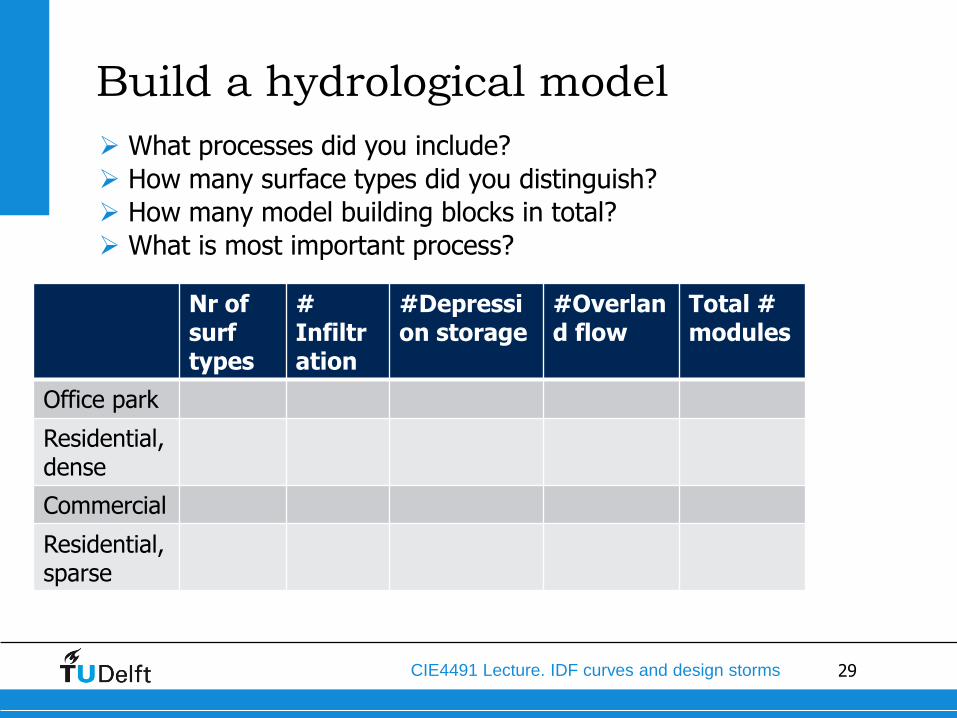
Build a hydrological model
What processes did you include?
How many surface types did you distinguish?
How many model building blocks in total?
What is most important process?
Nr of surf types
# Infiltration
#Depression storage
#Overland flow
Total # modules
Office park
Residential, dense
Commercial
Residential, sparse
30 CIE4491 Lecture. IDF curves and design storms
Rainfall-runoff processes,
representation in hydrodynamic
models
31 CIE4491 Lecture. IDF curves and design storms
Rainfall runoff module
Rainfall runoff model in Sobek: Sobek-Urban RR
32 CIE4491 Lecture. IDF curves and design storms
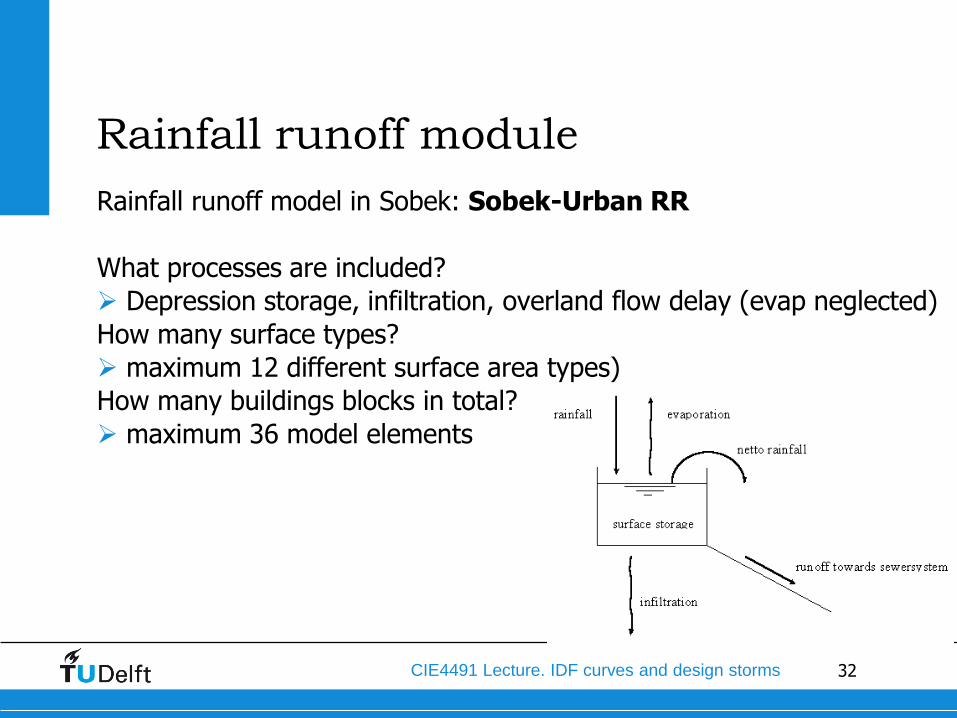
Rainfall runoff module
Rainfall runoff model in Sobek: Sobek-Urban RR
What processes are included?
Depression storage, infiltration, overland flow delay (evap neglected)
How many surface types?
maximum 12 different surface area types)
How many buildings blocks in total?
maximum 36 model elements
33 CIE4491 Lecture. IDF curves and design storms
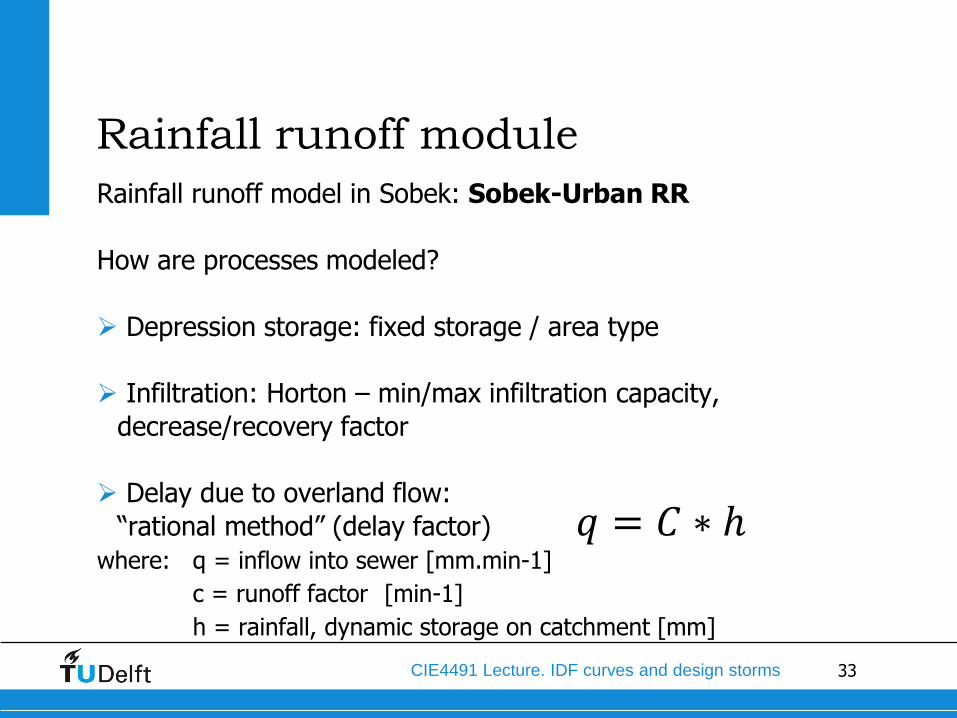
Rainfall runoff module
Rainfall runoff model in Sobek: Sobek-Urban RR
How are processes modeled?
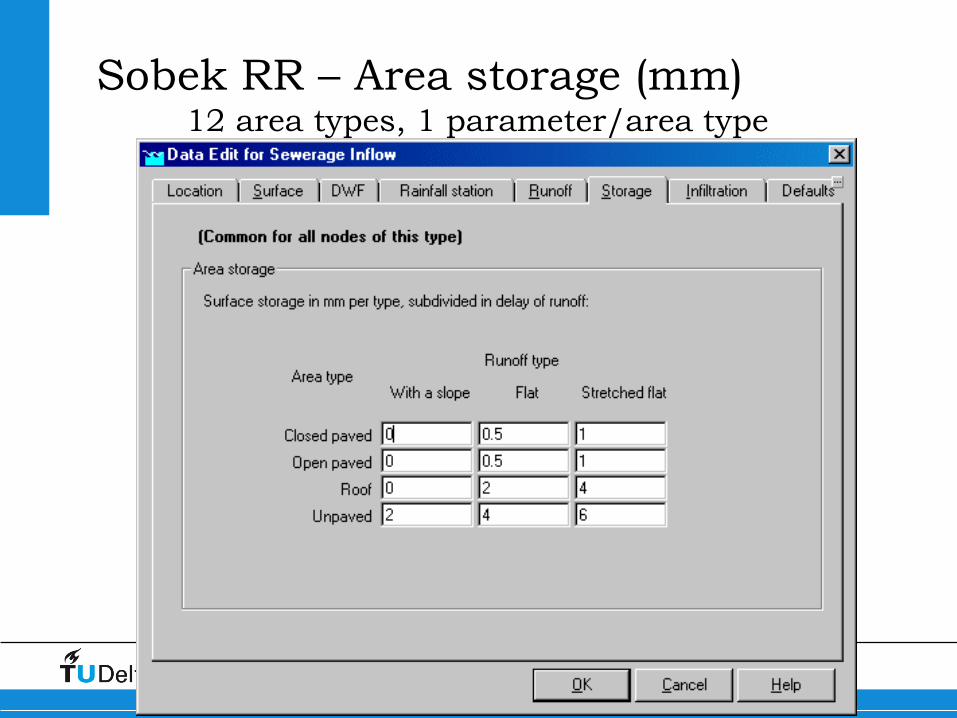
Depression storage: fixed storage / area type
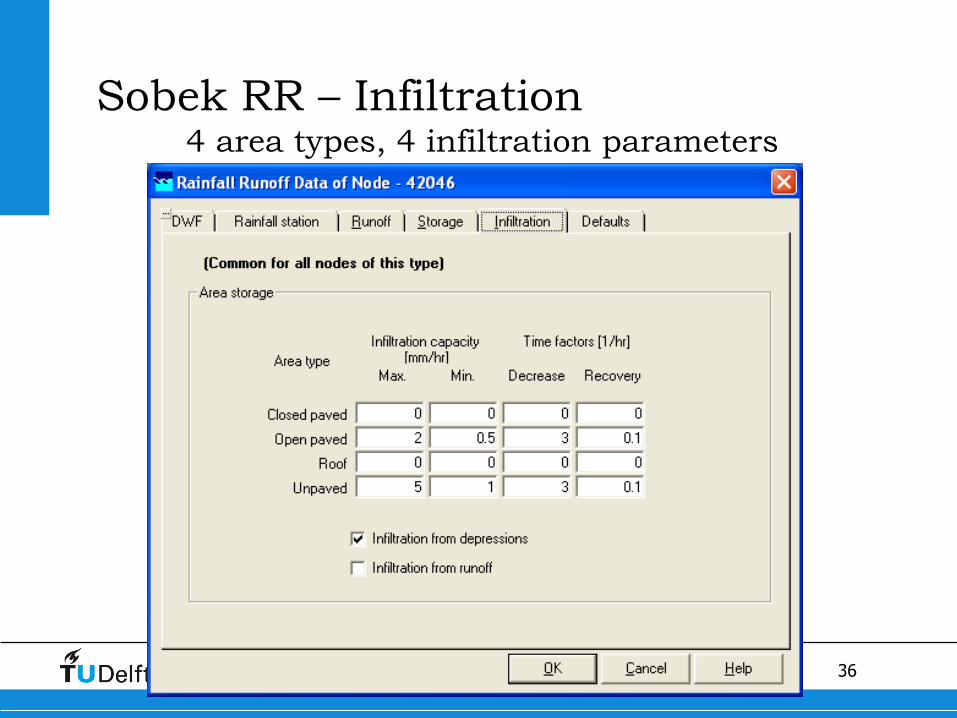
Infiltration: Horton – min/max infiltration capacity,
decrease/recovery factor
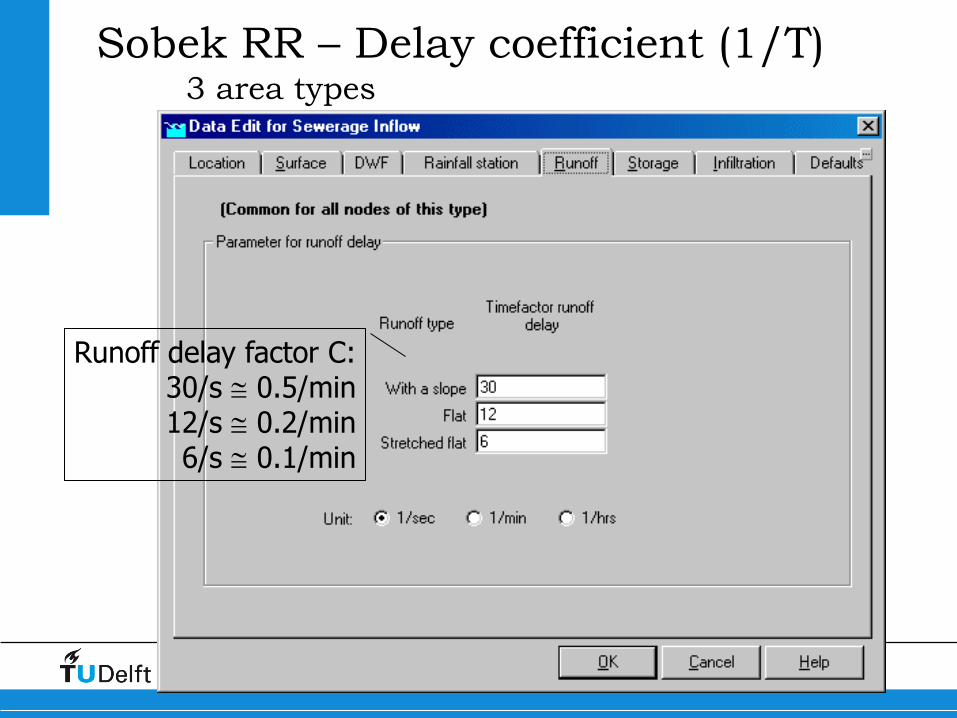
Delay due to overland flow:
“rational method” (delay factor) 𝑞 = 𝐶 ∗ ℎ
where: q = inflow into sewer [mm.min-1]
c = runoff factor [min-1]
h = rainfall, dynamic storage on catchment [mm]
34 CIE4491 Lecture. IDF curves and design storms
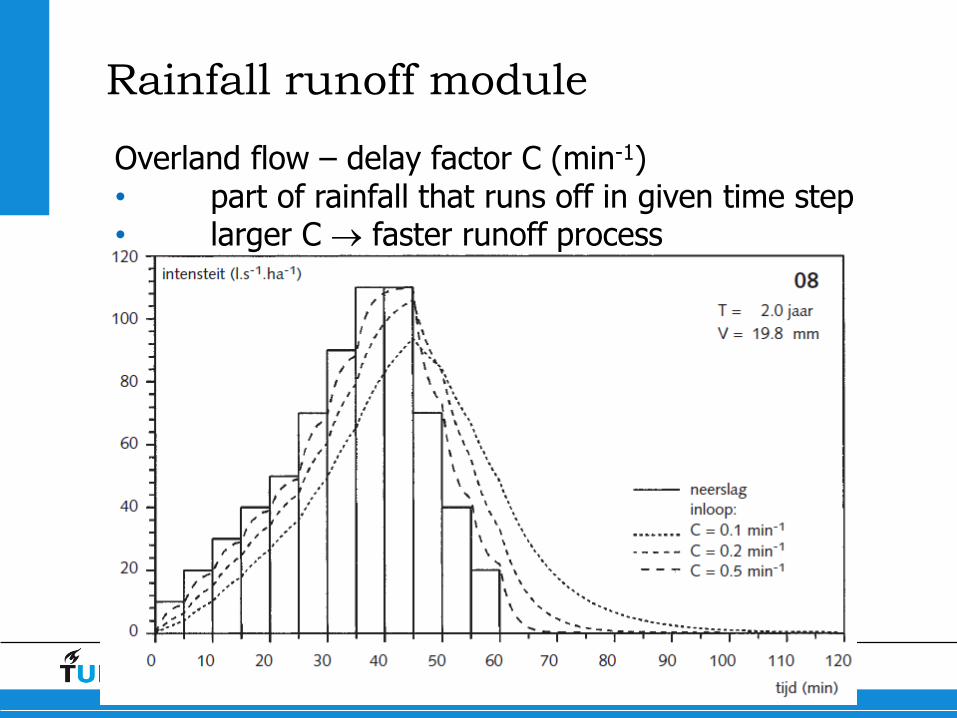
Overland flow – delay factor C (min-1) • part of rainfall that runs off in given time step • larger C faster runoff process
Rainfall runoff module
35 CIE4491 Lecture. IDF curves and design storms
Sobek RR – Area storage (mm) 12 area types, 1 parameter/area type
36 CIE4491 Lecture. IDF curves and design storms
Sobek RR – Infiltration 4 area types, 4 infiltration parameters
37 CIE4491 Lecture. IDF curves and design storms
Sobek RR – Delay coefficient (1/T) 3 area types
Runoff delay factor C: 30/s 0.5/min 12/s 0.2/min 6/s 0.1/min
38 CIE4491 Lecture. IDF curves and design storms
Rainfall runoff module
Rainfall runoff model in Infoworks CS:
Several options:
Fixed percentage runoff: portion of rainfall that translates into
flow
OR: 3 runoff processes
Area storage
Infiltration (Horton, Green-Ampt)
Delay due to overland flow – several options:
- Several types of unit hydrograph
- Reservoir model
- “Rational method” (delay factor)
39 CIE4491 Lecture. IDF curves and design storms
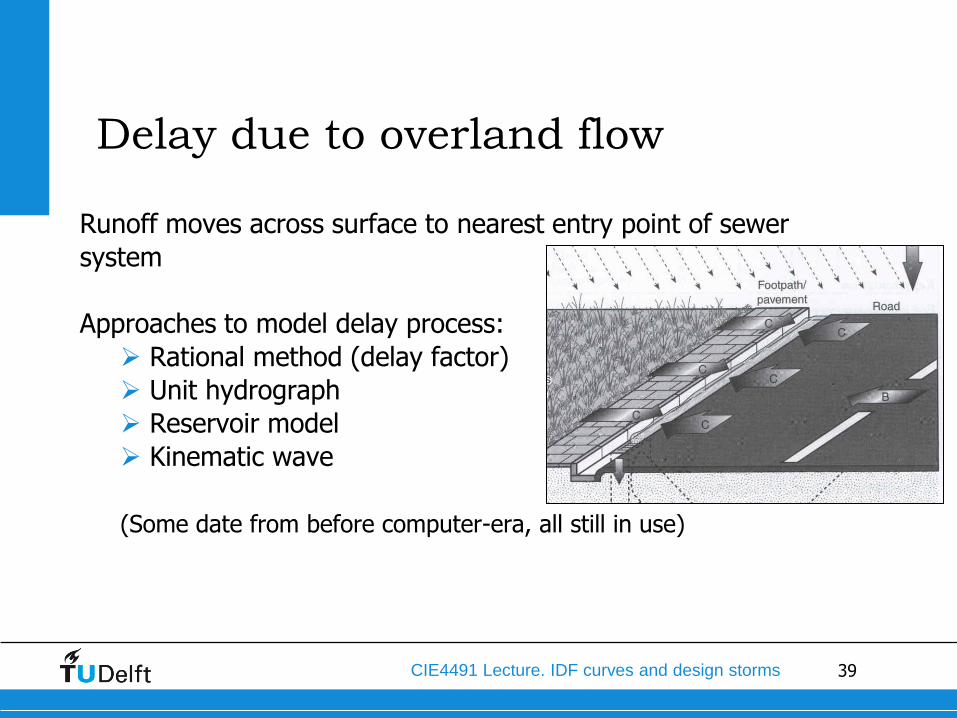
Delay due to overland flow
Runoff moves across surface to nearest entry point of sewer
system
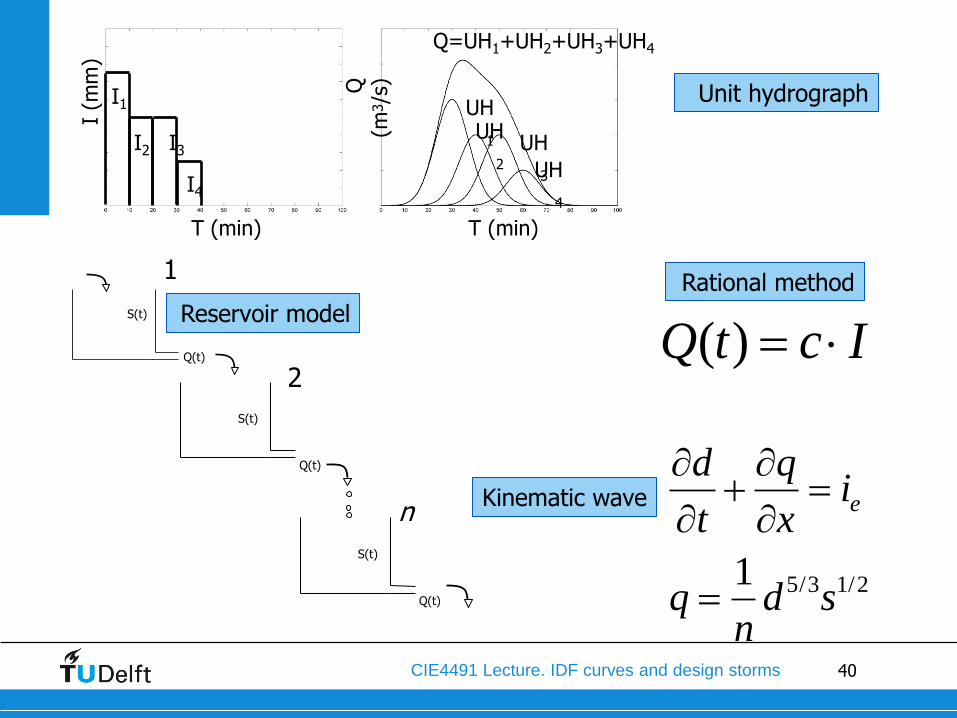
Approaches to model delay process:
Rational method (delay factor)
Unit hydrograph
Reservoir model
Kinematic wave
(Some date from before computer-era, all still in use)
40 CIE4491 Lecture. IDF curves and design storms
T (min) T (min)
I (m
m)
Q
(m3/s
)
I1
I2 I3
I4
UH
1 UH
2 UH
3 UH
4
Q=UH1+UH2+UH3+UH4
S(t)
Q(t)
S(t)
Q(t)
S(t)
Q(t)
2
n
1
( )Q t c I
¶+
d
t
q
xi
qn
d s
e
1 5 3 1 2/ /
Unit hydrograph
Reservoir model
Rational method
Kinematic wave
41 CIE4491 Lecture. IDF curves and design storms
Rainfall-runoff processes, runoff
model reliability
42 CIE4491 Lecture. IDF curves and design storms
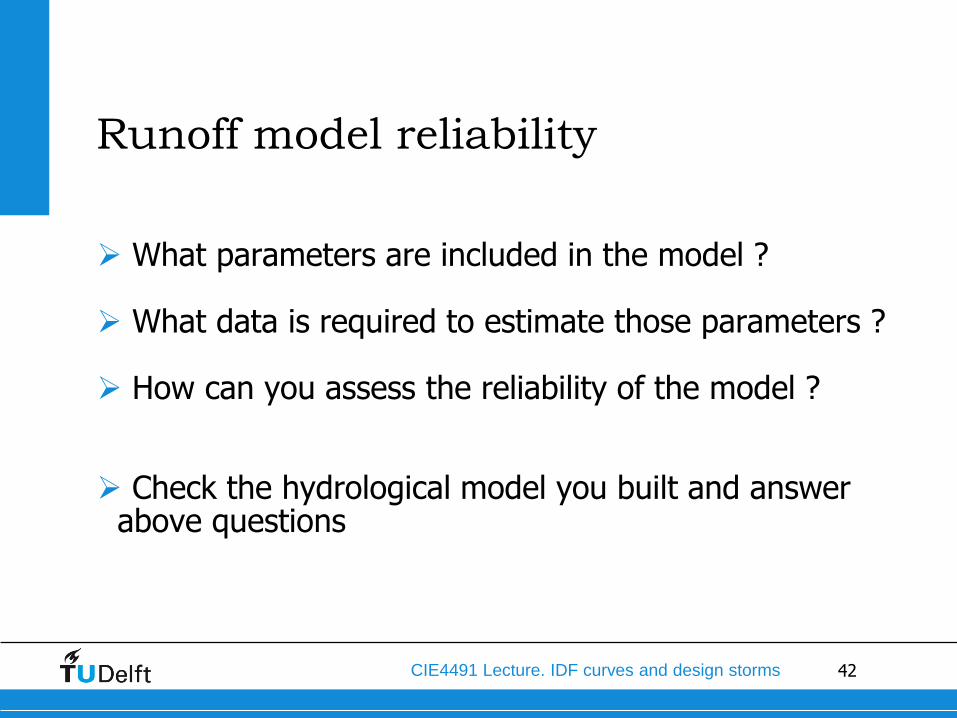
Runoff model reliability
What parameters are included in the model ?
What data is required to estimate those parameters ?
How can you assess the reliability of the model ?
Check the hydrological model you built and answer above questions
43 CIE4491 Lecture. IDF curves and design storms
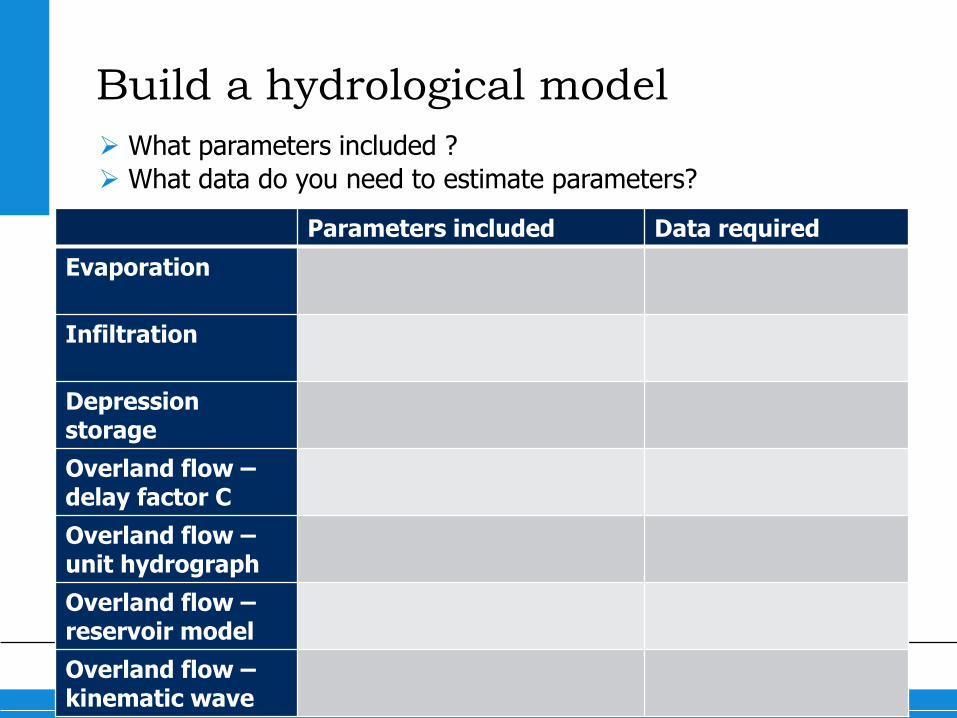
Build a hydrological model
What parameters included ?
What data do you need to estimate parameters?
Parameters included Data required
Evaporation
Infiltration
Depression storage
Overland flow – delay factor C
Overland flow – unit hydrograph
Overland flow – reservoir model
Overland flow – kinematic wave
44 CIE4491 Lecture. IDF curves and design storms
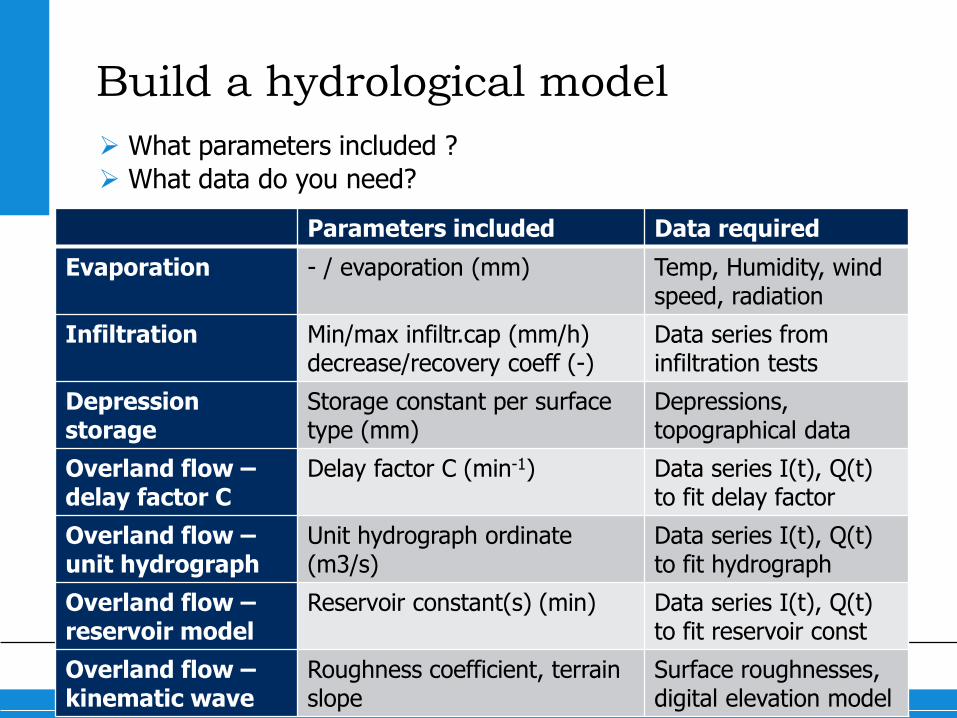
Build a hydrological model
What parameters included ?
What data do you need?
Parameters included Data required
Evaporation - / evaporation (mm) Temp, Humidity, wind speed, radiation
Infiltration
Min/max infiltr.cap (mm/h) decrease/recovery coeff (-)
Data series from infiltration tests
Depression storage
Storage constant per surface type (mm)
Depressions, topographical data
Overland flow – delay factor C
Delay factor C (min-1) Data series I(t), Q(t) to fit delay factor
Overland flow – unit hydrograph
Unit hydrograph ordinate (m3/s)
Data series I(t), Q(t) to fit hydrograph
Overland flow – reservoir model
Reservoir constant(s) (min) Data series I(t), Q(t) to fit reservoir const
Overland flow – kinematic wave
Roughness coefficient, terrain slope
Surface roughnesses, digital elevation model
45 CIE4491 Lecture. IDF curves and design storms
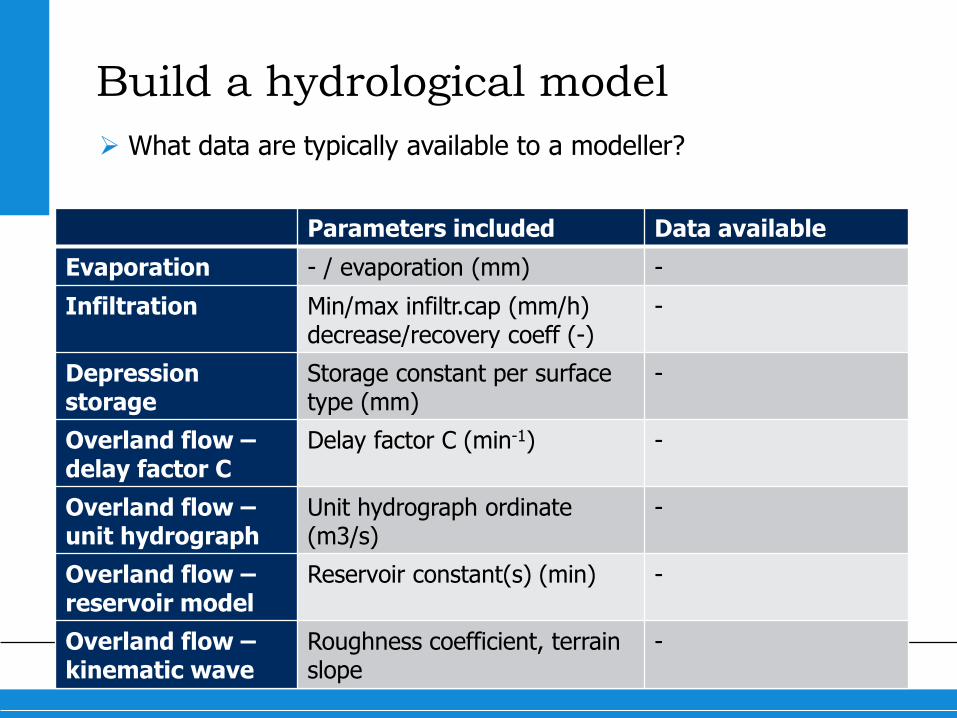
Build a hydrological model
What data are typically available to a modeller?
Parameters included Data available
Evaporation - / evaporation (mm) -
Infiltration
Min/max infiltr.cap (mm/h) decrease/recovery coeff (-)
-
Depression storage
Storage constant per surface type (mm)
-
Overland flow – delay factor C
Delay factor C (min-1) -
Overland flow – unit hydrograph
Unit hydrograph ordinate (m3/s)
-
Overland flow – reservoir model
Reservoir constant(s) (min) -
Overland flow – kinematic wave
Roughness coefficient, terrain slope
-
46 CIE4491 Lecture. IDF curves and design storms
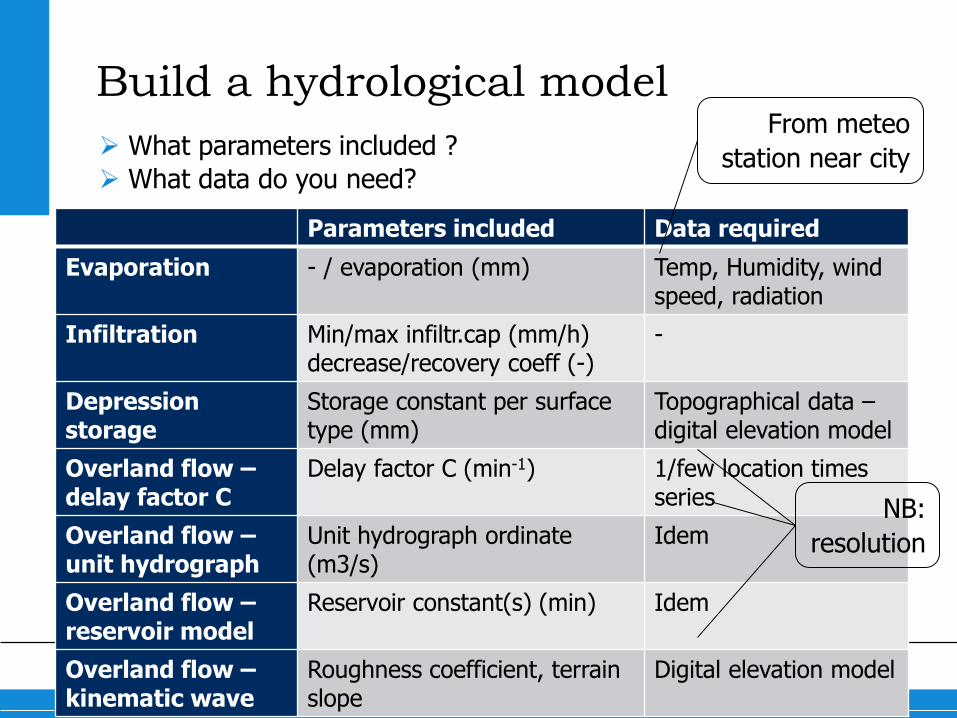
Build a hydrological model
What parameters included ?
What data do you need?
Parameters included Data required
Evaporation - / evaporation (mm) Temp, Humidity, wind speed, radiation
Infiltration
Min/max infiltr.cap (mm/h) decrease/recovery coeff (-)
-
Depression storage
Storage constant per surface type (mm)
Topographical data – digital elevation model
Overland flow – delay factor C
Delay factor C (min-1) 1/few location times series
Overland flow – unit hydrograph
Unit hydrograph ordinate (m3/s)
Idem
Overland flow – reservoir model
Reservoir constant(s) (min) Idem
Overland flow – kinematic wave
Roughness coefficient, terrain slope
Digital elevation model
From meteo
station near city
NB:
resolution
47 CIE4491 Lecture. IDF curves and design storms
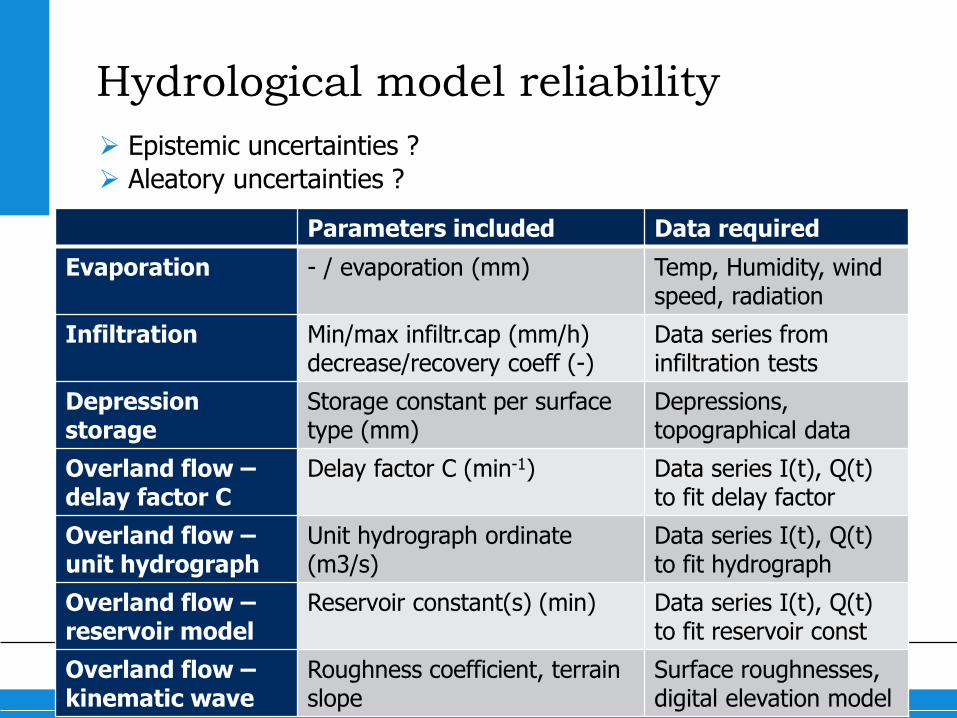
Hydrological model reliability
Epistemic uncertainties ?
Aleatory uncertainties ?
Parameters included Data required
Evaporation - / evaporation (mm) Temp, Humidity, wind speed, radiation
Infiltration
Min/max infiltr.cap (mm/h) decrease/recovery coeff (-)
Data series from infiltration tests
Depression storage
Storage constant per surface type (mm)
Depressions, topographical data
Overland flow – delay factor C
Delay factor C (min-1) Data series I(t), Q(t) to fit delay factor
Overland flow – unit hydrograph
Unit hydrograph ordinate (m3/s)
Data series I(t), Q(t) to fit hydrograph
Overland flow – reservoir model
Reservoir constant(s) (min) Data series I(t), Q(t) to fit reservoir const
Overland flow – kinematic wave
Roughness coefficient, terrain slope
Surface roughnesses, digital elevation model
48 CIE4491 Lecture. IDF curves and design storms
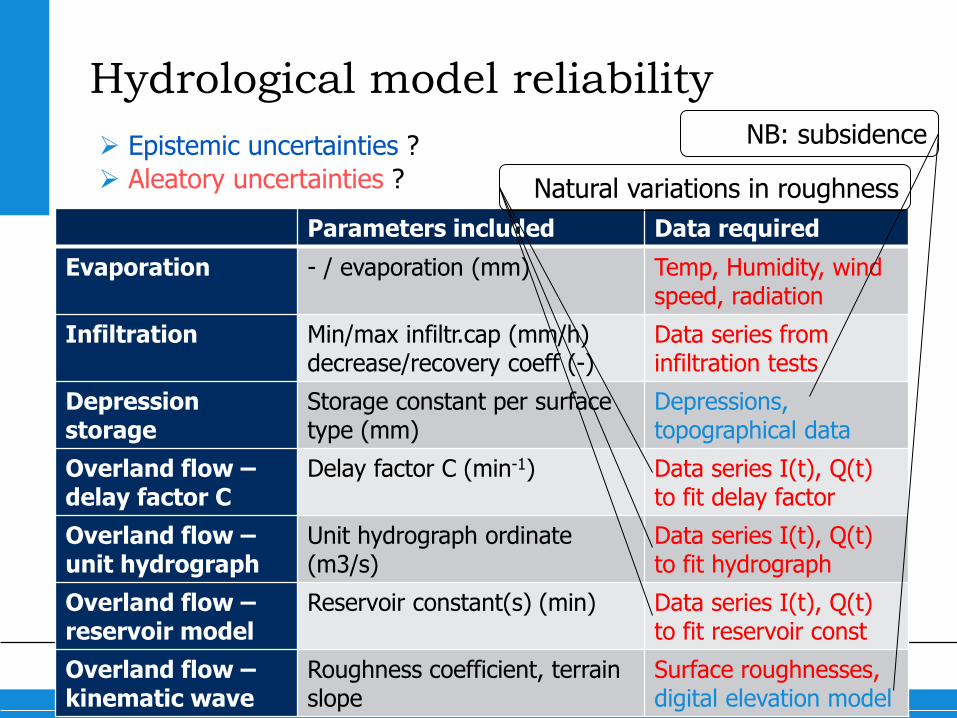
Hydrological model reliability
Epistemic uncertainties ?
Aleatory uncertainties ?
Parameters included Data required
Evaporation - / evaporation (mm) Temp, Humidity, wind speed, radiation
Infiltration
Min/max infiltr.cap (mm/h) decrease/recovery coeff (-)
Data series from infiltration tests
Depression storage
Storage constant per surface type (mm)
Depressions, topographical data
Overland flow – delay factor C
Delay factor C (min-1) Data series I(t), Q(t) to fit delay factor
Overland flow – unit hydrograph
Unit hydrograph ordinate (m3/s)
Data series I(t), Q(t) to fit hydrograph
Overland flow – reservoir model
Reservoir constant(s) (min) Data series I(t), Q(t) to fit reservoir const
Overland flow – kinematic wave
Roughness coefficient, terrain slope
Surface roughnesses, digital elevation model
NB: subsidence
Natural variations in roughness
49 CIE4491 Lecture. IDF curves and design storms
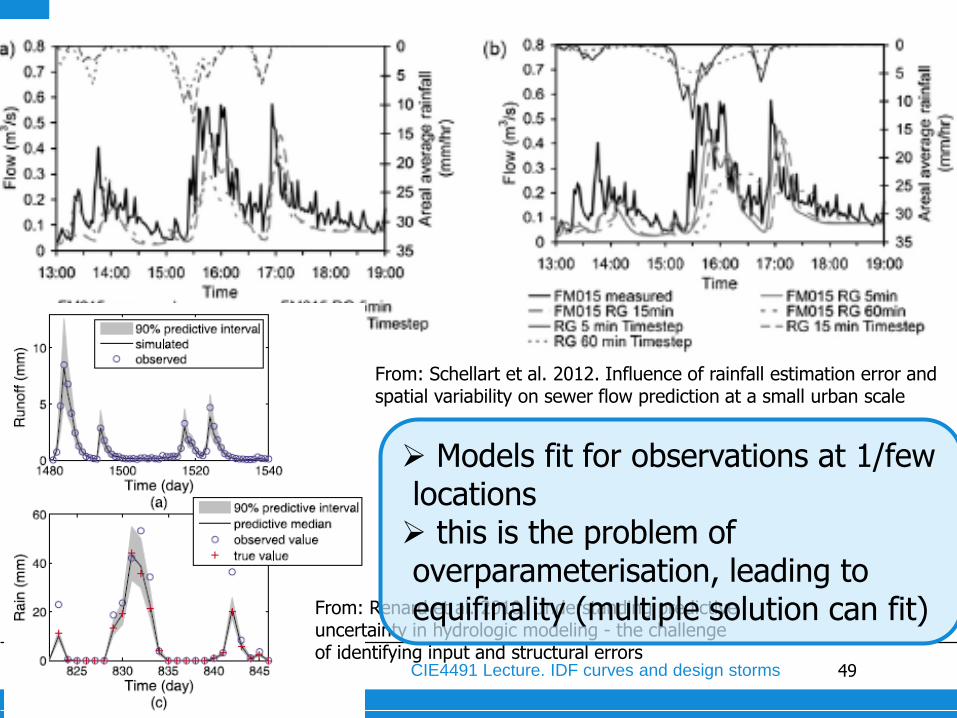
From: Schellart et al. 2012. Influence of rainfall estimation error and spatial variability on sewer flow prediction at a small urban scale
From: Renard et al. 2010. Understanding predictive uncertainty in hydrologic modeling - the challenge of identifying input and structural errors
Models fit for observations at 1/few locations this is the problem of overparameterisation, leading to equifinality (multiple solution can fit)
50 CIE4491 Lecture. IDF curves and design storms
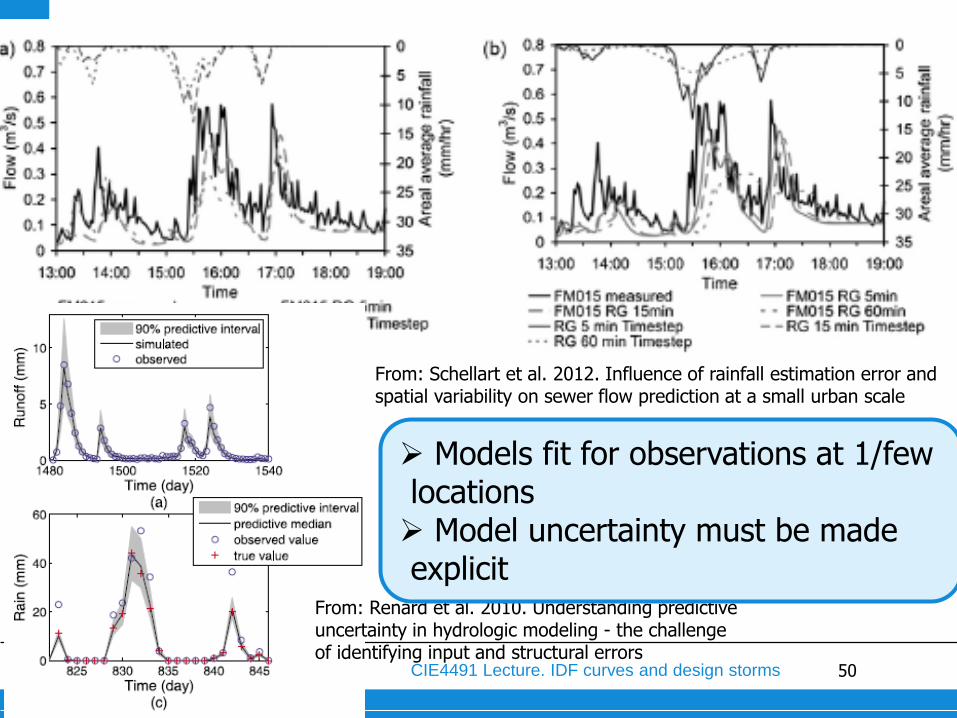
From: Schellart et al. 2012. Influence of rainfall estimation error and spatial variability on sewer flow prediction at a small urban scale
From: Renard et al. 2010. Understanding predictive uncertainty in hydrologic modeling - the challenge of identifying input and structural errors
Models fit for observations at 1/few locations Model uncertainty must be made explicit