Embed Size (px)
Citation preview
2016
Annual Citizen Satisfaction Survey Report
Calgary Police Commission
CONTENTS
In t roduct ion
C i t i zen Percept ions o f Cr ime & Sa fe ty
C i t i zen Percept ions o f the CPS
Conf idence in the CPS
Contact w i th the CPS and V ic t imizat ion
Neighbourhood T ra f f ic Sa fe ty
Unders tanding the Communi ty
3
6
10
13
33
2
Appendices 36
24
30

Introduction
3
PROJECT OBJECTIVES
4
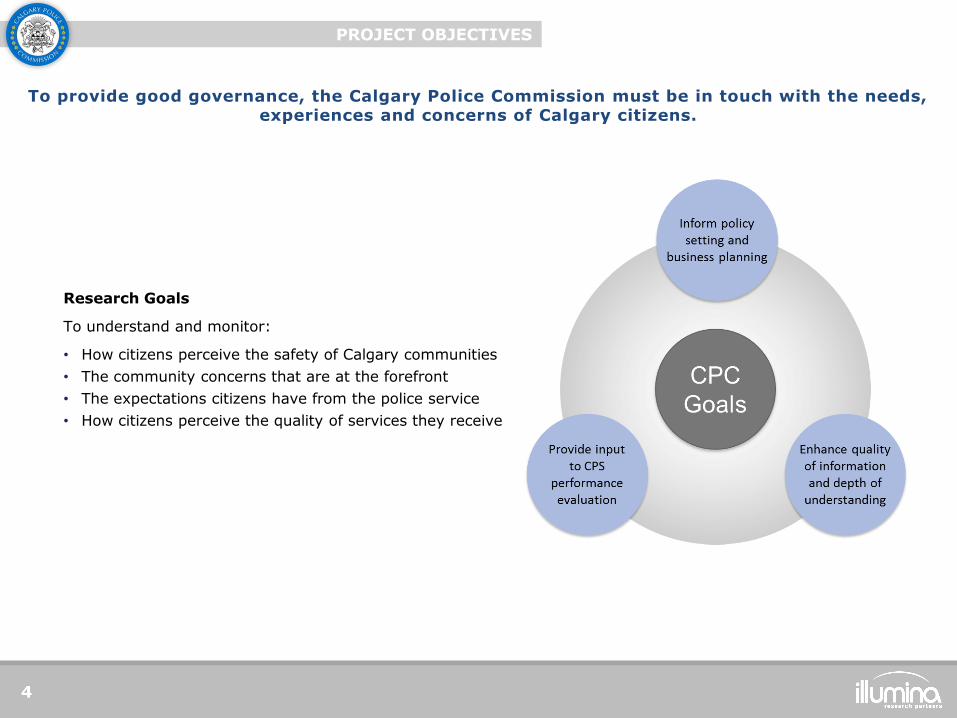
To provide good governance, the Calgary Police Commission must be in touch with the needs, experiences and concerns of Calgary citizens.
Research Goals
To understand and monitor:
• How citizens perceive the safety of Calgary communities
• The community concerns that are at the forefront
• The expectations citizens have from the police service
• How citizens perceive the quality of services they receive
RESEARCH OVERVIEW
5
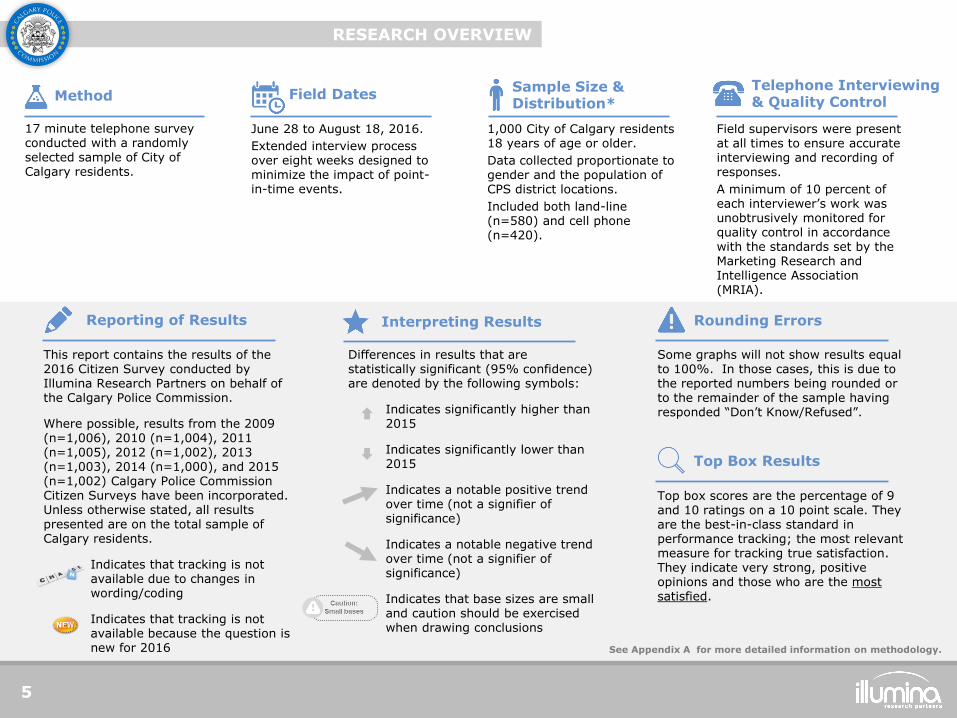
17 minute telephone survey conducted with a randomly selected sample of City of Calgary residents.
Method
June 28 to August 18, 2016.
Extended interview process over eight weeks designed to minimize the impact of point-in-time events.
Field Dates
1,000 City of Calgary residents 18 years of age or older.
Data collected proportionate to gender and the population of CPS district locations.
Included both land-line (n=580) and cell phone (n=420).
Sample Size & Distribution*
Field supervisors were present at all times to ensure accurate interviewing and recording of responses.
A minimum of 10 percent of each interviewer’s work was unobtrusively monitored for quality control in accordance with the standards set by the Marketing Research and Intelligence Association (MRIA).
Telephone Interviewing & Quality Control
This report contains the results of the 2016 Citizen Survey conducted by Illumina Research Partners on behalf of the Calgary Police Commission.
Where possible, results from the 2009 (n=1,006), 2010 (n=1,004), 2011 (n=1,005), 2012 (n=1,002), 2013 (n=1,003), 2014 (n=1,000), and 2015 (n=1,002) Calgary Police Commission Citizen Surveys have been incorporated. Unless otherwise stated, all results presented are on the total sample of Calgary residents.
Indicates that tracking is not available due to changes in wording/coding
Indicates that tracking is not available because the question is new for 2016
Reporting of Results
Differences in results that are statistically significant (95% confidence) are denoted by the following symbols:
Indicates significantly higher than 2015
Indicates significantly lower than 2015
Indicates a notable positive trend over time (not a signifier of significance)
Indicates a notable negative trend over time (not a signifier of significance)
Indicates that base sizes are small and caution should be exercised when drawing conclusions
Interpreting Results
Some graphs will not show results equal to 100%. In those cases, this is due to the reported numbers being rounded or to the remainder of the sample having responded “Don’t Know/Refused”.
Rounding Errors
See Appendix A for more detailed information on methodology.
Top Box Results
Top box scores are the percentage of 9 and 10 ratings on a 10 point scale. They are the best-in-class standard in performance tracking; the most relevant measure for tracking true satisfaction. They indicate very strong, positive opinions and those who are the most satisfied.
6
Citizen Perceptions of Crime & Safety
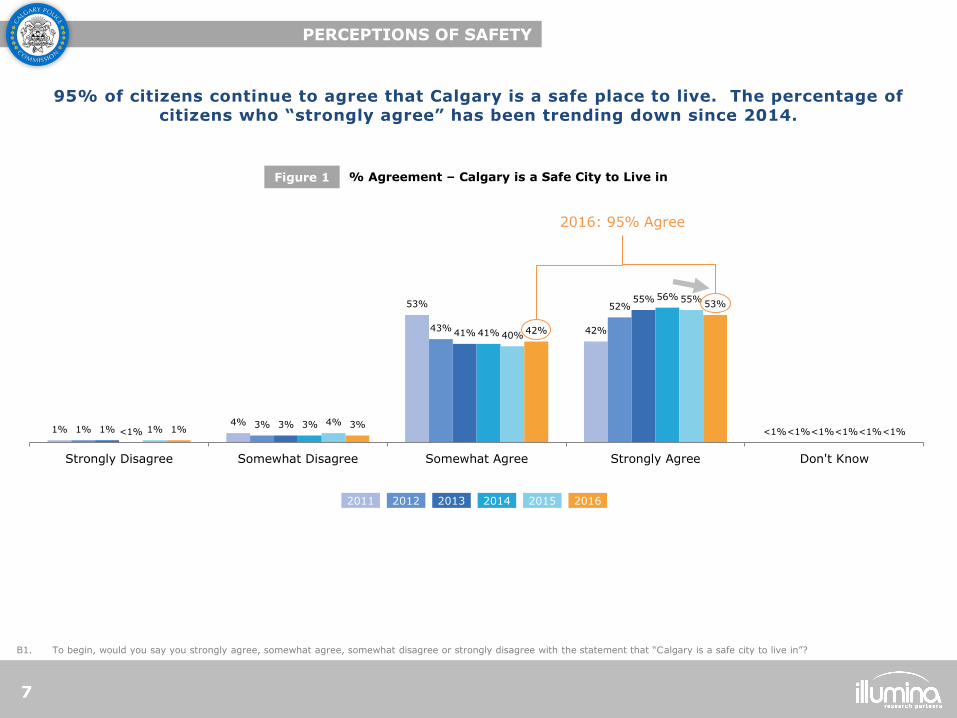
95% of citizens continue to agree that Calgary is a safe place to live. The percentage of citizens who “strongly agree” has been trending down since 2014.
% Agreement – Calgary is a Safe City to Live in Figure 1
To begin, would you say you strongly agree, somewhat agree, somewhat disagree or strongly disagree with the statement that “Calgary is a safe city to live in”? B1.
2014 2013 2011 2012 2015 2016
PERCEPTIONS OF SAFETY
7
1% 4%
53%
42%
<1% 1% 3%
43%
52%
<1% 1% 3%
41%
55%
<1% <1% 3%
41%
56%
<1% 1% 4%
40%
55%
<1% 1% 3%
42%
53%
<1%
Strongly Disagree Somewhat Disagree Somewhat Agree Strongly Agree Don't Know
2016: 95% Agree
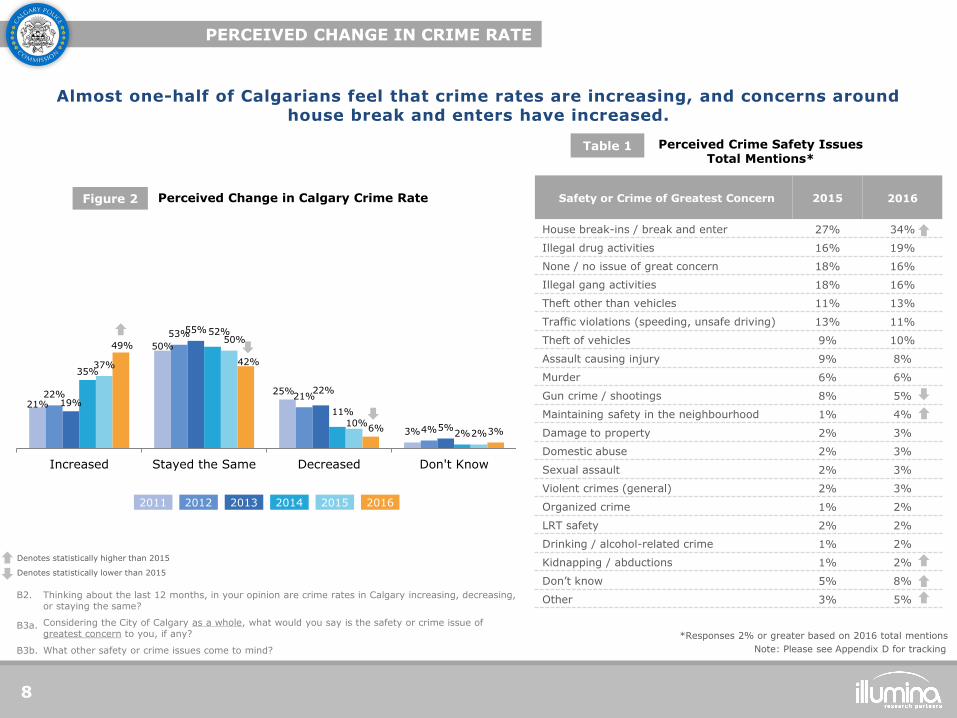
PERCEIVED CHANGE IN CRIME RATE
Perceived Change in Calgary Crime Rate Figure 2
Perceived Crime Safety Issues Total Mentions*
Table 1
Note: Please see Appendix D for tracking
Safety or Crime of Greatest Concern 2015 2016
House break-ins / break and enter 27% 34%
Illegal drug activities 16% 19%
None / no issue of great concern 18% 16%
Illegal gang activities 18% 16%
Theft other than vehicles 11% 13%
Traffic violations (speeding, unsafe driving) 13% 11%
Theft of vehicles 9% 10%
Assault causing injury 9% 8%
Murder 6% 6%
Gun crime / shootings 8% 5%
Maintaining safety in the neighbourhood 1% 4%
Damage to property 2% 3%
Domestic abuse 2% 3%
Sexual assault 2% 3%
Violent crimes (general) 2% 3%
Organized crime 1% 2%
LRT safety 2% 2%
Drinking / alcohol-related crime 1% 2%
Kidnapping / abductions 1% 2%
Don’t know 5% 8%
Other 3% 5% Thinking about the last 12 months, in your opinion are crime rates in Calgary increasing, decreasing, or staying the same?
Considering the City of Calgary as a whole, what would you say is the safety or crime issue of greatest concern to you, if any?
What other safety or crime issues come to mind?
B2.
B3a.
B3b.
8
Almost one-half of Calgarians feel that crime rates are increasing, and concerns around house break and enters have increased.
*Responses 2% or greater based on 2016 total mentions
21%
50%
25%
3%
22%
53%
21%
4%
19%
55%
22%
5%
35%
52%
11%
2%
37%
50%
10% 2%
49%
42%
6% 3%
Increased Stayed the Same Decreased Don't Know
Denotes statistically higher than 2015
Denotes statistically lower than 2015
2014 2013 2011 2012 2015 2016
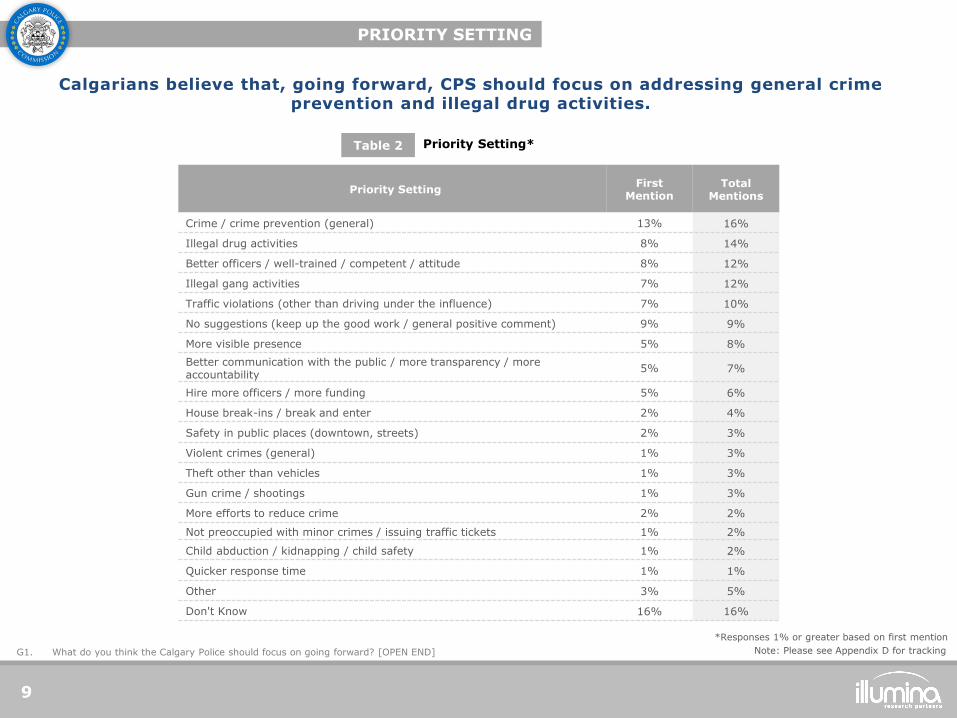
PRIORITY SETTING
9
Priority Setting* Table 2
Priority Setting First
Mention Total
Mentions
Crime / crime prevention (general) 13% 16%
Illegal drug activities 8% 14%
Better officers / well-trained / competent / attitude 8% 12%
Illegal gang activities 7% 12%
Traffic violations (other than driving under the influence) 7% 10%
No suggestions (keep up the good work / general positive comment) 9% 9%
More visible presence 5% 8%
Better communication with the public / more transparency / more accountability
5% 7%
Hire more officers / more funding 5% 6%
House break-ins / break and enter 2% 4%
Safety in public places (downtown, streets) 2% 3%
Violent crimes (general) 1% 3%
Theft other than vehicles 1% 3%
Gun crime / shootings 1% 3%
More efforts to reduce crime 2% 2%
Not preoccupied with minor crimes / issuing traffic tickets 1% 2%
Child abduction / kidnapping / child safety 1% 2%
Quicker response time 1% 1%
Other 3% 5%
Don't Know 16% 16%
What do you think the Calgary Police should focus on going forward? [OPEN END] G1.
Calgarians believe that, going forward, CPS should focus on addressing general crime prevention and illegal drug activities.
*Responses 1% or greater based on first mention
Note: Please see Appendix D for tracking
Confidence in the CPS
10
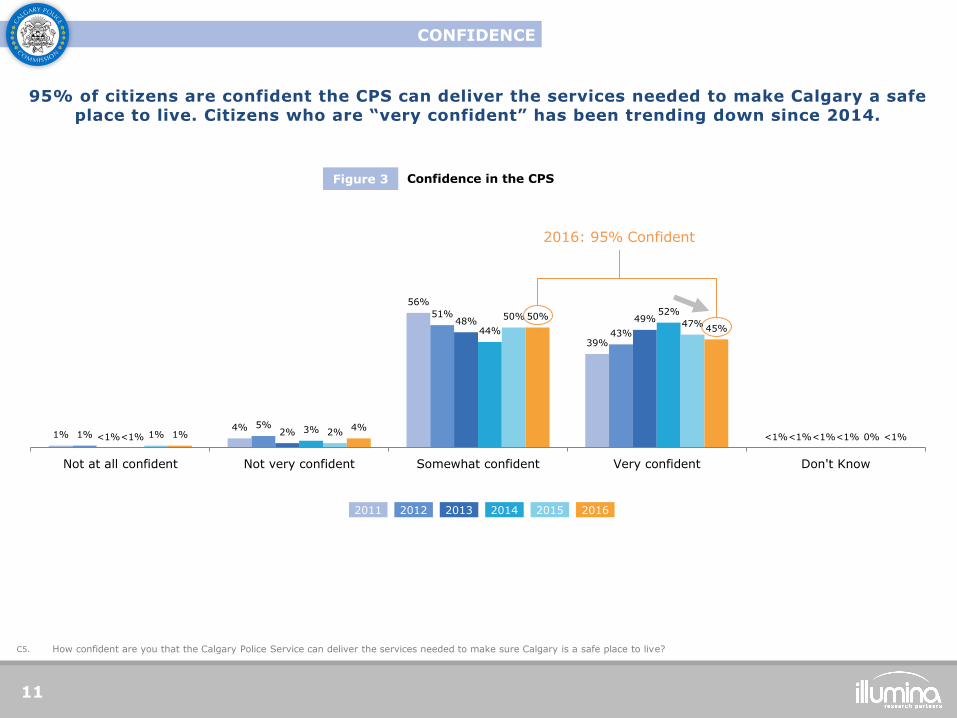
95% of citizens are confident the CPS can deliver the services needed to make Calgary a safe place to live. Citizens who are “very confident” has been trending down since 2014.
Confidence in the CPS Figure 3
How confident are you that the Calgary Police Service can deliver the services needed to make sure Calgary is a safe place to live? C5.
CONFIDENCE
11
2014 2013 2011 2012 2015 2016
1% 4%
56%
39%
<1% 1% 5%
51%
43%
<1% <1% 2%
48% 49%
<1% <1% 3%
44%
52%
<1% 1% 2%
50% 47%
0% 1% 4%
50%
45%
<1%
Not at all confident Not very confident Somewhat confident Very confident Don't Know
2016: 95% Confident
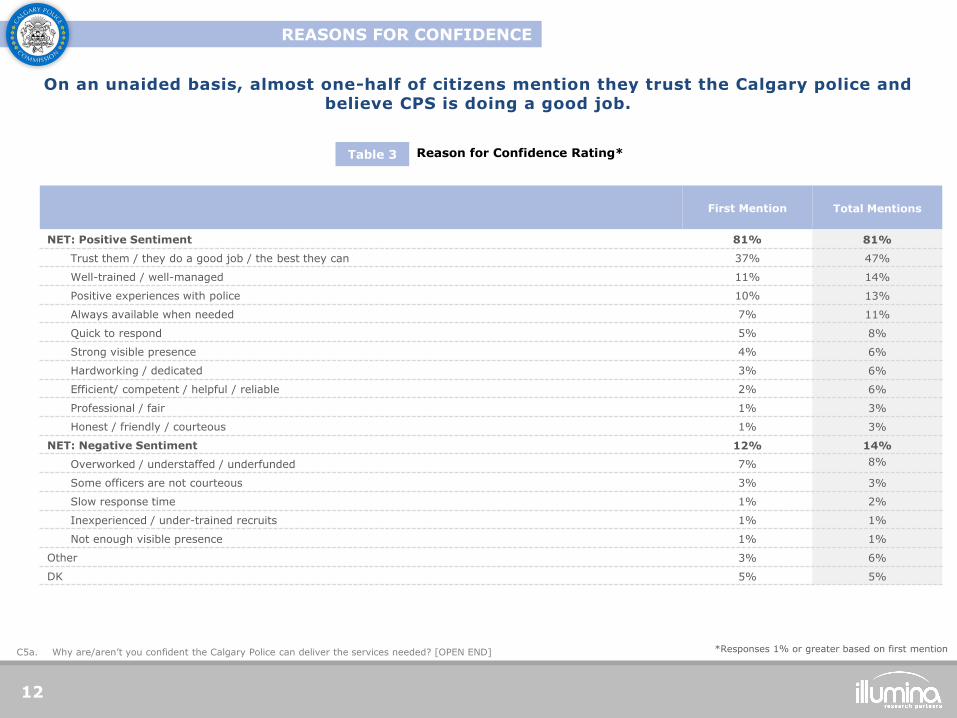
REASONS FOR CONFIDENCE
12
Reason for Confidence Rating* Table 3
First Mention Total Mentions
NET: Positive Sentiment 81% 81%
Trust them / they do a good job / the best they can 37% 47%
Well-trained / well-managed 11% 14%
Positive experiences with police 10% 13%
Always available when needed 7% 11%
Quick to respond 5% 8%
Strong visible presence 4% 6%
Hardworking / dedicated 3% 6%
Efficient/ competent / helpful / reliable 2% 6%
Professional / fair 1% 3%
Honest / friendly / courteous 1% 3%
NET: Negative Sentiment 12% 14%
Overworked / understaffed / underfunded 7% 8%
Some officers are not courteous 3% 3%
Slow response time 1% 2%
Inexperienced / under-trained recruits 1% 1%
Not enough visible presence 1% 1%
Other 3% 6%
DK 5% 5%
Why are/aren’t you confident the Calgary Police can deliver the services needed? [OPEN END] C5a.
On an unaided basis, almost one-half of citizens mention they trust the Calgary police and believe CPS is doing a good job.
*Responses 1% or greater based on first mention
Citizen Perceptions of the CPS
13
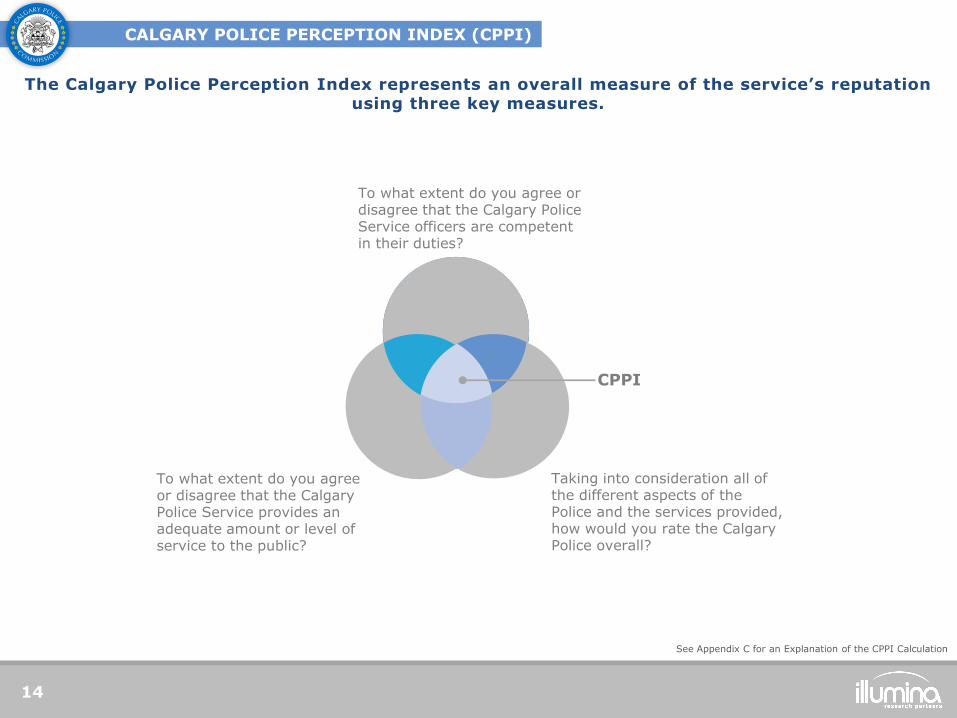
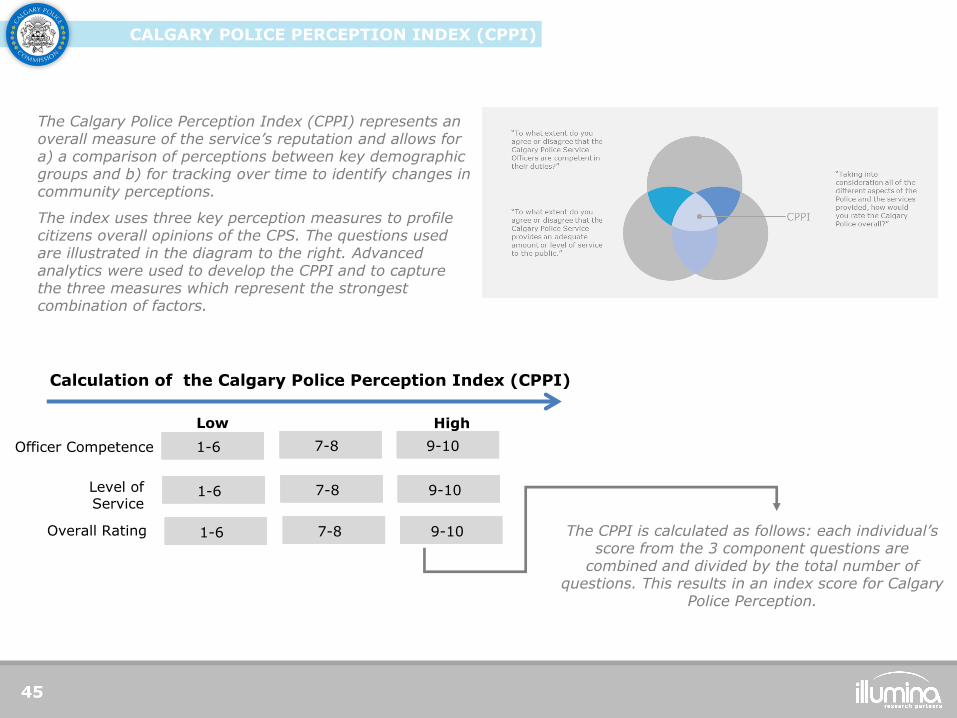
CALGARY POLICE PERCEPTION INDEX (CPPI)
14
The Calgary Police Perception Index represents an overall measure of the service’s reputation using three key measures.
CPPI
To what extent do you agree or disagree that the Calgary Police Service officers are competent in their duties?
To what extent do you agree or disagree that the Calgary Police Service provides an adequate amount or level of service to the public?
Taking into consideration all of the different aspects of the Police and the services provided, how would you rate the Calgary Police overall?
See Appendix C for an Explanation of the CPPI Calculation
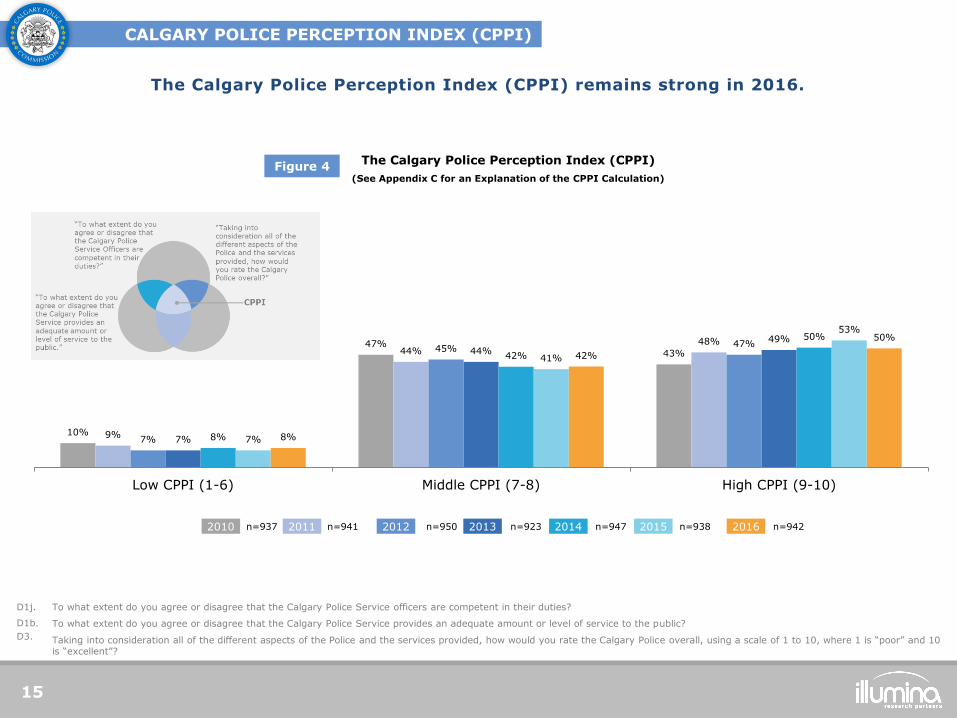
The Calgary Police Perception Index (CPPI)
(See Appendix C for an Explanation of the CPPI Calculation)
Figure 4
To what extent do you agree or disagree that the Calgary Police Service officers are competent in their duties?
To what extent do you agree or disagree that the Calgary Police Service provides an adequate amount or level of service to the public?
Taking into consideration all of the different aspects of the Police and the services provided, how would you rate the Calgary Police overall, using a scale of 1 to 10, where 1 is “poor” and 10 is “excellent”?
D1j.
D1b.
D3.
CALGARY POLICE PERCEPTION INDEX (CPPI)
15
The Calgary Police Perception Index (CPPI) remains strong in 2016.
2013 n=923 2012 n=950 2010 n=937 2011 n=941 2014 n=947 2015 n=938 2016 n=942
10%
47% 43%
9%
44% 48%
7%
45% 47%
7%
44%
49%
8%
42%
50%
7%
41%
53%
8%
42%
50%
Low CPPI (1-6) Middle CPPI (7-8) High CPPI (9-10)
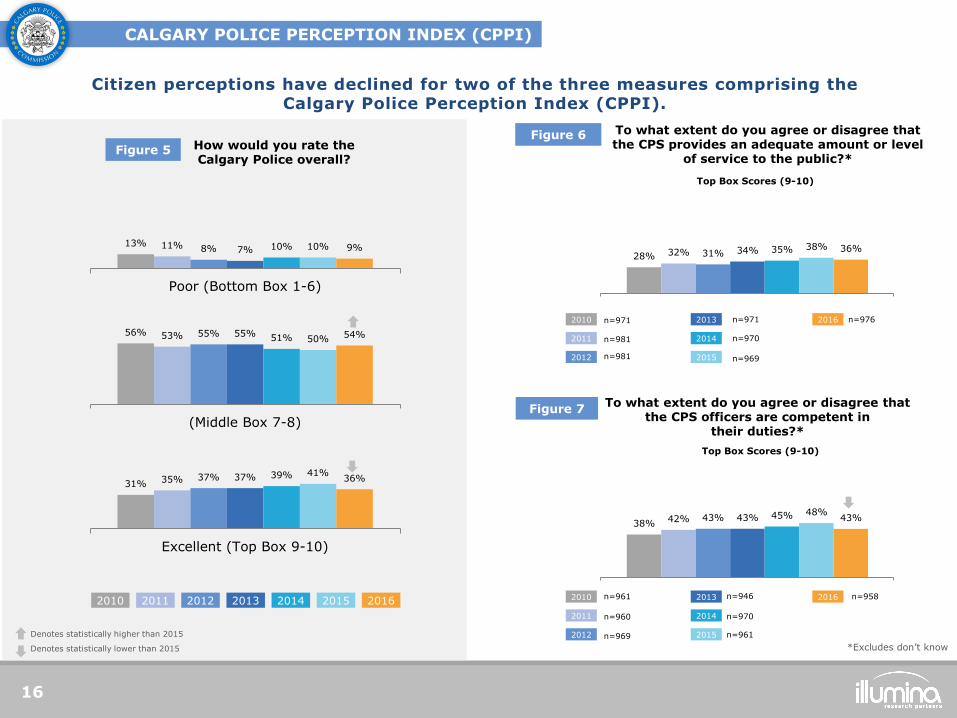
Citizen perceptions have declined for two of the three measures comprising the Calgary Police Perception Index (CPPI).
How would you rate the Calgary Police overall?
Figure 5
To what extent do you agree or disagree that the CPS provides an adequate amount or level
of service to the public?*
Figure 6
To what extent do you agree or disagree that the CPS officers are competent in
their duties?*
Figure 7
Top Box Scores (9-10)
Top Box Scores (9-10)
*Excludes don’t know
CALGARY POLICE PERCEPTION INDEX (CPPI)
16
2014 2013 2011 2012 2015 2016 2010
2010
2011
2012
2013
2014
2015
2016
n=981 n=970
n=971
n=981
n=971
n=969
n=976
n=960 n=970
n=946
n=969
n=961
n=961
2010
2011
2012
2013
2014
2015
2016 n=958
13% 11% 8% 7% 10% 10% 9%
Poor (Bottom Box 1-6)
56% 53% 55% 55% 51% 50% 54%
(Middle Box 7-8)
31% 35% 37% 37% 39% 41% 36%
Excellent (Top Box 9-10)
28% 32% 31% 34% 35% 38% 36%
38% 42% 43% 43% 45% 48%
43%
Denotes statistically higher than 2015
Denotes statistically lower than 2015
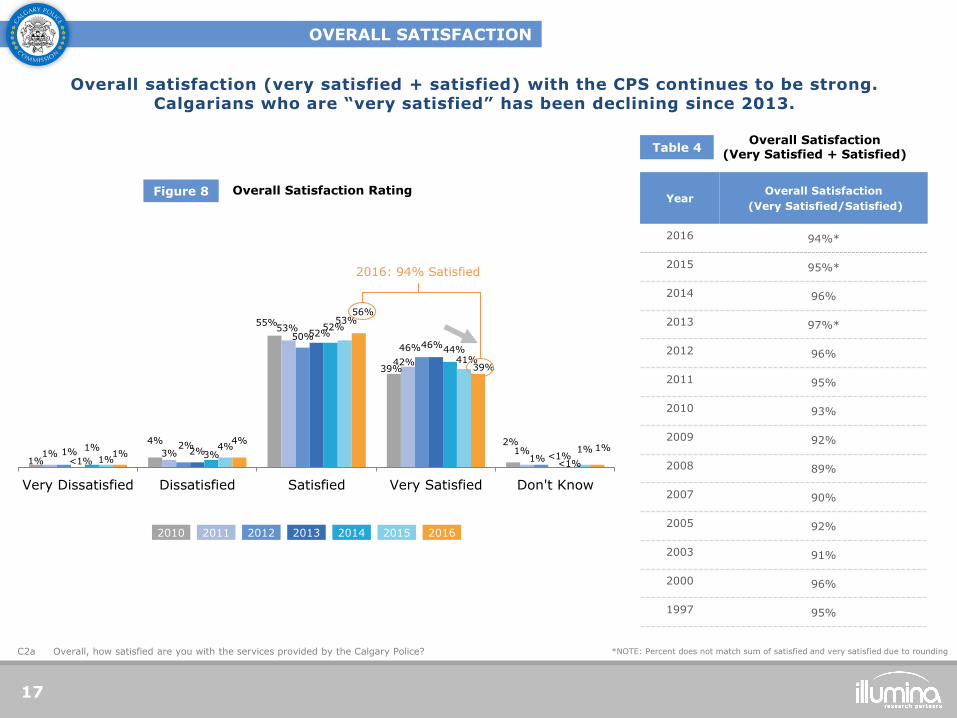
Overall satisfaction (very satisfied + satisfied) with the CPS continues to be strong. Calgarians who are “very satisfied” has been declining since 2013.
Overall Satisfaction Rating Figure 8
Overall Satisfaction (Very Satisfied + Satisfied)
Table 4
Overall, how satisfied are you with the services provided by the Calgary Police? C2a
Year Overall Satisfaction
(Very Satisfied/Satisfied)
2016 94%*
2015 95%*
2014 96%
2013 97%*
2012 96%
2011 95%
2010 93%
2009 92%
2008 89%
2007 90%
2005 92%
2003 91%
2000 96%
1997 95%
*NOTE: Percent does not match sum of satisfied and very satisfied due to rounding
OVERALL SATISFACTION
17
1%
4%
55%
39%
2%
1% 3%
53%
42%
1% 1% 2%
50% 46%
1% <1% 2%
52%
46%
<1% 1%
3%
52%
44%
<1% 1%
4%
53%
41%
1% 1%
4%
56%
39%
1%
Very Dissatisfied Dissatisfied Satisfied Very Satisfied Don't Know
2014 2013 2011 2012 2015 2016 2010
2016: 94% Satisfied
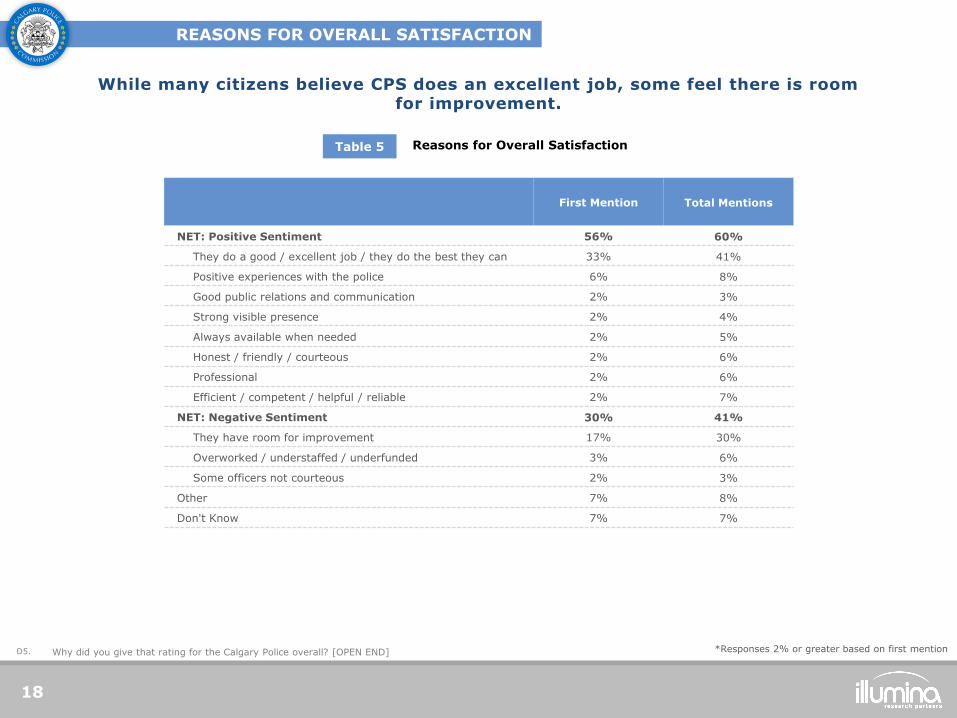
REASONS FOR OVERALL SATISFACTION
18
Reasons for Overall Satisfaction Table 5
First Mention Total Mentions
NET: Positive Sentiment 56% 60%
They do a good / excellent job / they do the best they can 33% 41%
Positive experiences with the police 6% 8%
Good public relations and communication 2% 3%
Strong visible presence 2% 4%
Always available when needed 2% 5%
Honest / friendly / courteous 2% 6%
Professional 2% 6%
Efficient / competent / helpful / reliable 2% 7%
NET: Negative Sentiment 30% 41%
They have room for improvement 17% 30%
Overworked / understaffed / underfunded 3% 6%
Some officers not courteous 2% 3%
Other 7% 8%
Don't Know 7% 7%
Why did you give that rating for the Calgary Police overall? [OPEN END] D5.
While many citizens believe CPS does an excellent job, some feel there is room for improvement.
*Responses 2% or greater based on first mention
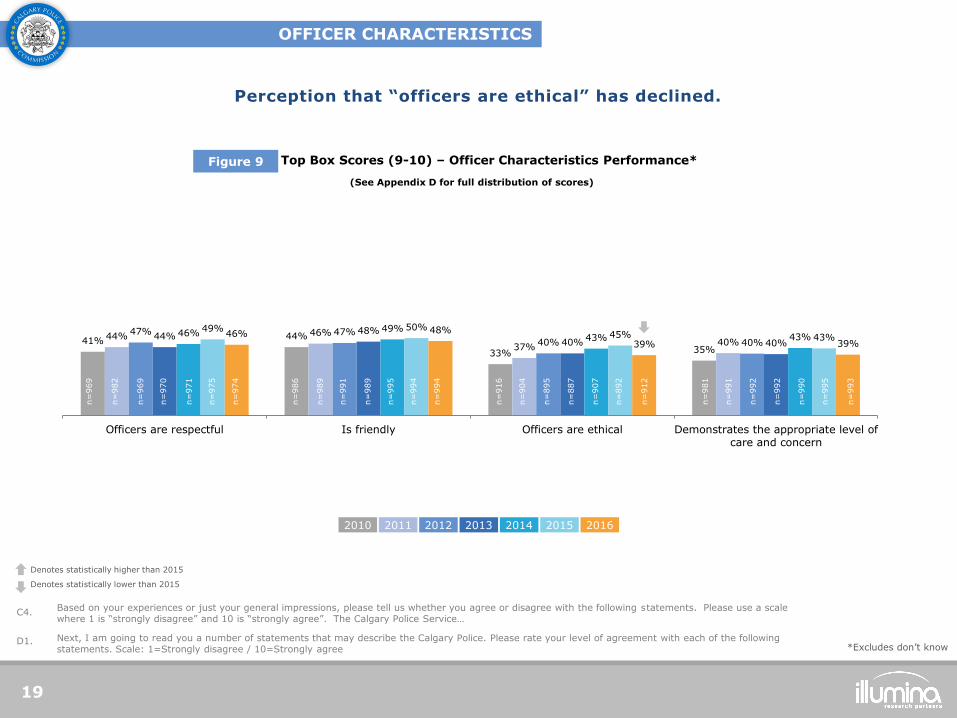
Top Box Scores (9-10) – Officer Characteristics Performance*
Perception that “officers are ethical” has declined.
Figure 9
(See Appendix D for full distribution of scores)
41% 44%
33% 35%
44% 46%
37% 40%
47% 47% 40% 40%
44% 48%
40% 40% 46%
49% 43% 43%
49% 50% 45% 43% 46% 48%
39% 39%
Officers are respectful Is friendly Officers are ethical Demonstrates the appropriate level ofcare and concern
Based on your experiences or just your general impressions, please tell us whether you agree or disagree with the following statements. Please use a scale where 1 is “strongly disagree” and 10 is “strongly agree”. The Calgary Police Service…
Next, I am going to read you a number of statements that may describe the Calgary Police. Please rate your level of agreement with each of the following statements. Scale: 1=Strongly disagree / 10=Strongly agree
C4.
D1. *Excludes don’t know
OFFICER CHARACTERISTICS
19
2010 2011 2012 2013 2014 2015 2016
n=
974
n=
969
n=
982
n=
969
n=
970
n=
971
n=
975
n=
994
n=
986
n=
989
n=
991
n=
989
n=
995
n=
994
n=
916
n=
904
n=
895
n=
887
n=
907
n=
892
n=
912
n=
981
n=
991
n=
992
n=
992
n=
990
n=
995
n=
993
Denotes statistically higher than 2015
Denotes statistically lower than 2015
38% 37% 30%
30%
42% 37% 34% 34%
43% 38% 36% 35%
43% 39%
31% 33%
45%
38% 34% 35%
52% 48%
43% 39% 38% 48%
43% 43%
34% 36%
Officers are professional Officers are competent intheir duties
Officers clearly understandmy safety needs and concerns
Responds in a fair way whendealing with all segments of
the Calgary Community
Uses its authority and forceappropriately
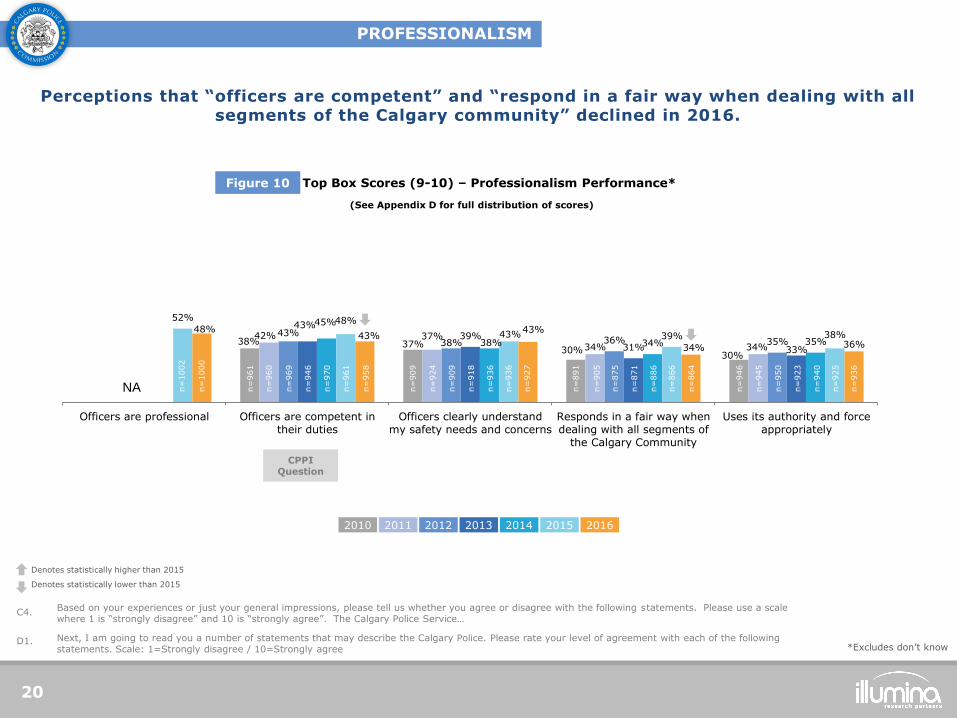
Top Box Scores (9-10) – Professionalism Performance*
Perceptions that “officers are competent” and “respond in a fair way when dealing with all segments of the Calgary community” declined in 2016.
Figure 10
(See Appendix D for full distribution of scores)
Based on your experiences or just your general impressions, please tell us whether you agree or disagree with the following statements. Please use a scale where 1 is “strongly disagree” and 10 is “strongly agree”. The Calgary Police Service…
Next, I am going to read you a number of statements that may describe the Calgary Police. Please rate your level of agreement with each of the following statements. Scale: 1=Strongly disagree / 10=Strongly agree
C4.
D1. *Excludes don’t know
PROFESSIONALISM
20
2010 2011 2012 2013 2014 2015 2016
CPPI Question
Denotes statistically higher than 2015
Denotes statistically lower than 2015
n=
1000
n=
1002
n=
961
n=
960
n=
969
n=
946
n=
970
n=
961
n=
958
n=
909
n=
924
n=
909
n=
918
n=
936
n=
936
n=
927
n=
891
n=
905
n=
875
n=
871
n=
886
n=
866
n=
864
n=
946
n=
945
n=
950
n=
923
n=
940
n=
925
n=
936
NA
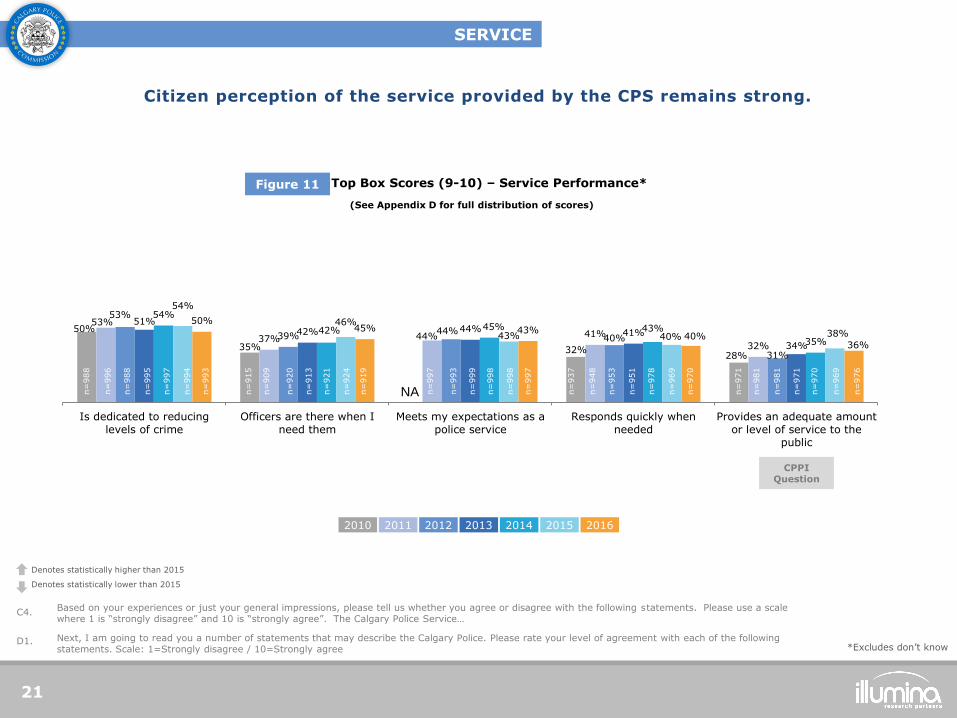
Citizen perception of the service provided by the CPS remains strong.
Figure 11 Top Box Scores (9-10) – Service Performance*
(See Appendix D for full distribution of scores)
50%
35% 32% 28%
53%
37% 44% 41%
32%
53%
39% 44%
40%
31%
51% 42% 44% 41%
34%
54%
42% 45% 43%
35%
54%
46%
43% 40% 38%
50% 45% 43%
40% 36%
Is dedicated to reducinglevels of crime
Officers are there when Ineed them
Meets my expectations as apolice service
Responds quickly whenneeded
Provides an adequate amountor level of service to the
public
Based on your experiences or just your general impressions, please tell us whether you agree or disagree with the following statements. Please use a scale where 1 is “strongly disagree” and 10 is “strongly agree”. The Calgary Police Service…
Next, I am going to read you a number of statements that may describe the Calgary Police. Please rate your level of agreement with each of the following statements. Scale: 1=Strongly disagree / 10=Strongly agree
C4.
D1. *Excludes don’t know
SERVICE
21
CPPI Question
2010 2011 2012 2013 2014 2015 2016
n=
988
n=
996
n=
988
n=
995
n=
997
n=
994
n=
993
n=
915
n=
909
n=
920
n=
913
n=
921
n=
924
n=
919
n=
997
n=
993
n=
999
n=
998
n=
998
n=
997
NA n=
937
n=
948
n=
953
n=
951
n=
978
n=
969
n=
970
n=
971
n=
981
n=
981
n=
971
n=
970
n=
969
n=
976
Denotes statistically higher than 2015
Denotes statistically lower than 2015
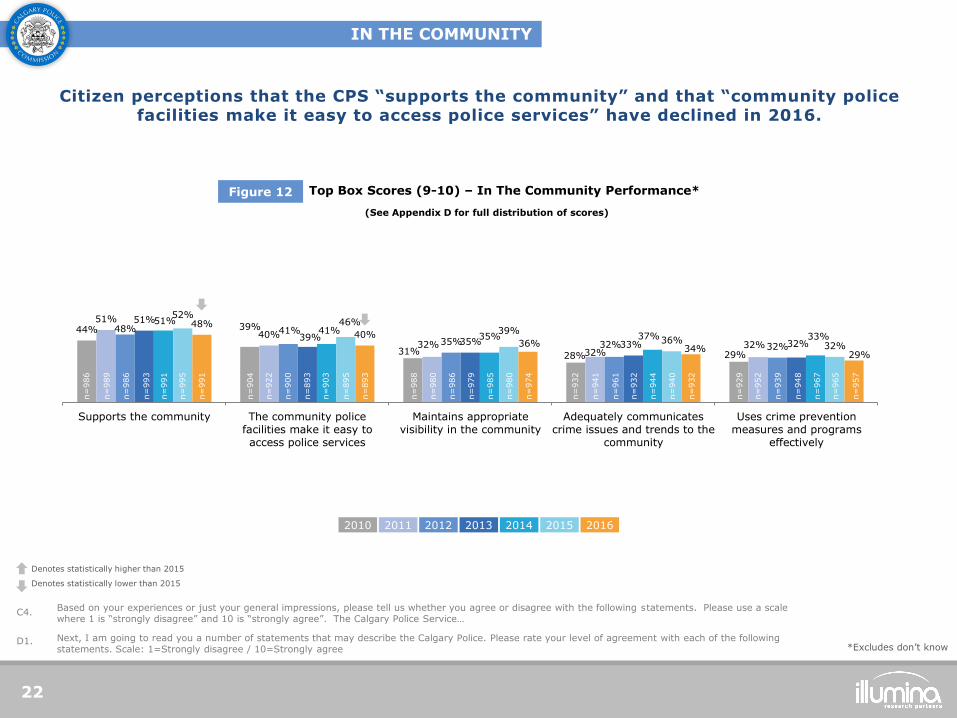
Citizen perceptions that the CPS “supports the community” and that “community police facilities make it easy to access police services” have declined in 2016.
Top Box Scores (9-10) – In The Community Performance* Figure 12
(See Appendix D for full distribution of scores)
44% 39%
31% 28% 29%
51%
40% 32%
32% 32%
48% 41% 35% 32% 32%
51%
39% 35% 33% 32%
51% 41%
35% 37% 33%
52% 46%
39% 36%
32%
48% 40%
36% 34%
29%
Supports the community The community policefacilities make it easy toaccess police services
Maintains appropriatevisibility in the community
Adequately communicatescrime issues and trends to the
community
Uses crime preventionmeasures and programs
effectively
Based on your experiences or just your general impressions, please tell us whether you agree or disagree with the following statements. Please use a scale where 1 is “strongly disagree” and 10 is “strongly agree”. The Calgary Police Service…
Next, I am going to read you a number of statements that may describe the Calgary Police. Please rate your level of agreement with each of the following statements. Scale: 1=Strongly disagree / 10=Strongly agree
C4.
D1. *Excludes don’t know
IN THE COMMUNITY
22
2010 2011 2012 2013 2014 2015 2016
Denotes statistically higher than 2015
Denotes statistically lower than 2015
n=
986
n=
989
n=
986
n=
993
n=
991
n=
995
n=
991
n=
904
n=
922
n=
900
n=
893
n=
903
n=
895
n=
893
n=
988
n=
980
n=
986
n=
979
n=
985
n=
980
n=
974
n=
932
n=
941
n=
961
n=
932
n=
944
n=
940
n=
932
n=
929
n=
952
n=
939
n=
948
n=
967
n=
965
n=
957
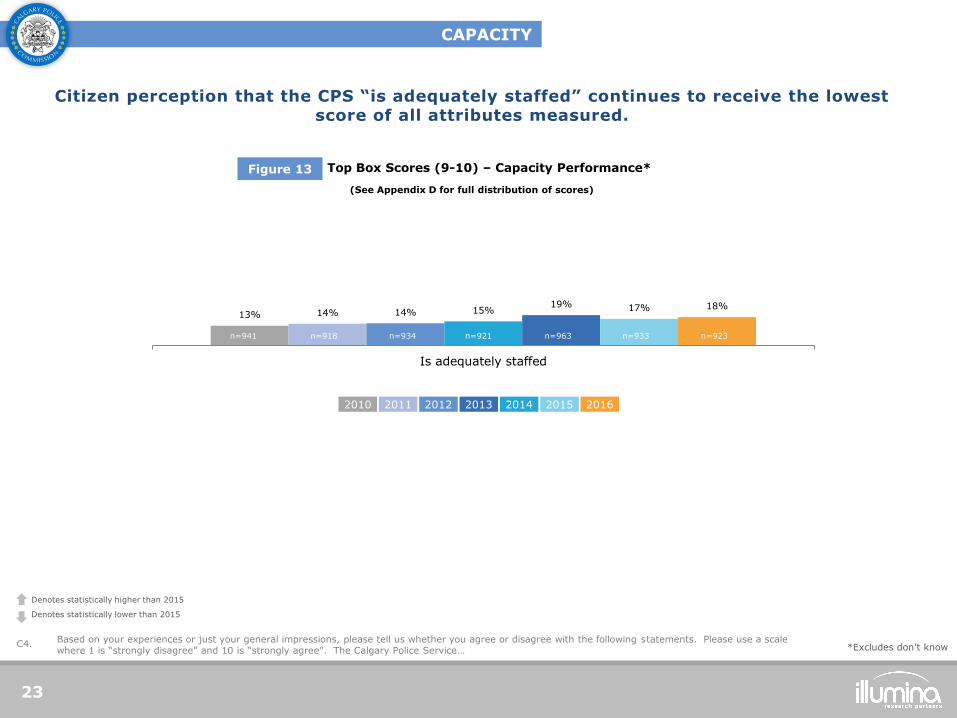
CAPACITY
23
Top Box Scores (9-10) – Capacity Performance*
Citizen perception that the CPS “is adequately staffed” continues to receive the lowest score of all attributes measured.
Figure 13
(See Appendix D for full distribution of scores)
Based on your experiences or just your general impressions, please tell us whether you agree or disagree with the following statements. Please use a scale where 1 is “strongly disagree” and 10 is “strongly agree”. The Calgary Police Service…
C4.
13% 14% 14% 15% 19% 17% 18%
Is adequately staffed
n=941 n=918 n=934 n=921 n=963 n=933 n=923
2010 2011 2012 2013 2014 2015 2016
Denotes statistically higher than 2015
Denotes statistically lower than 2015
*Excludes don’t know
Contact with the CPS and Victimization
24
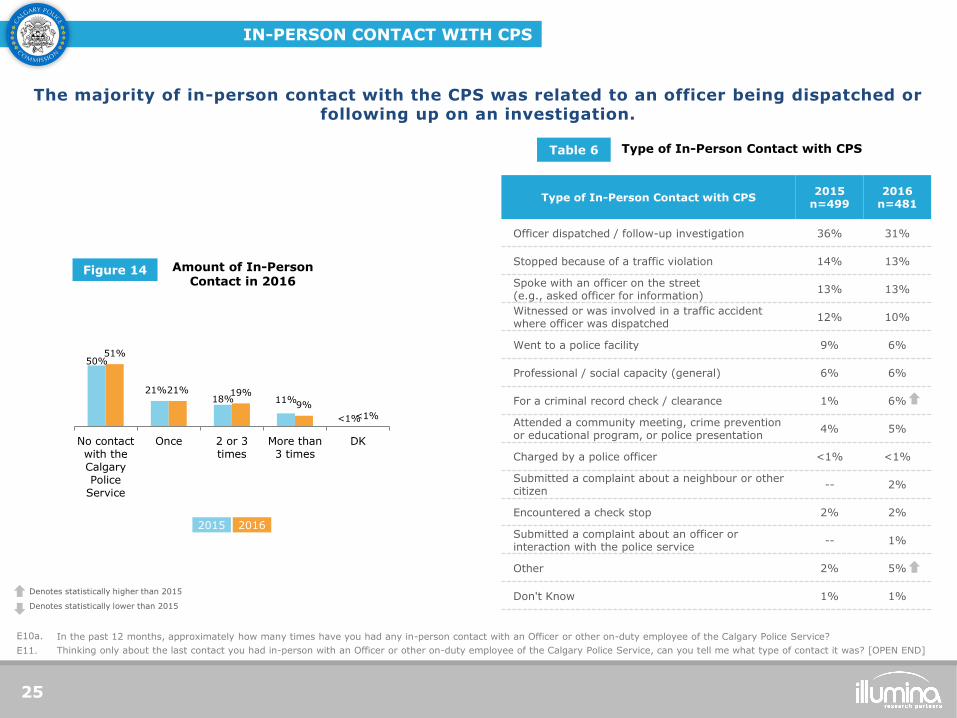
The majority of in-person contact with the CPS was related to an officer being dispatched or following up on an investigation.
Thinking only about the last contact you had in-person with an Officer or other on-duty employee of the Calgary Police Service, can you tell me what type of contact it was? [OPEN END] E11.
Type of In-Person Contact with CPS Table 6
Type of In-Person Contact with CPS 2015
n=499 2016
n=481
Officer dispatched / follow-up investigation 36% 31%
Stopped because of a traffic violation 14% 13%
Spoke with an officer on the street (e.g., asked officer for information)
13% 13%
Witnessed or was involved in a traffic accident where officer was dispatched
12% 10%
Went to a police facility 9% 6%
Professional / social capacity (general) 6% 6%
For a criminal record check / clearance 1% 6%
Attended a community meeting, crime prevention or educational program, or police presentation
4% 5%
Charged by a police officer <1% <1%
Submitted a complaint about a neighbour or other citizen
-- 2%
Encountered a check stop 2% 2%
Submitted a complaint about an officer or interaction with the police service
-- 1%
Other 2% 5%
Don't Know 1% 1%
IN-PERSON CONTACT WITH CPS
25
In the past 12 months, approximately how many times have you had any in-person contact with an Officer or other on-duty employee of the Calgary Police Service? E10a.
50%
21% 18% 11%
<1%
51%
21% 19%
9% <1%
No contactwith theCalgaryPolice
Service
Once 2 or 3times
More than3 times
DK
2016
Amount of In-Person Contact in 2016
Figure 14
2015
Denotes statistically higher than 2015
Denotes statistically lower than 2015
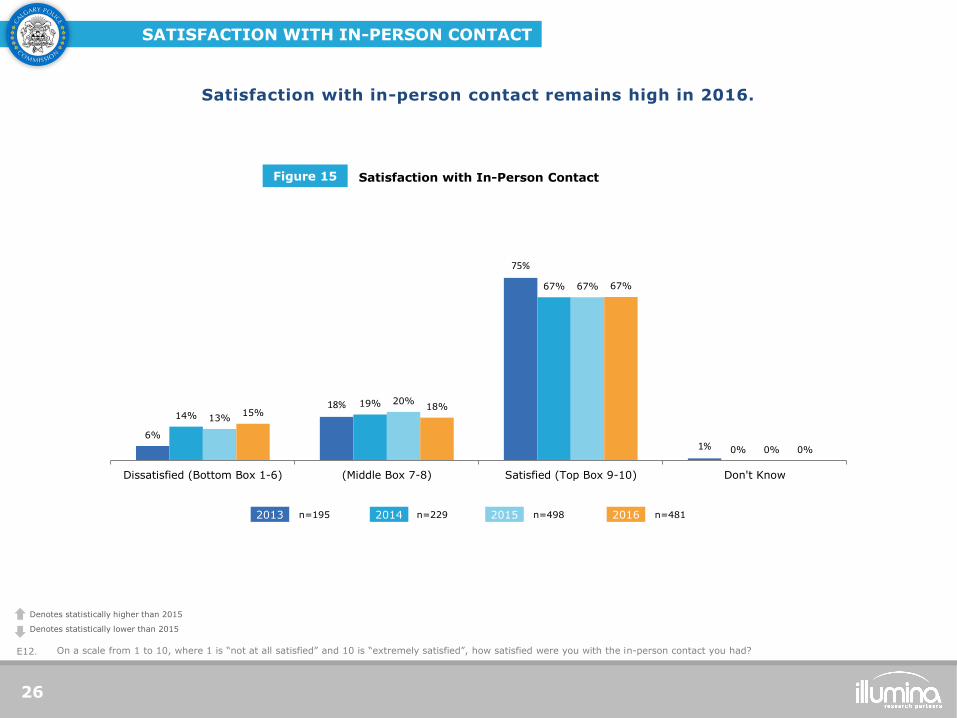
Satisfaction with in-person contact remains high in 2016.
On a scale from 1 to 10, where 1 is “not at all satisfied” and 10 is “extremely satisfied”, how satisfied were you with the in-person contact you had? E12.
SATISFACTION WITH IN-PERSON CONTACT
26
Satisfaction with In-Person Contact Figure 15
6%
18%
75%
1%
14%
19%
67%
0%
13%
20%
67%
0%
15% 18%
67%
0%
Dissatisfied (Bottom Box 1-6) (Middle Box 7-8) Satisfied (Top Box 9-10) Don't Know
2013 n=195 2014 n=229 2015 n=498 2016 n=481
Denotes statistically higher than 2015
Denotes statistically lower than 2015
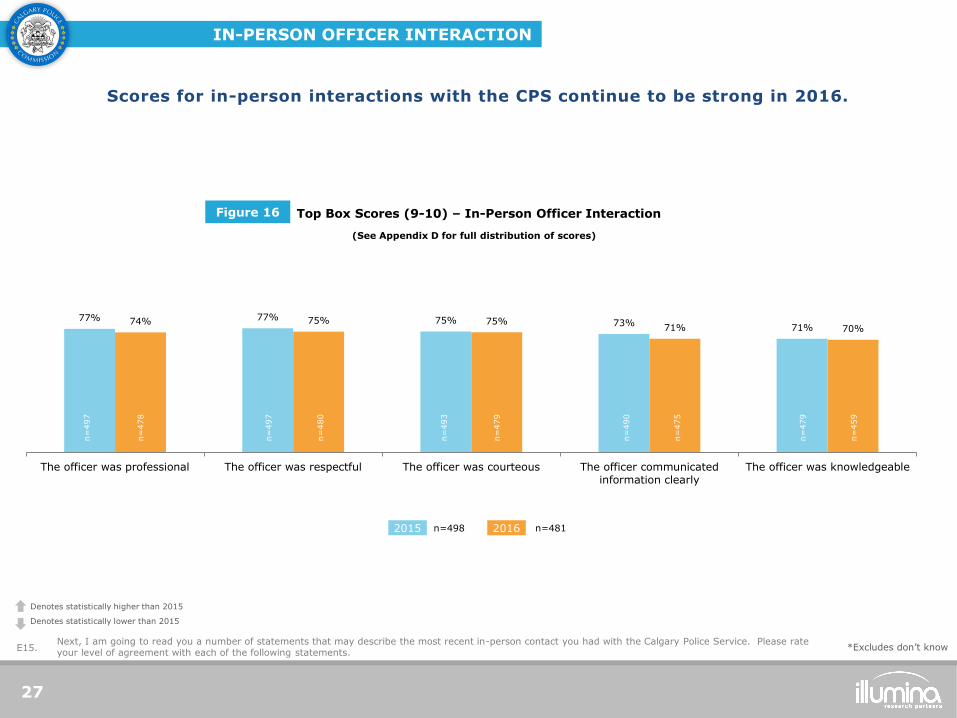
IN-PERSON OFFICER INTERACTION
27
77% 77% 75% 73% 71%
74% 75% 75% 71% 70%
The officer was professional The officer was respectful The officer was courteous The officer communicatedinformation clearly
The officer was knowledgeable
Top Box Scores (9-10) – In-Person Officer Interaction
(See Appendix D for full distribution of scores)
Scores for in-person interactions with the CPS continue to be strong in 2016.
Next, I am going to read you a number of statements that may describe the most recent in-person contact you had with the Calgary Police Service. Please rate your level of agreement with each of the following statements.
E15.
Figure 16
2015 n=498 2016 n=481
Denotes statistically higher than 2015
Denotes statistically lower than 2015
*Excludes don’t know
n=
497
n=
478
n=
497
n=
480
n=
493
n=
479
n=
490
n=
475
n=
479
n=
459
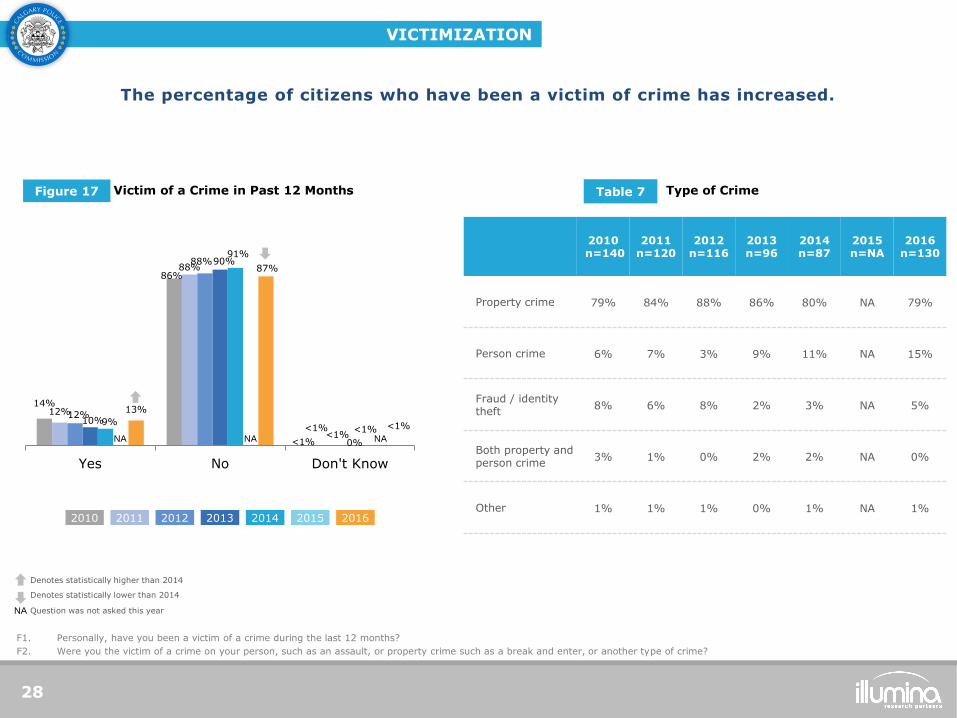
The percentage of citizens who have been a victim of crime has increased.
VICTIMIZATION
28
Were you the victim of a crime on your person, such as an assault, or property crime such as a break and enter, or another type of crime? F2.
Personally, have you been a victim of a crime during the last 12 months? F1.
Type of Crime Table 7
2010 n=140
2011 n=120
2012 n=116
2013 n=96
2014 n=87
2015 n=NA
2016 n=130
Property crime 79% 84% 88% 86% 80% NA 79%
Person crime 6% 7% 3% 9% 11% NA 15%
Fraud / identity theft
8% 6% 8% 2% 3% NA 5%
Both property and person crime
3% 1% 0% 2% 2% NA 0%
Other 1% 1% 1% 0% 1% NA 1%
Victim of a Crime in Past 12 Months Figure 17
14%
86%
<1%
12%
88%
<1%
12%
88%
<1%
10%
90%
0%
9%
91%
<1%
13%
87%
<1%
Yes No Don't Know
2014 2013 2011 2012 2015 2016 2010
NA NA NA
Denotes statistically higher than 2014
Denotes statistically lower than 2014
NA Question was not asked this year
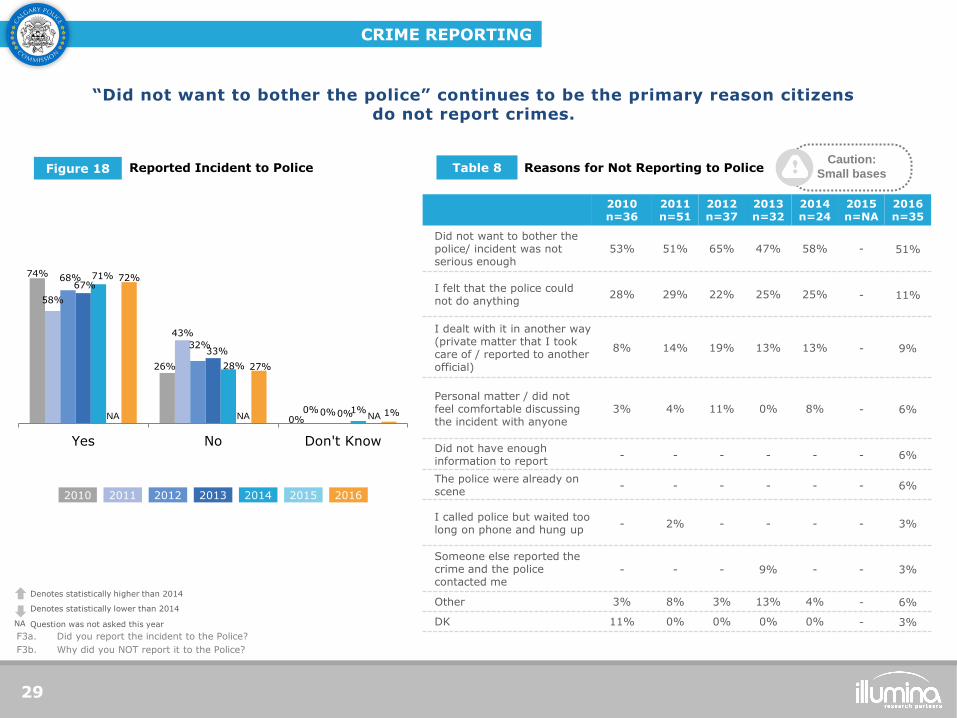
“Did not want to bother the police” continues to be the primary reason citizens do not report crimes.
CRIME REPORTING
29
Why did you NOT report it to the Police? F3b.
Did you report the incident to the Police? F3a.
2010 n=36
2011 n=51
2012 n=37
2013 n=32
2014 n=24
2015 n=NA
2016 n=35
Did not want to bother the police/ incident was not serious enough
53% 51% 65% 47% 58% - 51%
I felt that the police could not do anything
28% 29% 22% 25% 25% - 11%
I dealt with it in another way (private matter that I took care of / reported to another official)
8% 14% 19% 13% 13% - 9%
Personal matter / did not feel comfortable discussing the incident with anyone
3% 4% 11% 0% 8% - 6%
Did not have enough information to report
- - - - - - 6%
The police were already on scene
- - - - - - 6%
I called police but waited too long on phone and hung up
- 2% - - - - 3%
Someone else reported the crime and the police contacted me
- - - 9% - - 3%
Other 3% 8% 3% 13% 4% - 6%
DK 11% 0% 0% 0% 0% - 3%
Reported Incident to Police Figure 18
74%
26%
0%
58%
43%
0%
68%
32%
0%
67%
33%
0%
71%
28%
1%
72%
27%
1%
Yes No Don't Know
2014 2013 2011 2012 2015 2016 2010
NA NA NA
Reasons for Not Reporting to Police Table 8 Caution:
Small bases
Denotes statistically higher than 2014
Denotes statistically lower than 2014
NA Question was not asked this year
Neighbourhood Traffic Safety
30
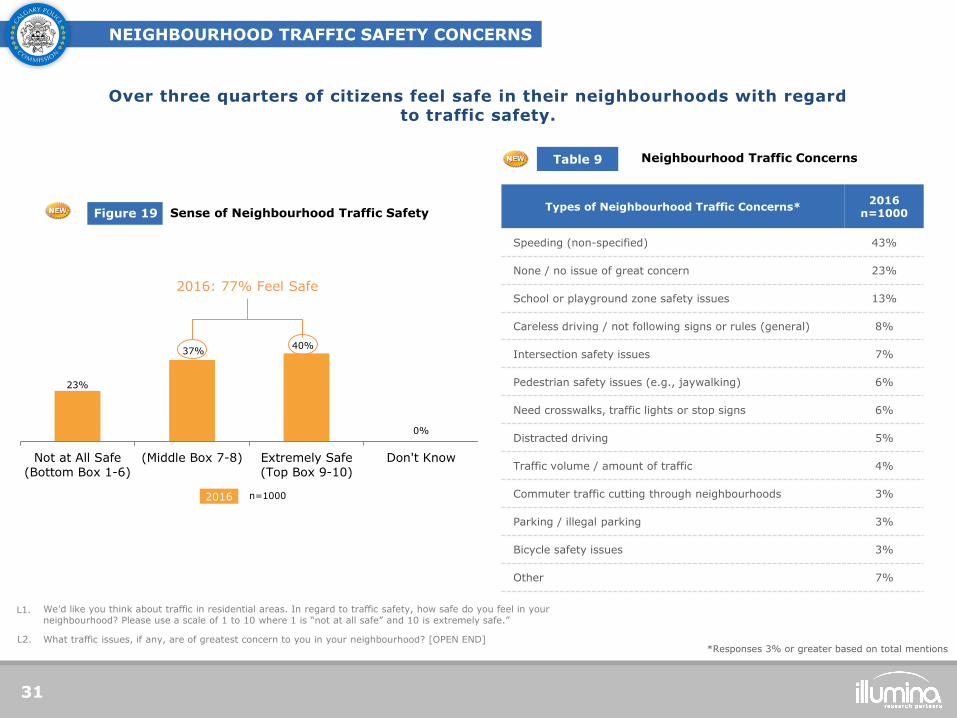
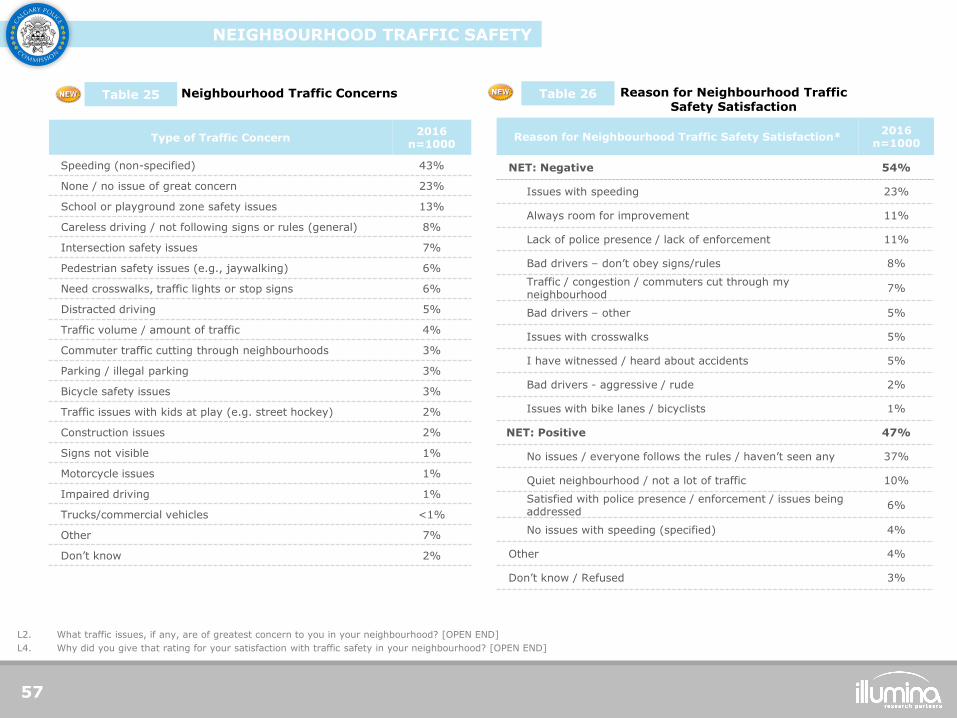
NEIGHBOURHOOD TRAFFIC SAFETY CONCERNS
31
Over three quarters of citizens feel safe in their neighbourhoods with regard to traffic safety.
23%
37% 40%
0%
Not at All Safe(Bottom Box 1-6)
(Middle Box 7-8) Extremely Safe(Top Box 9-10)
Don't Know
2016 n=1000
Neighbourhood Traffic Concerns Table 9
Types of Neighbourhood Traffic Concerns* 2016
n=1000
Speeding (non-specified) 43%
None / no issue of great concern 23%
School or playground zone safety issues 13%
Careless driving / not following signs or rules (general) 8%
Intersection safety issues 7%
Pedestrian safety issues (e.g., jaywalking) 6%
Need crosswalks, traffic lights or stop signs 6%
Distracted driving 5%
Traffic volume / amount of traffic 4%
Commuter traffic cutting through neighbourhoods 3%
Parking / illegal parking 3%
Bicycle safety issues 3%
Other 7%
*Responses 3% or greater based on total mentions
Sense of Neighbourhood Traffic Safety Figure 19
We’d like you think about traffic in residential areas. In regard to traffic safety, how safe do you feel in your neighbourhood? Please use a scale of 1 to 10 where 1 is “not at all safe” and 10 is extremely safe.”
What traffic issues, if any, are of greatest concern to you in your neighbourhood? [OPEN END]
L1.
L2.
2016: 77% Feel Safe
NEIGHBOURHOOD TRAFFIC SAFETY SATISFACTION
32
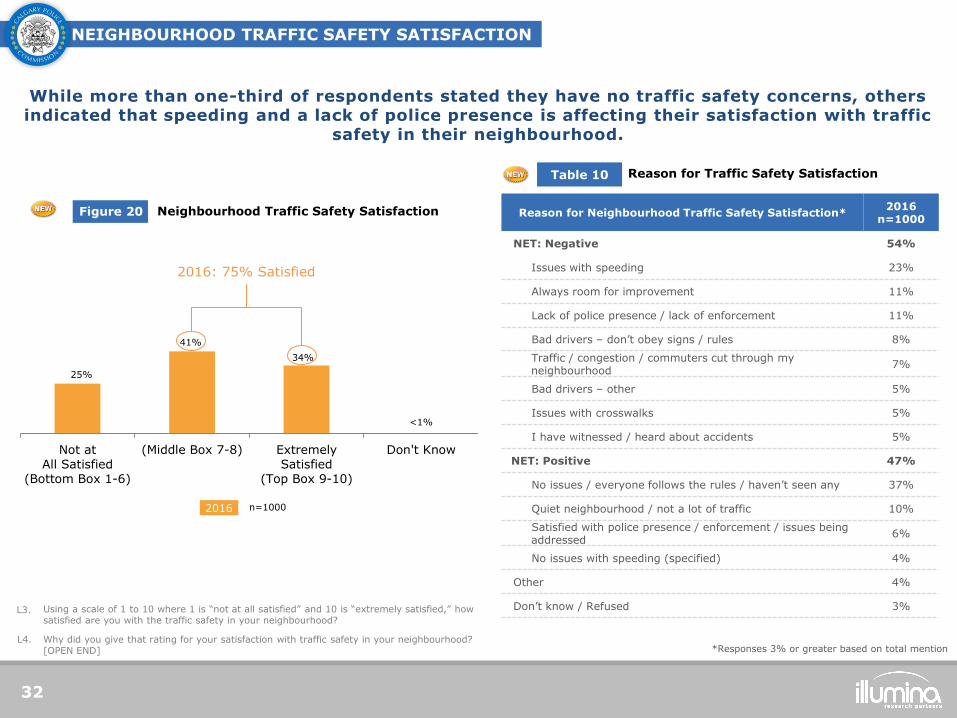
While more than one-third of respondents stated they have no traffic safety concerns, others indicated that speeding and a lack of police presence is affecting their satisfaction with traffic
safety in their neighbourhood.
Using a scale of 1 to 10 where 1 is “not at all satisfied” and 10 is “extremely satisfied,” how satisfied are you with the traffic safety in your neighbourhood?
Why did you give that rating for your satisfaction with traffic safety in your neighbourhood? [OPEN END]
L3.
2016 n=1000
Reason for Traffic Safety Satisfaction Table 10
Reason for Neighbourhood Traffic Safety Satisfaction* 2016
n=1000
NET: Negative 54%
Issues with speeding 23%
Always room for improvement 11%
Lack of police presence / lack of enforcement 11%
Bad drivers – don’t obey signs / rules 8%
Traffic / congestion / commuters cut through my neighbourhood
7%
Bad drivers – other 5%
Issues with crosswalks 5%
I have witnessed / heard about accidents 5%
NET: Positive 47%
No issues / everyone follows the rules / haven’t seen any 37%
Quiet neighbourhood / not a lot of traffic 10%
Satisfied with police presence / enforcement / issues being addressed
6%
No issues with speeding (specified) 4%
Other 4%
Don’t know / Refused 3%
*Responses 3% or greater based on total mention L4.
25%
41%
34%
<1%
Not atAll Satisfied
(Bottom Box 1-6)
(Middle Box 7-8) ExtremelySatisfied
(Top Box 9-10)
Don't Know
Neighbourhood Traffic Safety Satisfaction Figure 20
2016: 75% Satisfied
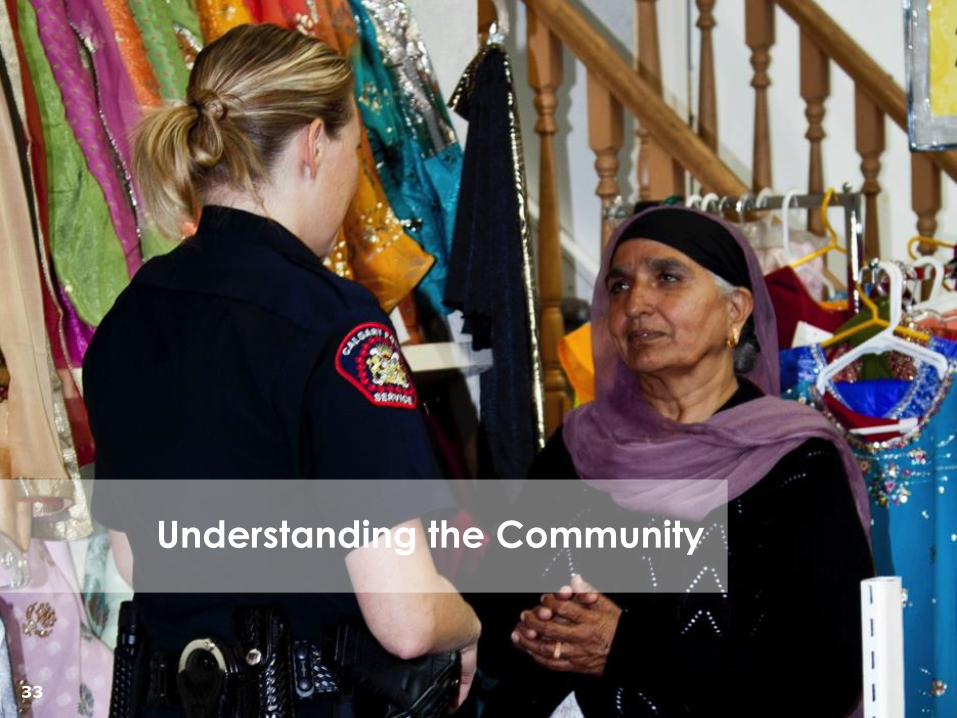
Understanding the Community
33
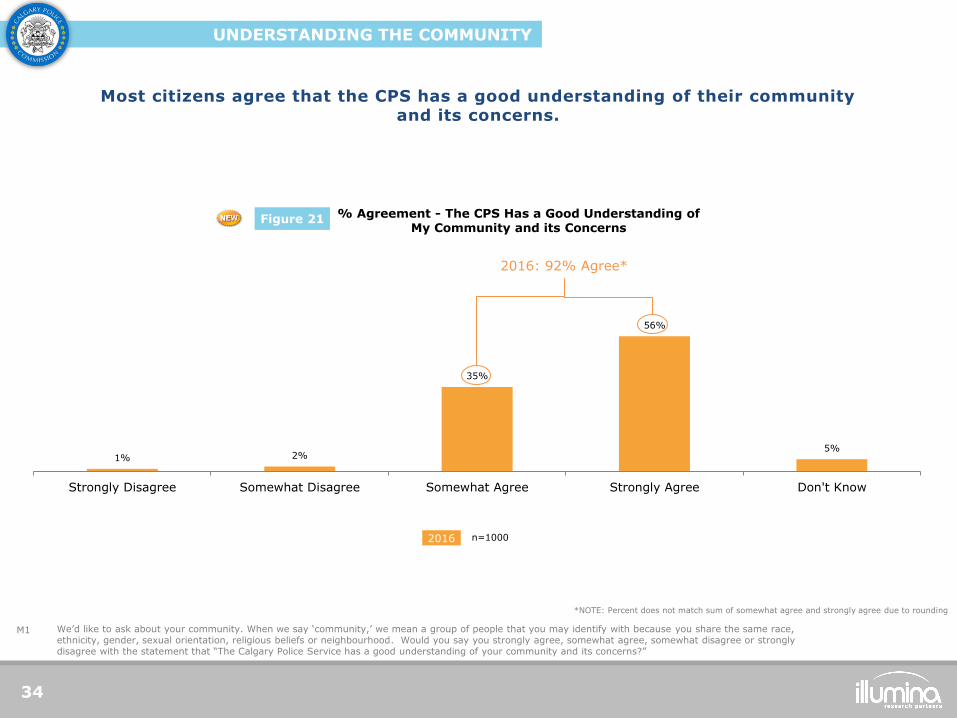
UNDERSTANDING THE COMMUNITY
We’d like to ask about your community. When we say ‘community,’ we mean a group of people that you may identify with because you share the same race, ethnicity, gender, sexual orientation, religious beliefs or neighbourhood. Would you say you strongly agree, somewhat agree, somewhat disagree or strongly disagree with the statement that “The Calgary Police Service has a good understanding of your community and its concerns?”
M1
34
2016 n=1000
1% 2%
35%
56%
5%
Strongly Disagree Somewhat Disagree Somewhat Agree Strongly Agree Don't Know
% Agreement - The CPS Has a Good Understanding of My Community and its Concerns
Figure 21
Most citizens agree that the CPS has a good understanding of their community and its concerns.
2016: 92% Agree*
*NOTE: Percent does not match sum of somewhat agree and strongly agree due to rounding
UNDERSTANDING THE COMMUNITY
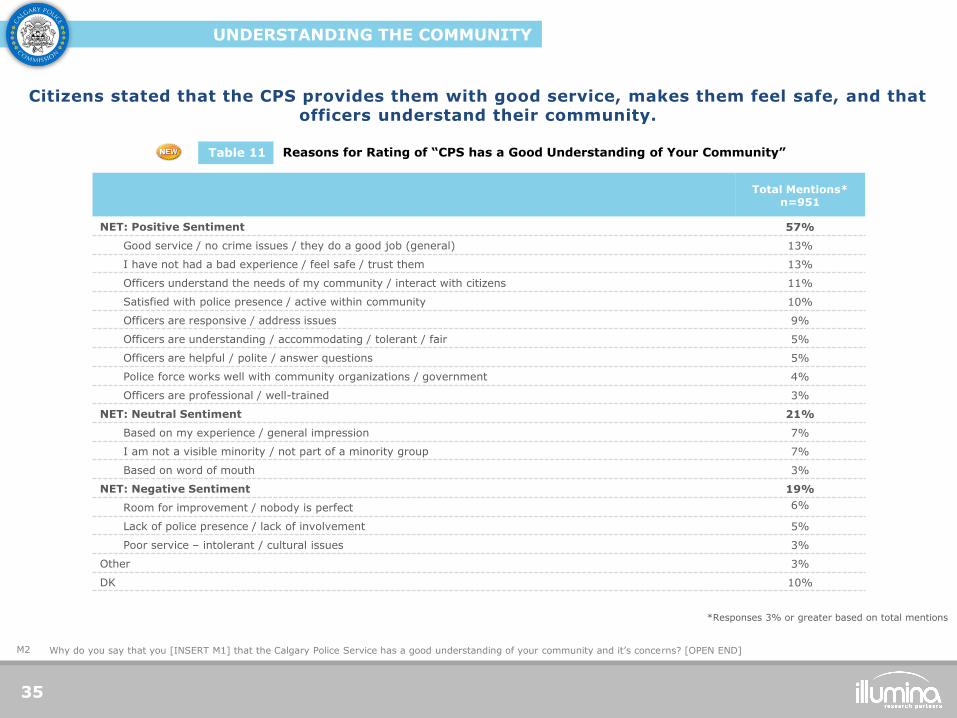
Why do you say that you [INSERT M1] that the Calgary Police Service has a good understanding of your community and it’s concerns? [OPEN END] M2
35
Reasons for Rating of “CPS has a Good Understanding of Your Community” Table 11
Total Mentions* n=951
NET: Positive Sentiment 57%
Good service / no crime issues / they do a good job (general) 13%
I have not had a bad experience / feel safe / trust them 13%
Officers understand the needs of my community / interact with citizens 11%
Satisfied with police presence / active within community 10%
Officers are responsive / address issues 9%
Officers are understanding / accommodating / tolerant / fair 5%
Officers are helpful / polite / answer questions 5%
Police force works well with community organizations / government 4%
Officers are professional / well-trained 3%
NET: Neutral Sentiment 21%
Based on my experience / general impression 7%
I am not a visible minority / not part of a minority group 7%
Based on word of mouth 3%
NET: Negative Sentiment 19%
Room for improvement / nobody is perfect 6%
Lack of police presence / lack of involvement 5%
Poor service – intolerant / cultural issues 3%
Other 3%
DK 10%
*Responses 3% or greater based on total mentions
Citizens stated that the CPS provides them with good service, makes them feel safe, and that officers understand their community.
Appendices
36

Appendix A:
Research Methodology
37
DETAILED METHODOLOGY
38
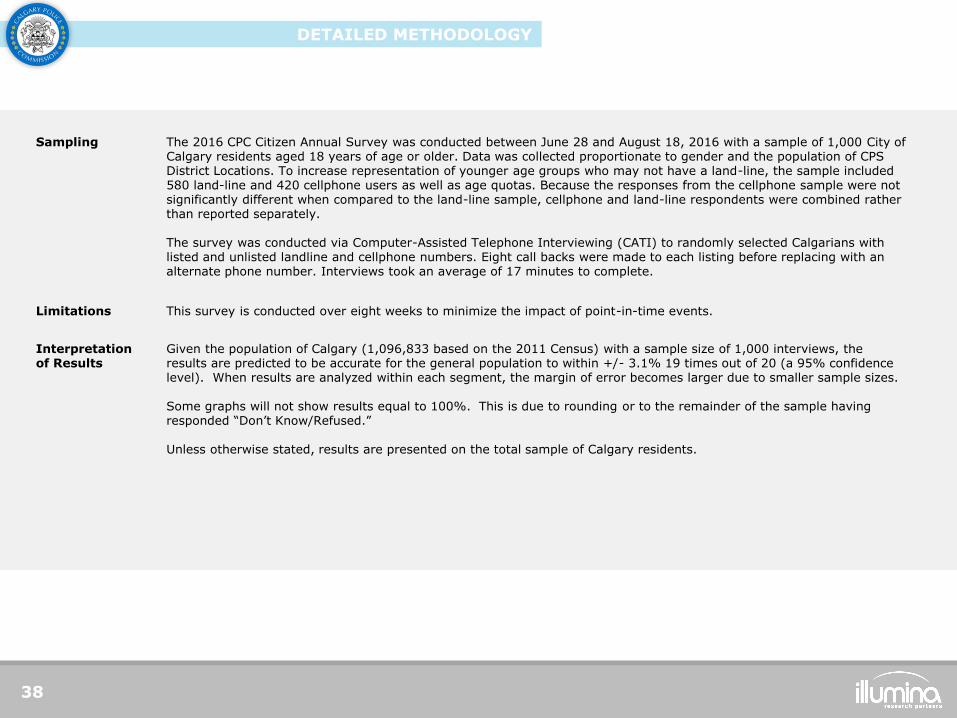
Sampling The 2016 CPC Citizen Annual Survey was conducted between June 28 and August 18, 2016 with a sample of 1,000 City of Calgary residents aged 18 years of age or older. Data was collected proportionate to gender and the population of CPS District Locations. To increase representation of younger age groups who may not have a land-line, the sample included 580 land-line and 420 cellphone users as well as age quotas. Because the responses from the cellphone sample were not significantly different when compared to the land-line sample, cellphone and land-line respondents were combined rather than reported separately. The survey was conducted via Computer-Assisted Telephone Interviewing (CATI) to randomly selected Calgarians with listed and unlisted landline and cellphone numbers. Eight call backs were made to each listing before replacing with an alternate phone number. Interviews took an average of 17 minutes to complete.
Limitations This survey is conducted over eight weeks to minimize the impact of point-in-time events.
Interpretation of Results
Given the population of Calgary (1,096,833 based on the 2011 Census) with a sample size of 1,000 interviews, the results are predicted to be accurate for the general population to within +/- 3.1% 19 times out of 20 (a 95% confidence level). When results are analyzed within each segment, the margin of error becomes larger due to smaller sample sizes. Some graphs will not show results equal to 100%. This is due to rounding or to the remainder of the sample having responded “Don’t Know/Refused.” Unless otherwise stated, results are presented on the total sample of Calgary residents.
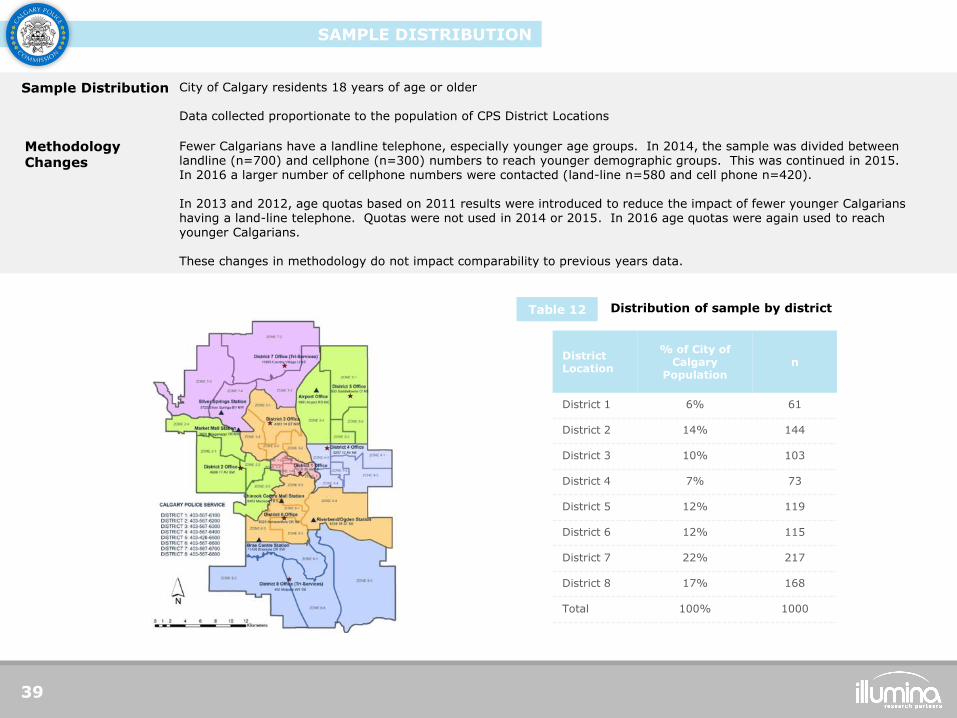
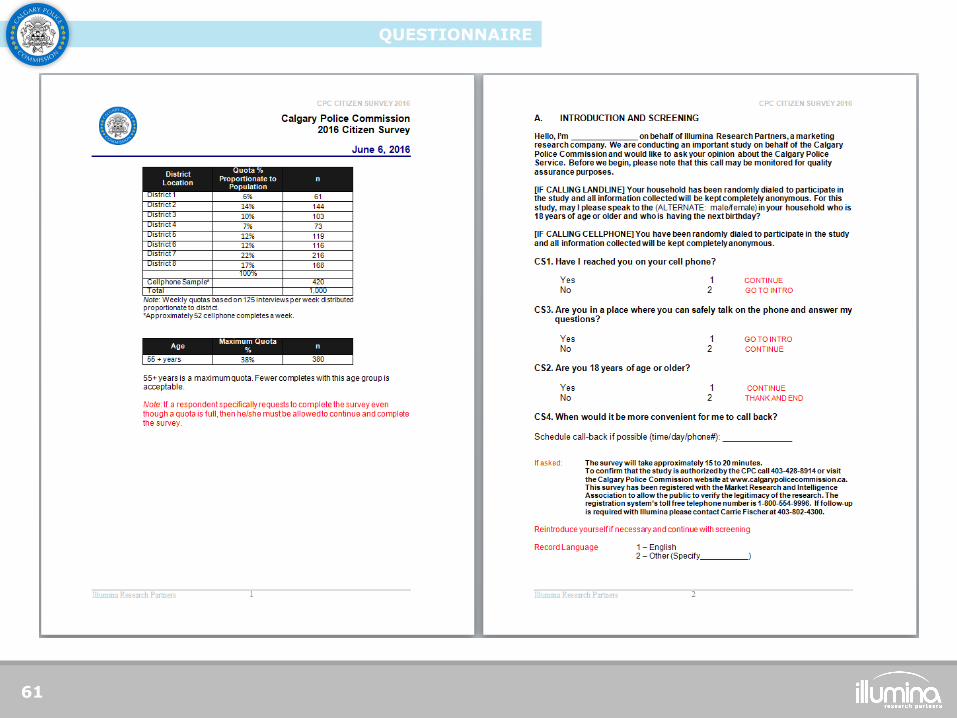
SAMPLE DISTRIBUTION
39
City of Calgary residents 18 years of age or older Data collected proportionate to the population of CPS District Locations
Sample Distribution
District Location
% of City of Calgary
Population n
District 1 6% 61
District 2 14% 144
District 3 10% 103
District 4 7% 73
District 5 12% 119
District 6 12% 115
District 7 22% 217
District 8 17% 168
Total 100% 1000
Methodology Changes
Fewer Calgarians have a landline telephone, especially younger age groups. In 2014, the sample was divided between landline (n=700) and cellphone (n=300) numbers to reach younger demographic groups. This was continued in 2015. In 2016 a larger number of cellphone numbers were contacted (land-line n=580 and cell phone n=420). In 2013 and 2012, age quotas based on 2011 results were introduced to reduce the impact of fewer younger Calgarians having a land-line telephone. Quotas were not used in 2014 or 2015. In 2016 age quotas were again used to reach younger Calgarians. These changes in methodology do not impact comparability to previous years data.
Distribution of sample by district Table 12
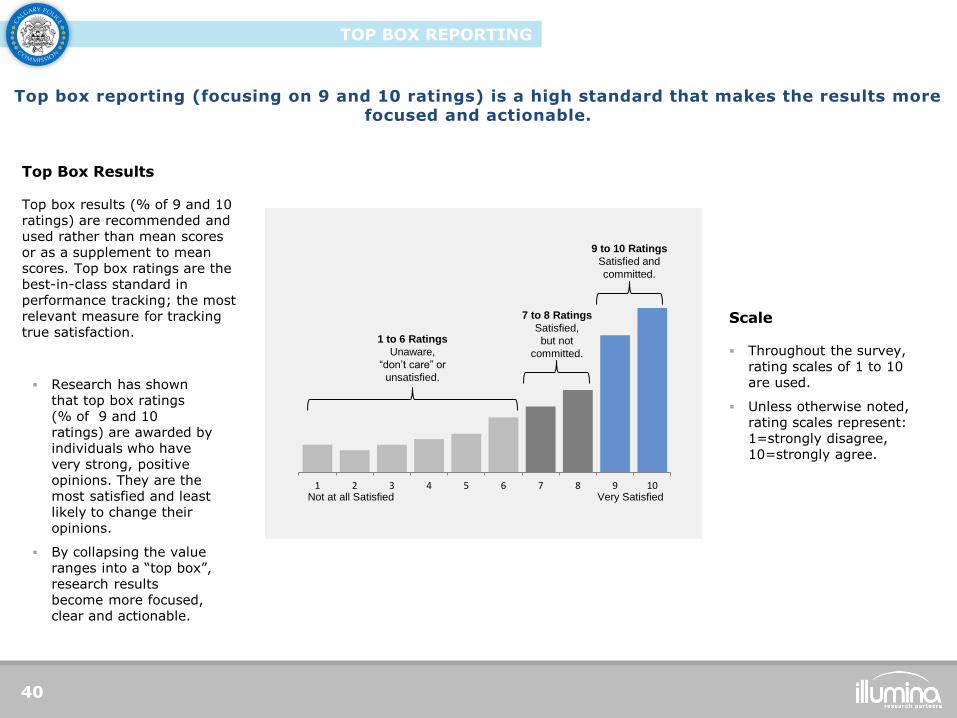
TOP BOX REPORTING
40
1 2 3 4 5 6 7 8 9 10
1 to 6 Ratings
Unaware,
“don’t care” or
unsatisfied.
7 to 8 Ratings
Satisfied,
but not
committed.
9 to 10 Ratings
Satisfied and
committed.
Not at all Satisfied Very Satisfied
Top box results (% of 9 and 10 ratings) are recommended and used rather than mean scores or as a supplement to mean scores. Top box ratings are the best-in-class standard in performance tracking; the most relevant measure for tracking true satisfaction.
Research has shown that top box ratings (% of 9 and 10 ratings) are awarded by individuals who have very strong, positive opinions. They are the most satisfied and least likely to change their opinions.
By collapsing the value ranges into a “top box”, research results become more focused, clear and actionable.
Top Box Results
Throughout the survey, rating scales of 1 to 10 are used.
Unless otherwise noted, rating scales represent: 1=strongly disagree, 10=strongly agree.
Scale
Top box reporting (focusing on 9 and 10 ratings) is a high standard that makes the results more focused and actionable.

41
Appendix B:
Demographics
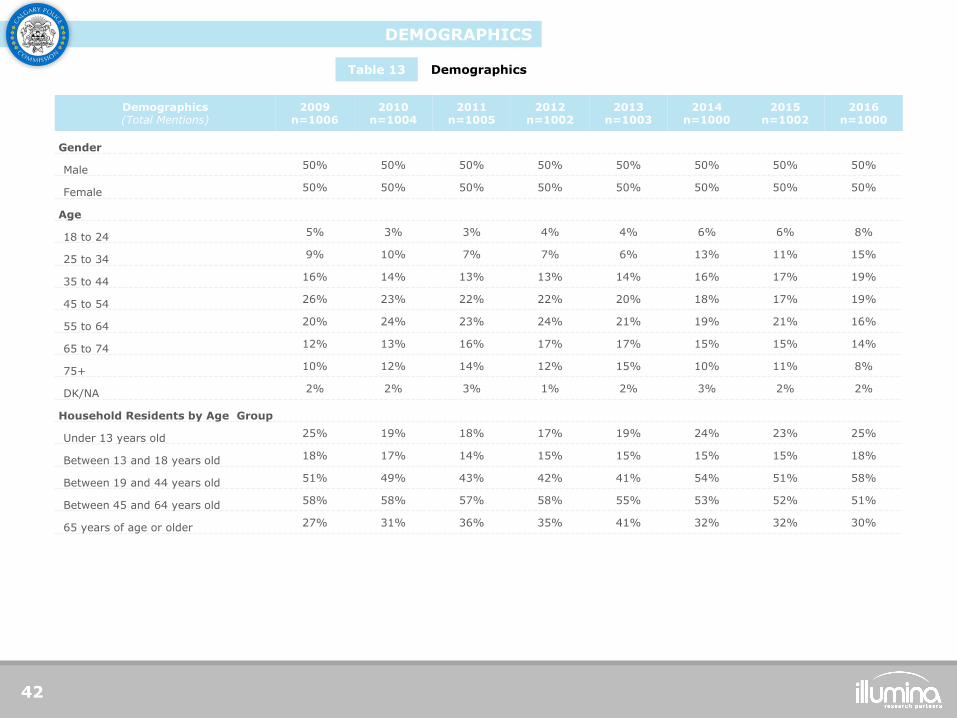
Demographics Table 13
Demographics (Total Mentions)
2009 n=1006
2010 n=1004
2011 n=1005
2012 n=1002
2013 n=1003
2014 n=1000
2015 n=1002
2016 n=1000
Gender
Male 50% 50% 50% 50% 50% 50% 50% 50%
Female 50% 50% 50% 50% 50% 50% 50% 50%
Age
18 to 24 5% 3% 3% 4% 4% 6% 6% 8%
25 to 34 9% 10% 7% 7% 6% 13% 11% 15%
35 to 44 16% 14% 13% 13% 14% 16% 17% 19%
45 to 54 26% 23% 22% 22% 20% 18% 17% 19%
55 to 64 20% 24% 23% 24% 21% 19% 21% 16%
65 to 74 12% 13% 16% 17% 17% 15% 15% 14%
75+ 10% 12% 14% 12% 15% 10% 11% 8%
DK/NA 2% 2% 3% 1% 2% 3% 2% 2%
Household Residents by Age Group
Under 13 years old 25% 19% 18% 17% 19% 24% 23% 25%
Between 13 and 18 years old 18% 17% 14% 15% 15% 15% 15% 18%
Between 19 and 44 years old 51% 49% 43% 42% 41% 54% 51% 58%
Between 45 and 64 years old 58% 58% 57% 58% 55% 53% 52% 51%
65 years of age or older 27% 31% 36% 35% 41% 32% 32% 30%
DEMOGRAPHICS
42
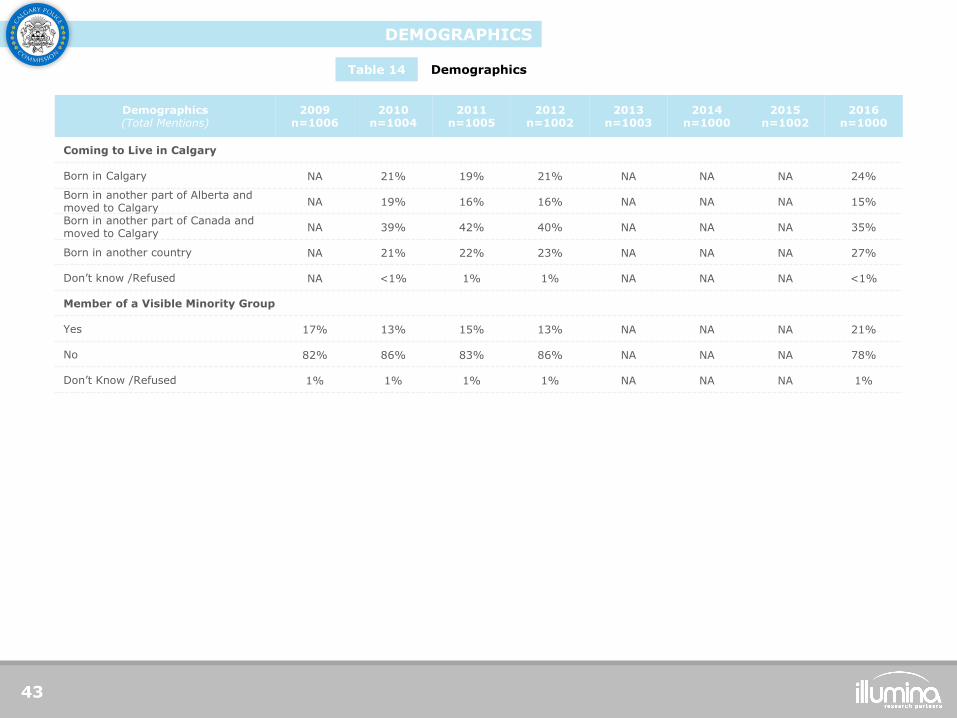
Demographics Table 14
Demographics (Total Mentions)
2009 n=1006
2010 n=1004
2011 n=1005
2012 n=1002
2013 n=1003
2014 n=1000
2015 n=1002
2016 n=1000
Coming to Live in Calgary
Born in Calgary NA 21% 19% 21% NA NA NA 24%
Born in another part of Alberta and moved to Calgary
NA 19% 16% 16% NA NA NA 15%
Born in another part of Canada and moved to Calgary
NA 39% 42% 40% NA NA NA 35%
Born in another country NA 21% 22% 23% NA NA NA 27%
Don’t know /Refused NA <1% 1% 1% NA NA NA <1%
Member of a Visible Minority Group
Yes 17% 13% 15% 13% NA NA NA 21%
No 82% 86% 83% 86% NA NA NA 78%
Don’t Know /Refused 1% 1% 1% 1% NA NA NA 1%
DEMOGRAPHICS
43

44
Appendix C:
CPPI Calculation
45
CALGARY POLICE PERCEPTION INDEX (CPPI)
The CPPI is calculated as follows: each individual’s score from the 3 component questions are
combined and divided by the total number of questions. This results in an index score for Calgary
Police Perception. .
The Calgary Police Perception Index (CPPI) represents an overall measure of the service’s reputation and allows for a) a comparison of perceptions between key demographic groups and b) for tracking over time to identify changes in community perceptions.
The index uses three key perception measures to profile citizens overall opinions of the CPS. The questions used are illustrated in the diagram to the right. Advanced analytics were used to develop the CPPI and to capture the three measures which represent the strongest combination of factors.
Low High
Officer Competence
Level of Service
Overall Rating
Calculation of the Calgary Police Perception Index (CPPI)
1-6 7-8 9-10
1-6 7-8 9-10
1-6 7-8 9-10

46
Appendix D:
Additional Reporting
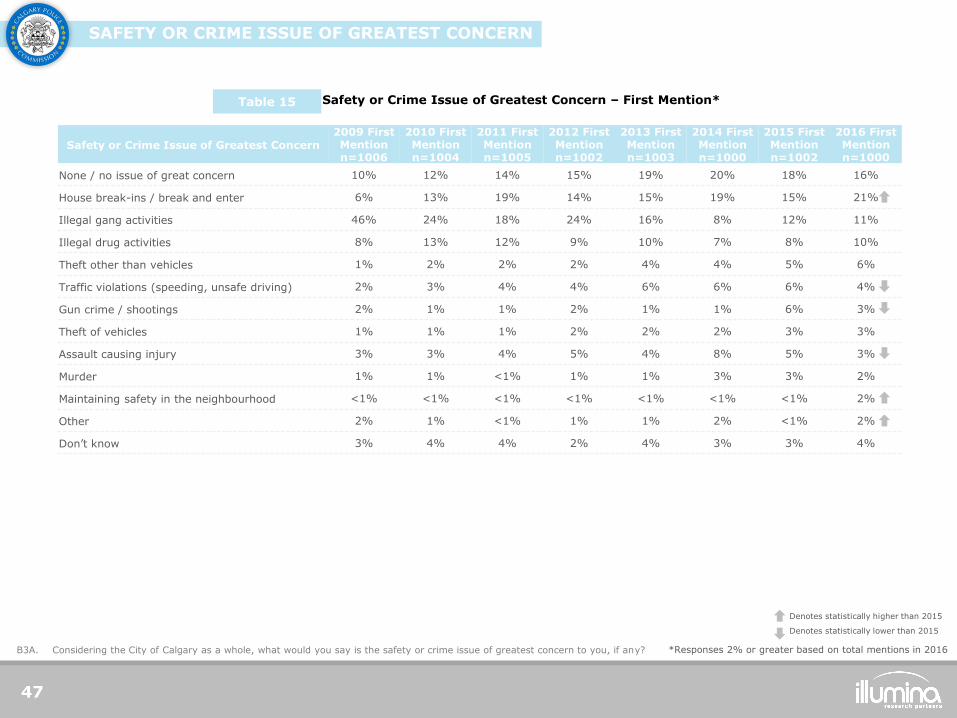
Safety or Crime Issue of Greatest Concern – First Mention* Table 15
Considering the City of Calgary as a whole, what would you say is the safety or crime issue of greatest concern to you, if any? B3A.
SAFETY OR CRIME ISSUE OF GREATEST CONCERN
47
Safety or Crime Issue of Greatest Concern
2009 First Mention n=1006
2010 First Mention n=1004
2011 First Mention n=1005
2012 First Mention n=1002
2013 First Mention n=1003
2014 First Mention n=1000
2015 First Mention n=1002
2016 First Mention n=1000
None / no issue of great concern 10% 12% 14% 15% 19% 20% 18% 16%
House break-ins / break and enter 6% 13% 19% 14% 15% 19% 15% 21%
Illegal gang activities 46% 24% 18% 24% 16% 8% 12% 11%
Illegal drug activities 8% 13% 12% 9% 10% 7% 8% 10%
Theft other than vehicles 1% 2% 2% 2% 4% 4% 5% 6%
Traffic violations (speeding, unsafe driving) 2% 3% 4% 4% 6% 6% 6% 4%
Gun crime / shootings 2% 1% 1% 2% 1% 1% 6% 3%
Theft of vehicles 1% 1% 1% 2% 2% 2% 3% 3%
Assault causing injury 3% 3% 4% 5% 4% 8% 5% 3%
Murder 1% 1% <1% 1% 1% 3% 3% 2%
Maintaining safety in the neighbourhood <1% <1% <1% <1% <1% <1% <1% 2%
Other 2% 1% <1% 1% 1% 2% <1% 2%
Don’t know 3% 4% 4% 2% 4% 3% 3% 4%
*Responses 2% or greater based on total mentions in 2016
Denotes statistically higher than 2015
Denotes statistically lower than 2015
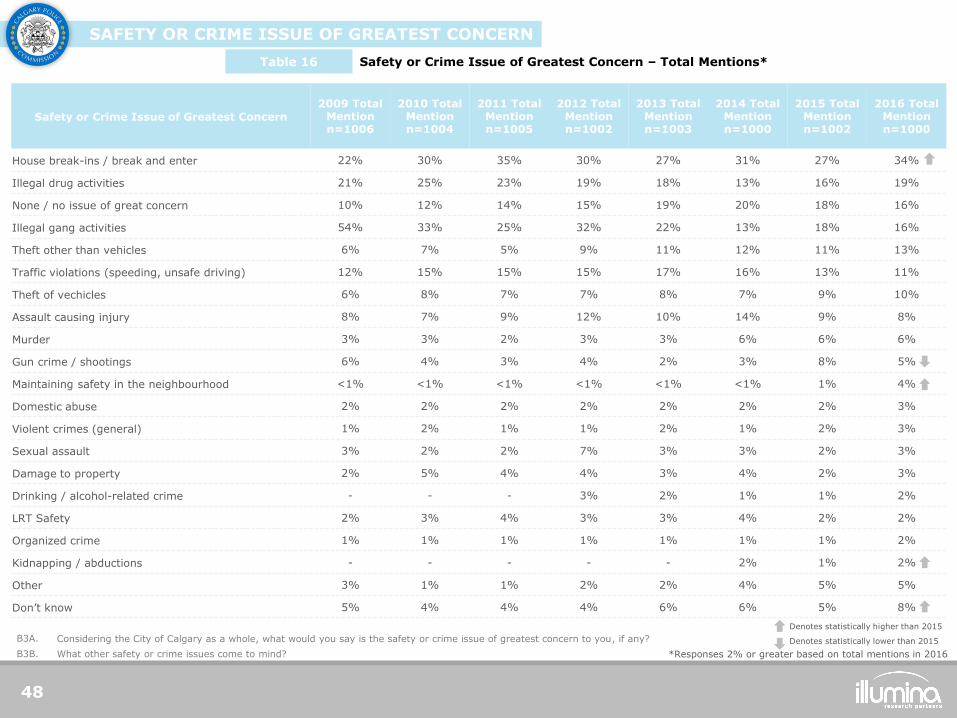
Safety or Crime Issue of Greatest Concern – Total Mentions* Table 16
Considering the City of Calgary as a whole, what would you say is the safety or crime issue of greatest concern to you, if any?
What other safety or crime issues come to mind?
B3A.
B3B.
Safety or Crime Issue of Greatest Concern
2009 Total Mention n=1006
2010 Total Mention n=1004
2011 Total Mention n=1005
2012 Total Mention n=1002
2013 Total Mention n=1003
2014 Total Mention n=1000
2015 Total Mention n=1002
2016 Total Mention n=1000
House break-ins / break and enter 22% 30% 35% 30% 27% 31% 27% 34%
Illegal drug activities 21% 25% 23% 19% 18% 13% 16% 19%
None / no issue of great concern 10% 12% 14% 15% 19% 20% 18% 16%
Illegal gang activities 54% 33% 25% 32% 22% 13% 18% 16%
Theft other than vehicles 6% 7% 5% 9% 11% 12% 11% 13%
Traffic violations (speeding, unsafe driving) 12% 15% 15% 15% 17% 16% 13% 11%
Theft of vechicles 6% 8% 7% 7% 8% 7% 9% 10%
Assault causing injury 8% 7% 9% 12% 10% 14% 9% 8%
Murder 3% 3% 2% 3% 3% 6% 6% 6%
Gun crime / shootings 6% 4% 3% 4% 2% 3% 8% 5%
Maintaining safety in the neighbourhood <1% <1% <1% <1% <1% <1% 1% 4%
Domestic abuse 2% 2% 2% 2% 2% 2% 2% 3%
Violent crimes (general) 1% 2% 1% 1% 2% 1% 2% 3%
Sexual assault 3% 2% 2% 7% 3% 3% 2% 3%
Damage to property 2% 5% 4% 4% 3% 4% 2% 3%
Drinking / alcohol-related crime - - - 3% 2% 1% 1% 2%
LRT Safety 2% 3% 4% 3% 3% 4% 2% 2%
Organized crime 1% 1% 1% 1% 1% 1% 1% 2%
Kidnapping / abductions - - - - - 2% 1% 2%
Other 3% 1% 1% 2% 2% 4% 5% 5%
Don’t know 5% 4% 4% 4% 6% 6% 5% 8%
SAFETY OR CRIME ISSUE OF GREATEST CONCERN
48
*Responses 2% or greater based on total mentions in 2016
Denotes statistically higher than 2015
Denotes statistically lower than 2015
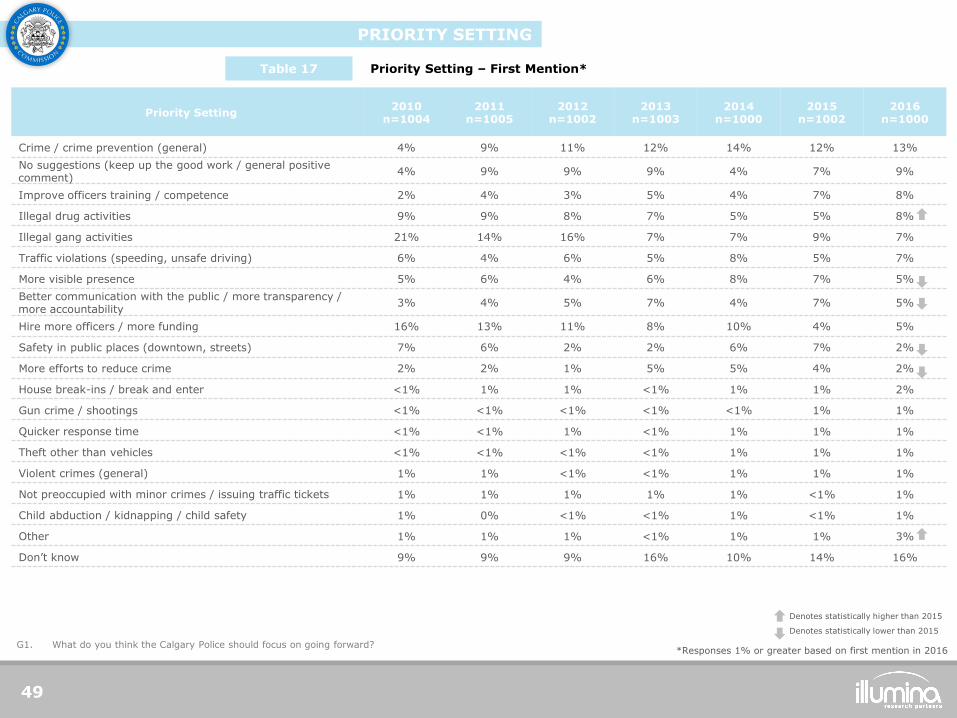
PRIORITY SETTING
49
Priority Setting 2010
n=1004 2011
n=1005 2012
n=1002 2013
n=1003 2014
n=1000 2015
n=1002 2016
n=1000
Crime / crime prevention (general) 4% 9% 11% 12% 14% 12% 13%
No suggestions (keep up the good work / general positive comment)
4% 9% 9% 9% 4% 7% 9%
Improve officers training / competence 2% 4% 3% 5% 4% 7% 8%
Illegal drug activities 9% 9% 8% 7% 5% 5% 8%
Illegal gang activities 21% 14% 16% 7% 7% 9% 7%
Traffic violations (speeding, unsafe driving) 6% 4% 6% 5% 8% 5% 7%
More visible presence 5% 6% 4% 6% 8% 7% 5%
Better communication with the public / more transparency / more accountability
3% 4% 5% 7% 4% 7% 5%
Hire more officers / more funding 16% 13% 11% 8% 10% 4% 5%
Safety in public places (downtown, streets) 7% 6% 2% 2% 6% 7% 2%
More efforts to reduce crime 2% 2% 1% 5% 5% 4% 2%
House break-ins / break and enter <1% 1% 1% <1% 1% 1% 2%
Gun crime / shootings <1% <1% <1% <1% <1% 1% 1%
Quicker response time <1% <1% 1% <1% 1% 1% 1%
Theft other than vehicles <1% <1% <1% <1% 1% 1% 1%
Violent crimes (general) 1% 1% <1% <1% 1% 1% 1%
Not preoccupied with minor crimes / issuing traffic tickets 1% 1% 1% 1% 1% <1% 1%
Child abduction / kidnapping / child safety 1% 0% <1% <1% 1% <1% 1%
Other 1% 1% 1% <1% 1% 1% 3%
Don’t know 9% 9% 9% 16% 10% 14% 16%
What do you think the Calgary Police should focus on going forward? G1. *Responses 1% or greater based on first mention in 2016
Priority Setting – First Mention* Table 17
Denotes statistically higher than 2015
Denotes statistically lower than 2015
PRIORITY SETTING
50
Priority Setting 2010
n=1004 2011
n=1005 2012
n=1002 2013
n=1003 2014
n=1000 2015
n=1002 2016
n=1000
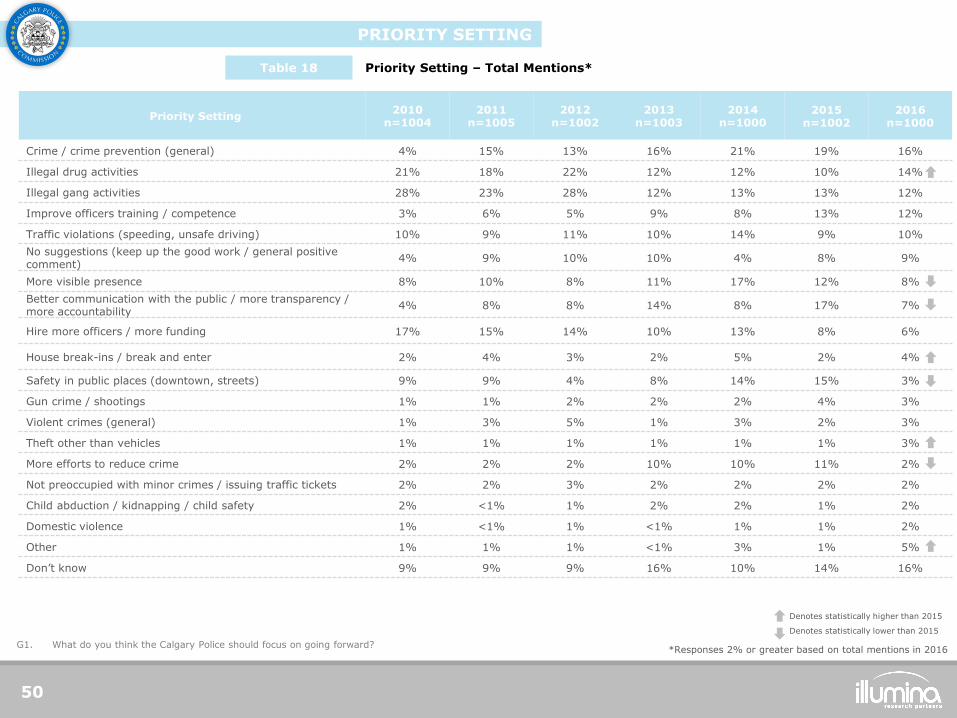
Crime / crime prevention (general) 4% 15% 13% 16% 21% 19% 16%
Illegal drug activities 21% 18% 22% 12% 12% 10% 14%
Illegal gang activities 28% 23% 28% 12% 13% 13% 12%
Improve officers training / competence 3% 6% 5% 9% 8% 13% 12%
Traffic violations (speeding, unsafe driving) 10% 9% 11% 10% 14% 9% 10%
No suggestions (keep up the good work / general positive comment)
4% 9% 10% 10% 4% 8% 9%
More visible presence 8% 10% 8% 11% 17% 12% 8%
Better communication with the public / more transparency / more accountability
4% 8% 8% 14% 8% 17% 7%
Hire more officers / more funding 17% 15% 14% 10% 13% 8% 6%
House break-ins / break and enter 2% 4% 3% 2% 5% 2% 4%
Safety in public places (downtown, streets) 9% 9% 4% 8% 14% 15% 3%
Gun crime / shootings 1% 1% 2% 2% 2% 4% 3%
Violent crimes (general) 1% 3% 5% 1% 3% 2% 3%
Theft other than vehicles 1% 1% 1% 1% 1% 1% 3%
More efforts to reduce crime 2% 2% 2% 10% 10% 11% 2%
Not preoccupied with minor crimes / issuing traffic tickets 2% 2% 3% 2% 2% 2% 2%
Child abduction / kidnapping / child safety 2% <1% 1% 2% 2% 1% 2%
Domestic violence 1% <1% 1% <1% 1% 1% 2%
Other 1% 1% 1% <1% 3% 1% 5%
Don’t know 9% 9% 9% 16% 10% 14% 16%
What do you think the Calgary Police should focus on going forward? G1. *Responses 2% or greater based on total mentions in 2016
Priority Setting – Total Mentions* Table 18
Denotes statistically higher than 2015
Denotes statistically lower than 2015
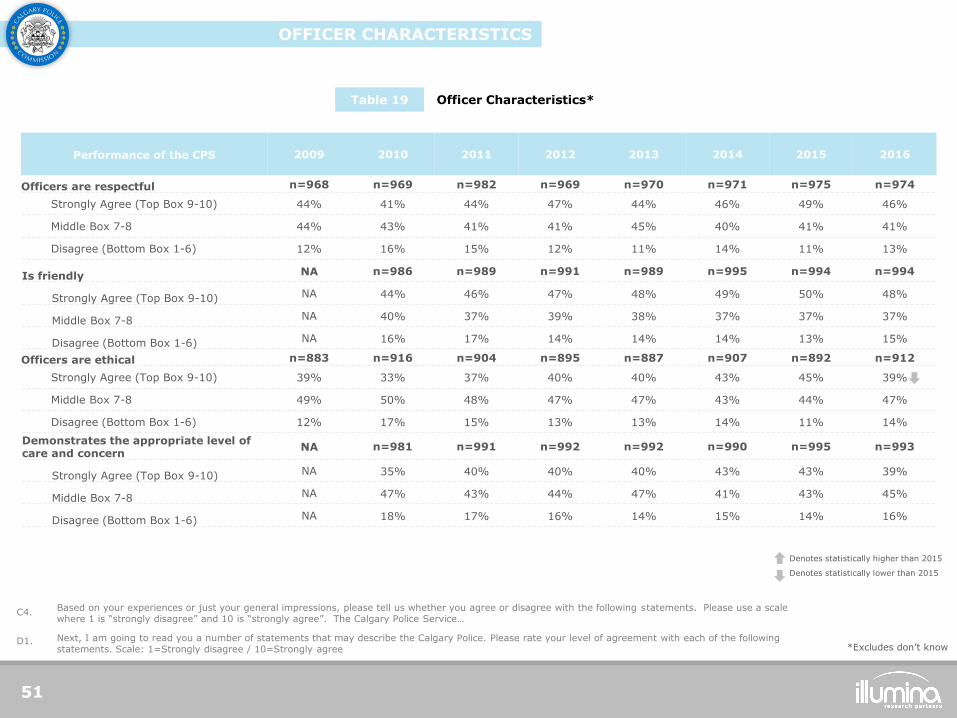
Officer Characteristics* Table 19
Performance of the CPS 2009 2010 2011 2012 2013 2014 2015 2016
Officers are respectful n=968 n=969 n=982 n=969 n=970 n=971 n=975 n=974
Strongly Agree (Top Box 9-10) 44% 41% 44% 47% 44% 46% 49% 46%
Middle Box 7-8 44% 43% 41% 41% 45% 40% 41% 41%
Disagree (Bottom Box 1-6) 12% 16% 15% 12% 11% 14% 11% 13%
Is friendly NA n=986 n=989 n=991 n=989 n=995 n=994 n=994
Strongly Agree (Top Box 9-10) NA 44% 46% 47% 48% 49% 50% 48%
Middle Box 7-8 NA 40% 37% 39% 38% 37% 37% 37%
Disagree (Bottom Box 1-6) NA 16% 17% 14% 14% 14% 13% 15%
Officers are ethical n=883 n=916 n=904 n=895 n=887 n=907 n=892 n=912
Strongly Agree (Top Box 9-10) 39% 33% 37% 40% 40% 43% 45% 39%
Middle Box 7-8 49% 50% 48% 47% 47% 43% 44% 47%
Disagree (Bottom Box 1-6) 12% 17% 15% 13% 13% 14% 11% 14%
Demonstrates the appropriate level of care and concern
NA n=981 n=991 n=992 n=992 n=990 n=995 n=993
Strongly Agree (Top Box 9-10) NA 35% 40% 40% 40% 43% 43% 39%
Middle Box 7-8 NA 47% 43% 44% 47% 41% 43% 45%
Disagree (Bottom Box 1-6) NA 18% 17% 16% 14% 15% 14% 16%
*Excludes don’t know
OFFICER CHARACTERISTICS
51
Based on your experiences or just your general impressions, please tell us whether you agree or disagree with the following statements. Please use a scale where 1 is “strongly disagree” and 10 is “strongly agree”. The Calgary Police Service…
Next, I am going to read you a number of statements that may describe the Calgary Police. Please rate your level of agreement with each of the following statements. Scale: 1=Strongly disagree / 10=Strongly agree
C4.
D1.
Denotes statistically higher than 2015
Denotes statistically lower than 2015
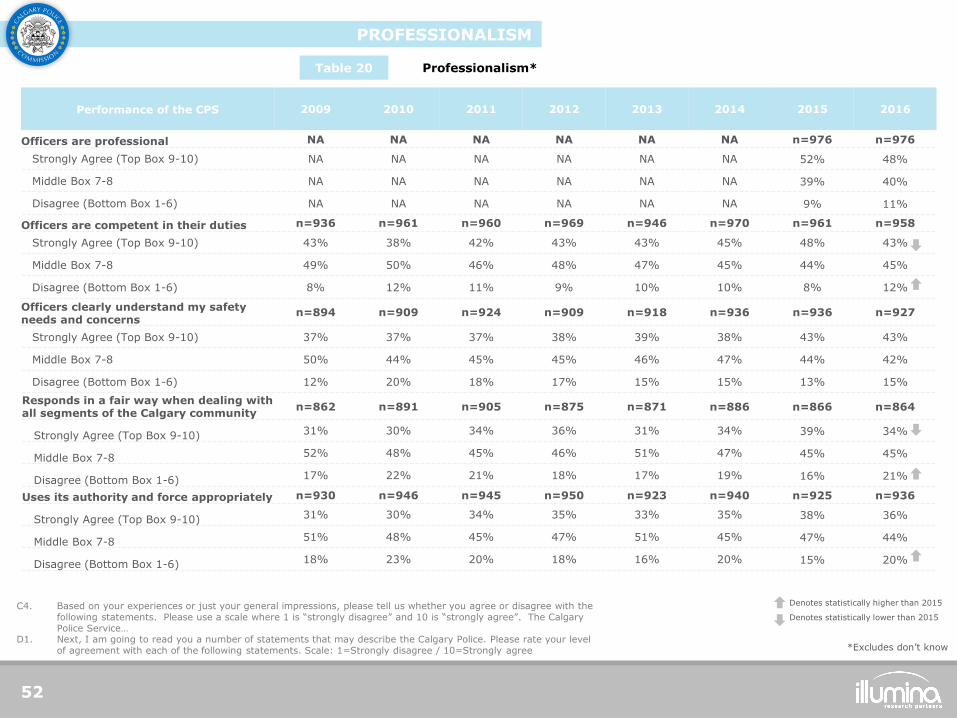
PROFESSIONALISM
Professionalism* Table 20
Performance of the CPS 2009 2010 2011 2012 2013 2014 2015 2016
Officers are professional NA NA NA NA NA NA n=976 n=976
Strongly Agree (Top Box 9-10) NA NA NA NA NA NA 52% 48%
Middle Box 7-8 NA NA NA NA NA NA 39% 40%
Disagree (Bottom Box 1-6) NA NA NA NA NA NA 9% 11%
Officers are competent in their duties n=936 n=961 n=960 n=969 n=946 n=970 n=961 n=958
Strongly Agree (Top Box 9-10) 43% 38% 42% 43% 43% 45% 48% 43%
Middle Box 7-8 49% 50% 46% 48% 47% 45% 44% 45%
Disagree (Bottom Box 1-6) 8% 12% 11% 9% 10% 10% 8% 12%
Officers clearly understand my safety needs and concerns
n=894 n=909 n=924 n=909 n=918 n=936 n=936 n=927
Strongly Agree (Top Box 9-10) 37% 37% 37% 38% 39% 38% 43% 43%
Middle Box 7-8 50% 44% 45% 45% 46% 47% 44% 42%
Disagree (Bottom Box 1-6) 12% 20% 18% 17% 15% 15% 13% 15%
Responds in a fair way when dealing with all segments of the Calgary community
n=862 n=891 n=905 n=875 n=871 n=886 n=866 n=864
Strongly Agree (Top Box 9-10) 31% 30% 34% 36% 31% 34% 39% 34%
Middle Box 7-8 52% 48% 45% 46% 51% 47% 45% 45%
Disagree (Bottom Box 1-6) 17% 22% 21% 18% 17% 19% 16% 21%
Uses its authority and force appropriately n=930 n=946 n=945 n=950 n=923 n=940 n=925 n=936
Strongly Agree (Top Box 9-10) 31% 30% 34% 35% 33% 35% 38% 36%
Middle Box 7-8 51% 48% 45% 47% 51% 45% 47% 44%
Disagree (Bottom Box 1-6) 18% 23% 20% 18% 16% 20% 15% 20%
*Excludes don’t know
52
Based on your experiences or just your general impressions, please tell us whether you agree or disagree with the following statements. Please use a scale where 1 is “strongly disagree” and 10 is “strongly agree”. The Calgary Police Service…
C4.
D1. Next, I am going to read you a number of statements that may describe the Calgary Police. Please rate your level of agreement with each of the following statements. Scale: 1=Strongly disagree / 10=Strongly agree
Denotes statistically higher than 2015
Denotes statistically lower than 2015
SERVICE
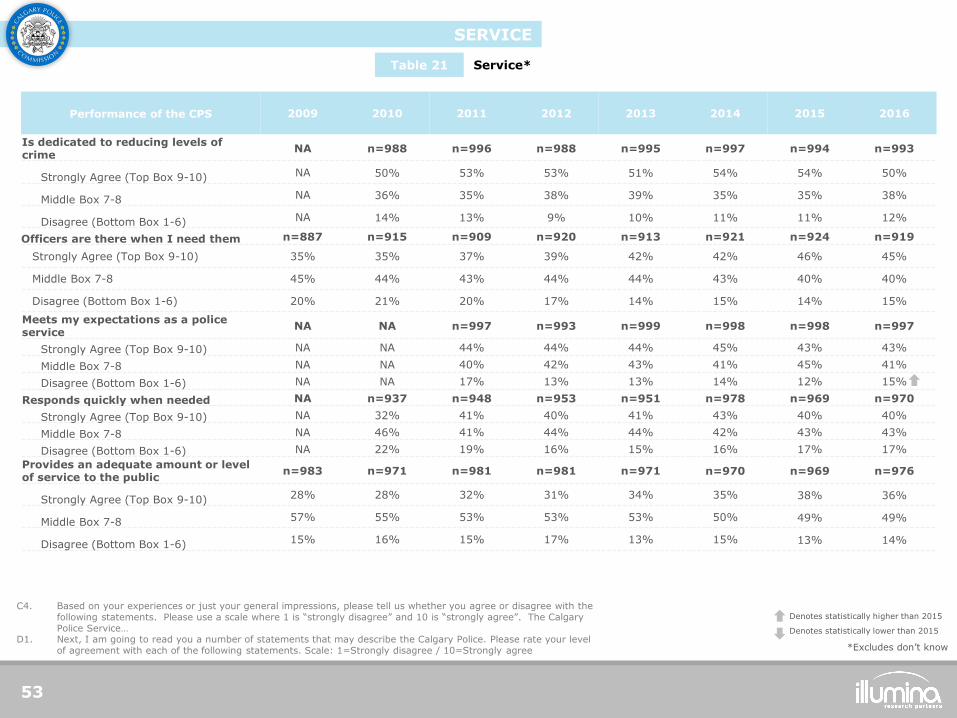
Service* Table 21
Performance of the CPS 2009 2010 2011 2012 2013 2014 2015 2016
Is dedicated to reducing levels of crime
NA n=988 n=996 n=988 n=995 n=997 n=994 n=993
Strongly Agree (Top Box 9-10) NA 50% 53% 53% 51% 54% 54% 50%
Middle Box 7-8 NA 36% 35% 38% 39% 35% 35% 38%
Disagree (Bottom Box 1-6) NA 14% 13% 9% 10% 11% 11% 12%
Officers are there when I need them n=887 n=915 n=909 n=920 n=913 n=921 n=924 n=919
Strongly Agree (Top Box 9-10) 35% 35% 37% 39% 42% 42% 46% 45%
Middle Box 7-8 45% 44% 43% 44% 44% 43% 40% 40%
Disagree (Bottom Box 1-6) 20% 21% 20% 17% 14% 15% 14% 15%
Meets my expectations as a police service
NA NA n=997 n=993 n=999 n=998 n=998 n=997
Strongly Agree (Top Box 9-10) NA NA 44% 44% 44% 45% 43% 43%
Middle Box 7-8 NA NA 40% 42% 43% 41% 45% 41%
Disagree (Bottom Box 1-6) NA NA 17% 13% 13% 14% 12% 15%
Responds quickly when needed NA n=937 n=948 n=953 n=951 n=978 n=969 n=970
Strongly Agree (Top Box 9-10) NA 32% 41% 40% 41% 43% 40% 40%
Middle Box 7-8 NA 46% 41% 44% 44% 42% 43% 43%
Disagree (Bottom Box 1-6) NA 22% 19% 16% 15% 16% 17% 17%
Provides an adequate amount or level of service to the public
n=983 n=971 n=981 n=981 n=971 n=970 n=969 n=976
Strongly Agree (Top Box 9-10) 28% 28% 32% 31% 34% 35% 38% 36%
Middle Box 7-8 57% 55% 53% 53% 53% 50% 49% 49%
Disagree (Bottom Box 1-6) 15% 16% 15% 17% 13% 15% 13% 14%
*Excludes don’t know
53
Based on your experiences or just your general impressions, please tell us whether you agree or disagree with the following statements. Please use a scale where 1 is “strongly disagree” and 10 is “strongly agree”. The Calgary Police Service…
C4.
D1. Next, I am going to read you a number of statements that may describe the Calgary Police. Please rate your level of agreement with each of the following statements. Scale: 1=Strongly disagree / 10=Strongly agree
Denotes statistically higher than 2015
Denotes statistically lower than 2015
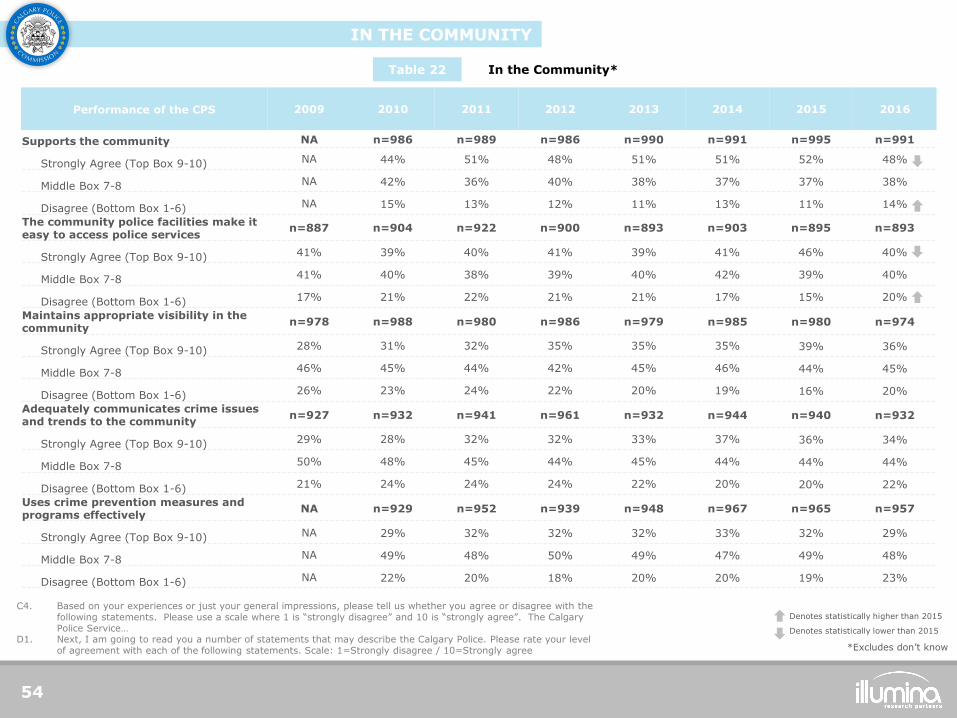
IN THE COMMUNITY
In the Community* Table 22
*Excludes don’t know
54
Based on your experiences or just your general impressions, please tell us whether you agree or disagree with the following statements. Please use a scale where 1 is “strongly disagree” and 10 is “strongly agree”. The Calgary Police Service…
C4.
D1. Next, I am going to read you a number of statements that may describe the Calgary Police. Please rate your level of agreement with each of the following statements. Scale: 1=Strongly disagree / 10=Strongly agree
Performance of the CPS 2009 2010 2011 2012 2013 2014 2015 2016
Supports the community NA n=986 n=989 n=986 n=990 n=991 n=995 n=991
Strongly Agree (Top Box 9-10) NA 44% 51% 48% 51% 51% 52% 48%
Middle Box 7-8 NA 42% 36% 40% 38% 37% 37% 38%
Disagree (Bottom Box 1-6) NA 15% 13% 12% 11% 13% 11% 14%
The community police facilities make it easy to access police services
n=887 n=904 n=922 n=900 n=893 n=903 n=895 n=893
Strongly Agree (Top Box 9-10) 41% 39% 40% 41% 39% 41% 46% 40%
Middle Box 7-8 41% 40% 38% 39% 40% 42% 39% 40%
Disagree (Bottom Box 1-6) 17% 21% 22% 21% 21% 17% 15% 20%
Maintains appropriate visibility in the community
n=978 n=988 n=980 n=986 n=979 n=985 n=980 n=974
Strongly Agree (Top Box 9-10) 28% 31% 32% 35% 35% 35% 39% 36%
Middle Box 7-8 46% 45% 44% 42% 45% 46% 44% 45%
Disagree (Bottom Box 1-6) 26% 23% 24% 22% 20% 19% 16% 20%
Adequately communicates crime issues and trends to the community
n=927 n=932 n=941 n=961 n=932 n=944 n=940 n=932
Strongly Agree (Top Box 9-10) 29% 28% 32% 32% 33% 37% 36% 34%
Middle Box 7-8 50% 48% 45% 44% 45% 44% 44% 44%
Disagree (Bottom Box 1-6) 21% 24% 24% 24% 22% 20% 20% 22%
Uses crime prevention measures and programs effectively
NA n=929 n=952 n=939 n=948 n=967 n=965 n=957
Strongly Agree (Top Box 9-10) NA 29% 32% 32% 32% 33% 32% 29%
Middle Box 7-8 NA 49% 48% 50% 49% 47% 49% 48%
Disagree (Bottom Box 1-6) NA 22% 20% 18% 20% 20% 19% 23%
Denotes statistically higher than 2015
Denotes statistically lower than 2015
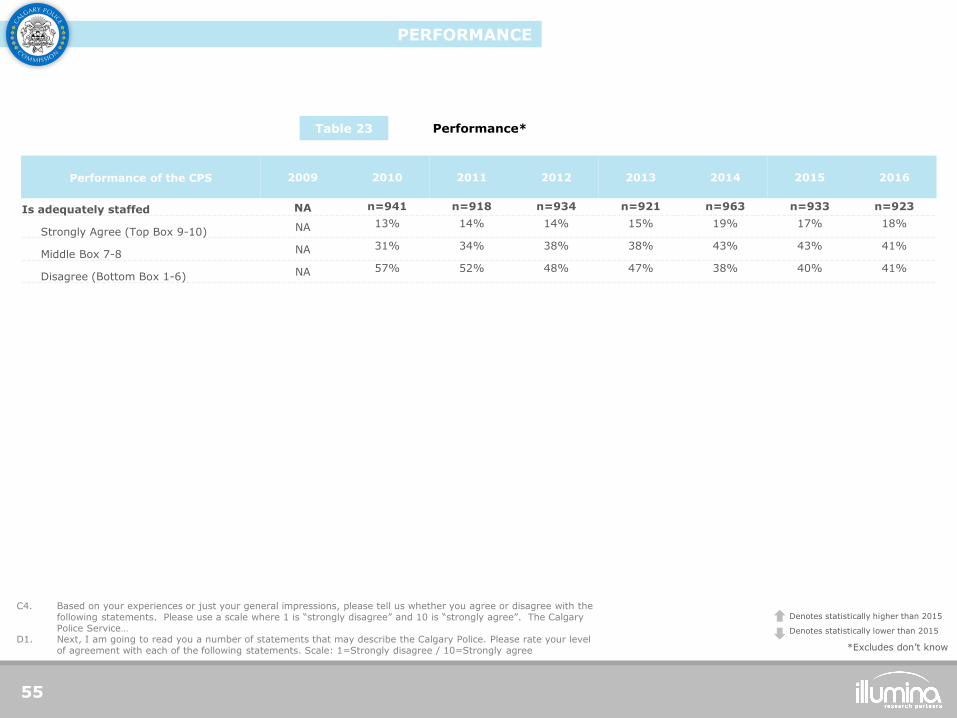
PERFORMANCE
Performance* Table 23
Performance of the CPS 2009 2010 2011 2012 2013 2014 2015 2016
Is adequately staffed NA n=941 n=918 n=934 n=921 n=963 n=933 n=923
Strongly Agree (Top Box 9-10) NA 13% 14% 14% 15% 19% 17% 18%
Middle Box 7-8 NA 31% 34% 38% 38% 43% 43% 41%
Disagree (Bottom Box 1-6) NA 57% 52% 48% 47% 38% 40% 41%
*Excludes don’t know
55
Based on your experiences or just your general impressions, please tell us whether you agree or disagree with the following statements. Please use a scale where 1 is “strongly disagree” and 10 is “strongly agree”. The Calgary Police Service…
C4.
D1. Next, I am going to read you a number of statements that may describe the Calgary Police. Please rate your level of agreement with each of the following statements. Scale: 1=Strongly disagree / 10=Strongly agree
Denotes statistically higher than 2015
Denotes statistically lower than 2015
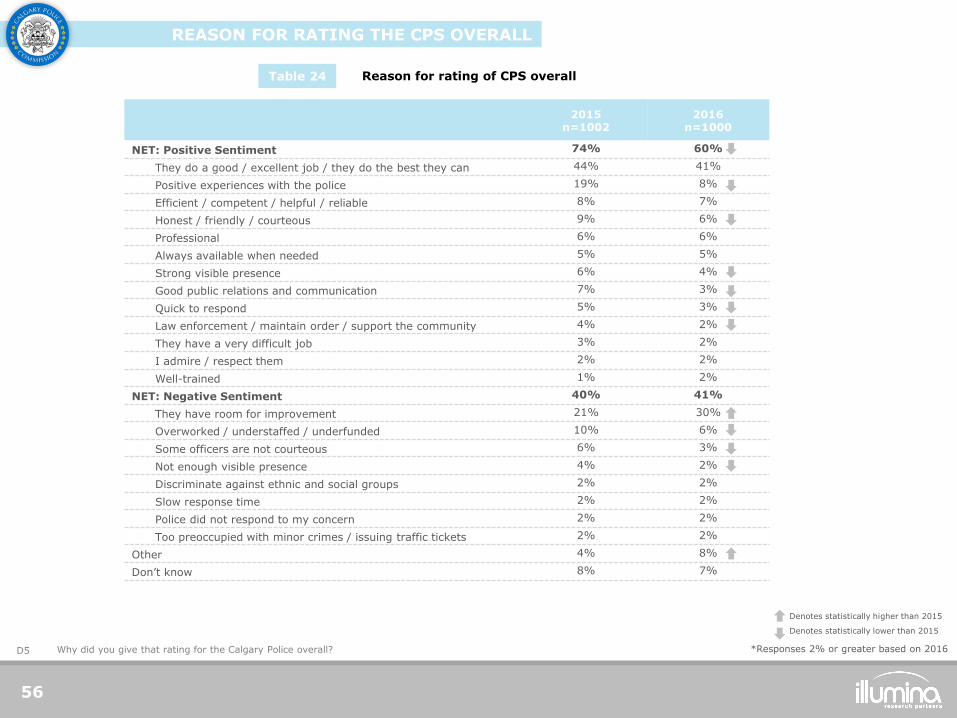
REASON FOR RATING THE CPS OVERALL
56
Reason for rating of CPS overall Table 24
2015 n=1002
2016 n=1000
NET: Positive Sentiment 74% 60%
They do a good / excellent job / they do the best they can 44% 41%
Positive experiences with the police 19% 8%
Efficient / competent / helpful / reliable 8% 7%
Honest / friendly / courteous 9% 6%
Professional 6% 6%
Always available when needed 5% 5%
Strong visible presence 6% 4%
Good public relations and communication 7% 3%
Quick to respond 5% 3%
Law enforcement / maintain order / support the community 4% 2%
They have a very difficult job 3% 2%
I admire / respect them 2% 2%
Well-trained 1% 2%
NET: Negative Sentiment 40% 41%
They have room for improvement 21% 30%
Overworked / understaffed / underfunded 10% 6%
Some officers are not courteous 6% 3%
Not enough visible presence 4% 2%
Discriminate against ethnic and social groups 2% 2%
Slow response time 2% 2%
Police did not respond to my concern 2% 2%
Too preoccupied with minor crimes / issuing traffic tickets 2% 2%
Other 4% 8%
Don’t know 8% 7%
Why did you give that rating for the Calgary Police overall? D5 *Responses 2% or greater based on 2016
Denotes statistically higher than 2015
Denotes statistically lower than 2015
NEIGHBOURHOOD TRAFFIC SAFETY
57
Neighbourhood Traffic Concerns Table 25
Type of Traffic Concern 2016
n=1000
Speeding (non-specified) 43%
None / no issue of great concern 23%
School or playground zone safety issues 13%
Careless driving / not following signs or rules (general) 8%
Intersection safety issues 7%
Pedestrian safety issues (e.g., jaywalking) 6%
Need crosswalks, traffic lights or stop signs 6%
Distracted driving 5%
Traffic volume / amount of traffic 4%
Commuter traffic cutting through neighbourhoods 3%
Parking / illegal parking 3%
Bicycle safety issues 3%
Traffic issues with kids at play (e.g. street hockey) 2%
Construction issues 2%
Signs not visible 1%
Motorcycle issues 1%
Impaired driving 1%
Trucks/commercial vehicles <1%
Other 7%
Don’t know 2%
Reason for Neighbourhood Traffic Safety Satisfaction
Table 26
What traffic issues, if any, are of greatest concern to you in your neighbourhood? [OPEN END] L2.
Reason for Neighbourhood Traffic Safety Satisfaction* 2016
n=1000
NET: Negative 54%
Issues with speeding 23%
Always room for improvement 11%
Lack of police presence / lack of enforcement 11%
Bad drivers – don’t obey signs/rules 8%
Traffic / congestion / commuters cut through my neighbourhood
7%
Bad drivers – other 5%
Issues with crosswalks 5%
I have witnessed / heard about accidents 5%
Bad drivers - aggressive / rude 2%
Issues with bike lanes / bicyclists 1%
NET: Positive 47%
No issues / everyone follows the rules / haven’t seen any 37%
Quiet neighbourhood / not a lot of traffic 10%
Satisfied with police presence / enforcement / issues being addressed
6%
No issues with speeding (specified) 4%
Other 4%
Don’t know / Refused 3%
Why did you give that rating for your satisfaction with traffic safety in your neighbourhood? [OPEN END] L4.
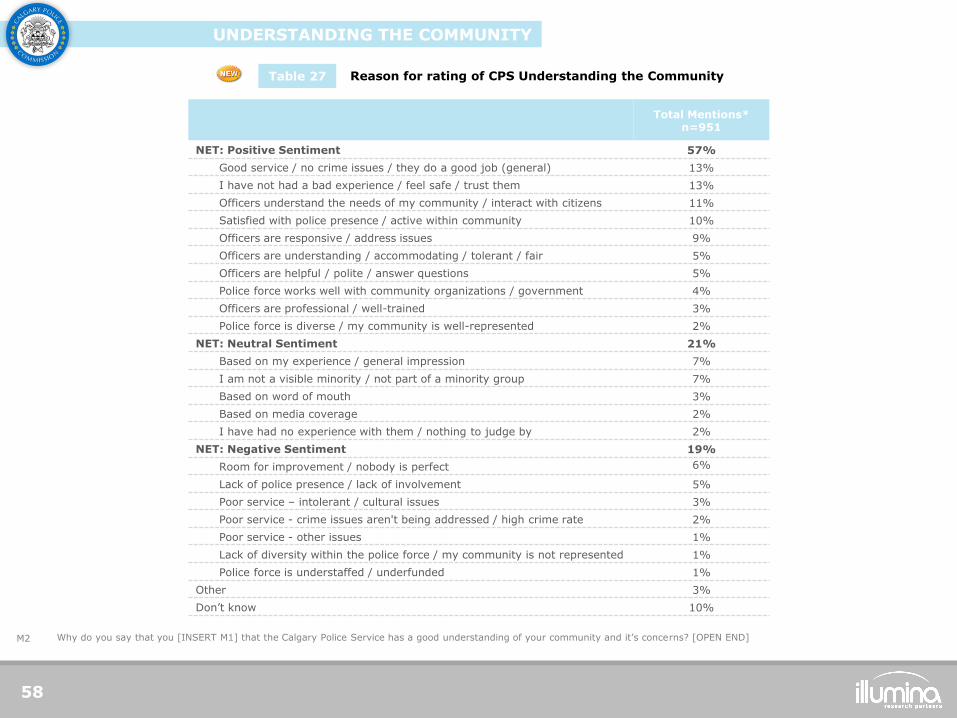
UNDERSTANDING THE COMMUNITY
58
Reason for rating of CPS Understanding the Community Table 27
Total Mentions* n=951
NET: Positive Sentiment 57%
Good service / no crime issues / they do a good job (general) 13%
I have not had a bad experience / feel safe / trust them 13%
Officers understand the needs of my community / interact with citizens 11%
Satisfied with police presence / active within community 10%
Officers are responsive / address issues 9%
Officers are understanding / accommodating / tolerant / fair 5%
Officers are helpful / polite / answer questions 5%
Police force works well with community organizations / government 4%
Officers are professional / well-trained 3%
Police force is diverse / my community is well-represented 2%
NET: Neutral Sentiment 21%
Based on my experience / general impression 7%
I am not a visible minority / not part of a minority group 7%
Based on word of mouth 3%
Based on media coverage 2%
I have had no experience with them / nothing to judge by 2%
NET: Negative Sentiment 19%
Room for improvement / nobody is perfect 6%
Lack of police presence / lack of involvement 5%
Poor service – intolerant / cultural issues 3%
Poor service - crime issues aren't being addressed / high crime rate 2%
Poor service - other issues 1%
Lack of diversity within the police force / my community is not represented 1%
Police force is understaffed / underfunded 1%
Other 3%
Don’t know 10%
Why do you say that you [INSERT M1] that the Calgary Police Service has a good understanding of your community and it’s concerns? [OPEN END] M2
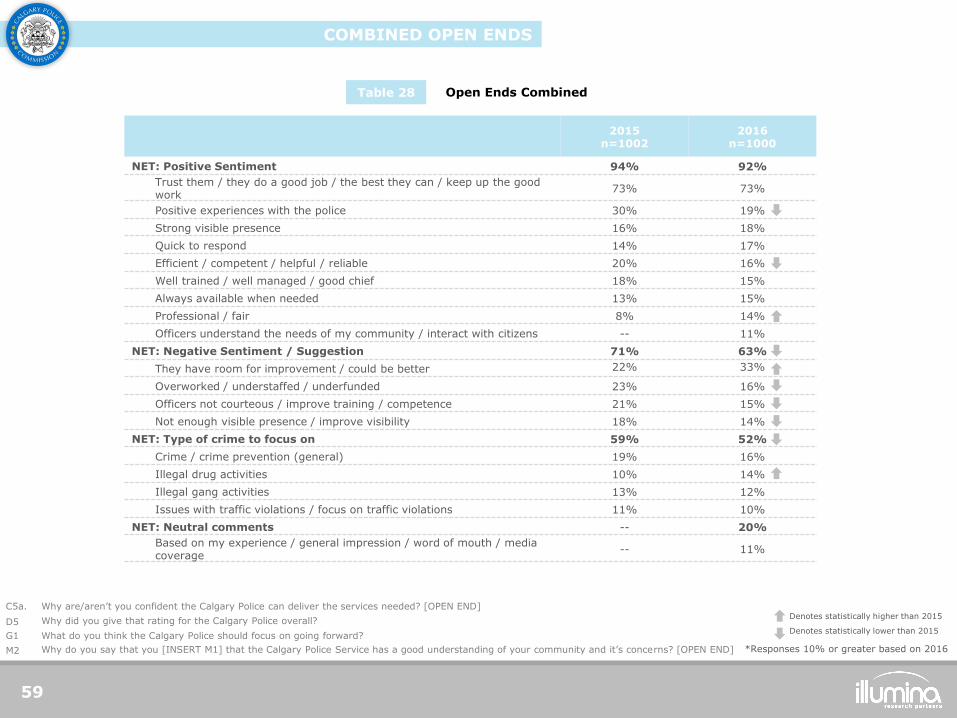
COMBINED OPEN ENDS
59
Open Ends Combined Table 28
2015 n=1002
2016 n=1000
NET: Positive Sentiment 94% 92%
Trust them / they do a good job / the best they can / keep up the good work
73% 73%
Positive experiences with the police 30% 19%
Strong visible presence 16% 18%
Quick to respond 14% 17%
Efficient / competent / helpful / reliable 20% 16%
Well trained / well managed / good chief 18% 15%
Always available when needed 13% 15%
Professional / fair 8% 14%
Officers understand the needs of my community / interact with citizens -- 11%
NET: Negative Sentiment / Suggestion 71% 63%
They have room for improvement / could be better 22% 33%
Overworked / understaffed / underfunded 23% 16%
Officers not courteous / improve training / competence 21% 15%
Not enough visible presence / improve visibility 18% 14%
NET: Type of crime to focus on 59% 52%
Crime / crime prevention (general) 19% 16%
Illegal drug activities 10% 14%
Illegal gang activities 13% 12%
Issues with traffic violations / focus on traffic violations 11% 10%
NET: Neutral comments -- 20%
Based on my experience / general impression / word of mouth / media coverage
-- 11%
Denotes statistically higher than 2015
Denotes statistically lower than 2015
*Responses 10% or greater based on 2016 Why do you say that you [INSERT M1] that the Calgary Police Service has a good understanding of your community and it’s concerns? [OPEN END] M2
What do you think the Calgary Police should focus on going forward? G1
Why did you give that rating for the Calgary Police overall? D5
Why are/aren’t you confident the Calgary Police can deliver the services needed? [OPEN END] C5a.

60
Appendix E:
Questionnaire
QUESTIONNAIRE
61
QUESTIONNAIRE
62
QUESTIONNAIRE
63
QUESTIONNAIRE
64
QUESTIONNAIRE
65
QUESTIONNAIRE
66
QUESTIONNAIRE
67