Embed Size (px)
Citation preview

International Student Enrollment
Berkeley International Office2299 Piedmont AvenueBerkeley, CA 94720-2321510.642.2818
http://[email protected]
Prepared by Berkeley International Office
Fall 2017
Female Male Total % Change from 2016
Undergraduate 1690 1773 3463 2.73%Graduate 980 1626 2606 11.75%EAP 137 139 276 11.29%
Total 6345
Rank Country Fall2016
Fall 2017
Fall 2017%Total
% Change from 2016
1 China 2021 2279 35.92% 12.77%
2 Korea, South 657 628 9.90% -4.41%
3 India 492 572 9.01% 16.26%
4 Canada 366 355 5.59% -3.01%
5 Taiwan 146 161 2.54% 10.27%
6 France 128 160 2.52% 25.00%
7 United Kingdom 126 153 2.41% 21.43%
8 Indonesia 146 148 2.33% 1.37%
9 Japan 121 127 2.00% 4.96%
10 Hong Kong 121 109 1.72% -9.92%
11 Singapore 92 93 1.47% 1.09%
12 Germany 79 91 1.43% 15.19%
13 Australia 75 87 1.37% 16.00%
14 Brazil 67 74 1.17% 10.45%
15 Malaysia 57 68 1.07% 19.30%
16 Thailand 70 67 1.06% -4.29%
17 Mexico 54 67 1.06% 24.07%
18 Turkey 72 66 1.04% -8.33%
19 Chile 60 57 0.90% -5.00%
20 Spain 51 56 0.88% 9.80%
Berkeley International OfficeFall 2017 International Student Enrollment
Applied Admitted Intend to Register
Freshmen 15373 1344 743
Transfer 3419 666 525
Graduate 18800 2840 1370
*This data was provided by UCB Undergraduate Admissions and Graduate Division.
Admission & Enrollment of New, Degree-Seeking Int’l Students* Top 20 Countries of Origin
Total Enrollment of International Students
Additional International Student Populations*
*This data is not included in the ‘Total Enrollment’ table shown above, but are populations served by Berkeley International Office and the University.
Page | 1
Female Male Total %Change from 2016
OPT & AT 1060 1493 2553 42.07%Masters Law (LLM)Summer Program 81 103 184 -3.16%
Summer Sessions 1643 1404 3047 -2.40%
Total 7801
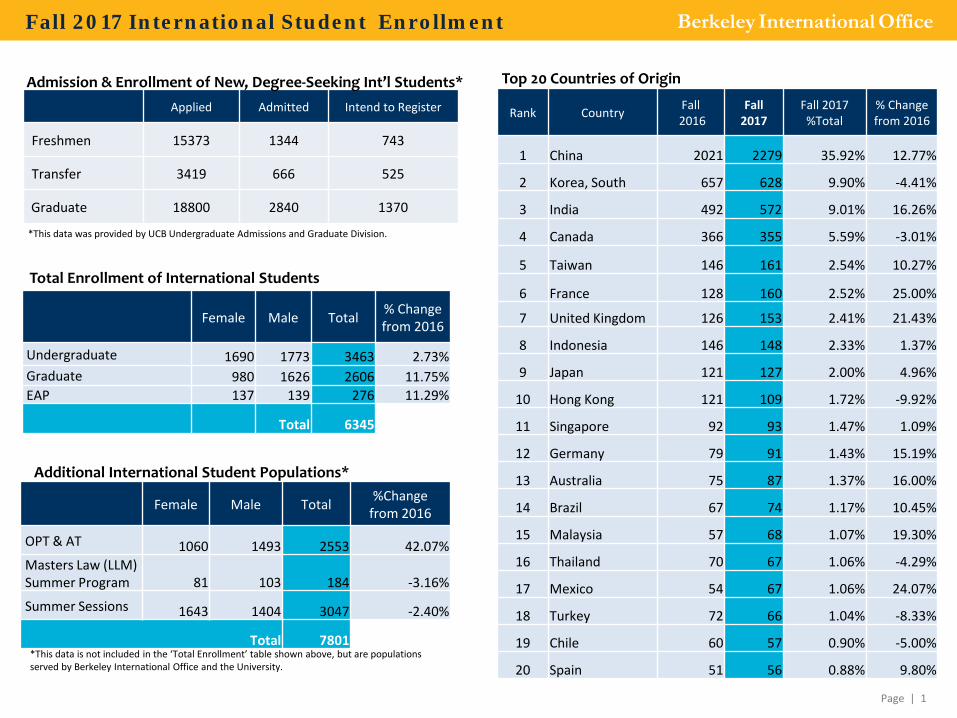
Total GRADUATE Enrollment: 10 Years*Total ALL International Student Enrollment: 10 Years
Total UNDERGRADUATE Enrollment: 10 Years
Page | 2
Berkeley International OfficeFall 2017 International Student Enrollment
30693419
3774
45484926
56455913 5846 5951
6345
2008 2009 2010 2011 2012 2013 2014 2015 2016 2017
1252%
390062%
85113%
1552%
64110%
67311%
Africa
East Asia and the Pacific
Europe and Eurasia
Near East
South and Central Asia
Western Hemisphere
Regions of Origin Fall 2016
*Includes EAP students
928
1270
1654
2284
2529
31483333
32973371 3463
2008 2009 2010 2011 2012 2013 2014 2015 2016 2017
1870 1878 1840
19702052
2170
2304 2314 2325
2606
2008 2009 2010 2011 2012 2013 2014 2015 2016 2017
BerkeleyInternationalOffice (BIO)
Page | 3
Berkeley International OfficeFall 2017 International Student Enrollment
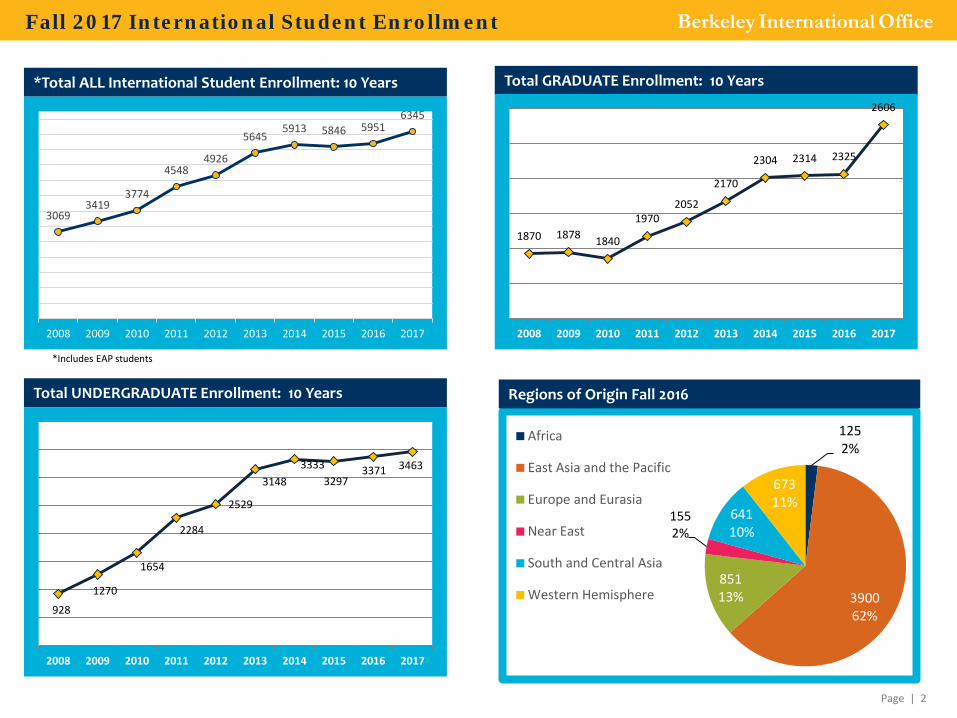
Freshman9%
Sophomore8%
Junior18%
Senior20%
Doctorate22%
Masters19%
UG Exchange
4%
Grad Exchange
0.16%
Educational Levels Educational Levels Comparison 2016 vs. 2017
530 495
1023
1323 1341
984
248
7
562510
11181273
1381
1225
266
10
Freshman Sophomore Junior Senior Doctorate Masters UG Exchange GradExchange
2016 2017
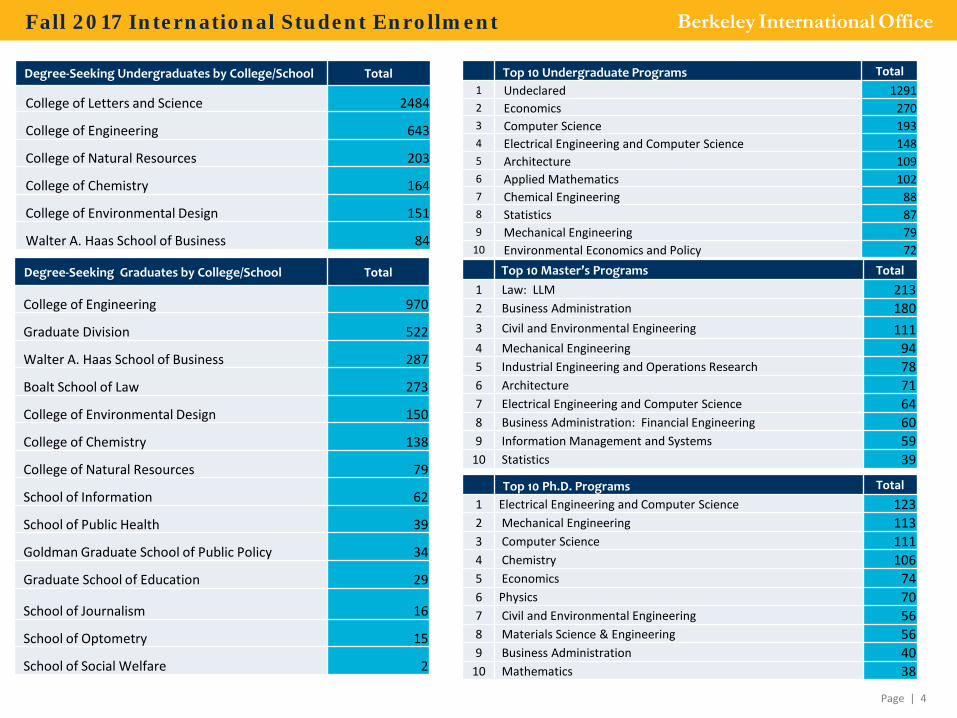
Degree-Seeking Graduates by College/School Total
College of Engineering 970
Graduate Division 522
Walter A. Haas School of Business 287
Boalt School of Law 273
College of Environmental Design 150
College of Chemistry 138
College of Natural Resources 79
School of Information 62
School of Public Health 39
Goldman Graduate School of Public Policy 34
Graduate School of Education 29
School of Journalism 16
School of Optometry 15
School of Social Welfare 2
Degree-Seeking Undergraduates by College/School Total
College of Letters and Science 2484
College of Engineering 643
College of Natural Resources 203
College of Chemistry 164
College of Environmental Design 151
Walter A. Haas School of Business 84
Page | 4
Berkeley International OfficeFall 2017 International Student Enrollment
Top 10 Undergraduate Programs Total1 Undeclared 12912 Economics 2703 Computer Science 1934 Electrical Engineering and Computer Science 1485 Architecture 1096 Applied Mathematics 1027 Chemical Engineering 888 Statistics 879 Mechanical Engineering 79
10 Environmental Economics and Policy 72Top 10 Master’s Programs Total
1 Law: LLM 2132 Business Administration 1803 Civil and Environmental Engineering 1114 Mechanical Engineering 945 Industrial Engineering and Operations Research 786 Architecture 717 Electrical Engineering and Computer Science 648 Business Administration: Financial Engineering 609 Information Management and Systems 59
10 Statistics 39
Top 10 Ph.D. Programs Total1 Electrical Engineering and Computer Science 1232 Mechanical Engineering 1133 Computer Science 1114 Chemistry 1065 Economics 746 Physics 707 Civil and Environmental Engineering 568 Materials Science & Engineering 569 Business Administration 40
10 Mathematics 38
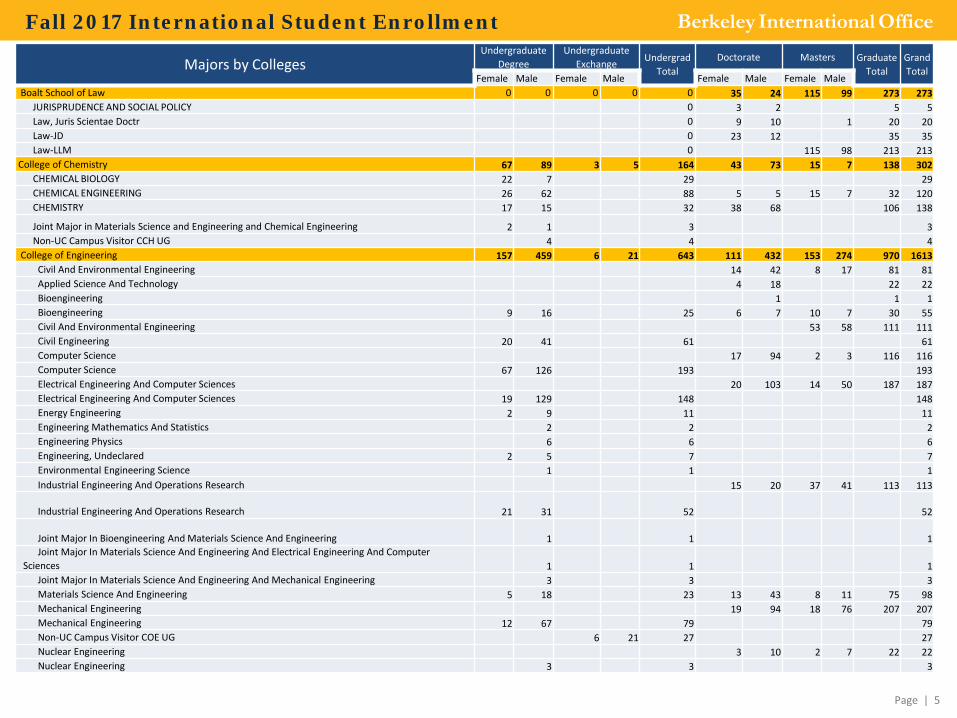
Enrollment by Major
Page | 5
Berkeley International OfficeFall 2017 International Student Enrollment
Majors by CollegesUndergraduate
DegreeUndergraduate
Exchange Undergrad Total
Doctorate Masters GraduateTotal
Grand Total
Female Male Female Male Female Male Female MaleBoalt School of Law 0 0 0 0 0 35 24 115 99 273 273
JURISPRUDENCE AND SOCIAL POLICY 0 3 2 5 5Law, Juris Scientae Doctr 0 9 10 1 20 20Law-JD 0 23 12 35 35Law-LLM 0 115 98 213 213
College of Chemistry 67 89 3 5 164 43 73 15 7 138 302CHEMICAL BIOLOGY 22 7 29 29CHEMICAL ENGINEERING 26 62 88 5 5 15 7 32 120CHEMISTRY 17 15 32 38 68 106 138
Joint Major in Materials Science and Engineering and Chemical Engineering 2 1 3 3Non-UC Campus Visitor CCH UG 4 4 4
College of Engineering 157 459 6 21 643 111 432 153 274 970 1613Civil And Environmental Engineering 14 42 8 17 81 81Applied Science And Technology 4 18 22 22Bioengineering 1 1 1Bioengineering 9 16 25 6 7 10 7 30 55Civil And Environmental Engineering 53 58 111 111Civil Engineering 20 41 61 61Computer Science 17 94 2 3 116 116Computer Science 67 126 193 193Electrical Engineering And Computer Sciences 20 103 14 50 187 187Electrical Engineering And Computer Sciences 19 129 148 148Energy Engineering 2 9 11 11Engineering Mathematics And Statistics 2 2 2Engineering Physics 6 6 6Engineering, Undeclared 2 5 7 7Environmental Engineering Science 1 1 1Industrial Engineering And Operations Research 15 20 37 41 113 113
Industrial Engineering And Operations Research 21 31 52 52
Joint Major In Bioengineering And Materials Science And Engineering 1 1 1Joint Major In Materials Science And Engineering And Electrical Engineering And Computer
Sciences 1 1 1Joint Major In Materials Science And Engineering And Mechanical Engineering 3 3 3Materials Science And Engineering 5 18 23 13 43 8 11 75 98Mechanical Engineering 19 94 18 76 207 207Mechanical Engineering 12 67 79 79Non-UC Campus Visitor COE UG 6 21 27 27Nuclear Engineering 3 10 2 7 22 22Nuclear Engineering 3 3 3
Page | 6
Berkeley International OfficeFall 2017 International Student Enrollment
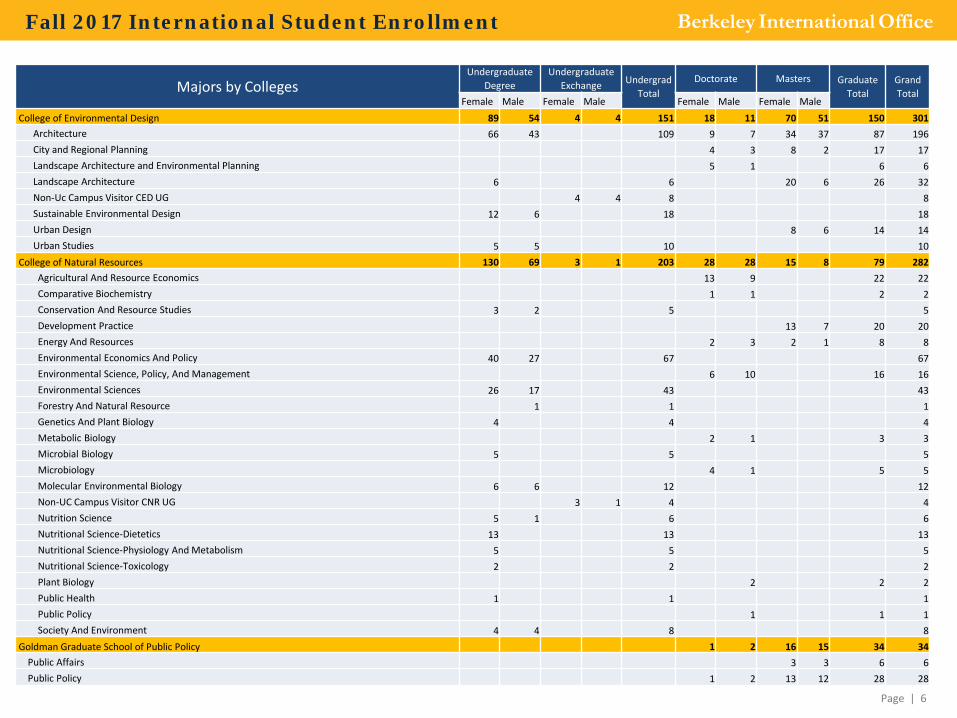
Majors by CollegesUndergraduate
DegreeUndergraduate
Exchange Undergrad Total
Doctorate Masters GraduateTotal
Grand Total
Female Male Female Male Female Male Female MaleCollege of Environmental Design 89 54 4 4 151 18 11 70 51 150 301
Architecture 66 43 109 9 7 34 37 87 196City and Regional Planning 4 3 8 2 17 17Landscape Architecture and Environmental Planning 5 1 6 6Landscape Architecture 6 6 20 6 26 32Non-Uc Campus Visitor CED UG 4 4 8 8Sustainable Environmental Design 12 6 18 18Urban Design 8 6 14 14Urban Studies 5 5 10 10
College of Natural Resources 130 69 3 1 203 28 28 15 8 79 282Agricultural And Resource Economics 13 9 22 22Comparative Biochemistry 1 1 2 2Conservation And Resource Studies 3 2 5 5Development Practice 13 7 20 20Energy And Resources 2 3 2 1 8 8Environmental Economics And Policy 40 27 67 67Environmental Science, Policy, And Management 6 10 16 16Environmental Sciences 26 17 43 43Forestry And Natural Resource 1 1 1Genetics And Plant Biology 4 4 4Metabolic Biology 2 1 3 3Microbial Biology 5 5 5Microbiology 4 1 5 5Molecular Environmental Biology 6 6 12 12Non-UC Campus Visitor CNR UG 3 1 4 4Nutrition Science 5 1 6 6Nutritional Science-Dietetics 13 13 13Nutritional Science-Physiology And Metabolism 5 5 5Nutritional Science-Toxicology 2 2 2Plant Biology 2 2 2Public Health 1 1 1Public Policy 1 1 1Society And Environment 4 4 8 8
Goldman Graduate School of Public Policy 1 2 16 15 34 34Public Affairs 3 3 6 6Public Policy 1 2 13 12 28 28
Page | 7
Berkeley International OfficeFall 2017 International Student Enrollment
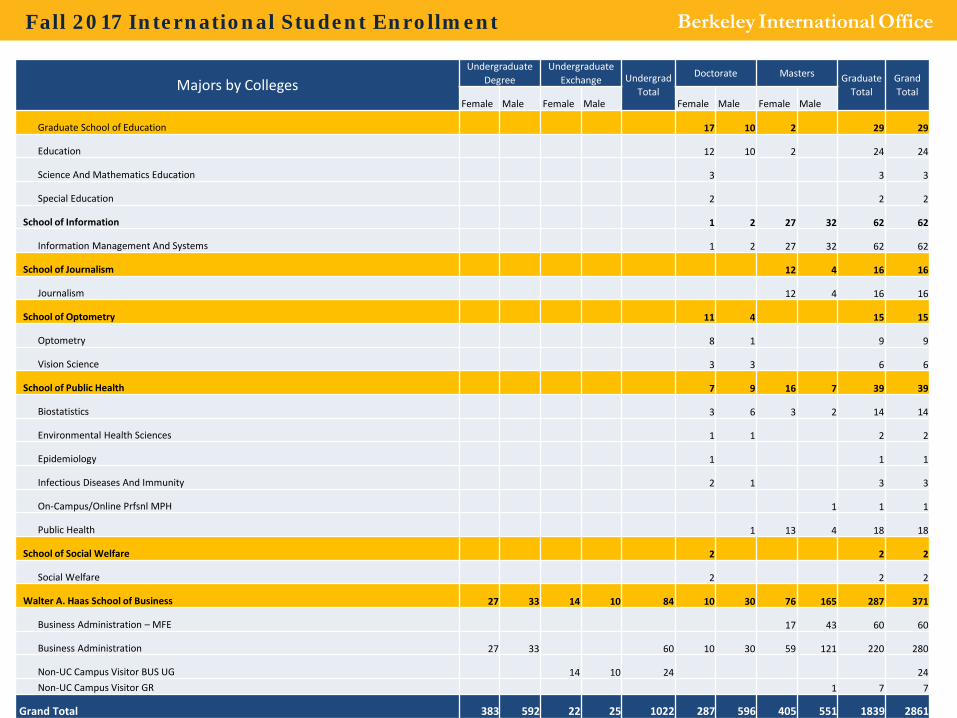
Majors by CollegesUndergraduate
DegreeUndergraduate
Exchange Undergrad Total
Doctorate Masters GraduateTotal
Grand Total
Female Male Female Male Female Male Female Male
Graduate School of Education 17 10 2 29 29
Education 12 10 2 24 24
Science And Mathematics Education 3 3 3
Special Education 2 2 2
School of Information 1 2 27 32 62 62
Information Management And Systems 1 2 27 32 62 62
School of Journalism 12 4 16 16
Journalism 12 4 16 16
School of Optometry 11 4 15 15
Optometry 8 1 9 9
Vision Science 3 3 6 6
School of Public Health 7 9 16 7 39 39
Biostatistics 3 6 3 2 14 14
Environmental Health Sciences 1 1 2 2
Epidemiology 1 1 1
Infectious Diseases And Immunity 2 1 3 3
On-Campus/Online Prfsnl MPH 1 1 1
Public Health 1 13 4 18 18
School of Social Welfare 2 2 2
Social Welfare 2 2 2
Walter A. Haas School of Business 27 33 14 10 84 10 30 76 165 287 371
Business Administration – MFE 17 43 60 60
Business Administration 27 33 60 10 30 59 121 220 280
Non-UC Campus Visitor BUS UG 14 10 24 24Non-UC Campus Visitor GR 1 7 7
Grand Total 383 592 22 25 1022 287 596 405 551 1839 2861
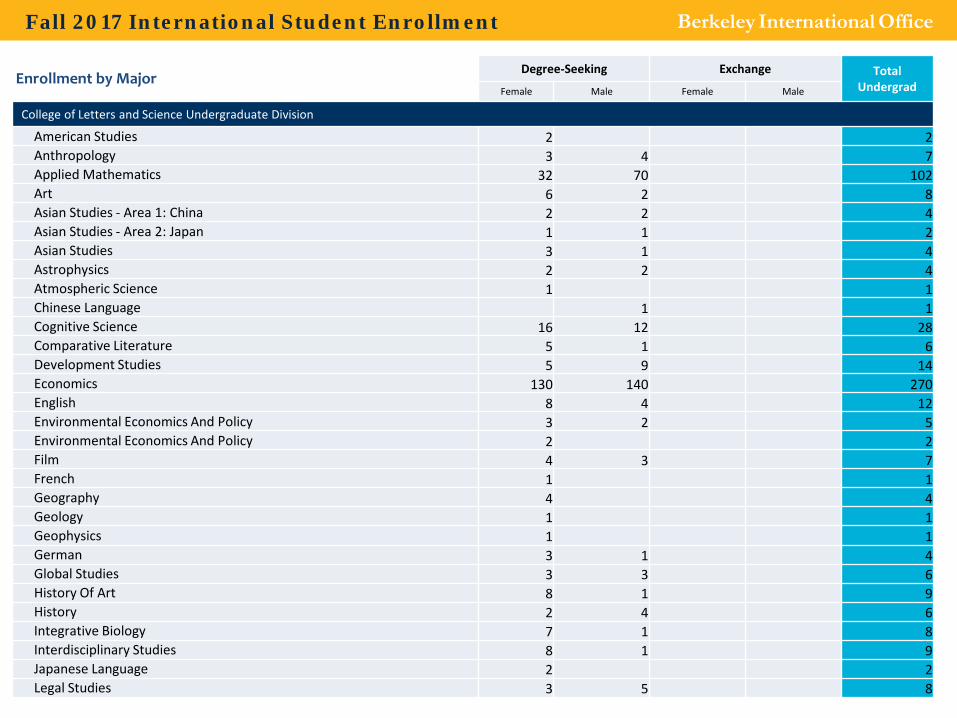
Degree-Seeking Exchange Total UndergradFemale Male Female Male
College of Letters and Science Undergraduate Division
American Studies 2 2Anthropology 3 4 7Applied Mathematics 32 70 102Art 6 2 8Asian Studies - Area 1: China 2 2 4Asian Studies - Area 2: Japan 1 1 2Asian Studies 3 1 4Astrophysics 2 2 4Atmospheric Science 1 1Chinese Language 1 1Cognitive Science 16 12 28Comparative Literature 5 1 6Development Studies 5 9 14Economics 130 140 270English 8 4 12Environmental Economics And Policy 3 2 5Environmental Economics And Policy 2 2Film 4 3 7French 1 1Geography 4 4Geology 1 1Geophysics 1 1German 3 1 4Global Studies 3 3 6History Of Art 8 1 9History 2 4 6Integrative Biology 7 1 8Interdisciplinary Studies 8 1 9Japanese Language 2 2Legal Studies 3 5 8
Enrollment by Major
Berkeley International OfficeFall 2017 International Student Enrollment
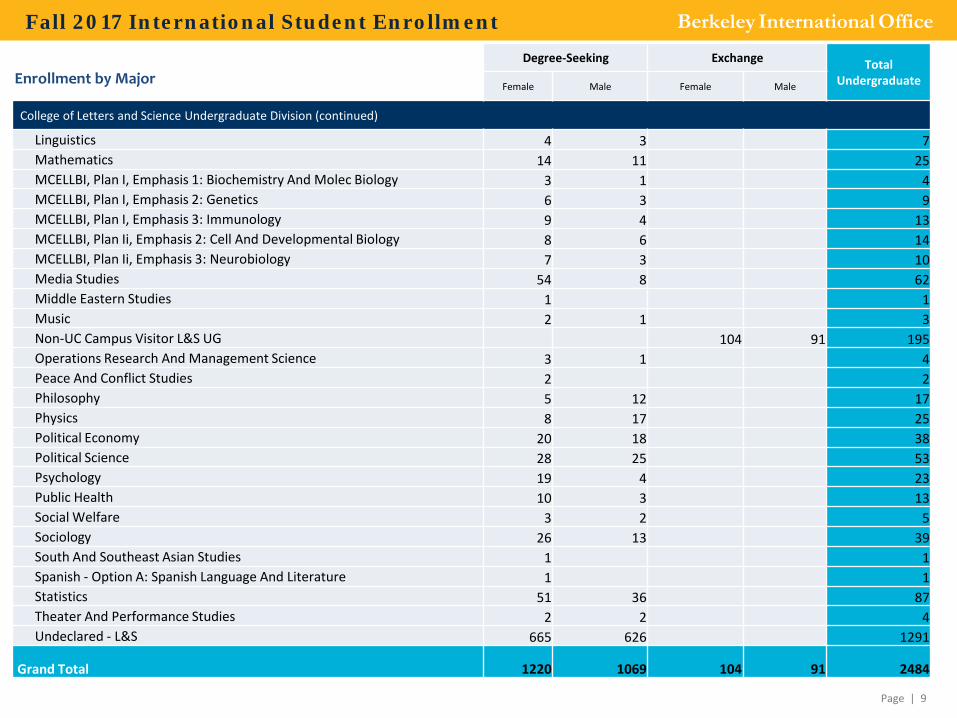
Degree-Seeking Exchange Total UndergraduateFemale Male Female Male
College of Letters and Science Undergraduate Division (continued)
Linguistics 4 3 7Mathematics 14 11 25MCELLBI, Plan I, Emphasis 1: Biochemistry And Molec Biology 3 1 4MCELLBI, Plan I, Emphasis 2: Genetics 6 3 9MCELLBI, Plan I, Emphasis 3: Immunology 9 4 13MCELLBI, Plan Ii, Emphasis 2: Cell And Developmental Biology 8 6 14MCELLBI, Plan Ii, Emphasis 3: Neurobiology 7 3 10Media Studies 54 8 62Middle Eastern Studies 1 1Music 2 1 3Non-UC Campus Visitor L&S UG 104 91 195Operations Research And Management Science 3 1 4Peace And Conflict Studies 2 2Philosophy 5 12 17Physics 8 17 25Political Economy 20 18 38Political Science 28 25 53Psychology 19 4 23Public Health 10 3 13Social Welfare 3 2 5Sociology 26 13 39South And Southeast Asian Studies 1 1Spanish - Option A: Spanish Language And Literature 1 1Statistics 51 36 87Theater And Performance Studies 2 2 4Undeclared - L&S 665 626 1291
Grand Total 1220 1069 104 91 2484
Enrollment by Major
Page | 9
Berkeley International OfficeFall 2017 International Student Enrollment
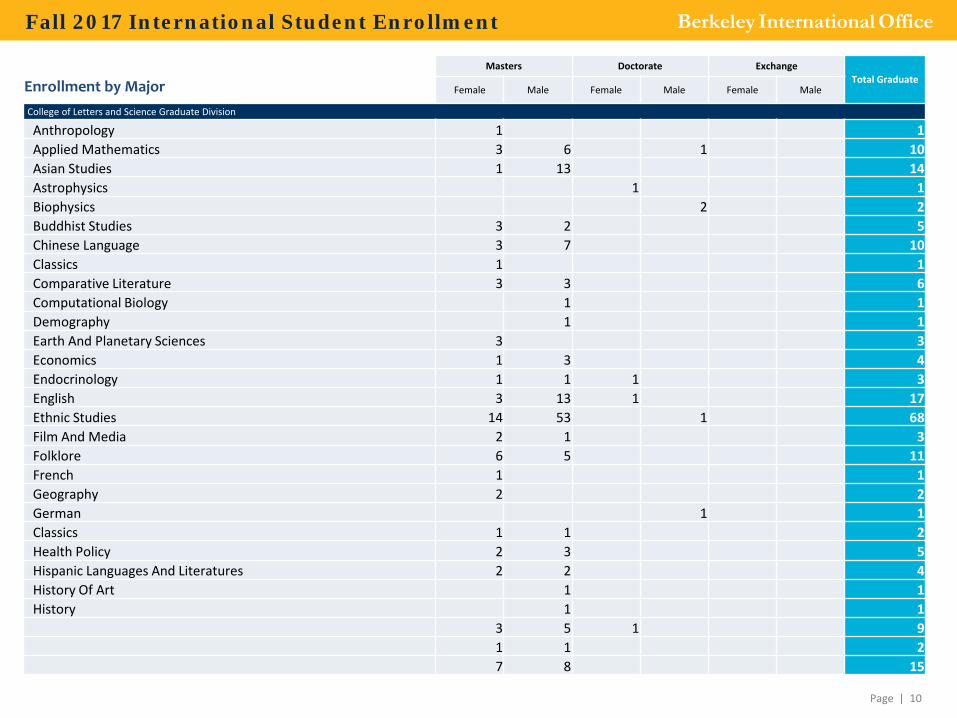
Masters Doctorate ExchangeTotal Graduate
Female Male Female Male Female Male
College of Letters and Science Graduate Division
Anthropology 1 1Applied Mathematics 3 6 1 10Asian Studies 1 13 14Astrophysics 1 1Biophysics 2 2Buddhist Studies 3 2 5Chinese Language 3 7 10Classics 1 1Comparative Literature 3 3 6Computational Biology 1 1Demography 1 1Earth And Planetary Sciences 3 3Economics 1 3 4Endocrinology 1 1 1 3English 3 13 1 17Ethnic Studies 14 53 1 68Film And Media 2 1 3Folklore 6 5 11French 1 1Geography 2 2German 1 1Classics 1 1 2Health Policy 2 3 5Hispanic Languages And Literatures 2 2 4History Of Art 1 1History 1 1
3 5 1 91 1 27 8 15
Enrollment by Major
Page | 10
Berkeley International OfficeFall 2017 International Student Enrollment
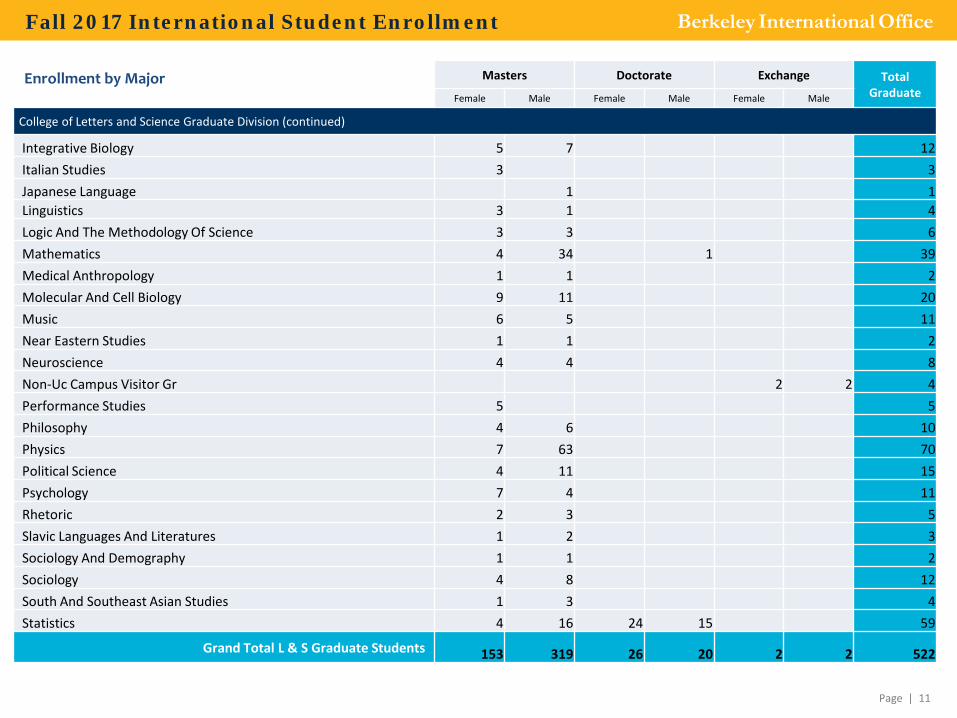
Masters Doctorate Exchange Total GraduateFemale Male Female Male Female Male
College of Letters and Science Graduate Division (continued)
Integrative Biology 5 7 12Italian Studies 3 3Japanese Language 1 1Linguistics 3 1 4Logic And The Methodology Of Science 3 3 6Mathematics 4 34 1 39Medical Anthropology 1 1 2Molecular And Cell Biology 9 11 20Music 6 5 11Near Eastern Studies 1 1 2Neuroscience 4 4 8Non-Uc Campus Visitor Gr 2 2 4Performance Studies 5 5Philosophy 4 6 10Physics 7 63 70Political Science 4 11 15Psychology 7 4 11Rhetoric 2 3 5Slavic Languages And Literatures 1 2 3Sociology And Demography 1 1 2Sociology 4 8 12South And Southeast Asian Studies 1 3 4Statistics 4 16 24 15 59
Grand Total L & S Graduate Students 153 319 26 20 2 2 522
Enrollment by Major
Page | 11
Berkeley International OfficeFall 2017 International Student Enrollment
Page | 12
Berkeley International OfficeFall 2017 International Student Enrollment
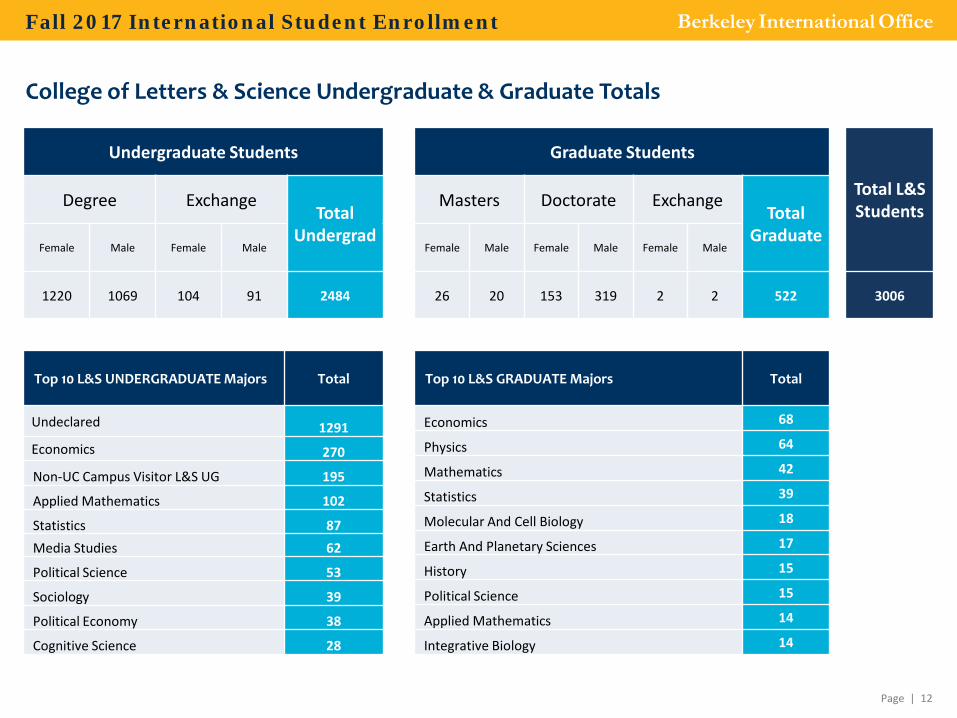
Undergraduate Students Graduate Students
Total L&S StudentsDegree Exchange
Total Undergrad
Masters Doctorate ExchangeTotal
GraduateFemale Male Female Male Female Male Female Male Female Male
1220 1069 104 91 2484 26 20 153 319 2 2 522 3006
College of Letters & Science Undergraduate & Graduate Totals
Top 10 L&S UNDERGRADUATE Majors Total
Undeclared 1291Economics 270
Non-UC Campus Visitor L&S UG 195
Applied Mathematics 102
Statistics 87Media Studies 62
Political Science 53
Sociology 39
Political Economy 38
Cognitive Science 28
Top 10 L&S GRADUATE Majors Total
Economics 68
Physics 64
Mathematics 42
Statistics 39
Molecular And Cell Biology 18
Earth And Planetary Sciences 17
History 15
Political Science 15
Applied Mathematics 14
Integrative Biology 14
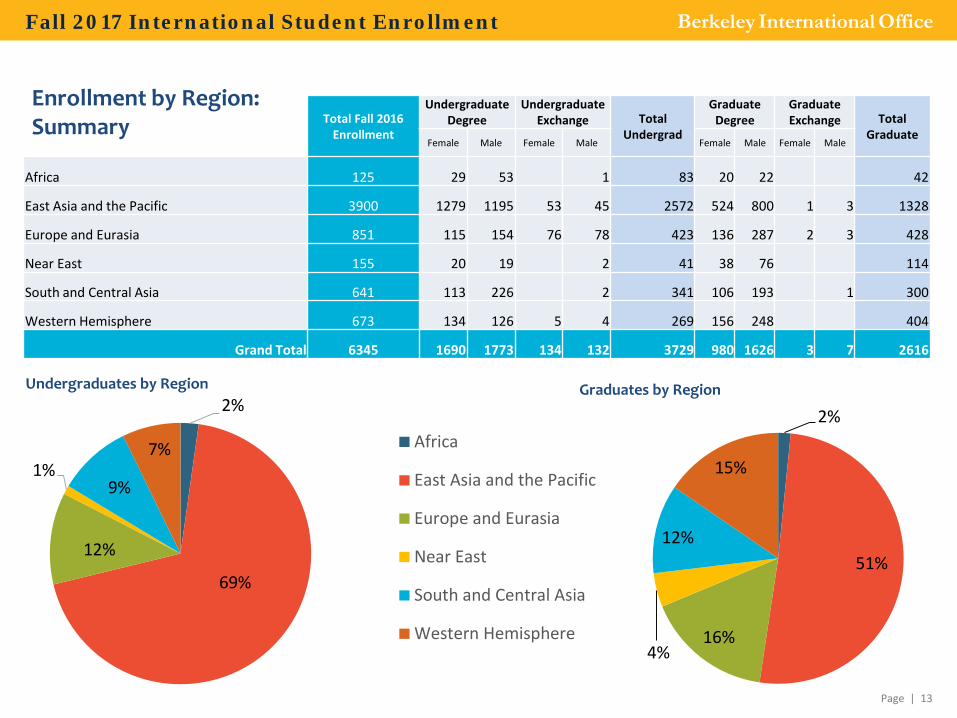
Total Fall 2016 Enrollment
Undergraduate Degree
Undergraduate Exchange Total
Undergrad
Graduate Degree
Graduate Exchange Total
GraduateFemale Male Female Male Female Male Female Male
Africa 125 29 53 1 83 20 22 42
East Asia and the Pacific 3900 1279 1195 53 45 2572 524 800 1 3 1328
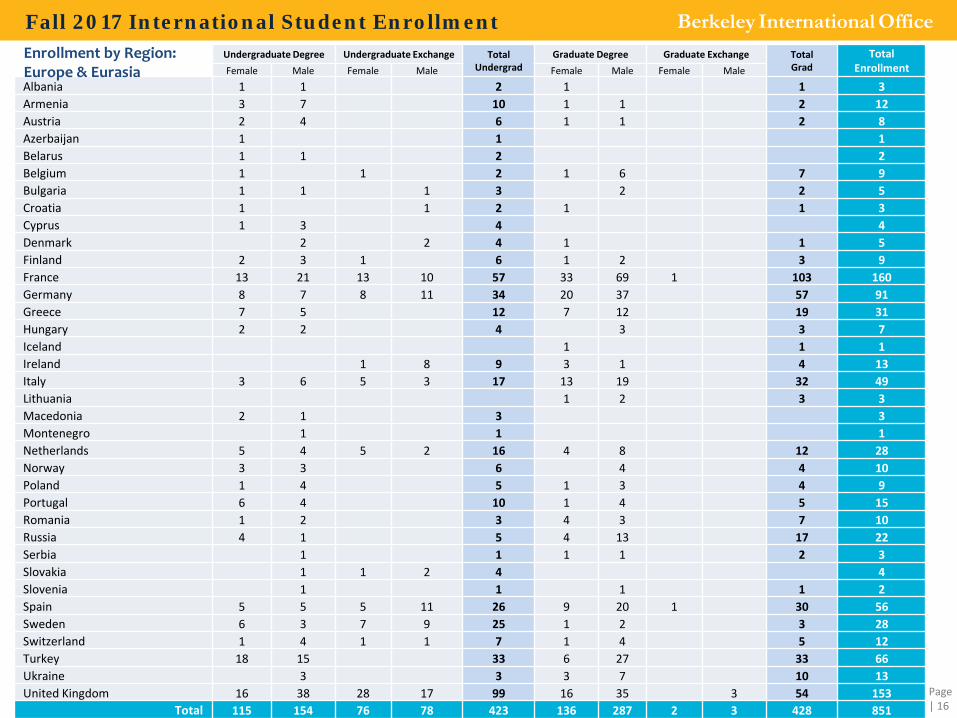
Europe and Eurasia 851 115 154 76 78 423 136 287 2 3 428
Near East 155 20 19 2 41 38 76 114
South and Central Asia 641 113 226 2 341 106 193 1 300
Western Hemisphere 673 134 126 5 4 269 156 248 404
Grand Total 6345 1690 1773 134 132 3729 980 1626 3 7 2616
Enrollment by Region:Summary
Undergraduates by Region Graduates by Region
Page | 13
Berkeley International OfficeFall 2017 International Student Enrollment
2%
69%
12%
1%9%
7% Africa
East Asia and the Pacific
Europe and Eurasia
Near East
South and Central Asia
Western Hemisphere
2%
51%
16%4%
12%
15%
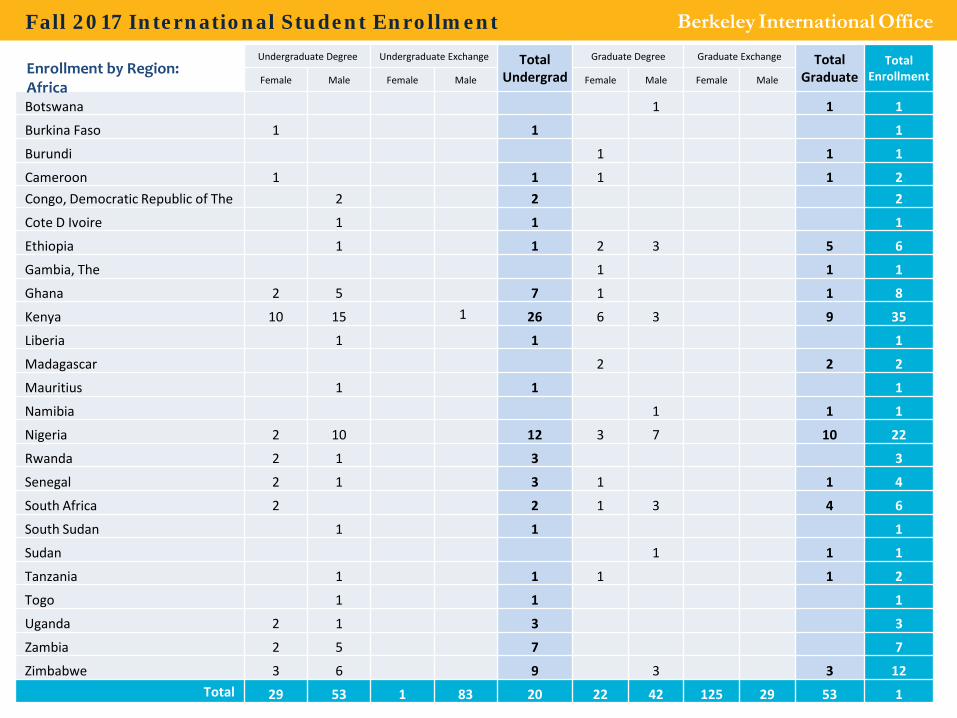
Undergraduate Degree Undergraduate Exchange Total Undergrad
Graduate Degree Graduate Exchange Total Graduate
Total EnrollmentFemale Male Female Male Female Male Female Male
Botswana 1 1 1
Burkina Faso 1 1 1
Burundi 1 1 1
Cameroon 1 1 1 1 2Congo, Democratic Republic of The 2 2 2
Cote D Ivoire 1 1 1
Ethiopia 1 1 2 3 5 6
Gambia, The 1 1 1
Ghana 2 5 7 1 1 8
Kenya 10 15 1 26 6 3 9 35
Liberia 1 1 1
Madagascar 2 2 2
Mauritius 1 1 1
Namibia 1 1 1
Nigeria 2 10 12 3 7 10 22
Rwanda 2 1 3 3
Senegal 2 1 3 1 1 4
South Africa 2 2 1 3 4 6
South Sudan 1 1 1
Sudan 1 1 1
Tanzania 1 1 1 1 2
Togo 1 1 1
Uganda 2 1 3 3
Zambia 2 5 7 7
Zimbabwe 3 6 9 3 3 12Total 29 53 1 83 20 22 42 125 29 53 1
Enrollment by Region:Africa
Berkeley International OfficeFall 2017 International Student Enrollment
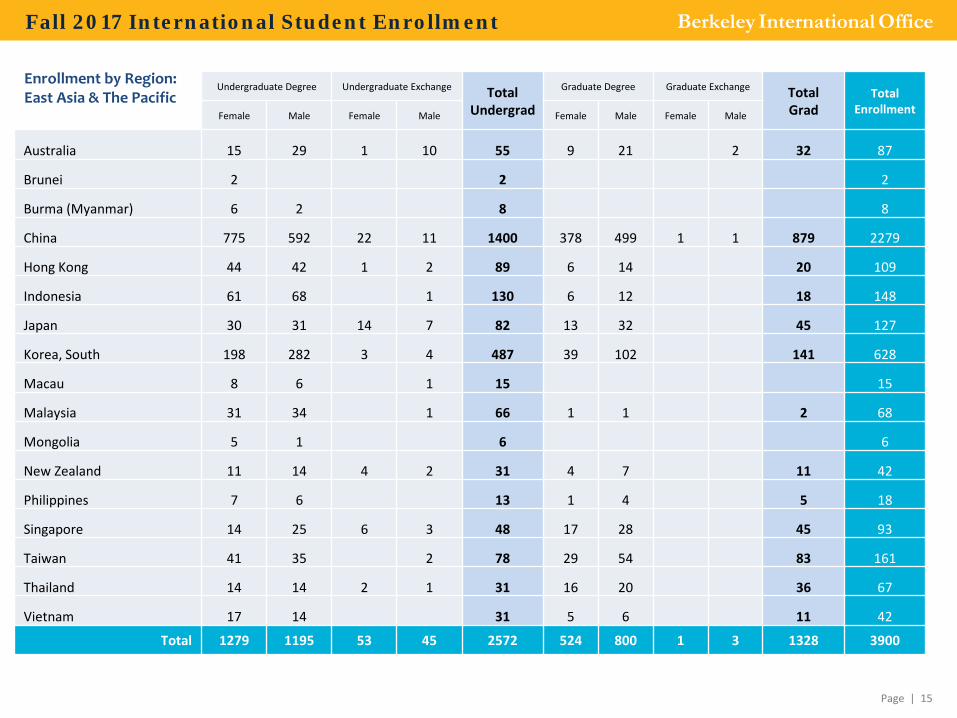
Undergraduate Degree Undergraduate Exchange Total Undergrad
Graduate Degree Graduate Exchange Total Grad
Total EnrollmentFemale Male Female Male Female Male Female Male
Australia 15 29 1 10 55 9 21 2 32 87
Brunei 2 2 2
Burma (Myanmar) 6 2 8 8
China 775 592 22 11 1400 378 499 1 1 879 2279
Hong Kong 44 42 1 2 89 6 14 20 109
Indonesia 61 68 1 130 6 12 18 148
Japan 30 31 14 7 82 13 32 45 127
Korea, South 198 282 3 4 487 39 102 141 628
Macau 8 6 1 15 15
Malaysia 31 34 1 66 1 1 2 68
Mongolia 5 1 6 6
New Zealand 11 14 4 2 31 4 7 11 42
Philippines 7 6 13 1 4 5 18
Singapore 14 25 6 3 48 17 28 45 93
Taiwan 41 35 2 78 29 54 83 161
Thailand 14 14 2 1 31 16 20 36 67
Vietnam 17 14 31 5 6 11 42
Total 1279 1195 53 45 2572 524 800 1 3 1328 3900
Enrollment by Region:East Asia & The Pacific
Page | 15
Berkeley International OfficeFall 2017 International Student Enrollment
Undergraduate Degree Undergraduate Exchange Total Undergrad
Graduate Degree Graduate Exchange Total Grad
Total EnrollmentFemale Male Female Male Female Male Female Male
Albania 1 1 2 1 1 3Armenia 3 7 10 1 1 2 12Austria 2 4 6 1 1 2 8Azerbaijan 1 1 1Belarus 1 1 2 2Belgium 1 1 2 1 6 7 9Bulgaria 1 1 1 3 2 2 5Croatia 1 1 2 1 1 3Cyprus 1 3 4 4Denmark 2 2 4 1 1 5Finland 2 3 1 6 1 2 3 9France 13 21 13 10 57 33 69 1 103 160Germany 8 7 8 11 34 20 37 57 91Greece 7 5 12 7 12 19 31Hungary 2 2 4 3 3 7Iceland 1 1 1Ireland 1 8 9 3 1 4 13Italy 3 6 5 3 17 13 19 32 49Lithuania 1 2 3 3Macedonia 2 1 3 3Montenegro 1 1 1Netherlands 5 4 5 2 16 4 8 12 28Norway 3 3 6 4 4 10Poland 1 4 5 1 3 4 9Portugal 6 4 10 1 4 5 15Romania 1 2 3 4 3 7 10Russia 4 1 5 4 13 17 22Serbia 1 1 1 1 2 3Slovakia 1 1 2 4 4Slovenia 1 1 1 1 2Spain 5 5 5 11 26 9 20 1 30 56Sweden 6 3 7 9 25 1 2 3 28Switzerland 1 4 1 1 7 1 4 5 12Turkey 18 15 33 6 27 33 66Ukraine 3 3 3 7 10 13United Kingdom 16 38 28 17 99 16 35 3 54 153
Total 115 154 76 78 423 136 287 2 3 428 851
Enrollment by Region:Europe & Eurasia
Page | 16
Berkeley International OfficeFall 2017 International Student Enrollment
Undergraduate Degree Undergraduate ExchangeTotal
Undergrad
Graduate Degree Graduate ExchangeTotal Grad
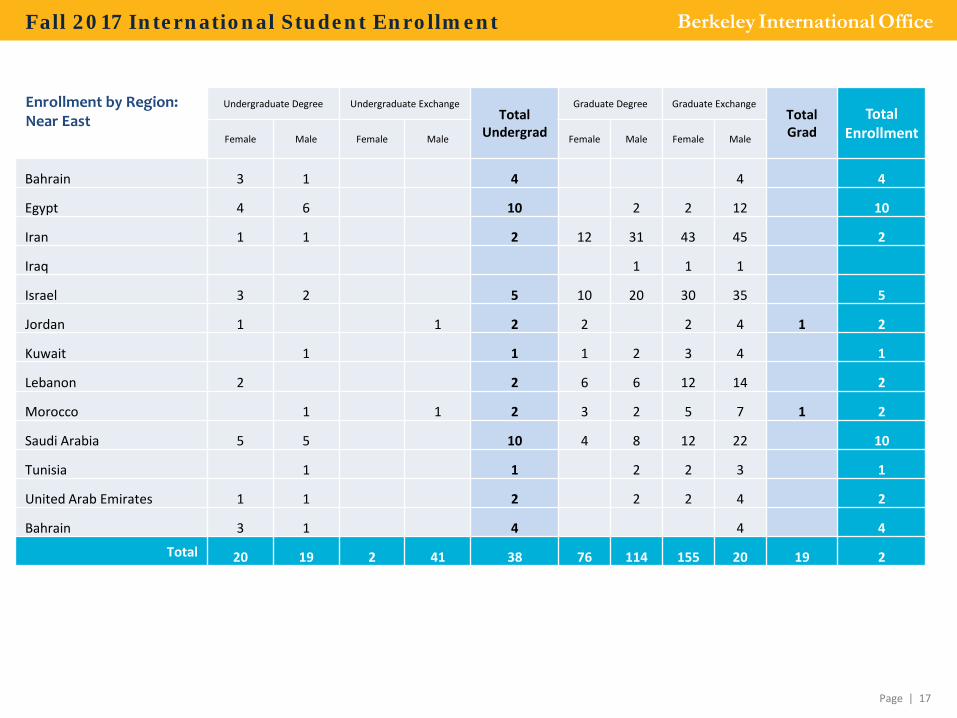
Total EnrollmentFemale Male Female Male Female Male Female Male
Bahrain 3 1 4 4 4
Egypt 4 6 10 2 2 12 10
Iran 1 1 2 12 31 43 45 2
Iraq 1 1 1
Israel 3 2 5 10 20 30 35 5
Jordan 1 1 2 2 2 4 1 2
Kuwait 1 1 1 2 3 4 1
Lebanon 2 2 6 6 12 14 2
Morocco 1 1 2 3 2 5 7 1 2
Saudi Arabia 5 5 10 4 8 12 22 10
Tunisia 1 1 2 2 3 1
United Arab Emirates 1 1 2 2 2 4 2
Bahrain 3 1 4 4 4
Total 20 19 2 41 38 76 114 155 20 19 2
Enrollment by Region:Near East
Page | 17
Berkeley International OfficeFall 2017 International Student Enrollment
Undergraduate Degree Undergraduate ExchangeTotal
Undergrad
Graduate Degree Graduate ExchangeTotal Grad
Total Enrollment
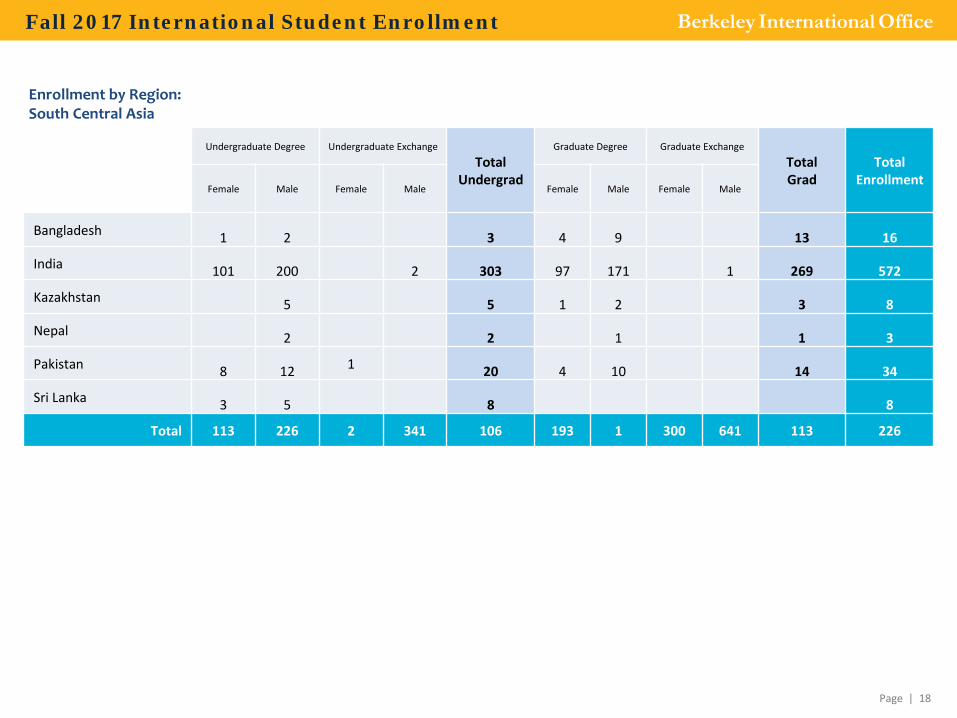
Female Male Female Male Female Male Female Male
Bangladesh 1 2 3 4 9 13 16
India 101 200 2 303 97 171 1 269 572
Kazakhstan 5 5 1 2 3 8
Nepal 2 2 1 1 3
Pakistan 8 12 1 20 4 10 14 34
Sri Lanka 3 5 8 8
Total 113 226 2 341 106 193 1 300 641 113 226
Enrollment by Region:South Central Asia
Page | 18
Berkeley International OfficeFall 2017 International Student Enrollment
Undergraduate Degree Undergraduate Exchange Total Undergrad
Graduate Degree Graduate Exchange Total Grad
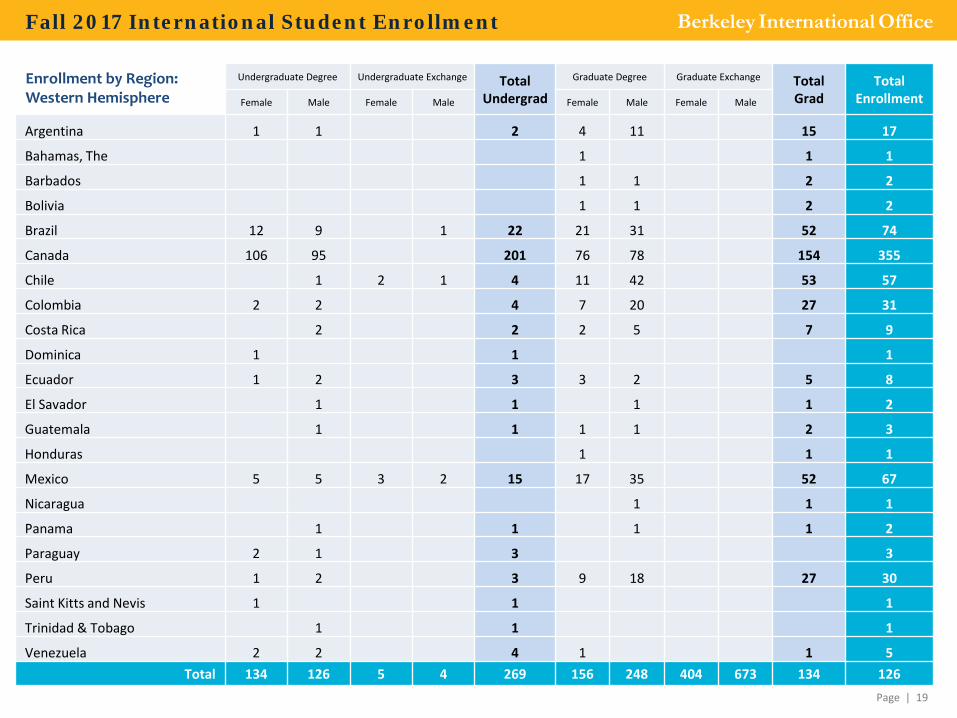
Total EnrollmentFemale Male Female Male Female Male Female Male
Argentina 1 1 2 4 11 15 17
Bahamas, The 1 1 1
Barbados 1 1 2 2
Bolivia 1 1 2 2
Brazil 12 9 1 22 21 31 52 74
Canada 106 95 201 76 78 154 355
Chile 1 2 1 4 11 42 53 57
Colombia 2 2 4 7 20 27 31
Costa Rica 2 2 2 5 7 9
Dominica 1 1 1
Ecuador 1 2 3 3 2 5 8
El Savador 1 1 1 1 2
Guatemala 1 1 1 1 2 3
Honduras 1 1 1
Mexico 5 5 3 2 15 17 35 52 67
Nicaragua 1 1 1
Panama 1 1 1 1 2
Paraguay 2 1 3 3
Peru 1 2 3 9 18 27 30
Saint Kitts and Nevis 1 1 1
Trinidad & Tobago 1 1 1
Venezuela 2 2 4 1 1 5Total 134 126 5 4 269 156 248 404 673 134 126
Enrollment by Region:Western Hemisphere
Page | 19
Berkeley International OfficeFall 2017 International Student Enrollment
![Computer Science and Engineering Department · Computer Science and Engineering Department [ CSE LINKS | UNIVERSITY AT BUFFALO COMPUTER SCIENCE AND ENGINEERING | CSE.BUFFALO.EDU ]](https://img.pdfslide.net/doc/110x75/5e7dff6fc6634778841fc1dc/computer-science-and-engineering-computer-science-and-engineering-department-cse.jpg)