Embed Size (px)
Citation preview


Which Students are in Need of Interventions?

Section 1
CREATING STUDENT GROUPS
Early Identification of Proficient and At-risk Students

Parameters (cut scores) for I/E Blocks • Cut scores helps us to identify student groups for
intervention, enhancement and enrichment.
76-99 31-75 1-30 FAIR-FS and SAT 10 Percentiles
Intervene Enhance
Enrich

What do these cut scores look like based on normative classifications?
FAIR-FS and SAT 10 Percentiles: 76-99 (Enrichment) 31-75 (Enhance) 1-30 (Intervene)
Tier 1 Enrichment
Tier Enhancement
Tier 2 Interventions
Tier 3 Interventions
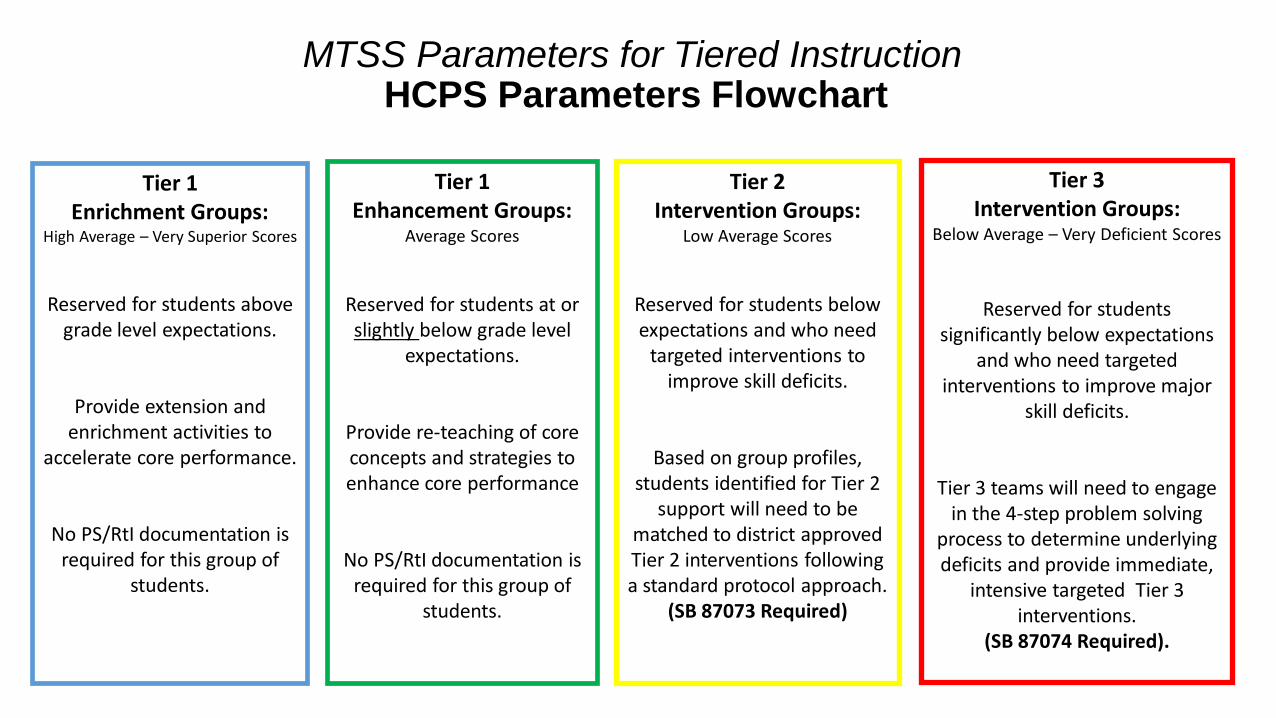
MTSS Parameters for Tiered Instruction HCPS Parameters Flowchart
Tier 1 Enrichment Groups:
High Average – Very Superior Scores
Reserved for students above
grade level expectations.
Provide extension and enrichment activities to
accelerate core performance.
No PS/RtI documentation is required for this group of
students.
Tier 1 Enhancement Groups:
Average Scores
Reserved for students at or slightly below grade level
expectations.
Provide re-teaching of core concepts and strategies to enhance core performance
No PS/RtI documentation is required for this group of
students.
Tier 2 Intervention Groups:
Low Average Scores
Reserved for students below expectations and who need
targeted interventions to improve skill deficits.
Based on group profiles, students identified for Tier 2
support will need to be matched to district approved Tier 2 interventions following a standard protocol approach.
(SB 87073 Required)
Tier 3 Intervention Groups:
Below Average – Very Deficient Scores
Reserved for students significantly below expectations
and who need targeted interventions to improve major
skill deficits.
Tier 3 teams will need to engage in the 4-step problem solving
process to determine underlying deficits and provide immediate,
intensive targeted Tier 3 interventions.
(SB 87074 Required).

Intervention Flowcharts for Data Sorting in Elementary Schools.
Reading: K, 1, 2, 3, 3-5
Math: K-1, 1-2, 3-5
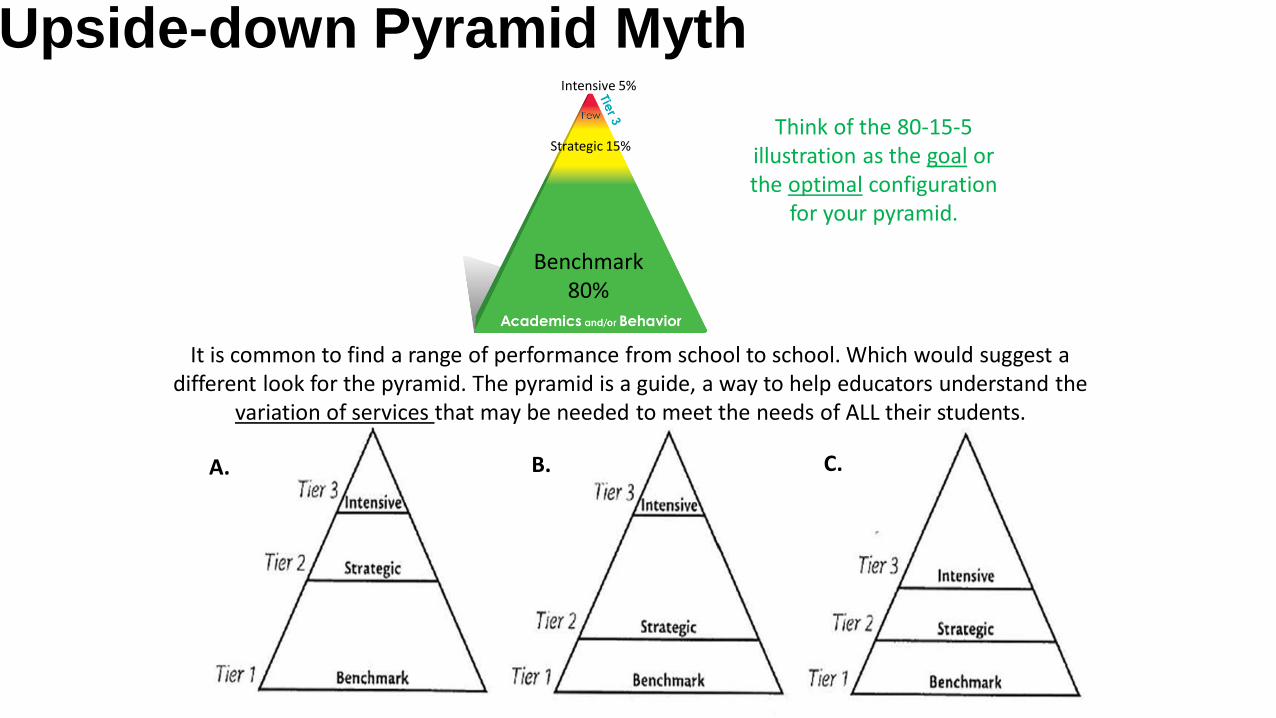
Upside-down Pyramid Myth
It is common to find a range of performance from school to school. Which would suggest a different look for the pyramid. The pyramid is a guide, a way to help educators understand the
variation of services that may be needed to meet the needs of ALL their students.
Think of the 80-15-5 illustration as the goal or the optimal configuration
for your pyramid.
A. B. C.
Benchmark 80%
Strategic 15%
Intensive 5%

What about ESE and ELL Students?

True and False Positives and
Negatives
Data Triangulation
Considering True and False Positive/ Negative Indicators

Considering True and False Positives and Negatives when Sorting Student Data

Below Expectation
Below Expectation
Below Expectation
Data Triangulation for Validation Considering True and False Positives/Negatives
Intervention Needed
?
Data Source
1 (FCAT)
Data Source
2 FAIR AP3
Data Source
3 FAIR-FS
Three valid and reliable data sources fell in the “at-risk” range, indicating a true need for intervention supports.
True Positive: All data sources indicate student is at risk for failure and in reality does need intervention support
Intervention: Yes No
Yes

Below Expectation
At or Above Expectation
Below Expectation
Intervention Needed
?
Data Source
1 (FCAT)
Data Source
2 FAIR AP3
Data Source
3 FAIR-FS
Two out of the three valid and reliable data sources fell in the “at-risk” range, indicating a true need for intervention supports.
False Negative: Data source indicates student is not at risk for failure, but in reality is in need of support.
Intervention: Yes No
Data Triangulation with FAIR-FS Considering True and False Positives and Negatives
Yes

At or Above Expectation
At or Above Expectation
Below Expectation
Intervention Needed
?
Data Source
1 (FCAT)
Data Source
2 FAIR AP3
Data Source
3 FAIR-FS
Two out of the three valid and reliable data sources did not indicate risk.
False Positive: Data source indicates student is at risk for failure, but in reality does not need of support.
Intervention: Yes No
NO
Data Triangulation for Validation Considering True and False Positives/Negatives

At or Above Expectation
At or Above Expectation
At or Above Expectation
Intervention Needed
?
Data Source
1 (FCAT)
Data Source
2 FAIR AP3
Data Source
3 FAIR-FS
Three valid and reliable data sources indicated student is not in need for intervention supports.
True Negative: All data sources indicate student is not at risk for failure and in reality does not need intervention support
Intervention: Yes No
No
Data Triangulation for Validation Considering True and False Positives/Negatives

________
Data Triangulation with Grades 3-5 Guiding Questions:
Intervention Needed
? Yes or No
Data Source
1
Data Source
2
Data Source
3
________
Using additional data to validate continued need for Intervention: (FAIR FS
Example)
1. Did the student receive a level 1 or 2 on FCAT during the previous school year?
• If “yes”, this is a student who requires intervention support per Florida State Rule 6A-6.054.
• If “no”, consider data from FAIR AP3 and FAIR-FS (when available) to determine the need for tiered supports for skill enhancement or enrichment.
1. Are at least two out of the three data sources within the “intervention”
range (FCAT/SAT-10, FAIR AP3, FAIR-FS AP1) ? • If “yes”, this is a student who continues to display a need for intervention. • If “no”, review HCPS intervention parameters to determine the need for
enhancement or enrichment supports. • If only one out of three data sources fell within the “intervention”
range, consider the possibility that the below expectation score may be a false positive indicator.

Keeping Parents Informed
• Overview of MTSS-RtI parent letter and/or brochure • MTSS-RtI parent information letter or brochure provides an overview of MTSS-RtI in HCPS and at
your school.
• Can be mailed to parents along with all other school documents at the beginning of the school year.
• Can be distributed during parent conference night and other large parent meetings.
• Tiered Notification Letters • Letters for Enrichment, Enhancement and Intervention describes the support that
students will receive at each tier during the 30 minute Intervention/Enrichment blocks • Can be sent after initial data sorts when student groups have been established.
• Can also be provided to parents during a parent conferences.

Section 2
INTERVENTION DELIVERY
Visual Overview of MTSS Intervention Delivery Protocols
Standard Protocol and Problem Solving Protocol

MTSS Process for Intervention Delivery
Addl. Diagnostic Assessment
Instruction
Individual Diagnostic
Problem Solve for Individualized
Intensive Interventions
Universal Screening with ALL Students
Fall None Enhancement and
Enrichment Groups
Match to Standard Protocol
Intervention
Small Groups Differentiated/Adapt
ed to Skill Deficit
1-10 students per group
Winter Spring
Include Summative Data FCAT 2.0/SAT-10
Tier 3: <15th %ile on FAIR RC, FCAT level 1 and/or a retention
Tier 2: 16th - 30th %ile on FAIR RC and at Level 2 on FCAT
Between the 31st %ile and 75th%ile on FAIR RC and/or
low level 3 on FCAT Enhancement
At or above 76th%ile on FAIR RC and/or Level 4/5 on
FCAT Enrichment
Journeys Strategic Intervention
Leveled Literacy
Intervention
Istation
iReady
1-4 students per group
Data Sort for Student Groups
Grade-level, classroom, or small groups
FAIR-FS
Sort data to determine appropriate intervention groups
E X A M P L E S
Diagnostic assessments are used to aid educators in understanding the underlying causes for student
performance/concerns:

Intervention Duration, Frequency and Monitoring
Progress Monitoring
Every 6 weeks to review intervention fidelity and
small group data
Response to Intervention Check Points
Every 6 weeks to review intervention fidelity and individual student data
Per easyCBM Requirements
Per easyCBM Requirements
Formative &
Summative Assessments
3 times a year with universal screener and/or other Tier 1 assessments.
Team Decision Making
Determine Good, Poor or Questionable Response.
continue Tier 2 interventions, refer for Tier 3 or Tier 1 instruction.
Determine Good, Poor or Questionable response.
Refer for Tier 2 interventions or continue Tier 1 instruction.
Determine Good, Poor or Questionable response.
Refer for CST, move to Tier 1 or Tier 2 instruction, or continue
Tier 3 interventions.
Frequency Duration
Immediately Matched to Tier 3 Intervention:
150 minutes per week (e.g., 30 minutes, 5 times per week)
Minimum of 12-18 weeks of intensive, individualized intervention
required.
Immediately matched to Tier 2 Intervention:
90 minutes per week (e.g., 30 minutes, 3 times per week)
Minimum 18 weeks of targeted intervention required.
As outlined in the intervention, and enrichment block schedule Tier 1
Tier 2
Tier 3
i.e., 90 minutes a week of istation computer assisted learning (Tier 2)+ 60 minutes of teacher led instruction with istation lessons (Tier 3) = 150 minutes s per week.

SECTION 3
PLANNING YOUR YEAR FOR MTSS-RTI
Scheduling opportunities for intervention delivery, fidelity walk-throughs and team meetings

MTSS- RtI Calendar of Events for Intervention Planning and Delivery
Published by MTSS-RtI Services
2014-2015

Response
Checkpoint #1
May Apr Mar Feb Jan Dec Oct Sep Aug Nov
Sep 3 - Oct 16 6-week
Intervention Period
Nov 3 – Dec 19 6-week
Intervention Period
Jan 12 – Feb 27 6-week
Intervention Period
Mar 16 – Apr 29 6-week
Intervention Period
May 1-May 29 6-week
Intervention Period
Full year of Core
Instruction and
Intervention Delivery
Response
Checkpoint #2
Response
Checkpoint #3
Adjusted
Grouping Initial Data Sort
What:
Identify I/E need and form
groups
Who:
RLT/PSLT organizes grade
level data sources to be
further sorted at the
intervention planning PLC
for I/E grouping
Data Sources:
FCAT/SAT-10
FAIR Classic (AP3)
What:
Refine and adjust groups
through data triangulation
Who:
RLT/PSLT organizes grade
level data sources to be
further sorted for adjusted I/E
grouping
at PLC
Data Sources:
Grouping Data- FAIR-FS AP1
Response Data- easyCBM
What:
Evaluate response to
intervention, adjust groups,
and/or modify interventions;
assign any newly enrolled
students to an I/E group
Who:
RLT/PSLT organizes grade
level data sources to be
further sorted for adjusted I/E
grouping at PLC
Data Sources:
Grouping Data- FAIR-FS AP2
Response Data- easyCBM
RtI PLC wks 1-2
RtI PLC 6 wks
What:
Evaluate response to
intervention, adjust groups,
and/or modify interventions;
assign any newly enrolled
students to an I/E group
Who:
PLC interventionists with
support from PSLT
Liaison/RLT will analyze
graphed data from
intervention groups
Data Sources:
Response Data- easyCBM
What:
Evaluate response to
intervention, adjust groups,
and/or modify interventions;
assign any newly enrolled
students to an I/E group
Who:
PLC interventionists with
support from PSLT
Liaison/RLT will analyze
graphed data from
intervention groups
Data Sources:
Response Data- easyCBM
Continuous Core Assessments and Instructional Planning
Core PLCs Core PLCs Core PLCs RtI PLC 12 wks
Core PLCs RtI PLC 18 wks
RtI PLC 24-30 wks
Create I/E Groups.
Are students grouped
appropriately?
How are students
responding?
How are students
responding?
How are students
responding?
Core PLCs review core assessment data to determine students response to core
instruction and implement core instructional strategies.

Guiding Principles for RtI PLC Meetings
Please use the upcoming color coded documents at the
listed color coded meetings:
Initial Data Sort
Adjusted Grouping
Response to Intervention Checkpoint
1
Response to Intervention Checkpoint
2
Response to Intervention Checkpoint
3

Guiding Principles
RtI PLC: Initial Data Sort
Timeline: Beginning of the Year/Weeks 1-2
Data Sorting
Validation
I/E Skill
Grouping
Intervention
Selection
Progress
Monitoring
Intervention: LAFS Foundational Skills (PA, P, F)
Enhancement: LAFS Foundational skills and/or Core Standards
Enrichment: Core or Advanced Standards (LAFS and/or MAFS)
I/E Block Instructional Activities
Meets Tier 2 intervention criteria: Meets Tier 3 intervention criteria:
Match group to appropriate HCPS standard intervention protocol Place in I/E skill group and provide additional individualized, intensive supports as determined by the Tier 3 Team.
Intervention Groups: Required: YES Tool: easyCBM (biweekly)
Enhancement/Enrichment: Required: NO Tool: Core Assessments/FAIR, Formative, Performance Tasks
Review: Review grade level data broadly sorted by PSLT/RLT with HCPS parameters for intervention, enrichment, and enhancement
Sort: For students in need of intervention, PLC will use the FAIR Decision Tree to create targeted skill groups (FAIR AP3 only)
Consider false positive and false negative indicators when determining the need for intervention. Use the “True and False positive and negatives” reference sheets to guide inquiry.
Select a priority skill/target for
group focus
Baseline Data Collection: Begin collecting data Immediately following initial data sort . For students receiving intervention, this data will serve as “baseline” for setting the group and individual SMART goals required at the next review point. To determine the appropriate tool for assessment see the easyCBM Quick Reference Guide.
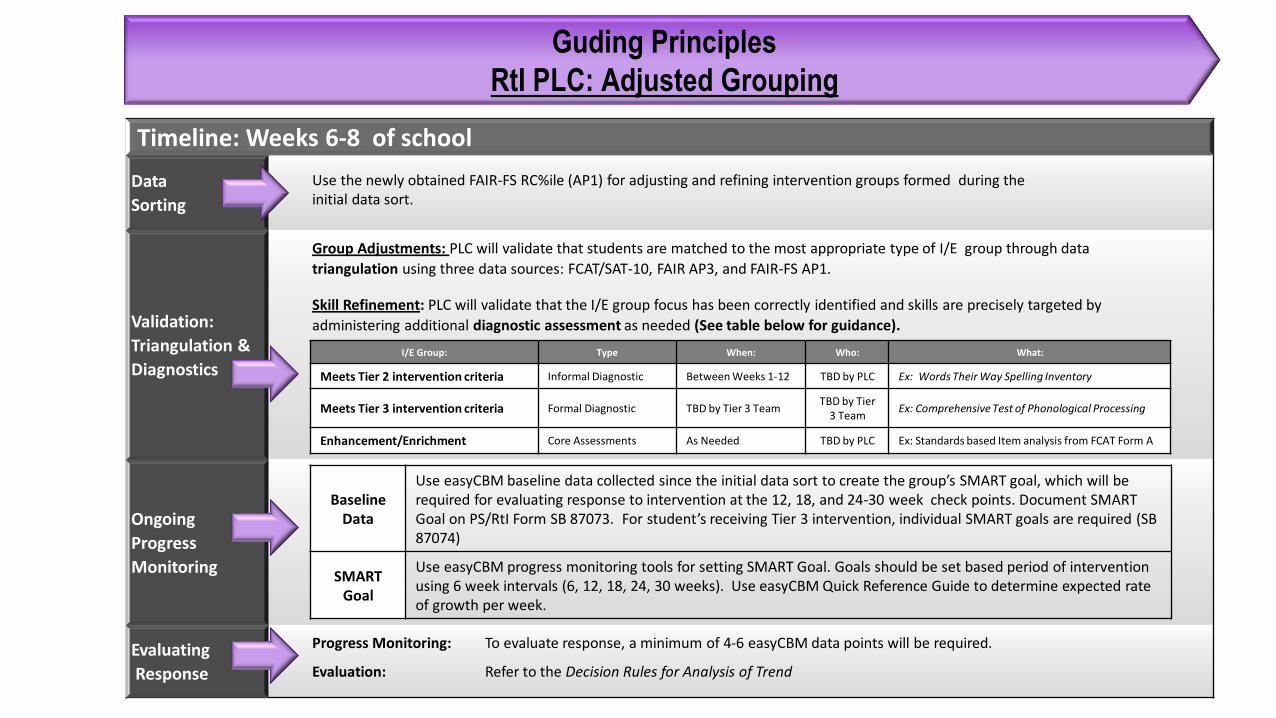
Guding Principles
RtI PLC: Adjusted Grouping
Timeline: Weeks 6-8 of school
Data
Sorting
Validation:
Triangulation &
Diagnostics
Ongoing
Progress
Monitoring
Evaluating
Response
Baseline
Data
Use easyCBM baseline data collected since the initial data sort to create the group’s SMART goal, which will be required for evaluating response to intervention at the 12, 18, and 24-30 week check points. Document SMART Goal on PS/RtI Form SB 87073. For student’s receiving Tier 3 intervention, individual SMART goals are required (SB 87074)
SMART Goal
Use easyCBM progress monitoring tools for setting SMART Goal. Goals should be set based period of intervention using 6 week intervals (6, 12, 18, 24, 30 weeks). Use easyCBM Quick Reference Guide to determine expected rate of growth per week.
Use the newly obtained FAIR-FS RC%ile (AP1) for adjusting and refining intervention groups formed during the initial data sort.
Progress Monitoring: To evaluate response, a minimum of 4-6 easyCBM data points will be required.
Evaluation: Refer to the Decision Rules for Analysis of Trend
I/E Group: Type When: Who: What:
Meets Tier 2 intervention criteria Informal Diagnostic Between Weeks 1-12 TBD by PLC Ex: Words Their Way Spelling Inventory
Meets Tier 3 intervention criteria Formal Diagnostic TBD by Tier 3 Team TBD by Tier
3 Team Ex: Comprehensive Test of Phonological Processing
Enhancement/Enrichment Core Assessments As Needed TBD by PLC Ex: Standards based Item analysis from FCAT Form A
Group Adjustments: PLC will validate that students are matched to the most appropriate type of I/E group through data
triangulation using three data sources: FCAT/SAT-10, FAIR AP3, and FAIR-FS AP1.
Skill Refinement: PLC will validate that the I/E group focus has been correctly identified and skills are precisely targeted by
administering additional diagnostic assessment as needed (See table below for guidance).

Guiding Principles
RtI PLC: Response Checkpoint #1
Timeline: Weeks 12-15 of school
Data
Sorting
Validation
Ongoing
Progress
Monitoring
Evaluating
Response
• For students who have received well documented Tier 3 supports for at least 12-18 weeks (for example, retained students), a possible
next step may include referral to CST for consideration of a multidisciplinary evaluation. • For students who have received well documented Tier 2 supports for at least 15-18 weeks, possible next steps may include referral to
Tier 3 Team to determine need for intensive supports (Tier 3) and formal diagnostics needed to support in the 4 step problem-solving process.
Review easyCBM:
Requirement:
Guideline:
Review 4 most recent easyCBM data points to evaluate group and individual response (SMART Goal must be in place) .
Minimum of 4 data points
6-8 data points available for review by weeks 12-15
Review results from easyCBM, FAIR-FS, and any additional informal or formal diagnostics to determine which students may be removed from an intervention group and placed in an enhancement group. Students must be showing “Good” response to intervention.
Use the newly obtained FAIR-FS RC%ile (AP2) to support adjusting and refining intervention groups formed during the initial data sort.
Step 1 Evaluate each student’s
response Use Decision Rules for Analysis of Trend to determine if response “good, poor, questionable”
Step 2 Evaluate each intervention
group’s response
Use Data Driven Decision Making Guide to evaluate group’s response. Use guide to determine next steps. (+SO = ≥ 70% had a “good” response, +IF = ≥ 70% rating for fidelity)
Step 3 Prepare for next steps Continue intervention, implement strategies to promote fidelity, or modify/change intervention.

Guiding Principles
RtI PLC: Response Checkpoint #2
Timeline: Week 18 of school
Data
Sorting
Validation
Ongoing
Progress
Monitoring
Evaluating
Response
• For students who have received well documented Tier 3 supports for at least 12-18 weeks (for example, retained students), a
possible next step may include referral to CST for consideration of a multidisciplinary evaluation.
• For students who have received well documented Tier 2 supports for at least 15-18 weeks, possible next steps may include referral to Tier 3 Team to determine need for intensive supports (Tier 3) and formal diagnostics needed to support in the 4 step problem-solving process.
Review results from easyCBM progress monitoring data, FAIR-FS, and any additional informal or formal diagnostics to determine which students may be removed from an intervention group and placed in an enhancement group. Students must be showing “Good” response to intervention.
Use the newly obtained FAIR-FS RC%ile (AP2), easyCBM progress monitoring data, and any additional formal/informal diagnostic information for refining and adjusting intervention groups formed during the initial data sort.
Step 1 Evaluate each student’s
response Use Decision Rules for Analysis of Trend to determine if response “good, poor, questionable”
Step 2 Evaluate each intervention
group’s response
Use Data Driven Decision Making Guide to evaluate group’s response. Use guide to determine next steps. (+SO = ≥ 70% had a “good” response, +IF = ≥ 70% rating for fidelity)
Step 3 Prepare for next steps Continue intervention, implement strategies to promote fidelity, or modify/change intervention
Review easyCBM:
Requirement:
Guideline:
Review 4 most recent easyCBM data points to evaluate group and individual response (SMART Goal must be in place) .
Minimum of 6-8 data points
9-12 data points available for review by weeks 12-15

Guiding Principles
RtI PLC: Response Checkpoint #3
Timeline: Week 24-30 of school
Ongoing
Progress
Monitoring
Evaluating
Response
Review CBM:
Requirement:
Guideline:
Review 4 most recent easyCBM data points to evaluate group and individual response (SMART Goal must be in place).
Minimum of 8-12 data points
12-15 data points available for review by weeks 24-30
Possible next steps may include: • Referral to Tier 3 Team to document initiation of Tier 3 supports for the following school year. • For students who have received Tier 3 supports for at least 12 weeks beyond Tier 2 (15-18 weeks of Tier 2 intervention
required). Tier 3 Team may refer to CST for consideration of the multidisciplinary evaluation. At the last RtI PLC meeting, ensure all documentation is complete for students who have received intervention throughout the school year. Provide PSLT Liaison with all PS/RtI documents needed for the student’s cumulative school record upon request.
• Documentation will be reviewed to determine need for summer reading camp and may be used by school and/or district level Promotion/Retention Committees
Step 1 Evaluate each student’s
response Use Decision Rules for Analysis of Trend to determine if response “good, poor, questionable”
Step 2 Evaluate each intervention
group’s response
Use Data Driven Decision Making Guide to evaluate group’s response. Use guide to determine next steps. (+SO = ≥ 70% had a “good” response, +IF = ≥ 70% rating for fidelity)
Step 3 Prepare for next steps Continue intervention, implement strategies to promote fidelity, or modify/change intervention, refer to Tier 3 Team

MONDAY TUESDAY WEDNESDAY THURSDAY FRIDAY SAT/SUN
Note:
You can print this template to use as a wall calendar. You can also copy the slide for any month to add to your own presentation.
28 July 29 30 31 1 August 2/3
4 5 6 7 8 9/10
11 12 13 14 15 16/17
18 19 20 21 22 23/24
25 26 27 28 29 30/31
august
1 September 2 3 4 5 6/7
2014
Professional Study Day
Students’ First Day of School FLKRS (8/19-9/30)
Hold a PSLT Meeting for school-wide data review
and planning
August
Review RtI Documentation and data from the previous school year to determine next steps for those students. NO, YOU DO NOT NEED TO START OVER!!!!!!
Math Formative 1: Gr 3-5 (8/25-9/5) Science Formative: Gr 5 (8/25-9/5) KRT (8/25-10/10)
Schedule RtI PLCs for Initial data sorts to occur
between 8/19-9/2

MONDAY TUESDAY WEDNESDAY THURSDAY FRIDAY SAT/SUN
Note:
You can print this template to use as a wall calendar. You can also copy the slide for any month to add to your own presentation.
1 September 2 3 4 5 6/7
8 9 10 11 12 13/14
15 16 17 18 19 20/21
22 23 24 25 26 27/28
29 30 1 October 2 3 4/5
6 7 8 9 10 11/12
September 2014
6-week Intervention
Period #1 Begins (9/3-10/16)
Reading Coaches will send a list of students identified for
interventions to the RtI facilitator. easyCBM licenses will be assigned
for these students.
EasyCBM Assessments
PSLT Meeting for school-wide data review
Possible Intervention
Fidelity Check
September
PLC: Tier 1 Instructional
Planning (Formative Results)
EasyCBM Assessments
PLC: Tier 1 Instructional
Planning (Formative Results)
FAIR-FS AP1 Begins: Gr. K-5 (9/2-10/24)
Opportunities for Response to Intervention meetings (PLCs /Tier 3 Team Meetings)
Opportunities for Response to Intervention meetings (Tier 3 Team Meetings)
Initial Data Sorts should
be completed By 9/2
Early in the school year students will be completing universal screening assessment; however, the initial data sort can be completed without waiting for all assessment to be completed. With the initial data sort groups for enrichment, enhancement and intervention, the intention is to use summative assessment outcomes from the previous school year and AP3 screening data for the early identification of struggling readers. During this intervention period, interventionists will begin collecting baseline data with easyCBM progress monitoring assessments This data will be needed to set a SMART goal, which is extremely important for applying RtI decision rules made at subsequent response checkpoints. Use the red Guiding Principles for Initial Data Sorting document to guide the PLC data sort discussion.

MONDAY TUESDAY WEDNESDAY THURSDAY FRIDAY SAT/SUN
Note:
You can print this template to use as a wall calendar. You can also copy the slide for any month to add to your own presentation.
29 September 30 1 October 2 3 4/5
6 7 8 9 10 11/12
13 14 15 16 17 18/19
20 21 22 23 24 25/26
27 28 29 30 31 1/2 November
3 4 5 6 7 8/9
october 2014
EasyCBM Assessments
ELA Interim Assessment Gr. 2-5 10/13-10/17
6-week Intervention
Period #1 Ends (9/3-10/16)
Continue interventions and schedule RtI PLC for data sort with FAIR-FS
and adjusted I/E grouping between 10/14-10/31
PSLT Meeting
for school-wide data review
EasyCBM Assessments
October
Opportunities for Response to Intervention meetings (Tier 3 Team Meetings)
Possible Intervention
Fidelity Check
RtI PLC by 10/31 Adjusted Grouping
Review AP1 Screener and make I/E
group adjustments by 10/31
Opportunities for Response to Intervention meetings (RtI PLC’s /Tier 3 Team Meetings)
Possible Intervention
Fidelity Check
PLC: Tier 1 Instructional Planning (Formative Results/FAIR)
Opportunities for Response to Intervention meetings (Tier 3 Team Meetings)
FAIR AP1 Closes
PLC: Tier 1 Instructional Planning (Formative Results/FAIR)
During the 2nd data sort “adjusted grouping” RtI PLCs will use the data triangulation documents to validate students in need of interventions. Within the first few weeks of intervention implementation, the PSLT should schedule fidelity checks. Data obtained from fidelity checks should be summarized on the fidelity walk-through checklist and provided to interventionist as part of informal feedback. Use the purple Guiding Principles for adjusted grouping sheet to drive your PLC discussion around adjusted grouping.
End of 1st grading period

Section 4
MONITORING RESPONSE TO INTERVENTION
Fidelity Checks, Student Goals and Student Outcomes

SO = Student Outcomes
IF = Intervention Fidelity
+SO = > 70%
+IF= > 70%
Guided Steps for Reviewing Intervention Fidelity and Student Outcomes

11 fundamental components:
1. Adhered to scheduled time
2. Lesson matched to identified need
3. Evidence-based lessons
4. Explicit instruction/modeling
5. High student-teacher interaction
6. Opportunities for practice
7. Checks for understanding
8. Corrective feedback
9. Instructional/Behavioral praise
10.Pacing with a sense of urgency
11.Students on-task & focused
11

Calculating Average Fidelity for RtI Meetings: 1. Add the percent of fidelity obtained for each fidelity check completed to date. 2. Divide by the number of fidelity checks completed to date. 3. Report the average fidelity score as a percent and use this score to determine positive and
negative Intervention Fidelity "IF" at the intervention meeting. Example: Fidelity Check 1 = 45 Fidelity Check 2 = 65 Fidelity Check 3 = 70 Fidelity Check 4 = 100 45+65+70+100 = 280 divide by 4 = 70 70% average fidelity (+IF)

0%
10%
20%
30%
40%
50%
60%
70%
80%
90%
100%Grade Level Walkthrough Feedback for Teacher Teams
Fidelity Component
Goal

0%
10%
20%
30%
40%
50%
60%
70%
80%
Sep 17th Oct 1st Oct 15th Nov 5th Nov 9th Dec 3rd Dec 17th Jan 14th Jan 28th Feb 4th Feb 28th April 8th April 28th May 6th May 20th
Intervention Fidelity Data by Interventionist
Interventionist 1
Interventionist 2
Interventionist 3
Goal Line

Ongoing Progress Monitoring for Determining Response to Intervention
Important Characteristics of Ongoing Progress Monitoring Measures identified in the professional literature:
• Reliable and Valid (Commercial assessments have undergone psychometric analyses to determine
reliability and validity). A “teacher-made” assessment cannot be referred to as reliable nor valid if it has not undergone psychometric analyses.
• Standardized norms
• Sufficient number of alternative forms of equal difficulty
• Rates of improvement are specified
• Sensitive to improvement/small increments of growth
• Administered at regular intervals, with increasing frequency as the intensity of the intervention increases.
• Given to selected students

easyCBM
District Required Assessment Program
for Goal Setting and Ongoing Progress Monitoring

Setting Goals for Monitoring Student Outcomes (SO)
Measure/Skill 1st Grade Norms: CBM Expected Rates of Improvement:
Total Word Gain Guidelines by 6 Week Checkpoints
Passage Reading Fluency 6 Weeks 12 Weeks 18 Weeks 24 Weeks 30 Weeks 36 Weeks
Insufficient Growth < 6
word gain
< 12
word gain
< 18
word gain
< 24
word gain
< 30
word gain
< 36
word gain
Reasonable Goal 8
word gain
16
word gain
24
word gain
32
word gain
40
word gain
48
word gain
Ambitious Goal 10+
word gain
20+
word gain
30+
word gain
40+
word gain
50+
word gain
60+
word gain
Word Reading Fluency 6 Weeks 12 Weeks 18 Weeks 24 Weeks 30 Weeks 36 Weeks
Insufficient Growth < 6
word gain
< 12
word gain
< 18
word gain
< 24
word gain
< 30
word gain
< 36
word gain
Reasonable Goal 8
word gain
16
word gain
24
word gain
32
word gain
40
word gain
48
word gain
Ambitious Goal 10+
word gain
20+
word gain
30+
word gain
40+
word gain
50+
word gain
60+
word gain

Setting a Goal for Decision Making Setting an Individual Student Goal Example
Step 1. Define baseline On 9/6, STUDENT 3 read 21 wcpm on a 2nd grade passage reading fluency measure
Step 2. Define expected rate of growth Ambitious rate using CBM Expected Rates of Improvement chart for 2nd grade (60 wcpm expected growth over 30 weeks)
Step 3. Define # of weeks 30 weeks (9/3/13 to 05/5/13)
Step 4. Calculate Goal Expected growth over 30 weeks of intervention = 60 wcpm (21+60= 81 wcpm Goal)
Step 5. Create goal line Enter goal into easyCBM system under “Reports” tab AND review goal line appearing on graph after a minimum of 3 data points are recorded
Step 6. Evaluate response at next review point
At the RTI PLC (Response Checkpoint 1), 15 weeks of intervention had been delivered. Response was determined to be “poor” when using 4-point method (use Rules for Analysis of Trend)
Step 7. Use decision rules to determine next steps
Keep goal, modify teaching (complete fidelity check before changing intervention)
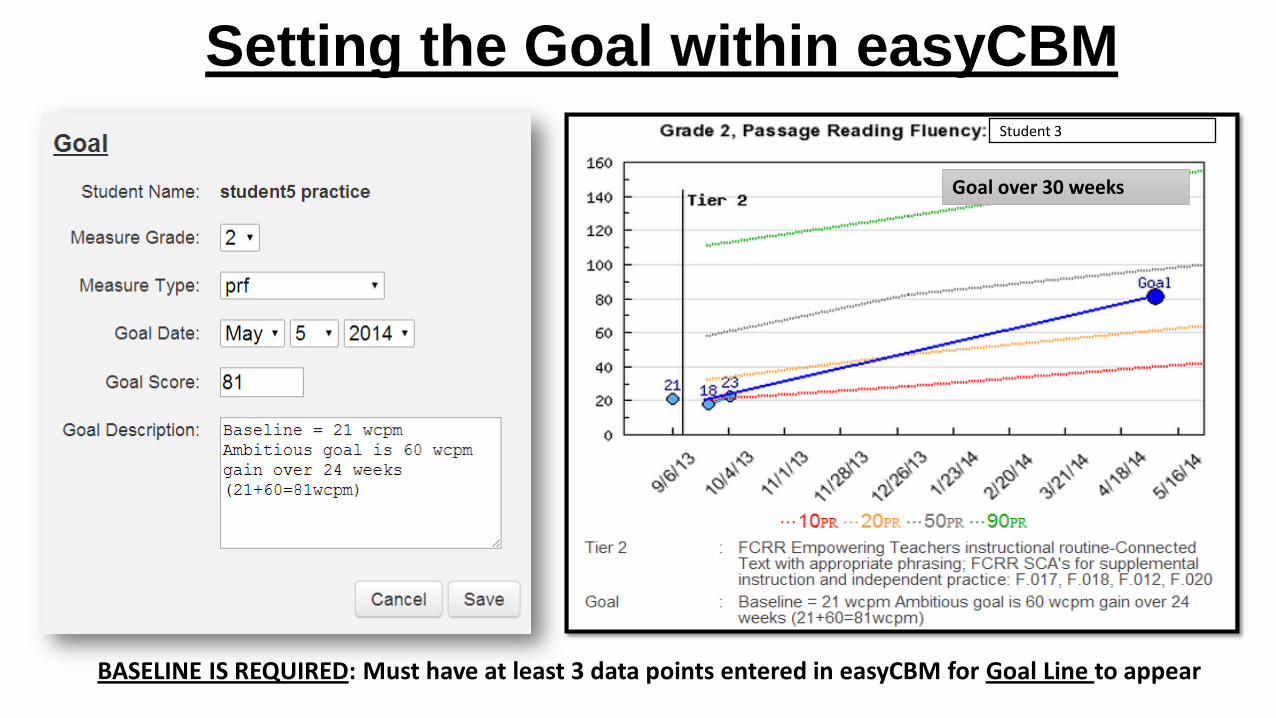
Setting the Goal within easyCBM
Student 3
Goal over 30 weeks
BASELINE IS REQUIRED: Must have at least 3 data points entered in easyCBM for Goal Line to appear

Sample Tier 2 Group SMART Goal
Based on most recent data points from 09/8/2014, students will each improve their CBM scores on
1st grade Word Reading Fluency by 50 words correct per minute (wcpm) over the next 30 Weeks.
Review goal line within easyCBM to evaluate response using 4-point method. Remember: Response is considered “good” when the 4 most recent
consecutive data points are all above the goal line.
Group Monitoring Question:
Are ≥ 70% showing “Good” response?
Baseline 9/8/2014
Expected Growth 6 weeks
Intervention
(10 wcpm)
Expected Growth 12 weeks
Intervention
(20 wcpm)
Expected Growth 18 weeks
Intervention
(30 wcpm)
Expected Growth 24 weeks
Intervention
(40 wcpm)
Goal 05/29/15
(50 wcpm)
Abby 12 wcpm 22 wcpm 32 wcpm 42 wcpm 52 wcpm 62 wcpm
Bobby 18 wcpm 28 wcpm 38 wcpm 48 wcpm 58 wcpm 68 wcpm
Debby 11 wcpm 21 wcpm 31 wcpm 41 wcpm 51 wcpm 61 wcpm
Freddy 14 wcpm 24 wcpm 34 wcpm 44 wcpm 54 wcpm 64 wcpm
Gabby 20 wcpm 30 wcpm 40 wcpm 50 wcpm 60 wcpm 70 wcpm
Robby 22 wcpm 32 wcpm 42 wcpm 52 wcpm 62 wcpm 72 wcpm

Decision Rules for Analysis of Trend 4-Point Method
If the four most recent consecutive scores are: — All above the goal-line, keep the current intervention and increase goal (Good Response)
— All below the goal-line, keep the current goal and modify intervention (i.e., increase intervention fidelity and/or change intervention program) (Poor Response)
— Neither above or below, keep the current goal and intervention and continue to progress monitor (Questionable Response)

Response to Intervention: Decision Making with the Four-Point Method
(12 Weeks of Intervention)
Tier 2 Intervention Began 9/7/13
Goal Line
I/E Group
Created
Most recent 4 Points
Keep intervention and increase
goal
PLC Next Steps?
Student 1

Tier 2 Intervention Began 9/07/13 I/E Group
Created
Response to Intervention: Decision Making with the Four-Point Method
Goal Line
Modify intervention
and keep goal
Student 2
Most recent 4 points
(12 Weeks of Intervention)
PLC Next Steps?
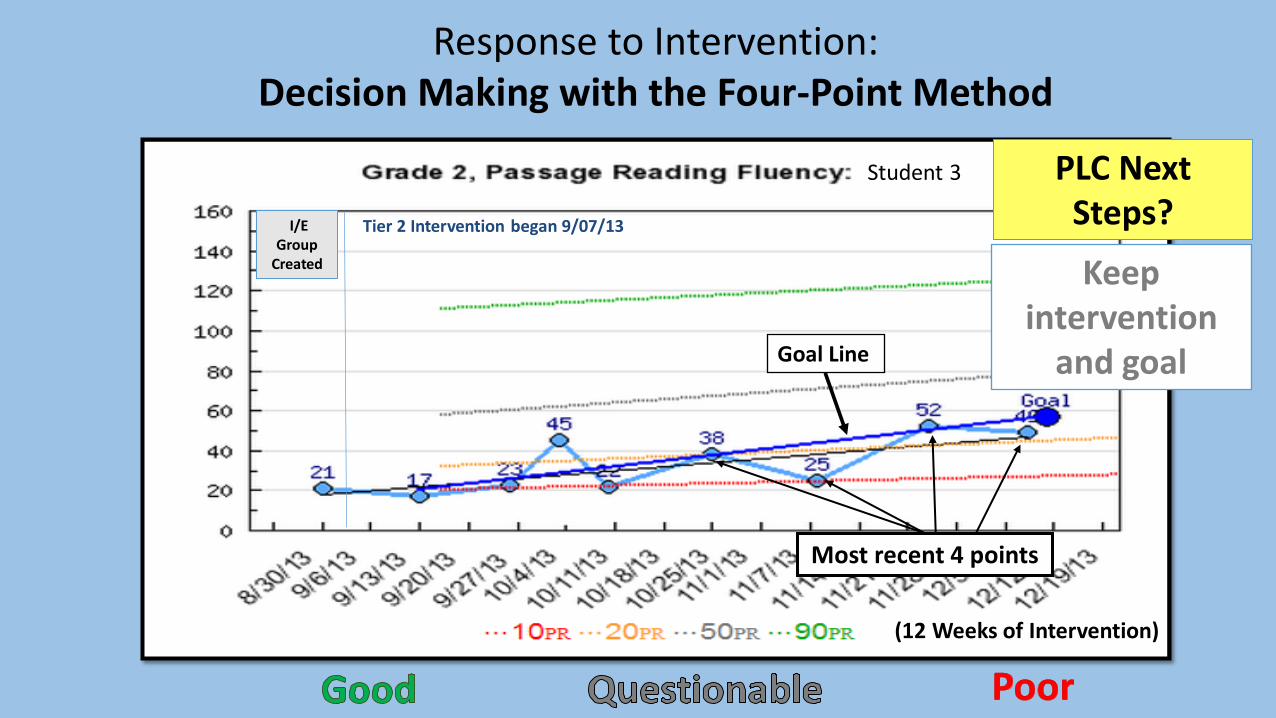
Tier 2 Intervention began 9/07/13 I/E Group
Created
Response to Intervention: Decision Making with the Four-Point Method
Goal Line
Most recent 4 points
Keep intervention
and goal
Student 3 PLC Next Steps?
(12 Weeks of Intervention)

Sep 3 - Oct 16 6-week
Intervention
Period 1
Nov 3 – Dec 19 6-week
Intervention
Period 2
30 week Continuum of Intervention Delivery and Data-Based Decision Making
RtI PLC Initial Data Sort (8/27)
RtI PLC Checkpoint
1
RtI PLC Adjusted Grouping
Student 3 RtI PLC Checkpoint
2
RtI PLC Checkpoint
3
6 wks 12-15 wks 24-30 wks May 1-May 29
6-week Intervention
Period
Full year of Core
Instruction and
Intervention Delivery
Tier 2 Intervention
begins 9/07/13
Fidelity Check
Questionable Response:
PLC decision is to keep
intervention, give informal
diagnostics and check fidelity
Fidelity Check
Questionable Response
Tier 3 Team Decision is to
Keep Intervention and
check fidelity before next review point
Set 30 week Goal using baseline
data
Poor Response: Fidelity was
>70% but basic, informal
diagnostics could not validate
hypothesis. PLC decision is
to request Tier 3 Team support
T3 Team Decision: Modify
intervention and request formal diagnostics to validate Tier 2
problem ID
Tier 3 Team
Decision: Good Response
Baseline
Most recent 4 points Below Goal Line
Decision for next steps: Fade Tier 3
individualized supports once
fluency has reached 50%tile
Mar 16 – Apr 29 6-week
Intervention
Period 4
18-21 wks Jan 12 – Feb 27
6-week Intervention
Period 3
Most recent 4 Points Above Goal Line

Documenting Intervention Support Electronically

Thank you for your collaboration on this project.
Divisions/Departments
Curriculum and Instruction
Elementary Education
School Improvement
Assessment and Accountability
Student Services
Exceptional Student Education
School Psychological Services
Academic Support and Federal Programs
Title 1 Office
Administration
Principal Coaches
Information Technology
School Leadership Teams
Sulphur Springs
Claywell
Springhead
Bay Crest
Graham
Wilson
Gibsonton
Interventions Should Always be in Addition to Quality Core Instruction