Embed Size (px)
Citation preview


Welcome
2010 Investor Conference: Creating Sustainable Long Term Value
September 29, 2010

Agenda
8:00 am Welcome & Introduction Dave Dillon
8:10 am How We Drive Value Creation Rodney McMullen
8:40 am Customer Loyalty Don Becker
8:55 am Associate Engagement Katy Barclay
9:10 am Break
9:25 am Financial Review Mike Schlotman
9:55 am Technology Innovation Chris Hjelm
10:10 am Summary
10:25 am Q&A Session
11:15 am Lunch & Tour
3

This presentation includes forward-looking statements which are subject to risks and uncertainties. Actual results might differ materially from those projected in the forward-looking statements. Additional information concerning factors that could cause actual results to materially differ from those in the forward-looking statements is contained in our Securities and Exchange Commission filings.
Forward-Looking Statements
4

Welcome and Introduction
Dave Dillon
Chairman and Chief Executive Officer

Kroger at a Glance
One of the largest U.S. retailers
2,468 supermarkets and multi-department stores in 31 states
2009 annual revenues: $76.7 billion
2009 operating profit: $1.1 billion
#1 or #2 market share in 38 of 42 major markets
Nearly 50% of households hold one of our shopper cards
334,000 associates
6

A Broad Footprint Across the U.S.
Alaska
(11)
Washington
(126)
Oregon
(55)
Montana(4)
(375)
Nevada
(55) Utah
(48)
Idaho(14)
Wyoming
(9)
Colorado
(138)
Arizona
(126)
New
Mexico
(27)
Texas
(201)
North
Dakota
South
Dakota
Minnesota
(134)
Illinois
(61)
Oklahoma
Ohio
(212)
Pennsylvania
New York
Kentucky(109)
Virginia(62)
Tennessee(121)
Missouri
(18)
(9)
Iowa
(145)
Wisconsin
Kansas(67)
Arkansas
(35)
North Carolina(18)
South
Carolina(11)Georgia
(175)
WV
(46)
CT
(34)(10)
VTNH
MA
RI
NJ
DEMD
Maine
Nebraska
(12)
7
2,468 Supermarkets in 31 States

Key Retail Grocery Industry Trends
Continued macro uncertainty
Consumer behavior mirroring economic realities
Cost volatility in food
– Inflation in perishables
– Deflation in grocery tied to promotions to drive volumes
More rational approach to managing for profitability
Performance closely tied to successfully meeting customers needs
8

Sustained Industry Leadership Over Time
* Includes Walmart Supercenters and Walmart subsidiary Sam’s Clubs.
Source: Business Guides, Directory of Supermarket, Grocery & Convenience Store Chains, 1988, 1998, 2008
1987 1997 2007
Safeway Kroger Walmart*
Kroger Safeway Kroger
American Stores Walmart* Safeway
Winn-Dixie Albertsons Costco
A&P American Stores SUPERVALU
Lucky Stores Costco Publix
Albertsons Winn-Dixie Ahold USA
Supermarkets Gen. Publix Delhaize America
Publix A&P H.E. Butt
Vons Companies Food Lion A&P
9

Independents < $20 > $20
Significant Growth Opportunities
Industry Market Share
Source: Progressive Grocer’s 72nd and 77th Annual Reports of the Grocery Industry
*Independents classified as fewer than 10 stores10
Average Store
Sales in Millions
2009$556.9 billion
2004$457.4 billion

Volatility in Food Costs
11Source: Company reports

Cost Volatility Across Departments
12Source: Company reports

The New Consumer Reality
Drivers of consumer behavior:
– ~ 10% unemployment
– Flat/falling home prices
– Customer uncertainty regarding economy is reflected in cautious spending
Our competitive response:
– Rewarding most loyal customers
– Balancing price and tonnage
– Targeted offerings to meet unique needs
– Balance of corporate brand, national brands
– Superior shopping experience
13

How We Drive Value Creation
Rodney McMullen
President and Chief Operating Officer

Our Competitive Advantages
Unique consumer insights drive high customer loyalty
Compelling three-tier corporate brand strategy
Successful multi-faceted strategy is difficult to replicate
Leader in growing identical sales – 27 consecutive quarters
Gaining market share and leveraging scale
Solid balance sheet with significant financial flexibility
Seasoned and proven leadership team
High quality asset base
Track record of rewarding shareholders through dividends and share repurchases
15

Customer 1st Strategy
Four Key Elements:
16

A Virtuous Cycle of Value Creation
Invest in Shopping Experience
Improve Connection with Customers
Strong ID Sales Growth
Operating Cost Leverage
17

How We Measure Our Success
Financial Metrics (all excluding fuel)
– ID sales
– Supermarket selling gross margin
– Operating costs
– Operating margin
Non-Financial Metrics
– Customer 1st Tracker scores
– Loyal household growth
– Market share
18
Progress on Key Customer 1st Metrics
PEOPLE SHOPPING EXPERIENCE
PRICEPRODUCTS
19

Driving Loyal Household Growth
Over 90% of Kroger’s transactions involve a loyalty card*
Nearly 50% of U.S. households carry one of our shopper cards
Our ability to collect and analyze customer purchase data allows us to respond rapidly to shifts in buying patterns
The data allows us to segment and target
dunnhumby enables us to more effectively partner with our national vendors than our peers
20* Excludes Food 4 Less division

Growing Share of Market – Dollar Sales
21Source: Nielsen Homescan Fiscal Year Sales Trends – August 14, 2010See Appendix 1 for definition of segments
19.0%
27.0%
27.4%
10.9%
4.3%
1.7%10.2%
FY 2007
Kroger Rem Food Mass Warehouse Drug Dollar A/O Channels
20.0%
26.4%
26.9%
11.1%
4.1%
1.9%9.7%
FY 2009

Customer 1st Drives Value Creation
More return visits and increased
sales and share
Growing profits andcash flow to reinvest in
business & enhance shareholder value
22

Earning Customer Loyalty
Don Becker
Executive Vice President

24
Deep Customer Knowledge

Growing Loyalty Helps Drive ID Sales
25
0%
1%
2%
3%
4%
5%
6% GAP between KR IDs and Industry IDs
Source: Credit Suisse and Company data

26
Our Pricing Strategy
Significant investment in price based on research data
Strategy focuses on three areas:
– Everyday prices
– Weekly specials
– Store brands
We are price competitive for everyday items important to price sensitive shoppers
Shoppers are willing to pay a certain premium for Kroger store experience

Products
Produce & meat quality
Offer the products our customers want
Corporate brands
27

Shopping Experience
Improving speed of checkout
Store cleanliness & convenience
28

People!
29

30
Produce: Investing in Price
Customer research & loyalty card data told us that we needed to address pricing
We responded by investing in lower prices on produce
– Lower everyday prices on fruits and vegetables that matter most to our customers
– Weekly specials
– Price competitive, not the price leader
Produce: Investing in Products
31
32
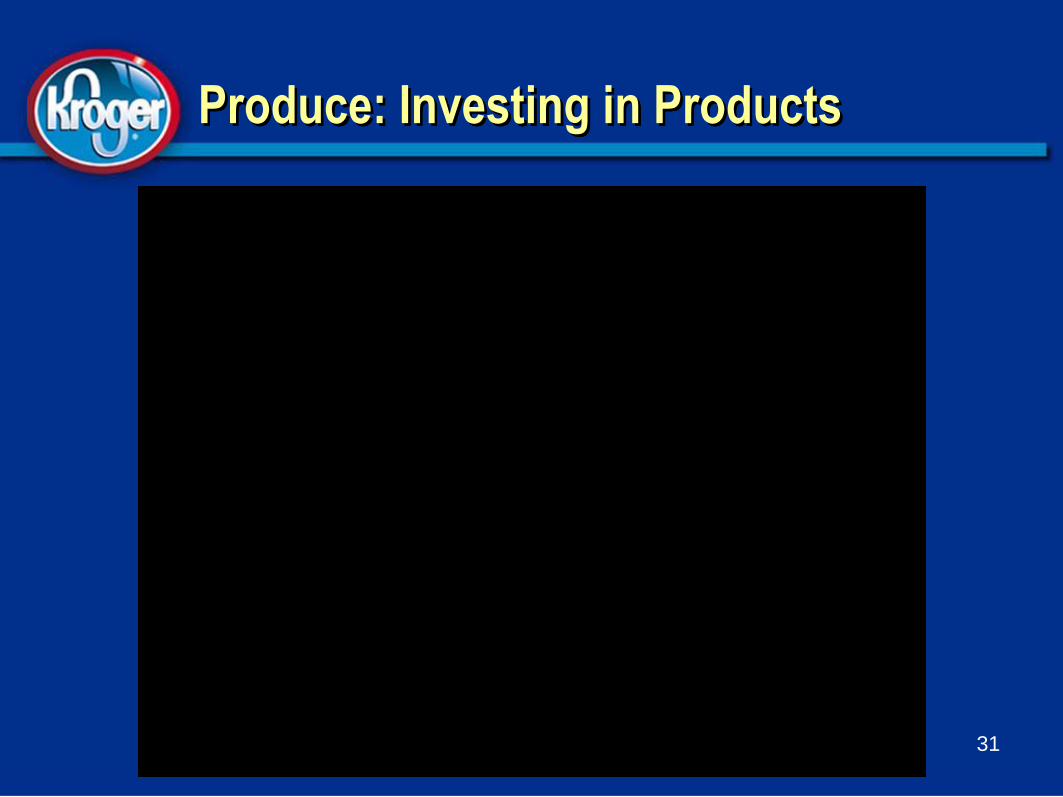
Produce: Investing in the Shopping Experience
Great displays
Improved signage

33
Produce: Investing in Service
Keep departments clean & well-stocked
Engage with customers

Produce: Investment Results
Emphasizing the 4 Keys help drive double-digit tonnage growth
Focusing on all 4 attributes of Customer 1st has delivered similar successes throughout our stores
34

Our Exclusive Brands
35

Source: Private Label Manufacturing Association 2Q10 data as reported in Barclays Capital U.S. Supermarket Industry Review –Fall 2010 and Company Reports
Private label penetration as a percent of industry unit sales has risen markedly in recent years
Kroger’s three-tier corporate branding strategy serves the needs of a diverse customer mix
Industry Leader in Corporate Brands…
36

…and Gaining Share
37

Three-Tier Corporate Brand Strategy
38
Value
Banner
Private

Responding to Customer Needs with Unique New Products
39

Creating Win – Win Vendor Relationships
Customer-centric approach to merchandising
The right product for the right customer at the right store
More effective promotion, advertising and direct mail spend
Data sharing on the performance of national brands in Kroger stores
Tonnage growth
Growing pool of loyal lifetime customers
40

Source: Cannondale Associates Manufacturer Survey Results as reported in Barclays Capital U.S. Supermarket Industry Review –Fall 2010 and Company Reports
Strengthening Our Relationship with CPG Companies
41
Improving Rating in Cannondale Associates Survey

42

Driving Success Through Associate Engagement
Katy Barclay
Senior Vice President

44

A More Focused Approach
More sophisticated tools and processes to define and measure employee engagement
Aligning associates with Kroger’s business objectives and strategy
Carefully acknowledging input from our associates and rewarding success
45

A positive emotional attachment to the job and the company
A strong personal desire for the company to be successful
A personal commitment to always do the right thing
46
What is Associate Engagement?

Why Focus on Associate Engagement?
Companies with engaged employees report:
Greater sales and profit growth
Higher productivity
Greater customer loyalty
Higher shareholder value
47Source: Towers Watson

Companies with high levels of engagement:
Financial Impact of Engagement
Have higher 5-year total returns to shareholders
Enjoy a higher market premium
Experience greater employee productivity
48
13%
50%
26%
Source: Towers Watson

Going a Level Deeper …
Extensive research proves that engaged employees are:
Twice as likely to be top performers
Exceed performance expectations
Miss fewer days of work
Connect with the company, products and customers
Resilient during organizational change
49Source: Towers Watson

Engagement Defined
attached to their companies
motivated to help their companies succeed
know how to make their companies successful
50
Connected
Committed
Aligned

Engagement Drivers
Customer Focus
Leadership
Associate Communications
Recognition
51

Engaging Front-end Associates
Leaders are involved and committed
Teams cometogether to build and own the outcomes
Associates are involved and excited to deliver results
Customers are scoring us higher in the Customer 1st Tracker
52

Measuring Effectiveness and Outcomes
Measuring Effectiveness:
– Proven, action-oriented questions
– Highly predictive of associate engagement
– Customer data validates effectiveness
Outcomes:
– Identical sales growth, excluding fuel
– Annual productivity improvements 53

54
Driving Success through Associate Engagement


Financial Review
Mike Schlotman
Senior Vice President and Chief Financial Officer

Driving Sustainable Earnings Growth
Objective: Grow earnings through steady increases in
identical sales coupled with a slight increase in annual
operating margin, both excluding fuel sales
Key long-term financial metrics (all exclude fuel):
– ID sales
– Supermarket selling gross margin
– Operating costs
– Operating margin
57

27 Consecutive Quarters of Positive ID Sales Growth
58

Kroger Outperforms Industry ID Sales Growth
59Source: Kroger ID Sales and Credit Suisse Supermarket Industry ID Estimates 8/4/10

Slowing the Rate of Gross Margin Decline
(120)
(100)
(80)
(60)
(40)
(20)
-
Q1-08 Q2-08 Q3-08 Q4-08 Q1-09 Q2-09 Q3-09 Q4-09 Q1-10 Q2-10
Ba
sis
Po
ints
Change in Supermarket Selling Gross Margin Rate(ex fuel, rolling 4-qtrs basis)
Source: Company data 60

Reducing Operating Costs
Since 2003, operating costs have declined by over 200 basis points, as a rate of non fuel sales due to:
– Cost reduction and efficiency initiatives
– Sales leverage
If not for these efficiencies and increased sales leverage, operating costs would have been $1.5 billion higher in fiscal 2009
61

Operating Margin Goals
Long term objective: slight increase in operating margin annually (ex fuel)
Sales leverage will drive operating margin improvement
FY09 operating margin isn’t “the new normal”
62

Outperforming Peers5-Yr Compound Annual EPS Growth Rate – Food Retailers
-8%
-6%
-4%
-2%
0%
2%
4%
6%
8%
10%
12%
A B C D E KR
63

0%
2%
4%
6%
8%
10%
12%
14%
16%
2005 2006 2007 2008 2009
Attractive Returns on Invested Capital5-Yr Average
64Source: Thomson Reuters
Kroger

Delivering Value to Shareholders
65
KR SWY SVU WFMI
Dividends $807 $538 $633 $609
Share Repurchases $3,161 $1,789 $490 $204
Net Cash Returned to Shareholders
$3,968 $2,326 $1,123 $813
Market Capitalization $12,933 $7,363 $2,117 $6,098
Cash Returned as % of Current Market Cap
30.7% 31.6% 53.0% 13.3%
Cash Returned to Shareholders 2005 – 2009 ($ in Millions)
Source: Barclays Capital Estimates – U.S. Supermarket Industry Overview Fall 2010 - Released 9/15/10

Disciplined Investment for Future Growth
*Excludes acquisitions & purchases of leased facilities.**Halfway point of guidance for $1.9 to $2.1 billion.
66
(In Billions)

Financial Leverage Decreasing
1.6
1.7
1.8
1.9
2.0
2.1
2.2
2.3 Net Total Debt to EBITDA
67Source: Company data

Attractive Credit Rating
BBB Credit Rating
Committed to a solid investment grade
Current $2.5 billion credit agreement expires November 2011
Favorable credit environment for issuers; anticipate negotiating a new credit agreement on favorable terms
68

Improving Performance in Q2
2Q10 2Q09 % Change
Sales $18,795.9 $17,728.2 6.02%
Operating Profit $493.5 $499.1 (1.12%)
Net Earnings $261.6 $254.4 2.83%
EPS $0.41 $0.39 5.13%
Operating Margin 2.63% 2.82%
Tax Rate 31.70% 34.75%
69
($ in millions except for per share amounts)

Strong Cash Flow
Year-to-date Highlights:
Operating Activities
– Generated $2.3 billion net cash
Investing Activities
– $952 million in capital expenditures
Financing Activities
– Issued $300 million in long-term debt
– Repurchased $228 million in common stock
– Paid out $123 million in dividends
70More than $1 billion in cash and temporary cash investments

Fiscal 2010 Annual Guidance
71
Guidance
ID Sales (ex fuel) 2% to 3%
Non-fuel Operating Margin Slight decline compared to FY 2009
Tax Rate 35.5%
Fuel Margin $0.11/gal
EPS (diluted) $1.60 to $1.80(Targeting the upper half of the range)
Capital Expenditures $1.9 to $2.1 billion

The Role of Technology Innovation in Customer 1st
Chris Hjelm
Senior Vice President and Chief Information Officer

Focus on Four Key Areas:
Build Reliable
Platforms
Drive Innovation
Implement Customer & Associate Solutions
Transform the
Organization
73
Our Technology Strategy

Customer 1st Strategy
74
“Align Technology Objectives for Positive Business Outcomes”

75
Good Prices – Distribution Center Automation

Good Prices – Distribution Center Automation
76

Single view of patient across Kroger
Prescription imaging
Release to patient, we know when prescriptions are sold, not just filled
Signature capture for HIPAA, EZ Caps, counseling, proof of delivery
Platform for innovation
77
Shopping Experience Makes Me Want to Return – Pharmacy

Conservative estimates have us crossing 15M coupon downloads a month by March of next year
We offer over 100 coupons valued at over $150 every week
Redemption rates are typically 10%
We’re currently working to release a cross-platform mobile coupon application
Shopping Experience Makes Me Want to Return – Digital Coupons
78

Digital Coupon Growth
79Source: Company data since inception in February 2010

New secure website provides content and gives associates a single trusted source for company and division information
Access from home or work
End goal is to personalize and provide role-specific information to our associates
Platform for innovation
Great People – Associate Portal
80

Research and Development Capability
– Game changing focus
– Challenge the status quo
– Partnerships to accelerate commercialization
Associate Engagement
– Everyone plays a role
Technology Infrastructure
Leverage Intellectual Property
81
Driving Continuous Innovation

Innovation In Process –Consumer Mobility
Pilot in 2010 Kroger Mobile Technology Platforms
(i-Phone/Droid) 82

83
Innovation in Process –Advantage Checkout

84
Innovation in Process –Advantage Checkout

Summary

Creating Sustainable Long Term Value
Unique consumer insights drive high customer loyalty
Compelling three-tier corporate brand strategy
Successful multi-faceted strategy is difficult to replicate
Leader in growing identical sales – 27 consecutive quarters
Gaining market share and leveraging scale
Solid balance sheet with significant financial flexibility
Seasoned and proven leadership team
High quality asset base
Track record of rewarding shareholders through dividends and share repurchases
86

Questions and Answers


Appendix

Appendix 1: Nielsen Homescan Definitions
Kroger
Rem Food – all other grocery retailers excluding Kroger
Mass – Walmart, K-mart, Target, etc.
Warehouse – Sam’s Club, BJ’s, Costco, etc.
Drug – CVS, Walgreens, Rite-aid, etc.
Dollar – Dollar stores
A/O Channels – Gas stations, convenience stores, military
bases
90

The accompanying slides contain certain forward-looking statements about the future performance of the Company. These statements are based on management’s assumptions and beliefs in light of the information currently available to it. These forward-looking statements are subject to uncertainties and other factors that could cause actual results to differ materially. Our ability to achieve identical supermarket sales and earnings growth and earnings per share goals, the timing that those earnings occur within the year, our ability to achieve results in the upper half of our earnings guidance range, and our abilityto continue to deliver shareholder value through dividends and share repurchases, may be affected by: labor disputes, particularly as the Company seeks to manage health care and pension costs; industry consolidation; pricing and promotional activities of existing and new competitors, including non-traditional competitors, and the aggressiveness of that competition; our response to these actions; unexpected changes in product costs; the state of the economy, including interest rates and the inflationary and deflationary trends in certain commodities; the extent to which our customers exercise caution in their purchasing behavior in response to economic conditions; the number of shares outstanding; the success of our future growth plans; goodwill impairment; volatility in our fuel margins; and our ability to generate sales at desirable margins, as well as the success of our programs designed to increase our identical sales without fuel. In addition, any delays in opening new stores,or changes in the economic climate could cause us to fall short of our sales and earnings targets. Our ability to increase identical supermarket sales also could be adversely affected by increased competition and sales shifts to other stores that we operate, as well as increases in sales of our corporate brand products. Earnings and sales also may be affected by adverse weather conditions, particularly to the extent that hurricanes, tornadoes, floods, and other conditions disrupt our operations or those of our suppliers; create shortages in the availability or increases in the cost of products that we sell in our stores or materials and ingredients we use in our manufacturing facilities; or raise the cost of supplying energy to our various operations. Our results also will be affected by the inconsistent pace of the economic recovery, consumer confidence, and changes in inflation and deflation in product and operating costs. Our capital expenditures could vary from our expectations if we are unsuccessful in acquiring suitable sites for new stores; development costs vary from those budgeted; our logistics andtechnology or store projects are not completed on budget or within the time frame projected; or if current operating conditions fail to improve or worsen. Our fuel margins could fail to normalize at 11¢ per gallon if rapid changes in fuel costs occur. Our non-fuel operating margin guidance could change if we are unable to pass on any cost increases, if our strategies fail to deliver the cost savings contemplated, or if changes in the cost of our inventory and the timing of those changes differfrom our expectations. Any change in tax laws, the regulations related thereto, the applicable accounting rules or standards, or the interpretation thereof by federal, state or local authorities could affect our expected effective tax rate. Please refer to Kroger’s reports and filings with the Securities and Exchange Commission for a further discussion of these risks and uncertainties.
Forward-Looking Statements
91


![Madison Kroger - Brochure [Read-Only]€¦ · D /^KE UD^ í ì ó ... Microsoft PowerPoint - Madison Kroger - Brochure [Read-Only] Author: clewis Created Date: 6/20/2019 5:33:39 PM](https://img.pdfslide.net/doc/110x75/5fef6a82268797271836f708/madison-kroger-brochure-read-only-d-ke-ud-microsoft-powerpoint.jpg)