Embed Size (px)
Citation preview

2017Half Year Investors/Analysts Presentation
Outline
Macro-economic Review
Overview of HY 2017
HY 2017 Performance Review
Business Segments and Subsidiary Review
Guidance and Plans for H2 2017
Outline
Macro-economic
Review
Overview of HY 2017
HY 2017 Performance
Review
Business Segments and
Subsidiary Review
Guidance and Plans for H2 2017
Macro-economic
Review
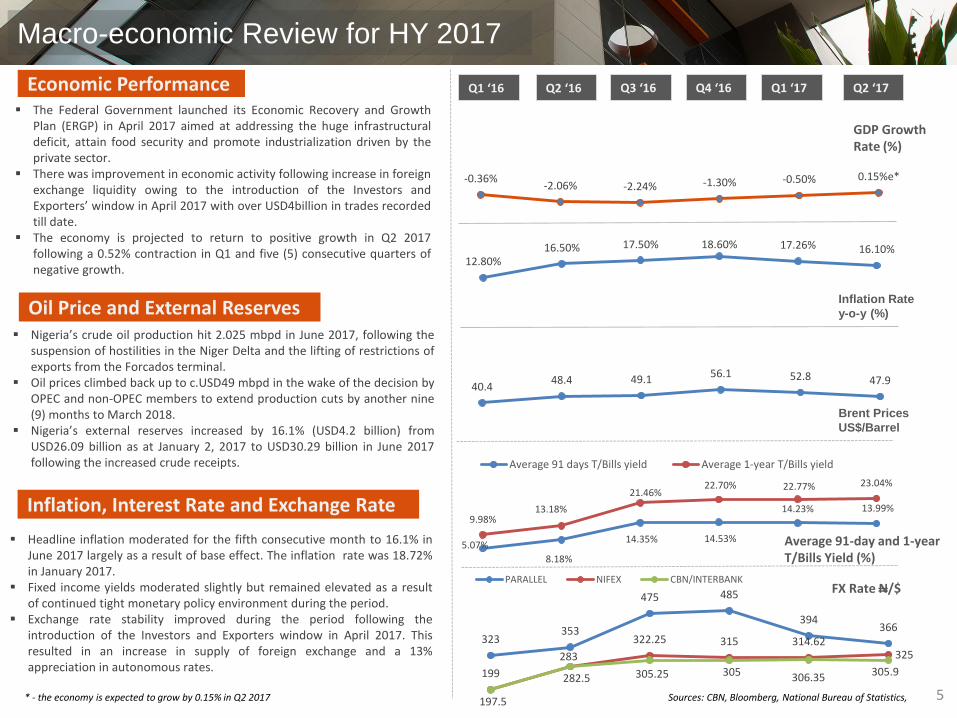
323353
475 485
394366
199 282.5
322.25 315 314.62325
197.5
283
305.25 305 306.35 305.9
PARALLEL NIFEX CBN/INTERBANK
5.07%
8.18%
14.35% 14.53%
14.23% 13.99%9.98%
13.18%
21.46%22.70% 22.77% 23.04%
Average 91 days T/Bills yield Average 1-year T/Bills yield
Q1 ‘16 Q2 ‘16 Q3 ‘16 Q4 ‘16 Q1 ‘17 Q2 ‘17
GDP Growth Rate (%)
Inflation Rate
y-o-y (%)
Brent Prices
US$/Barrel
FX Rate N/$
Average 91-day and 1-year T/Bills Yield (%)
Macro-economic Review for HY 2017
-0.36%-2.06% -2.24% -1.30% -0.50% 0.15%e*
12.80%16.50% 17.50% 18.60% 17.26% 16.10%
40.448.4 49.1 56.1 52.8 47.9
Sources: CBN, Bloomberg, National Bureau of Statistics,
Economic Performance
Oil Price and External Reserves
Inflation, Interest Rate and Exchange Rate
The Federal Government launched its Economic Recovery and GrowthPlan (ERGP) in April 2017 aimed at addressing the huge infrastructuraldeficit, attain food security and promote industrialization driven by theprivate sector.
There was improvement in economic activity following increase in foreignexchange liquidity owing to the introduction of the Investors andExporters’ window in April 2017 with over USD4billion in trades recordedtill date.
The economy is projected to return to positive growth in Q2 2017following a 0.52% contraction in Q1 and five (5) consecutive quarters ofnegative growth.
Nigeria’s crude oil production hit 2.025 mbpd in June 2017, following thesuspension of hostilities in the Niger Delta and the lifting of restrictions ofexports from the Forcados terminal.
Oil prices climbed back up to c.USD49 mbpd in the wake of the decision byOPEC and non-OPEC members to extend production cuts by another nine(9) months to March 2018.
Nigeria’s external reserves increased by 16.1% (USD4.2 billion) fromUSD26.09 billion as at January 2, 2017 to USD30.29 billion in June 2017following the increased crude receipts.
Headline inflation moderated for the fifth consecutive month to 16.1% inJune 2017 largely as a result of base effect. The inflation rate was 18.72%in January 2017.
Fixed income yields moderated slightly but remained elevated as a resultof continued tight monetary policy environment during the period.
Exchange rate stability improved during the period following theintroduction of the Investors and Exporters window in April 2017. Thisresulted in an increase in supply of foreign exchange and a 13%appreciation in autonomous rates.
5* - the economy is expected to grow by 0.15% in Q2 2017
Overview of HY 2017
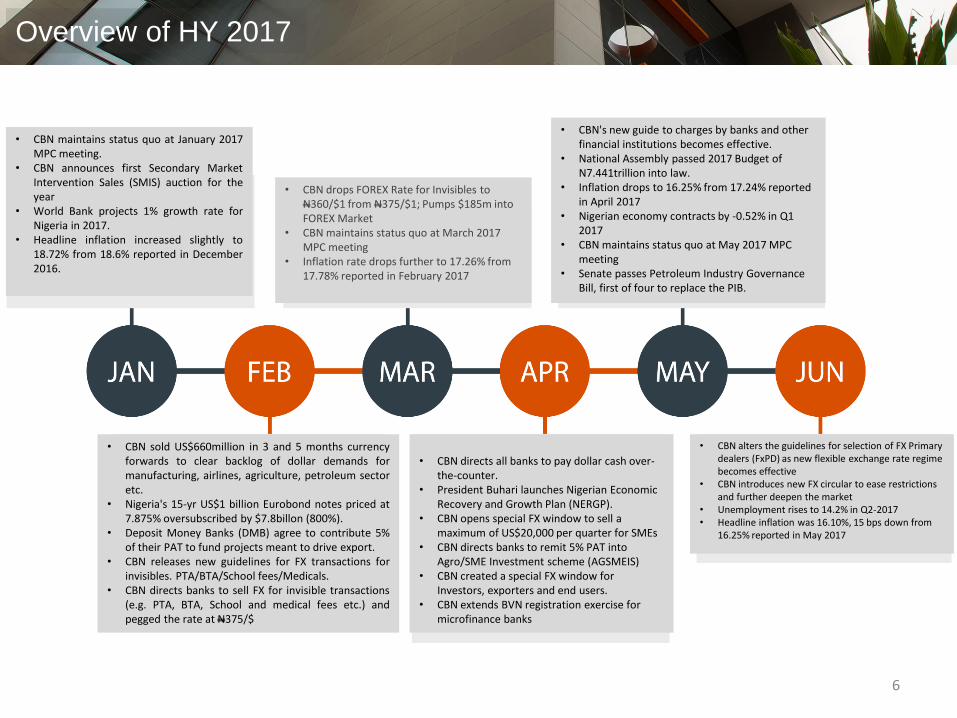
• CBN maintains status quo at January 2017MPC meeting.
• CBN announces first Secondary MarketIntervention Sales (SMIS) auction for theyear
• World Bank projects 1% growth rate forNigeria in 2017.
• Headline inflation increased slightly to18.72% from 18.6% reported in December2016.
• CBN sold US$660million in 3 and 5 months currencyforwards to clear backlog of dollar demands formanufacturing, airlines, agriculture, petroleum sectoretc.
• Nigeria's 15-yr US$1 billion Eurobond notes priced at7.875% oversubscribed by $7.8billon (800%).
• Deposit Money Banks (DMB) agree to contribute 5%of their PAT to fund projects meant to drive export.
• CBN releases new guidelines for FX transactions forinvisibles. PTA/BTA/School fees/Medicals.
• CBN directs banks to sell FX for invisible transactions(e.g. PTA, BTA, School and medical fees etc.) andpegged the rate at N375/$
• CBN drops FOREX Rate for Invisibles to N360/$1 from N375/$1; Pumps $185m into FOREX Market
• CBN maintains status quo at March 2017 MPC meeting
• Inflation rate drops further to 17.26% from 17.78% reported in February 2017
• CBN directs all banks to pay dollar cash over-the-counter.
• President Buhari launches Nigerian Economic Recovery and Growth Plan (NERGP).
• CBN opens special FX window to sell a maximum of US$20,000 per quarter for SMEs
• CBN directs banks to remit 5% PAT into Agro/SME Investment scheme (AGSMEIS)
• CBN created a special FX window for Investors, exporters and end users.
• CBN extends BVN registration exercise for microfinance banks
• CBN's new guide to charges by banks and other financial institutions becomes effective.
• National Assembly passed 2017 Budget of N7.441trillion into law.
• Inflation drops to 16.25% from 17.24% reported in April 2017
• Nigerian economy contracts by -0.52% in Q1 2017
• CBN maintains status quo at May 2017 MPC meeting
• Senate passes Petroleum Industry Governance Bill, first of four to replace the PIB.
• CBN alters the guidelines for selection of FX Primary dealers (FxPD) as new flexible exchange rate regime becomes effective
• CBN introduces new FX circular to ease restrictions and further deepen the market
• Unemployment rises to 14.2% in Q2-2017• Headline inflation was 16.10%, 15 bps down from
16.25% reported in May 2017
6

Half Year 2017 Financial
Performance Review

7
Net Interest Margin
Cost to Income
Capital Adequacy
Liquidity
Loans to Deposits and Borrowings
Return on Equity (post tax)
Return on Assets (post tax)
NPL to Total Loans
Cost of Risk
Coverage (with Reg. Risk
Reserve)
8.40% 10.42%
39.00% 40.00%
18.25% 23.10%
36.87% 48.52%
67.06% 62.70%
33.35% 32.09%
5.27% 5.27%
4.39% 3.71%
2.48% 0.45%
170.11% 222.94%
Six months ended June 30, 2016 Six months ended June 30, 2017
Key Performance Ratios
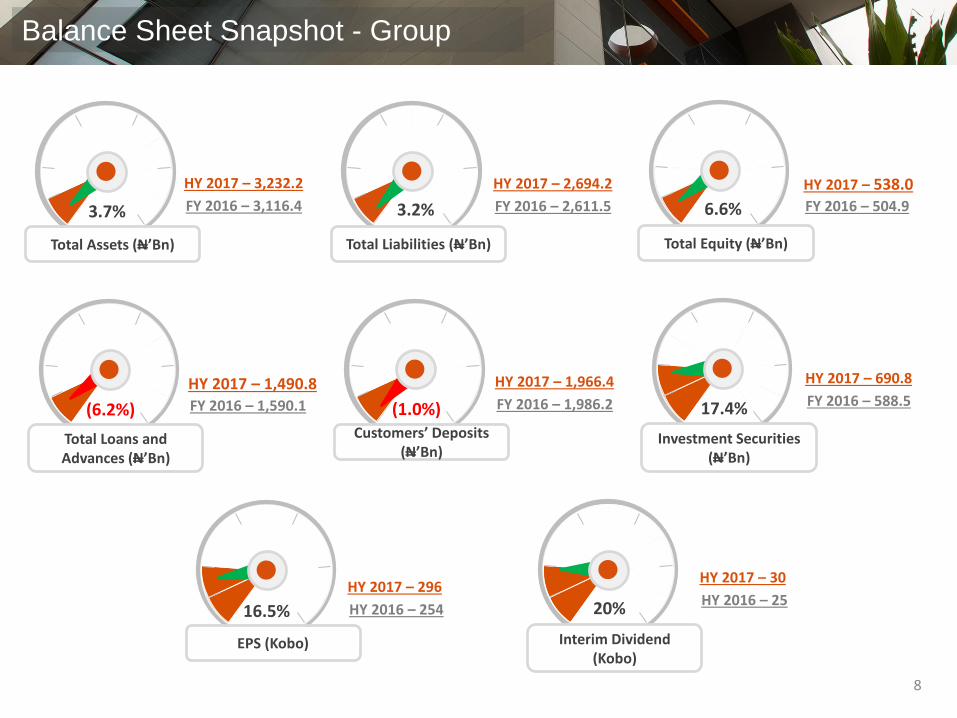
Balance Sheet Snapshot - Group
3.7%
Total Assets (N’Bn)
3.2%
Total Liabilities (N’Bn)
6.6%
Total Equity (N’Bn)
(6.2%)
Total Loans and Advances (N’Bn)
(1.0%)Customers’ Deposits
(N’Bn)
17.4%
Investment Securities (N’Bn)
16.5%
EPS (Kobo)
20%
Interim Dividend (Kobo)
HY 2017 – 3,232.2
FY 2016 – 3,116.4
HY 2017 – 2,694.2
FY 2016 – 2,611.5
HY 2017 – 538.0FY 2016 – 504.9
HY 2017 – 690.8
FY 2016 – 588.5
HY 2017 – 30
HY 2016 – 25
HY 2017 – 1,966.4
FY 2016 – 1,986.2
HY 2017 – 1,490.8FY 2016 – 1,590.1
HY 2017 – 296
HY 2016 – 254
8
9
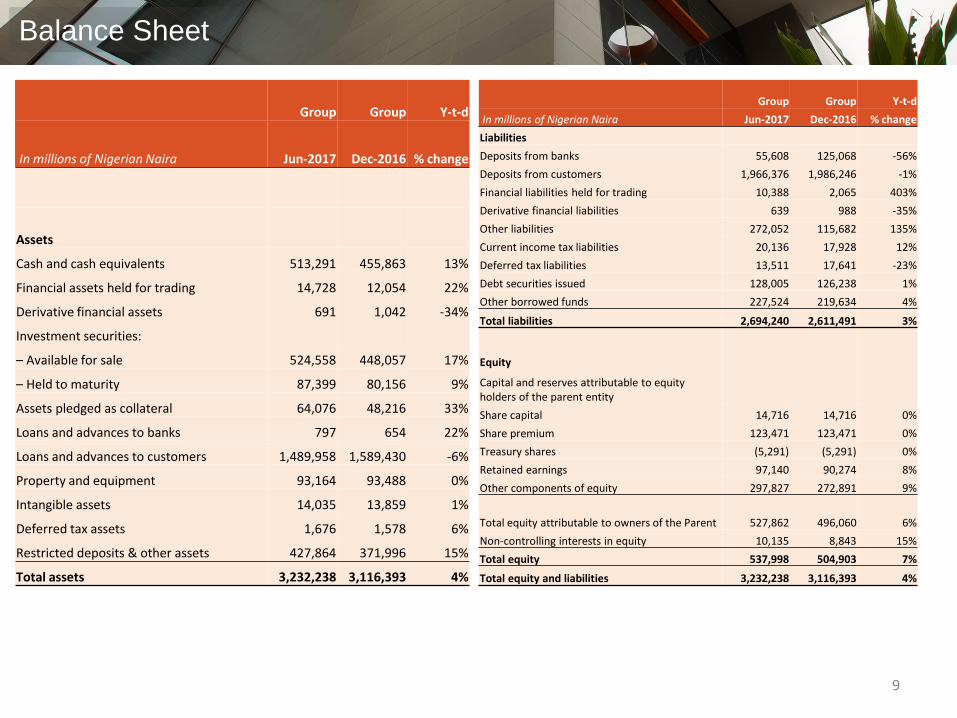
Balance Sheet
Group Group Y-t-d
In millions of Nigerian Naira Jun-2017 Dec-2016 % change
Assets
Cash and cash equivalents 513,291 455,863 13%
Financial assets held for trading 14,728 12,054 22%
Derivative financial assets 691 1,042 -34%
Investment securities:
– Available for sale 524,558 448,057 17%
– Held to maturity 87,399 80,156 9%
Assets pledged as collateral 64,076 48,216 33%
Loans and advances to banks 797 654 22%
Loans and advances to customers 1,489,958 1,589,430 -6%
Property and equipment 93,164 93,488 0%
Intangible assets 14,035 13,859 1%
Deferred tax assets 1,676 1,578 6%
Restricted deposits & other assets 427,864 371,996 15%
Total assets 3,232,238 3,116,393 4%
Group Group Y-t-d
In millions of Nigerian Naira Jun-2017 Dec-2016 % change
Liabilities
Deposits from banks 55,608 125,068 -56%
Deposits from customers 1,966,376 1,986,246 -1%
Financial liabilities held for trading 10,388 2,065 403%
Derivative financial liabilities 639 988 -35%
Other liabilities 272,052 115,682 135%
Current income tax liabilities 20,136 17,928 12%
Deferred tax liabilities 13,511 17,641 -23%
Debt securities issued 128,005 126,238 1%
Other borrowed funds 227,524 219,634 4%
Total liabilities 2,694,240 2,611,491 3%
Equity
Capital and reserves attributable to equity holders of the parent entity
Share capital 14,716 14,716 0%
Share premium 123,471 123,471 0%
Treasury shares (5,291) (5,291) 0%
Retained earnings 97,140 90,274 8%
Other components of equity 297,827 272,891 9%
Total equity attributable to owners of the Parent 527,862 496,060 6%
Non-controlling interests in equity 10,135 8,843 15%
Total equity 537,998 504,903 7%
Total equity and liabilities 3,232,238 3,116,393 4%
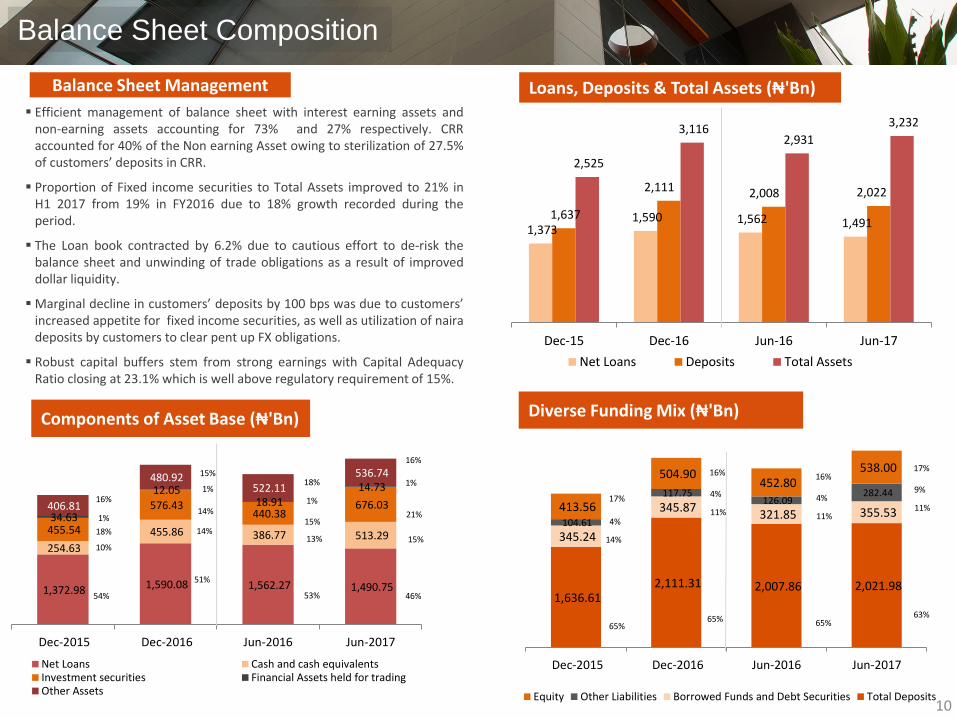
Balance Sheet Composition
Loans, Deposits & Total Assets (₦'Bn)
Components of Asset Base (₦'Bn) Diverse Funding Mix (₦'Bn)
1,373 1,590 1,562 1,491
1,637
2,111 2,008 2,022
2,525
3,116 2,931
3,232
Dec-15 Dec-16 Jun-16 Jun-17
Net Loans Deposits Total Assets
1,372.98 1,590.08 1,562.27 1,490.75
254.63
455.86 386.77 513.29 455.54
576.43 440.38
676.03 34.63
12.05 18.91
14.73
406.81
480.92 522.11
536.74
Dec-2015 Dec-2016 Jun-2016 Jun-2017
Net Loans Cash and cash equivalentsInvestment securities Financial Assets held for tradingOther Assets
1,636.61 2,111.31 2,007.86 2,021.98
345.24
345.87 321.85 355.53
104.61
117.75 126.09
282.44
413.56
504.90 452.80
538.00
Dec-2015 Dec-2016 Jun-2016 Jun-2017
Equity Other Liabilities Borrowed Funds and Debt Securities Total Deposits
Efficient management of balance sheet with interest earning assets andnon-earning assets accounting for 73% and 27% respectively. CRRaccounted for 40% of the Non earning Asset owing to sterilization of 27.5%of customers’ deposits in CRR.
Proportion of Fixed income securities to Total Assets improved to 21% inH1 2017 from 19% in FY2016 due to 18% growth recorded during theperiod.
The Loan book contracted by 6.2% due to cautious effort to de-risk thebalance sheet and unwinding of trade obligations as a result of improveddollar liquidity.
Marginal decline in customers’ deposits by 100 bps was due to customers’increased appetite for fixed income securities, as well as utilization of nairadeposits by customers to clear pent up FX obligations.
Robust capital buffers stem from strong earnings with Capital AdequacyRatio closing at 23.1% which is well above regulatory requirement of 15%.
Balance Sheet Management
16%
1%
18%
10%
54%
15%
14%
14%
51%
1%18%
15%
13%
53%
1%
1%
21%
15%
46%
16%
10
4%
14%
65%
17%4%
11%
65%
16%
4%
11%
65%
16%
9%
11%
63%
17%
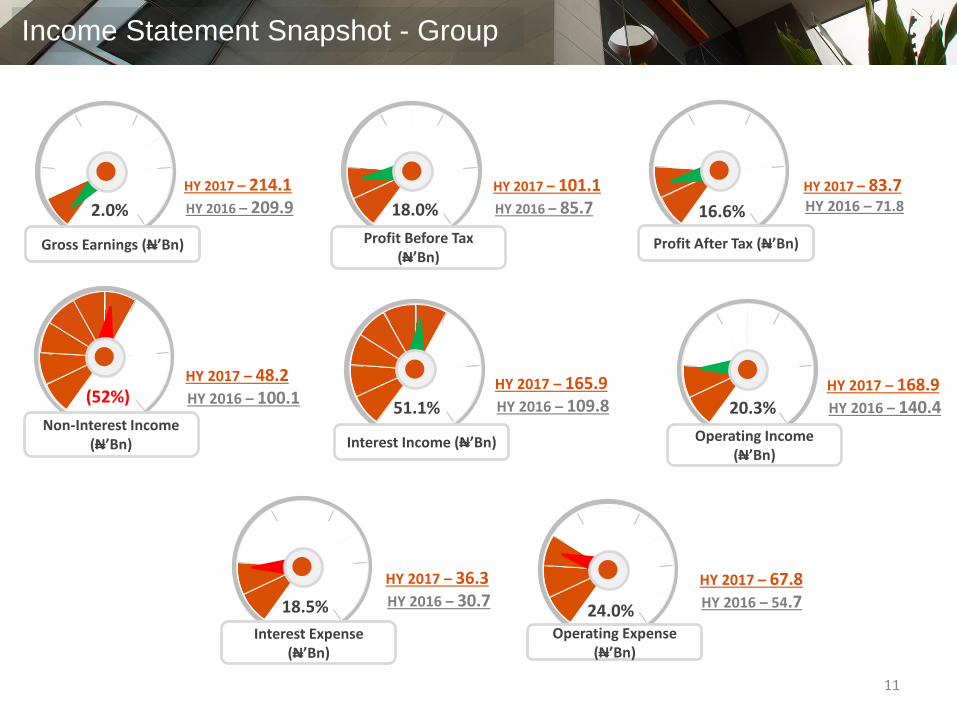
Income Statement Snapshot - Group
2.0%
Gross Earnings (N’Bn)
18.0%
Profit Before Tax (N’Bn)
16.6%
Profit After Tax (N’Bn)
20.3%
Operating Income (N’Bn)
51.1%
Interest Income (N’Bn)
18.5%
Interest Expense (N’Bn)
(52%)
Non-Interest Income (N’Bn)
24.0%Operating Expense
(N’Bn)
HY 2017 – 214.1HY 2016 – 209.9
HY 2017 – 101.1HY 2016 – 85.7
HY 2017 – 83.7HY 2016 – 71.8
HY 2017 – 36.3HY 2016 – 30.7
HY 2017 – 67.8HY 2016 – 54.7
HY 2017 – 165.9HY 2016 – 109.8
HY 2017 – 168.9HY 2016 – 140.4
HY 2017 – 48.2HY 2016 – 100.1
11
12
Income Statement - Group
Group Group Y-t-d
In millions of Nigerian Naira Jun-2017 Jun-2016 % change
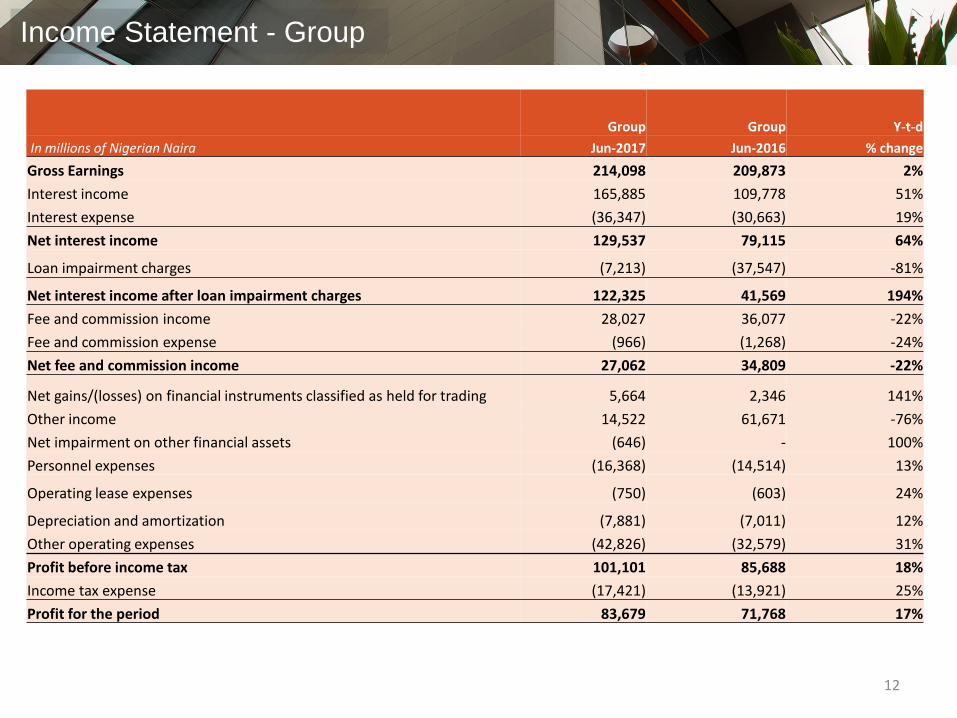
Gross Earnings 214,098 209,873 2%
Interest income 165,885 109,778 51%
Interest expense (36,347) (30,663) 19%
Net interest income 129,537 79,115 64%
Loan impairment charges (7,213) (37,547) -81%
Net interest income after loan impairment charges 122,325 41,569 194%
Fee and commission income 28,027 36,077 -22%
Fee and commission expense (966) (1,268) -24%
Net fee and commission income 27,062 34,809 -22%
Net gains/(losses) on financial instruments classified as held for trading 5,664 2,346 141%
Other income 14,522 61,671 -76%
Net impairment on other financial assets (646) - 100%
Personnel expenses (16,368) (14,514) 13%
Operating lease expenses (750) (603) 24%
Depreciation and amortization (7,881) (7,011) 12%
Other operating expenses (42,826) (32,579) 31%
Profit before income tax 101,101 85,688 18%
Income tax expense (17,421) (13,921) 25%
Profit for the period 83,679 71,768 17%
13
PBT Evolution
Return on Assets and Equity
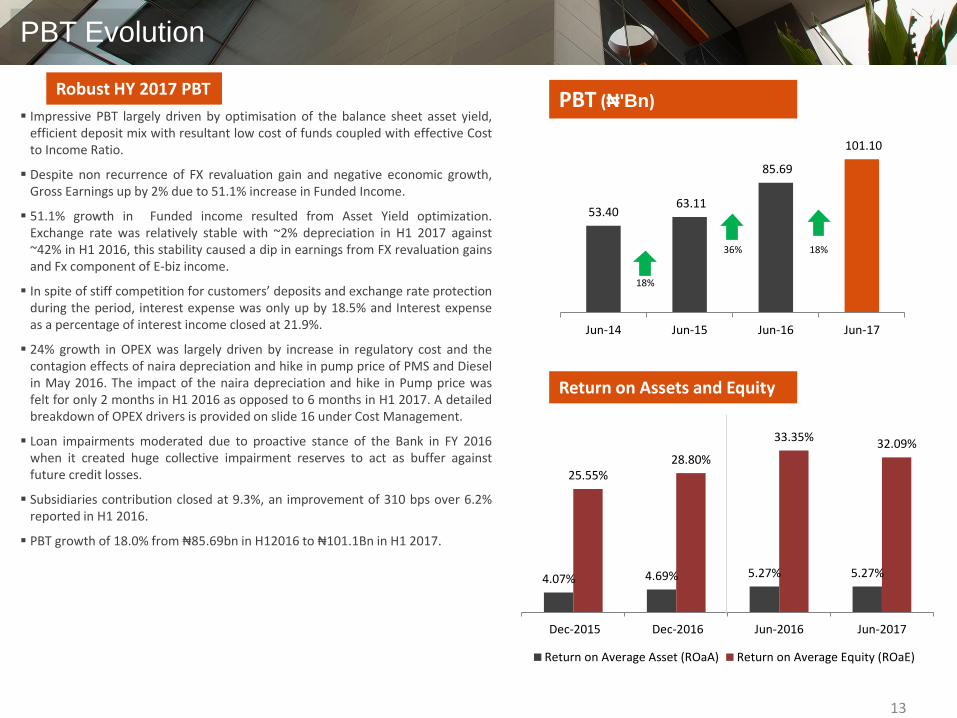
PBT (₦'Bn)
53.4063.11
85.69
101.10
Jun-14 Jun-15 Jun-16 Jun-17
4.07% 4.69% 5.27% 5.27%
25.55%28.80%
33.35%32.09%
Dec-2015 Dec-2016 Jun-2016 Jun-2017
Return on Average Asset (ROaA) Return on Average Equity (ROaE)
Impressive PBT largely driven by optimisation of the balance sheet asset yield,efficient deposit mix with resultant low cost of funds coupled with effective Costto Income Ratio.
Despite non recurrence of FX revaluation gain and negative economic growth,Gross Earnings up by 2% due to 51.1% increase in Funded Income.
51.1% growth in Funded income resulted from Asset Yield optimization.Exchange rate was relatively stable with ~2% depreciation in H1 2017 against~42% in H1 2016, this stability caused a dip in earnings from FX revaluation gainsand Fx component of E-biz income.
In spite of stiff competition for customers’ deposits and exchange rate protectionduring the period, interest expense was only up by 18.5% and Interest expenseas a percentage of interest income closed at 21.9%.
24% growth in OPEX was largely driven by increase in regulatory cost and thecontagion effects of naira depreciation and hike in pump price of PMS and Dieselin May 2016. The impact of the naira depreciation and hike in Pump price wasfelt for only 2 months in H1 2016 as opposed to 6 months in H1 2017. A detailedbreakdown of OPEX drivers is provided on slide 16 under Cost Management.
Loan impairments moderated due to proactive stance of the Bank in FY 2016when it created huge collective impairment reserves to act as buffer againstfuture credit losses.
Subsidiaries contribution closed at 9.3%, an improvement of 310 bps over 6.2%reported in H1 2016.
PBT growth of 18.0% from ₦85.69bn in H12016 to ₦101.1Bn in H1 2017.
Robust HY 2017 PBT
18%
36% 18%
14
Revenue Generation
Interest Income (₦’Bn)
Revenue Mix (₦'Bn)
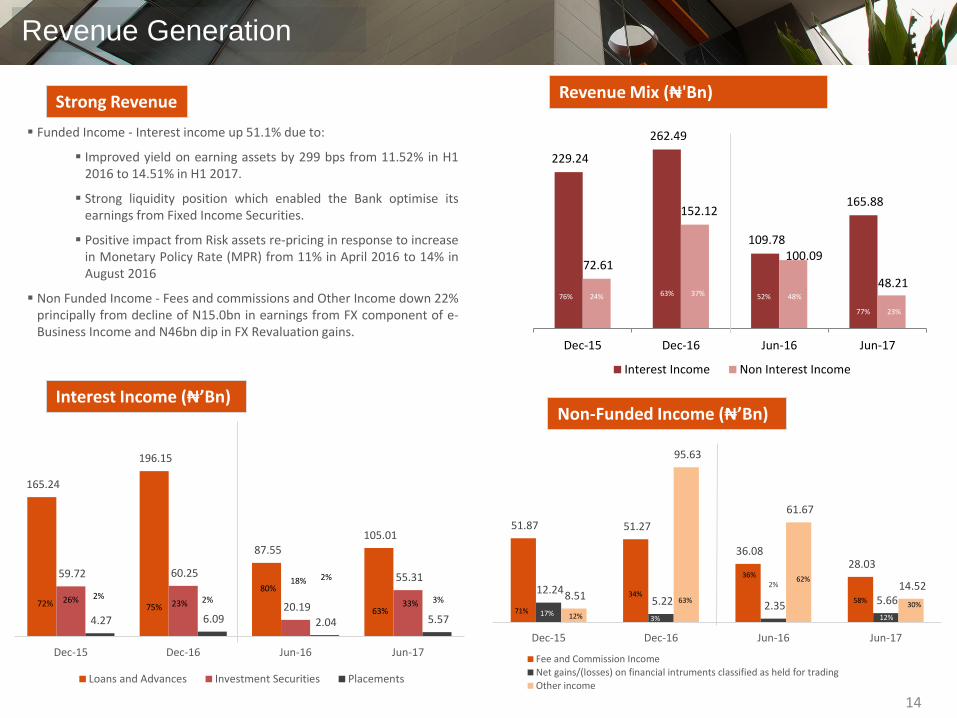
229.24
262.49
109.78
165.88
72.61
152.12
100.09
48.21
Dec-15 Dec-16 Jun-16 Jun-17
Interest Income Non Interest Income
165.24
196.15
87.55 105.01
59.72 60.25
20.19
55.31
4.27 6.09 2.04 5.57
Dec-15 Dec-16 Jun-16 Jun-17
Loans and Advances Investment Securities Placements
72% 26% 2%75% 23% 2%
80%18% 2%
63%33% 3%
51.87 51.27
36.08 28.03
12.24 5.22 2.35 5.66 8.51
95.63
61.67
14.52
Dec-15 Dec-16 Jun-16 Jun-17
Fee and Commission IncomeNet gains/(losses) on financial intruments classified as held for tradingOther income
Funded Income - Interest income up 51.1% due to:
Improved yield on earning assets by 299 bps from 11.52% in H12016 to 14.51% in H1 2017.
Strong liquidity position which enabled the Bank optimise itsearnings from Fixed Income Securities.
Positive impact from Risk assets re-pricing in response to increasein Monetary Policy Rate (MPR) from 11% in April 2016 to 14% inAugust 2016
Non Funded Income - Fees and commissions and Other Income down 22%principally from decline of N15.0bn in earnings from FX component of e-Business Income and N46bn dip in FX Revaluation gains.
Strong Revenue
76% 24% 63% 37% 52% 48%
77% 23%
71% 17% 12%
34%
3%
63%
36%2%
62%
58%
12%
30%
Non-Funded Income (₦’Bn)
Effective Cost Management
Overview of Expenses (₦'Bn)
Cost to Income (CIR)
Operating Expenses (OPEX) (₦'Bn)
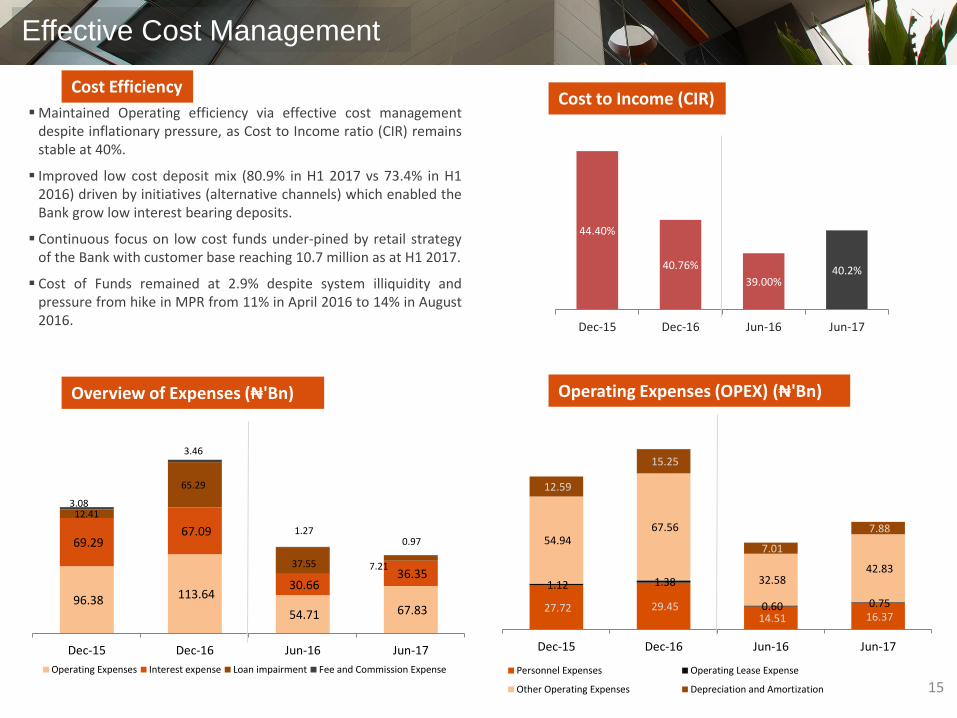
27.72 29.45 14.51 16.37
1.12 1.38
0.60 0.75
54.94 67.56
32.58 42.83
12.59
15.25
7.01
7.88
Dec-15 Dec-16 Jun-16 Jun-17
Personnel Expenses Operating Lease Expense
Other Operating Expenses Depreciation and Amortization
44.40%
40.76%
39.00%40.2%
Dec-15 Dec-16 Jun-16 Jun-17
96.38 113.64
54.71 67.83
69.29 67.09
30.66 36.35
12.41
65.29
37.55 7.21
3.08
3.46
1.27 0.97
Dec-15 Dec-16 Jun-16 Jun-17
Operating Expenses Interest expense Loan impairment Fee and Commission Expense
Maintained Operating efficiency via effective cost managementdespite inflationary pressure, as Cost to Income ratio (CIR) remainsstable at 40%.
Improved low cost deposit mix (80.9% in H1 2017 vs 73.4% in H12016) driven by initiatives (alternative channels) which enabled theBank grow low interest bearing deposits.
Continuous focus on low cost funds under-pined by retail strategyof the Bank with customer base reaching 10.7 million as at H1 2017.
Cost of Funds remained at 2.9% despite system illiquidity andpressure from hike in MPR from 11% in April 2016 to 14% in August2016.
Cost Efficiency
15
16
Effective Cost Management – Depreciation and Other Operating Expenses
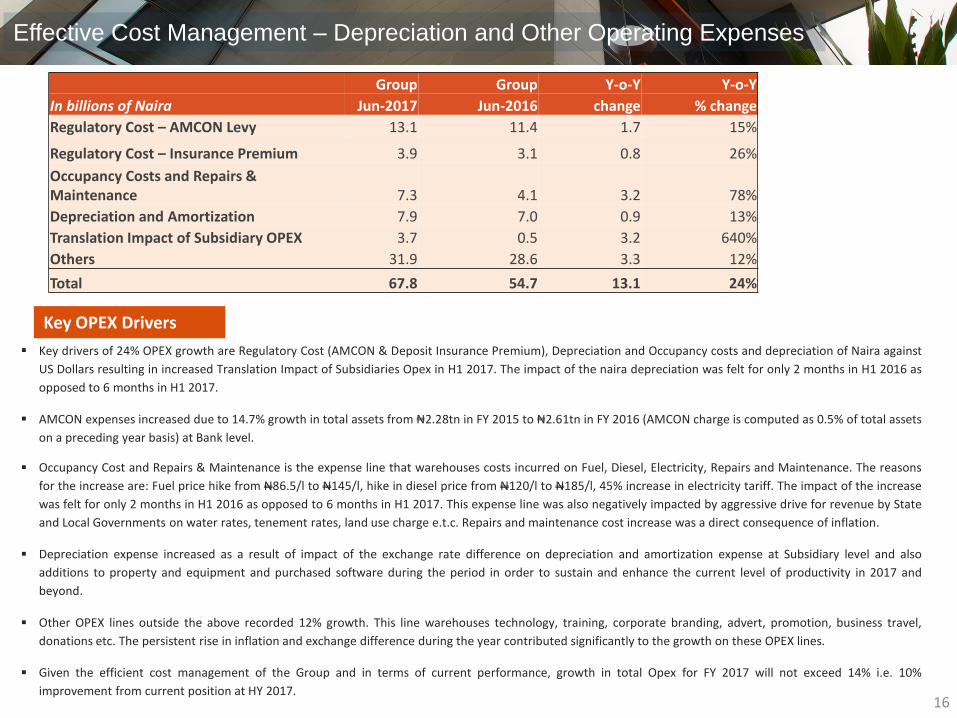
Key drivers of 24% OPEX growth are Regulatory Cost (AMCON & Deposit Insurance Premium), Depreciation and Occupancy costs and depreciation of Naira against
US Dollars resulting in increased Translation Impact of Subsidiaries Opex in H1 2017. The impact of the naira depreciation was felt for only 2 months in H1 2016 as
opposed to 6 months in H1 2017.
AMCON expenses increased due to 14.7% growth in total assets from ₦2.28tn in FY 2015 to ₦2.61tn in FY 2016 (AMCON charge is computed as 0.5% of total assets
on a preceding year basis) at Bank level.
Occupancy Cost and Repairs & Maintenance is the expense line that warehouses costs incurred on Fuel, Diesel, Electricity, Repairs and Maintenance. The reasons
for the increase are: Fuel price hike from N86.5/l to N145/l, hike in diesel price from N120/l to N185/l, 45% increase in electricity tariff. The impact of the increase
was felt for only 2 months in H1 2016 as opposed to 6 months in H1 2017. This expense line was also negatively impacted by aggressive drive for revenue by State
and Local Governments on water rates, tenement rates, land use charge e.t.c. Repairs and maintenance cost increase was a direct consequence of inflation.
Depreciation expense increased as a result of impact of the exchange rate difference on depreciation and amortization expense at Subsidiary level and also
additions to property and equipment and purchased software during the period in order to sustain and enhance the current level of productivity in 2017 and
beyond.
Other OPEX lines outside the above recorded 12% growth. This line warehouses technology, training, corporate branding, advert, promotion, business travel,
donations etc. The persistent rise in inflation and exchange difference during the year contributed significantly to the growth on these OPEX lines.
Given the efficient cost management of the Group and in terms of current performance, growth in total Opex for FY 2017 will not exceed 14% i.e. 10%
improvement from current position at HY 2017.
Group Group Y-o-Y Y-o-Y
In billions of Naira Jun-2017 Jun-2016 change % change
Regulatory Cost – AMCON Levy 13.1 11.4 1.7 15%
Regulatory Cost – Insurance Premium 3.9 3.1 0.8 26%
Occupancy Costs and Repairs & Maintenance 7.3 4.1 3.2 78%
Depreciation and Amortization 7.9 7.0 0.9 13%
Translation Impact of Subsidiary OPEX 3.7 0.5 3.2 640%
Others 31.9 28.6 3.3 12%
Total 67.8 54.7 13.1 24%
Key OPEX Drivers
16
17
Margin Metrics
Net Interest Margin
Cost of Funds
Yields on Interest earning Assets
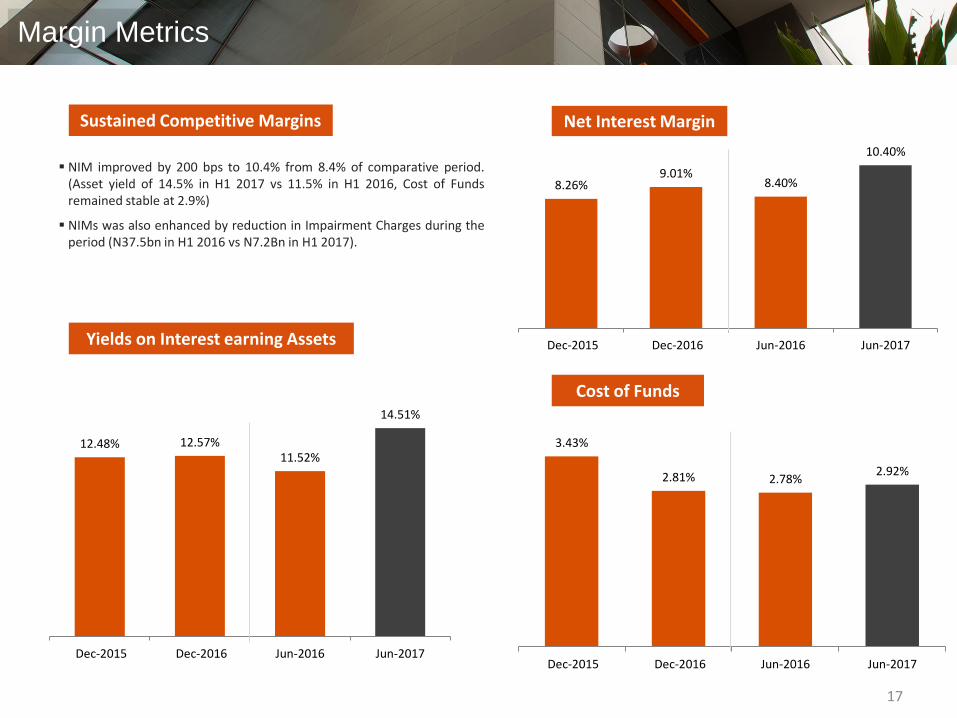
8.26%9.01%
8.40%
10.40%
Dec-2015 Dec-2016 Jun-2016 Jun-2017
3.43%
2.81% 2.78%2.92%
Dec-2015 Dec-2016 Jun-2016 Jun-2017
12.48% 12.57%11.52%
14.51%
Dec-2015 Dec-2016 Jun-2016 Jun-2017
NIM improved by 200 bps to 10.4% from 8.4% of comparative period.(Asset yield of 14.5% in H1 2017 vs 11.5% in H1 2016, Cost of Fundsremained stable at 2.9%)
NIMs was also enhanced by reduction in Impairment Charges during theperiod (N37.5bn in H1 2016 vs N7.2Bn in H1 2017).
Sustained Competitive Margins
18
Risk Asset Mix
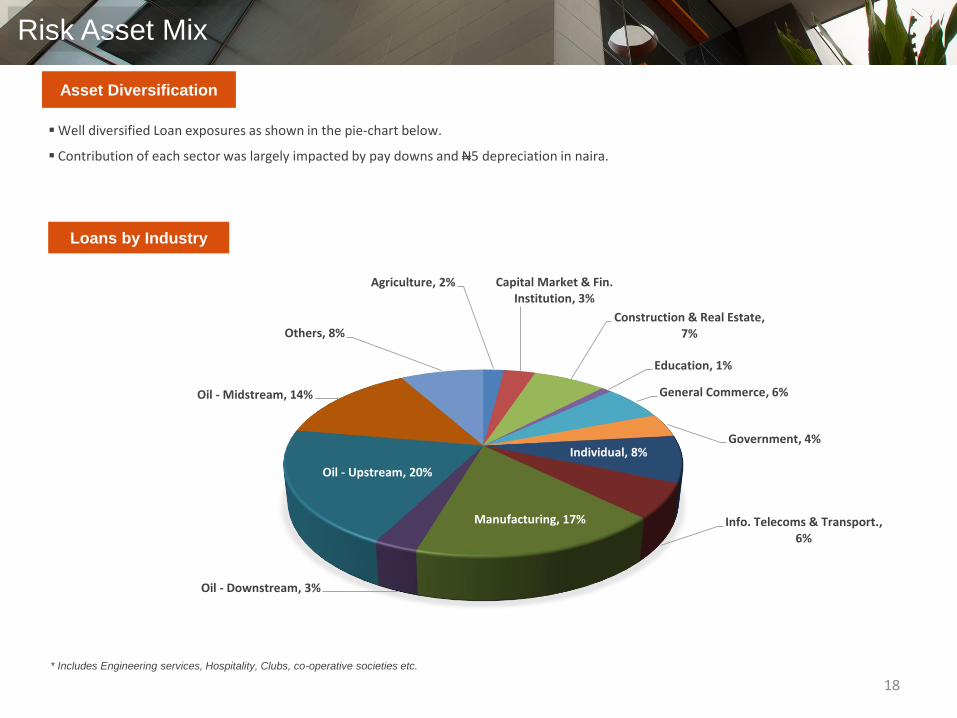
Loans by Industry
* Includes Engineering services, Hospitality, Clubs, co-operative societies etc.
Asset Diversification
Agriculture, 2% Capital Market & Fin. Institution, 3%
Construction & Real Estate, 7%
Education, 1%
General Commerce, 6%
Government, 4%Individual, 8%
Info. Telecoms & Transport., 6%
Manufacturing, 17%
Oil - Downstream, 3%
Oil - Upstream, 20%
Oil - Midstream, 14%
Others, 8%
Well diversified Loan exposures as shown in the pie-chart below.
Contribution of each sector was largely impacted by pay downs and N5 depreciation in naira.
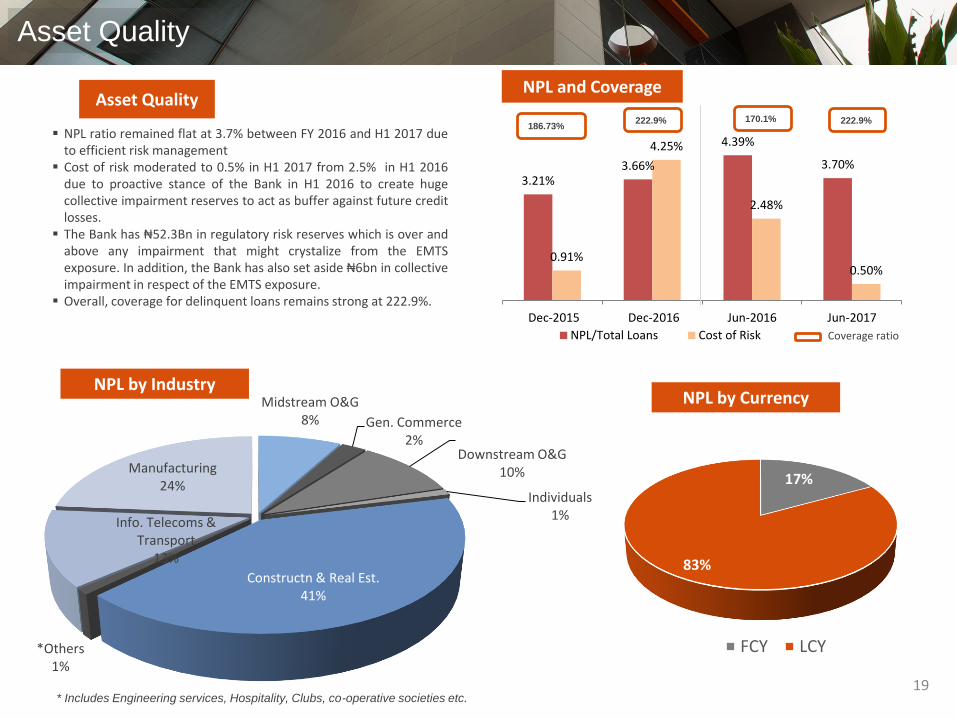
3.21%3.66%
4.39%
3.70%
0.91%
4.25%
2.48%
0.50%
Dec-2015 Dec-2016 Jun-2016 Jun-2017
NPL/Total Loans Cost of Risk
Midstream O&G8% Gen. Commerce
2%Downstream O&G
10%
Individuals1%
Constructn & Real Est.41%
*Others1%
Info. Telecoms & Transport
13%
Manufacturing24%
19
170.1%186.73%
222.9%222.9%
Coverage ratio
NPL and Coverage
Asset Quality
NPL by Industry
* Includes Engineering services, Hospitality, Clubs, co-operative societies etc.
NPL ratio remained flat at 3.7% between FY 2016 and H1 2017 dueto efficient risk management
Cost of risk moderated to 0.5% in H1 2017 from 2.5% in H1 2016due to proactive stance of the Bank in H1 2016 to create hugecollective impairment reserves to act as buffer against future creditlosses.
The Bank has ₦52.3Bn in regulatory risk reserves which is over andabove any impairment that might crystalize from the EMTSexposure. In addition, the Bank has also set aside ₦6bn in collectiveimpairment in respect of the EMTS exposure.
Overall, coverage for delinquent loans remains strong at 222.9%.
Asset Quality
17%
83%
FCY LCY
NPL by Currency
20
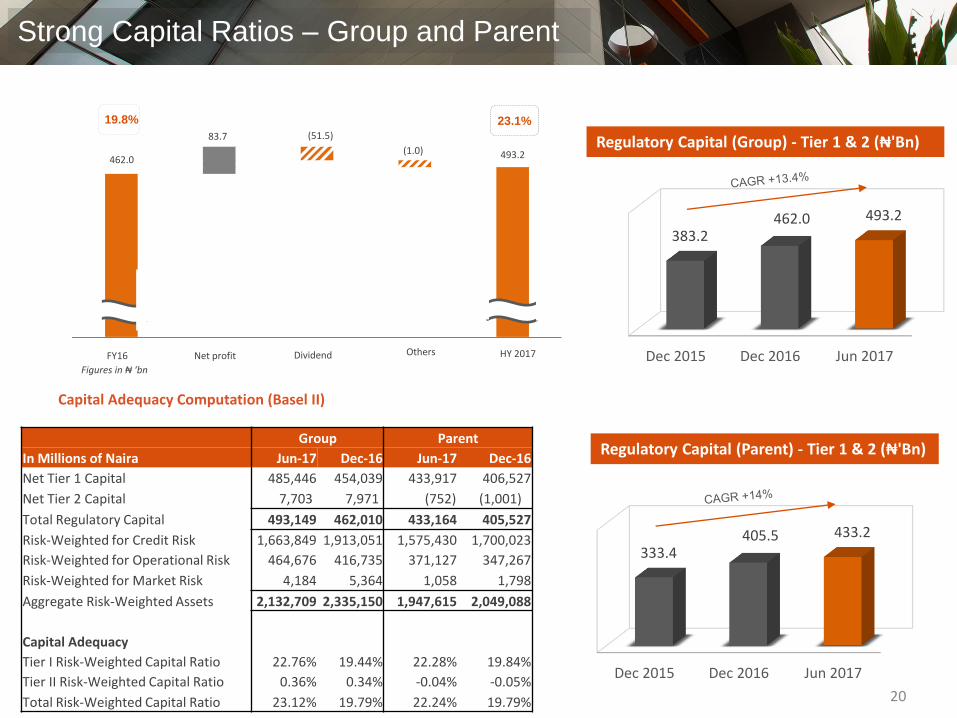
Dec 2015 Dec 2016 Jun 2017
383.2462.0 493.2
Regulatory Capital (Group) - Tier 1 & 2 (₦'Bn)
FY16 Net profit Dividend Others HY 2017
462.0
(51.5)
(1.0)
Figures in ₦ ‘bn
493.2
23.1%19.8%
83.7
Strong Capital Ratios – Group and Parent
Capital Adequacy Computation (Basel II)
Group Parent
In Millions of Naira Jun-17 Dec-16 Jun-17 Dec-16
Net Tier 1 Capital 485,446 454,039 433,917 406,527
Net Tier 2 Capital 7,703 7,971 (752) (1,001)
Total Regulatory Capital 493,149 462,010 433,164 405,527
Risk-Weighted for Credit Risk 1,663,849 1,913,051 1,575,430 1,700,023
Risk-Weighted for Operational Risk 464,676 416,735 371,127 347,267
Risk-Weighted for Market Risk 4,184 5,364 1,058 1,798
Aggregate Risk-Weighted Assets 2,132,709 2,335,150 1,947,615 2,049,088
Capital Adequacy
Tier I Risk-Weighted Capital Ratio 22.76% 19.44% 22.28% 19.84%
Tier II Risk-Weighted Capital Ratio 0.36% 0.34% -0.04% -0.05%
Total Risk-Weighted Capital Ratio 23.12% 19.79% 22.24% 19.79%
Dec 2015 Dec 2016 Jun 2017
333.4405.5 433.2
Regulatory Capital (Parent) - Tier 1 & 2 (₦'Bn)
21
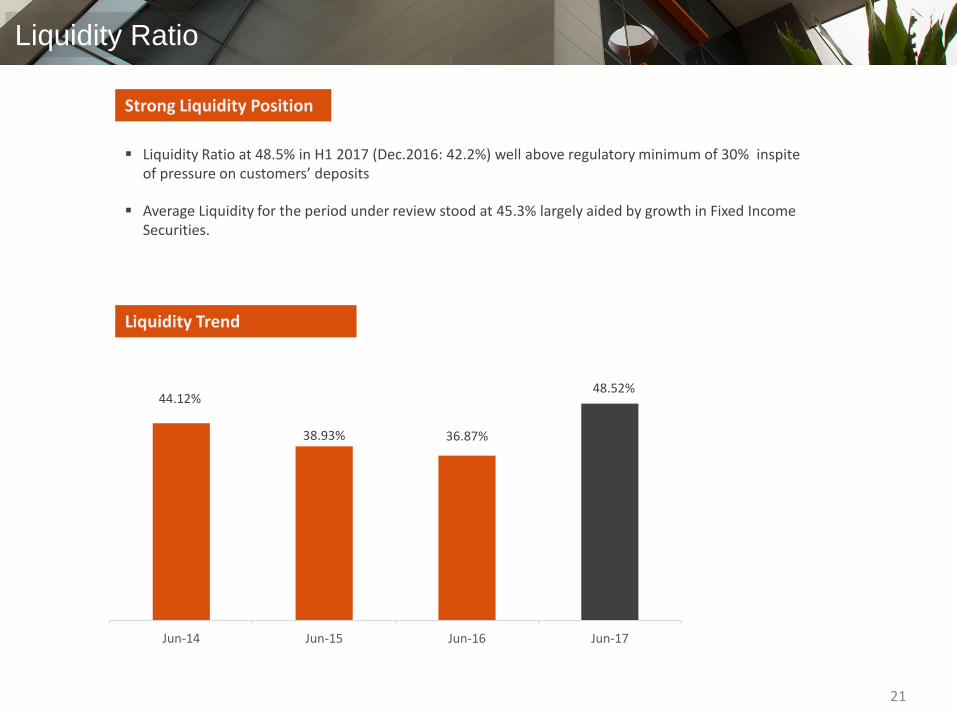
Liquidity Ratio
44.12%
38.93% 36.87%
48.52%
Jun-14 Jun-15 Jun-16 Jun-17
Liquidity Ratio at 48.5% in H1 2017 (Dec.2016: 42.2%) well above regulatory minimum of 30% inspite of pressure on customers’ deposits
Average Liquidity for the period under review stood at 45.3% largely aided by growth in Fixed Income Securities.
Strong Liquidity Position
Liquidity Trend

Business Segments and
Subsidiary Review
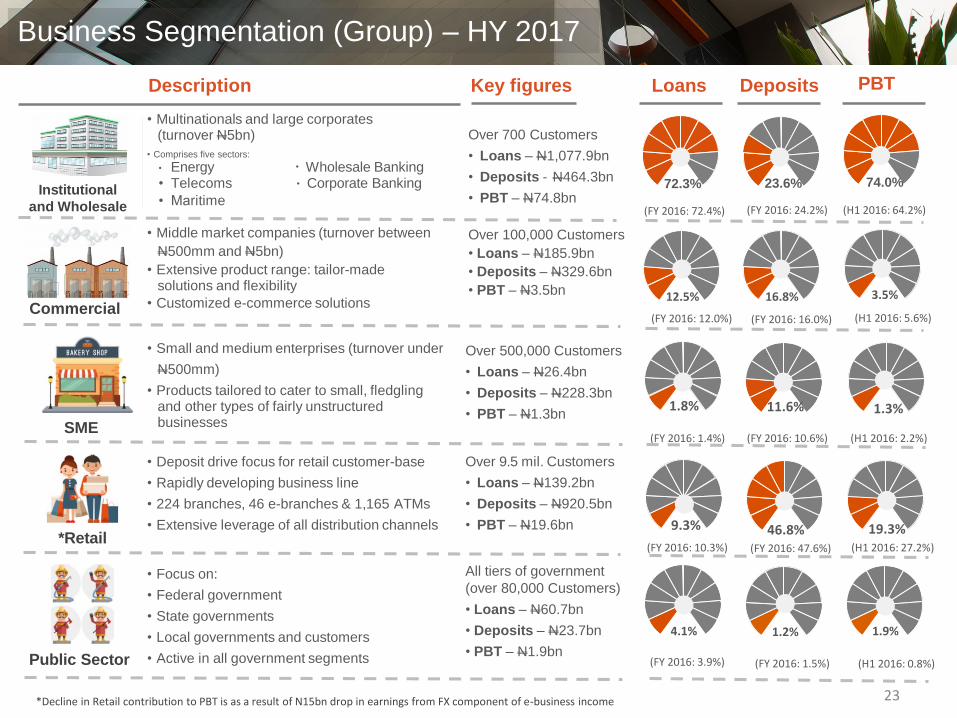
Description Key figures Loans Deposits PBT
(FY 2016: 72.4%) (FY 2016: 24.2%) (H1 2016: 64.2%)
(FY 2016: 12.0%) (FY 2016: 16.0%) (H1 2016: 5.6%)
(FY 2016: 1.4%) (FY 2016: 10.6%) (H1 2016: 2.2%)
(FY 2016: 10.3%) (FY 2016: 47.6%) (H1 2016: 27.2%)
(FY 2016: 3.9%) (FY 2016: 1.5%) (H1 2016: 0.8%)
Public
Sector
• Focus on:
• Federal government
• State governments
• Local governments and customers
• Active in all government segments
Retail
SME
• Small and medium enterprises (turnover under
N500mm)
• Products tailored to cater to small, fledglingand other types of fairly unstructuredbusinesses
• Middle market companies (turnover between
N500mm and N5bn)
• Extensive product range: tailor-madesolutions and flexibility
• Customized e-commerce solutionsCommercial
All tiers of government
(over 80,000 Customers)
• Loans – N60.7bn
• Deposits – N23.7bn
• PBT – N1.9bn
Over 9.5 mil. Customers
• Loans – N139.2bn
• Deposits – N920.5bn
• PBT – N19.6bn
Over 500,000 Customers
• Loans – N26.4bn
• Deposits – N228.3bn
• PBT – N1.3bn
Over 100,000 Customers
• Loans – N185.9bn
• Deposits – N329.6bn
• PBT – N3.5bn
Over 700 Customers
• Loans – N1,077.9bn
• Deposits - N464.3bn
• PBT – N74.8bn
• Multinationals and large corporates(turnover N5bn)
• Comprises five sectors:
• Energy • Wholesale Banking• Telecoms • Corporate Banking
• Maritime
• Deposit drive focus for retail customer-base
• Rapidly developing business line
• 224 branches, 46 e-branches & 1,165 ATMs
• Extensive leverage of all distribution channels
23
Institutional
and Wholesale
*Retail
Public Sector
72.3% 23.6% 74.0%
12.5% 16.8% 3.5%
1.8% 11.6% 1.3%
9.3% 46.8% 19.3%
4.1% 1.2% 1.9%
Business Segmentation (Group) – HY 2017
*Decline in Retail contribution to PBT is as a result of N15bn drop in earnings from FX component of e-business income
24
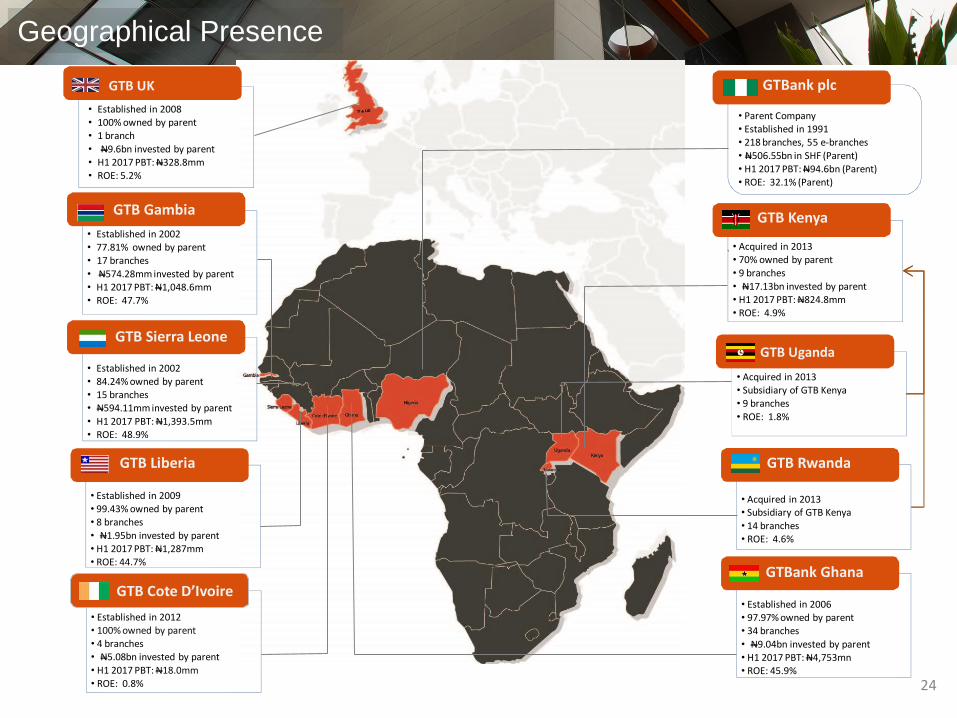
GTBank plc
• Parent Company• Established in 1991• 218 branches, 55 e-branches
• N506.55bn in SHF (Parent)• H1 2017 PBT: N94.6bn (Parent)• ROE: 32.1% (Parent)
• Acquired in 2013• 70% owned by parent• 9 branches
• N17.13bn invested by parent• H1 2017 PBT: N824.8mm• ROE: 4.9%
GTB Uganda
• Acquired in 2013• Subsidiary of GTB Kenya• 9 branches
• ROE: 1.8%
• Acquired in 2013• Subsidiary of GTB Kenya
• 14 branches• ROE: 4.6%
• Established in 2006• 97.97% owned by parent• 34 branches
• N9.04bn invested by parent• H1 2017 PBT: N4,753mn• ROE: 45.9%
GTB UK
• Established in 2008• 100% owned by parent• 1 branch
• N9.6bn invested by parent• H1 2017 PBT: N328.8mm• ROE: 5.2%
• Established in 2002• 77.81% owned by parent• 17 branches
• N574.28mm invested by parent• H1 2017 PBT: N1,048.6mm• ROE: 47.7%
• Established in 2002• 84.24% owned by parent• 15 branches• N594.11mm invested by parent
• H1 2017 PBT: N1,393.5mm• ROE: 48.9%
• Established in 2009• 99.43% owned by parent• 8 branches
• N1.95bn invested by parent• H1 2017 PBT: N1,287mm• ROE: 44.7%
• Established in 2012• 100% owned by parent• 4 branches• N5.08bn invested by parent
• H1 2017 PBT: N18.0mm• ROE: 0.8%
GTB Gambia
GTB Sierra Leone
GTB Liberia
GTB Cote D’Ivoire
GTB Kenya
GTB Rwanda
GTBank Ghana
Geographical Presence
25
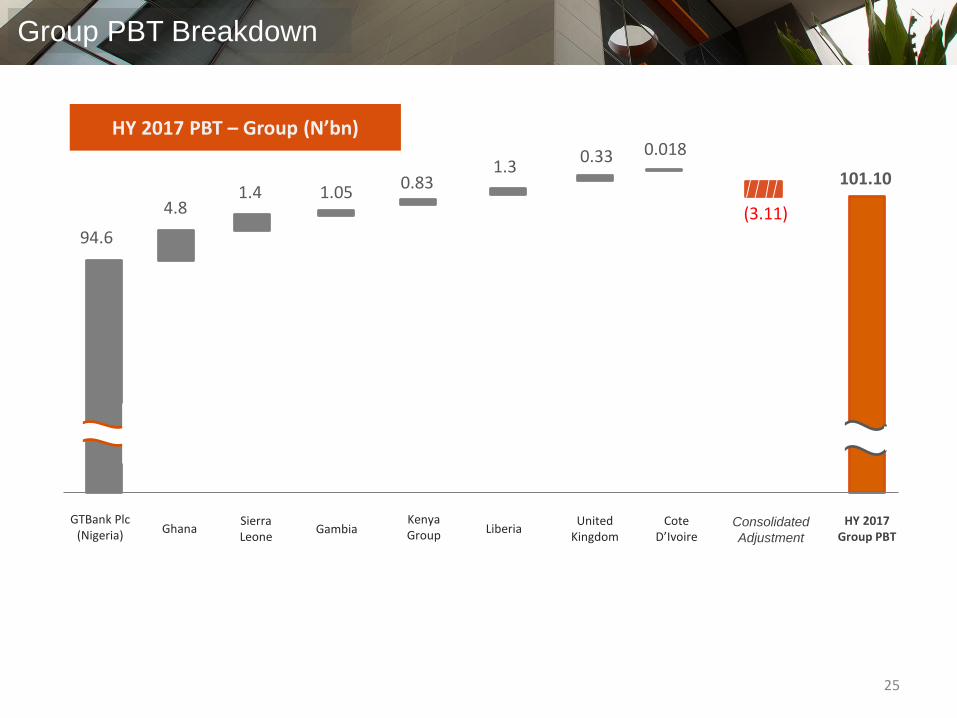
94.6
4.81.4
0.831.05
1.30.33 0.018
GTBank Plc (Nigeria) Ghana
Sierra Leone
Kenya GroupGambia Liberia
United Kingdom
Cote D’Ivoire
HY 2017 Group PBT
101.10
HY 2017 PBT – Group (N’bn)
Group PBT Breakdown
Consolidated
Adjustment
(3.11)
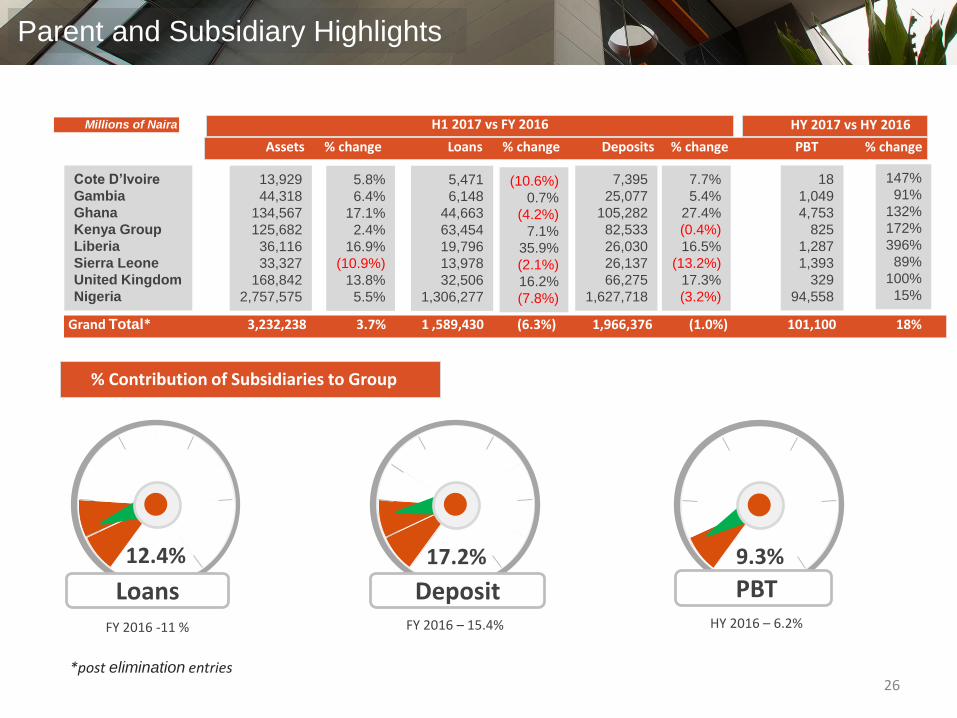
Grand Total* 3,232,238 3.7% 1 ,589,430 (6.3%) 1,966,376 (1.0%) 101,100 18%
Assets % change Loans % change Deposits % change PBT % change
*post elimination entries
Millions of Naira
26
H1 2017 vs FY 2016 HY 2017 vs HY 2016
Cote D’Ivoire
Gambia
Ghana
Kenya Group
Liberia
Sierra Leone
United Kingdom
Nigeria
13,929
44,318
134,567
125,682
36,116
33,327
168,842
2,757,575
5.8%
6.4%
17.1%
2.4%
16.9%
(10.9%)
13.8%
5.5%
5,471
6,148
44,663
63,454
19,796
13,978
32,506
1,306,277
(10.6%)
0.7%
(4.2%)
7.1%
35.9%
(2.1%)
16.2%
(7.8%)
7,395
25,077
105,282
82,533
26,030
26,137
66,275
1,627,718
7.7%
5.4%
27.4%
(0.4%)
16.5%
(13.2%)
17.3%
(3.2%)
18
1,049
4,753
825
1,287
1,393
329
94,558
147%
91%
132%
172%
396%
89%
100%
15%
Parent and Subsidiary Highlights
9.3%
PBT17.2%
Deposit
12.4%
Loans
% Contribution of Subsidiaries to Group
FY 2016 -11 % FY 2016 – 15.4% HY 2016 – 6.2%
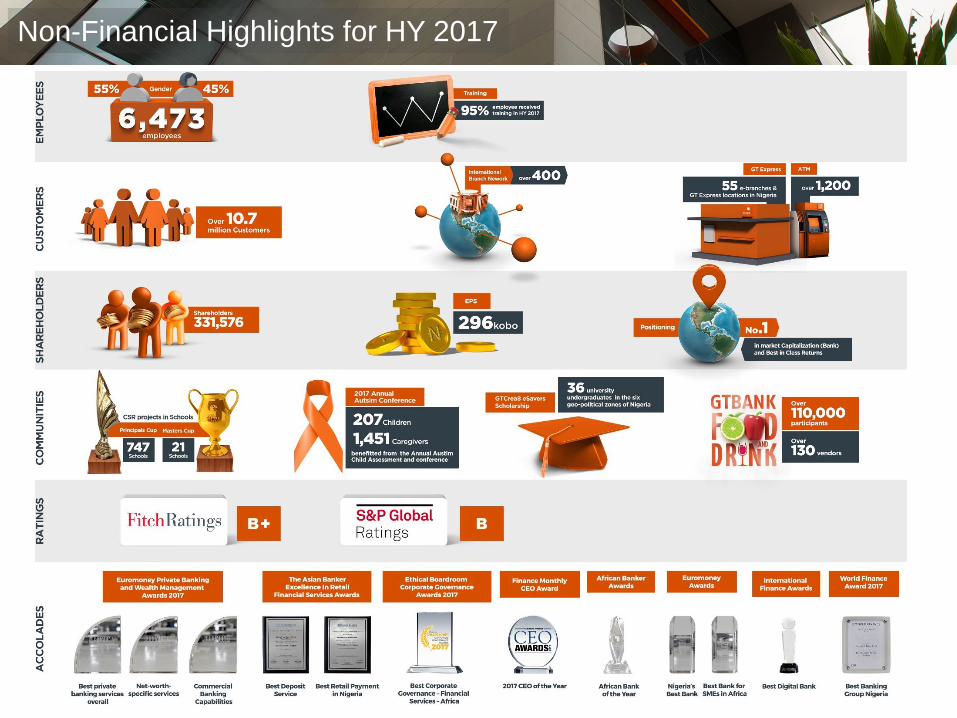
Non-Financial Highlights for HY 2017

Guidance and Plans
for FY 2017
29
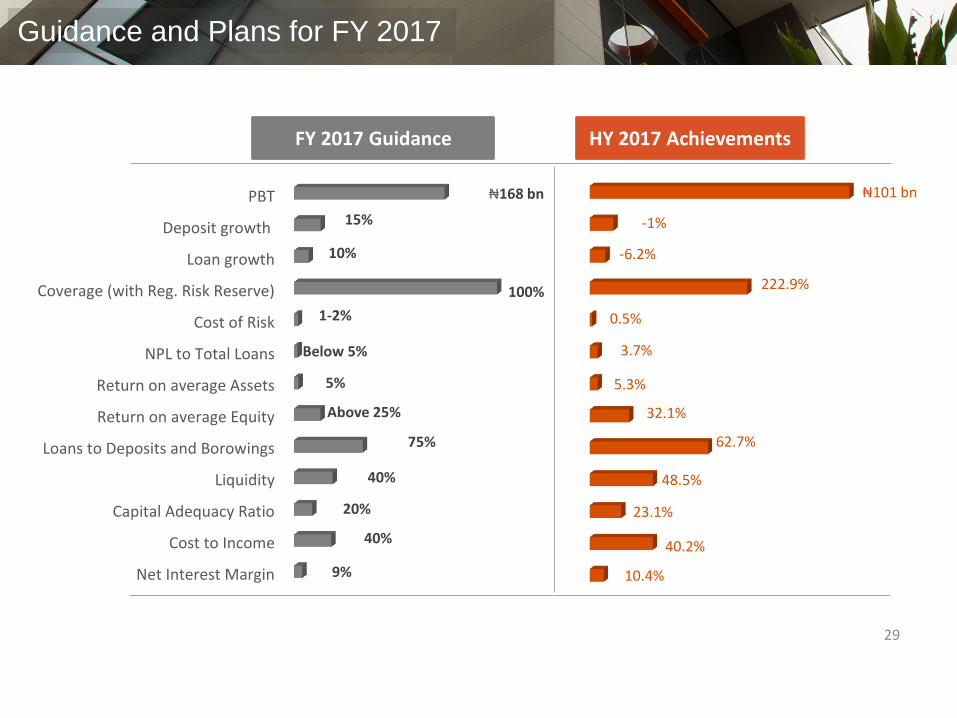
Guidance and Plans for FY 2017
Net Interest Margin
Cost to Income
Capital Adequacy Ratio
Liquidity
Loans to Deposits and Borowings
Return on average Equity
Return on average Assets
NPL to Total Loans
Cost of Risk
Coverage (with Reg. Risk Reserve)
Loan growth
Deposit growth
PBT
9%
40%
20%
40%
75%
Above 25%
5%
Below 5%
1-2%
100%
10%
15%
₦168 bn
10.4%
40.2%
23.1%
48.5%
62.7%
32.1%
5.3%
3.7%
0.5%
222.9%
-6.2%
-1%
₦101 bn
FY 2017 Guidance HY 2017 Achievements
This presentation is based on Guaranty Trust Bank Plc (“GTBank” or “Bank”)’s audited financial results for the half year ended June
30, 2017 prepared in accordance with International Financial Reporting Standards (“IFRS”) as issued by the International Accounting
Standards Board (IASB). The Bank has also obtained certain information in this presentation from sources it believes to be reliable.
Although GTBank has taken all reasonable care to ensure that such external information are accurate and correct, the Bank makes no
representation or warranty, express or implied, as to the accuracy, correctness or completeness of such information.
Furthermore, GTBank makes no representation or warranty, express or implied, that its future operating, financial or other results will be
consistent with results implied, directly or indirectly, by information contained herein or with GTBank's past operating, financial or other
results. Any information herein is as of the date of this presentation and may change without notice. GTBank undertakes no obligation to
update the information in this presentation. In addition, some of the information in this presentation may be condensed or incomplete,
and this presentation may not contain all material information in respect of GTBank.
This presentation may also contain “forward-looking statements” that relate to, among other things, GTBank’s plans, objectives, goals,
strategies, future operations and performance. Such forward-looking statements may be characterised using words such as “estimates,”
“aims,” “expects,” “projects,” “believes,” “intends,” “plans,” “may,” “will” and “should” and other similar expressions which are not the
exclusive means of identifying such statements. Such forward-looking statements involve known and unknown risks, uncertainties and
other important factors that could cause GTBank’s operating, financial or other results to be materially different from the operating,
financial or other results expressed or implied by such statements. Furthermore, GTBank makes no representation or warranty, express or
implied, that the operating, financial or other results anticipated by such forward-looking statements will be achieved. Such forward-
looking statements represent, in each case, only one of many possible scenarios and should not be viewed as the most likely or
standard scenario. GTBank undertakes no obligation to update the forward-looking statements in this presentation.
30
Disclaimer
Thank You