Embed Size (px)
Citation preview

CNO Financial Group | 2017 Investor Day | June 5, 2017 1
1Q18Financial and operating results for the period ended March 31, 2018April 26, 2018
Unless otherwise specified, comparisons in this presentation are between 1Q17 and 1Q18.

CNO Financial Group | First Quarter 2018 Earnings | April 26, 2018 2
Forward-Looking Statements
Certain statements made in this presentation should be considered
forward-looking statements as defined in the Private Securities Litigation
Reform Act of 1995. These include statements about future results of
operations and capital plans. We caution investors that these forward-
looking statements are not guarantees of future performance, and actual
results may differ materially. Investors should consider the important
risks and uncertainties that may cause actual results to differ, including
those included in our press release issued on April 25, 2018, our
Quarterly Reports on Form 10-Q, our Annual Report on Form 10-K and
other filings we make with the Securities and Exchange Commission. We
assume no obligation to update this presentation, which speaks as of
today’s date.

CNO Financial Group | First Quarter 2018 Earnings | April 26, 2018 3
Non-GAAP Measures
This presentation contains the following financial measures that differ from the
comparable measures under Generally Accepted Accounting Principles (GAAP):
operating earnings measures; book value, excluding accumulated other comprehensive
income (loss) per share; operating return measures; earnings before net realized
investment gains (losses), fair value changes in embedded derivative liabilities, fair value
changes and amendment related to the agent deferred compensation plan, other non-
operating items, corporate interest expense and taxes; and debt to capital ratios,
excluding accumulated other comprehensive income (loss). Reconciliations between
those non-GAAP measures and the comparable GAAP measures are included in the
Appendix, or on the page such measure is presented.
While management believes these measures are useful to enhance understanding and
comparability of our financial results, these non-GAAP measures should not be
considered substitutes for the most directly comparable GAAP measures.
Additional information concerning non-GAAP measures is included in our periodic filings
with the Securities and Exchange Commission that are available in the “Investors – SEC
Filings” section of CNO’s website, www.CNOinc.com.

CNO Financial Group | First Quarter 2018 Earnings | April 26, 2018 4

CNO Financial Group | First Quarter 2018 Earnings | April 26, 2018 5
Quarter in Review
▪ Strategic initiatives advancing
– Moving several efforts from pilot to scale
▪ Solid earnings results and continued financial strength
– Franchise diversity driving consistent and profitable growth
– Operating EPS up 29%, up 6% excluding the impacts of the change in
tax rate
– Book value per diluted share (excluding AOCI)1 of $21.94, up 2%
sequentially
– Capital position remains strong
▪ Dividends paid of $15 million, no common stock repurchases
1 A non-GAAP measure. See the Appendix for a reconciliation to the
corresponding GAAP measure.

CNO Financial Group | First Quarter 2018 Earnings | April 26, 2018 6
Segment Update
– Total collected premiums down 2%
– Annuity account values increased 4%
– Life and health NAP down 8% and 18%,
respectively
– Continued growth in BD/RIA customer
assets
– Fee revenue1 up 18%
– Total average producing agents down 7%
1 Fee revenue for prior periods revised to reflect the revenue recognition accounting policy
that went into effect January 1, 2018
Results Key Initiatives
– Reshape the agent force through
recruiting and retention
– Improve success rate of new
agents
– Enhanced use of data for better
underwriting results
– Total collected premiums up 2%;
supplemental health up 3%
– Life and health NAP down 3%
– Average producing agent count up 1%
– Total collected premiums up 1%
– NAP down 15%
– Worksite recruiting
– Geographic expansion
– Product diversity
– Enhanced Web/digital sales
capabilities
– Improved sales efficiency

CNO Financial Group | First Quarter 2018 Earnings | April 26, 2018 7
$0.34
$0.44
$0.35
$0.43
Net Operating IncomePer Share¹
Net Operating IncomePer Share ExcludingSignificant Items¹
1 A non-GAAP measure. See the Appendix for a reconciliation to the corresponding GAAP measure.
1Q17 1Q18
Financial ResultsFinancial Highlights
1Q18 Earnings Highlights ($ millions, except per share data)
Net Operating Income1 $59.8 $73.9
Net Operating Income
Excl. Significant Items1 $61.7 $73.0
Weighted Average
Shares Outstanding
(in millions)
175.1 169.7
▪ Net income per diluted share of $0.50
▪ Net operating income per diluted share1 of $0.44
- Excluding significant items, net operating
EPS1 of $0.43
▪ Operating ROE1 of 9.6%
▪ Holding company cash and investments of $378
million
- Reflects lower statutory dividends and
seasonality of HoldCo expenses
▪ Estimated consolidated RBC ratio of 427%
- Reflects impact of asset allocation changes
in the quarter

CNO Financial Group | First Quarter 2018 Earnings | April 26, 2018 8
Segment Results ($ millions)
1 A non-GAAP measure. See the Appendix for a reconciliation to the corresponding GAAP measure.
Segment Adjusted EBIT Excluding Significant Items1
Segment Highlights1Q17 2Q17 3Q17 4Q17 1Q18
$91.4 $103.2 $106.9 $98.9
$87.2
$24.8 $23.6$27.5 $24.7
$34.3
($0.3)
$8.0 $6.0 $5.9
($0.4)
Bankers Life
Washington
National
Colonial
Penn
$0.4 $1.7
($1.0)
$0.6 $0.0
($8.9) ($13.2) ($14.9) ($3.3) ($15.5)
LTC in
run-off
Corporate
Total CNO $107.4 $123.3 $124.5 $126.8 $105.6
▪ Bankers Life results reflect lower Medicare
supplement margins, partially offset by
favorable investment income and
expenses
▪ Washington National results reflect
favorable supplemental health claims
▪ Colonial Penn better than expectations,
with lower marketing spend offsetting
slightly unfavorable mortality
▪ LTC in run-off in-line with expectations
▪ Corporate results reflect significant COLI
outperformance in 1Q17 and lower
expenses in 1Q18

CNO Financial Group | First Quarter 2018 Earnings | April 26, 2018 9
$146 $146 $147 $149 $151
60.6% 60.4%59.0%
56.6%54.4%
1Q17 2Q17 3Q17 4Q17 1Q18
Earned PremiumReported Benefit Ratio
($ millions)
1 Interest-adjusted benefit ratio (IABR); a non-GAAP measure. Refer to the Appendix for the corresponding GAAP measure.
2 Adjusted benefit ratio; long-term care IABR1 excluding impact of policyholder actions following rate increases and other one-time impacts
Health Margins
Washington National
Supplemental Health IABR1
Bankers Life Long-term Care
IABR1
Bankers Life Medicare
Supplement Benefit Ratio
$196 $194 $195 $193 $193
70.0% 70.4%72.0% 70.7%
73.3%
1Q17 2Q17 3Q17 4Q17 1Q18
Earned PremiumReported Benefit Ratio
$116 $114 $113 $111 $110
72.5%
66.2%
72.9% 73.1%70.2%
74.2% 74.4% 72.9% 73.1% 72.6%
1Q17 2Q17 3Q17 4Q17 1Q18
Earned Premium
Reported IABR
Adjusted Benefit Ratio²
▪ Benefit ratio of 73.3% in-line with
expectations and reflecting
implementation of crossover claims
processing
▪ Benefit ratio guidance of 71-74%
for remainder of 2018
▪ IABR1 of 54.4% reflects favorable
incurred claims
▪ IABR1 guidance of 58-61% for
remainder of 2018
▪ Adjusted IABR2 of 72.6%, reflects
favorable incurred claims and
persistency
▪ IABR1 guidance of 75-80% for
remainder of 2018

CNO Financial Group | First Quarter 2018 Earnings | April 26, 2018 10
Priorities & Opportunities
▪ Implementation and execution on strategic
initiatives
▪ Reducing long-term care exposure
▪ Committed to effective capital deployment

CNO Financial Group | First Quarter 2018 Earnings | April 26, 2018 11
Questions and Answers

CNO Financial Group | First Quarter 2018 Earnings | April 26, 2018 12
Appendix

CNO Financial Group | First Quarter 2018 Earnings | April 26, 2018 13
Growth Scorecard ($ millions)
1 Includes third party products sold. See page 18 for a reconciliation to total policies inforce.
2 Measured as 100% of new term life and health annualized premiums and 10% of single premium whole life deposits.
2018
1Q 2Q 3Q 4Q 1Q Q/Q
First Year Collected Premiums Bankers Life $311.1 $319.9 $288.2 $326.4 $299.5 -3.7%
Washington National 20.5 19.7 18.9 19.3 19.7 -3.9%
Colonial Penn 13.7 12.7 12.1 11.6 11.9 -13.1%
Total CNO $345.3 $352.3 $319.2 $357.3 $331.1 -4.1%
Collected Premiums Bankers Life $687.8 $680.6 $641.7 $696.3 $672.5 -2.2%
Washington National 173.1 167.5 164.2 168.6 176.2 1.8%
Colonial Penn 74.5 72.5 72.6 72.0 75.3 1.1%
LTC in run-off 4.6 4.4 3.9 4.0 4.1 -10.9%
Total CNO $940.0 $925.0 $882.4 $940.9 $928.1 -1.3%
Policies Inforce 1 (thousands) Bankers Life 1,673.5 1,671.7 1,665.6 1,672.0 1,648.0 -1.5%
Washington National 964.6 964.5 963.1 964.1 969.5 0.5%
Colonial Penn 853.3 849.4 845.1 841.0 841.9 -1.3%
LTC in run-off 10.1 9.8 9.5 9.3 9.1 -9.9%
Total CNO 3,501.5 3495.4 3,483.3 3,486.4 3,468.5 -0.9%
New Annualized Premium 2Life Insurance $41.5 $36.0 $34.3 $33.6 $36.9 -11.1%
Health Insurance 46.4 45.9 43.1 51.8 41.2 -11.2%
Total Life & Health Insurance $87.9 $81.9 $77.4 $85.4 $78.1 -11.1%
Annuity Account Values Bankers Life $7,869.7 $7,954.7 $8,047.2 $8,163.3 $8,221.2 4.5%
Washington National 404.5 393.4 385.7 378.2 368.1 -9.0%
Total $8,274.2 $8,348.1 $8,432.9 $8,541.5 $8,589.3 3.8%
Annuity Collected Premiums Bankers Life $257.5 $264.3 $236.5 $272.3 $251.4 -2.4%
Fee Revenue 3Bankers Life $16.1 $8.7 $8.9 $8.5 $19.0 18.0%
% Change2017
3 Fee revenue for prior periods revised to reflect the revenue recognition accounting policy
that went into effect January 1, 2018

CNO Financial Group | First Quarter 2018 Earnings | April 26, 2018 14
Investment Results ($ millions)
Average Invested Assets and Cash
$23,864 $23,982 $24,286 $24,580 $24,642
$312.0 $322.4 $325.9 $325.1 $329.1
1Q17 2Q17 3Q17 4Q17 1Q18
NetInvestmentIncome
1 Earned Yield excludes assets held in our FHLB matchbook program.
▪ Strong investment income results due to high
alternatives returns as well as tactical shift to benefit
from inter-quarter volatility
▪ No impairments reflective of favorable credit quality
and credit market condition
▪ Prepayment income more in normalized range
compared to trailing quarters
▪ RBC negatively impacted by ratings of certain 1Q18
investments, largely in financials-related ETFs
▪ Adopted new equity securities accounting standard
as of January 1, 2018
- Requires equity investments to be measured
at fair value with changes recognized in net
income
- 1Q18 pre-tax impact of ($12.5) million
reported in non-operating earnings
New Money Rate 5.23% 4.64% 5.38% 5.16% 5.36%
Earned Yield1: 5.42% 5.54% 5.51% 5.43% 5.44%
Pre-
Pay/Call/Make-
whole Income
$0.6 $9.8 $16.9 $11.7 $4.4
Alternative
Investment
Income
$8.5 $6.1 $8.9 $10.2 $19.9
Impairments $8.4 $5.1 $4.7 $4.6 -
Quarter Highlights

CNO Financial Group | First Quarter 2018 Earnings | April 26, 2018 15
Average Producing Agents1
1st Yr 2nd Yr 3rd Yr + Total 1st Yr 2nd Yr 3rd Yr + Total
3/31/2018 1,808 453 1,847 4,108 285 85 316 686
12/31/2017 1,845 463 1,863 4,171 288 85 314 687
9/30/2017 1,887 483 1,873 4,243 287 89 310 686
6/30/2017 1,941 503 1,880 4,324 285 91 308 684
3/31/2017 1,994 533 1,877 4,404 280 92 308 680
12/31/2016 2,037 567 1,875 4,479 279 90 308 677
9/30/2016 2,081 584 1,875 4,540 283 89 309 681
6/30/2016 2,123 598 1,882 4,603 284 88 307 679
3/31/2016 2,194 604 1,888 4,686 287 90 300 677
1 Producing agent counts are determined at the end of each month and only include agents who submitted at least one policy in the month. The average producing
agent counts represent the average of the last 12 months producing agent counts.
Washington NationalBankers Life
CNO Financial Group | First Quarter 2018 Earnings | April 26, 2018 16
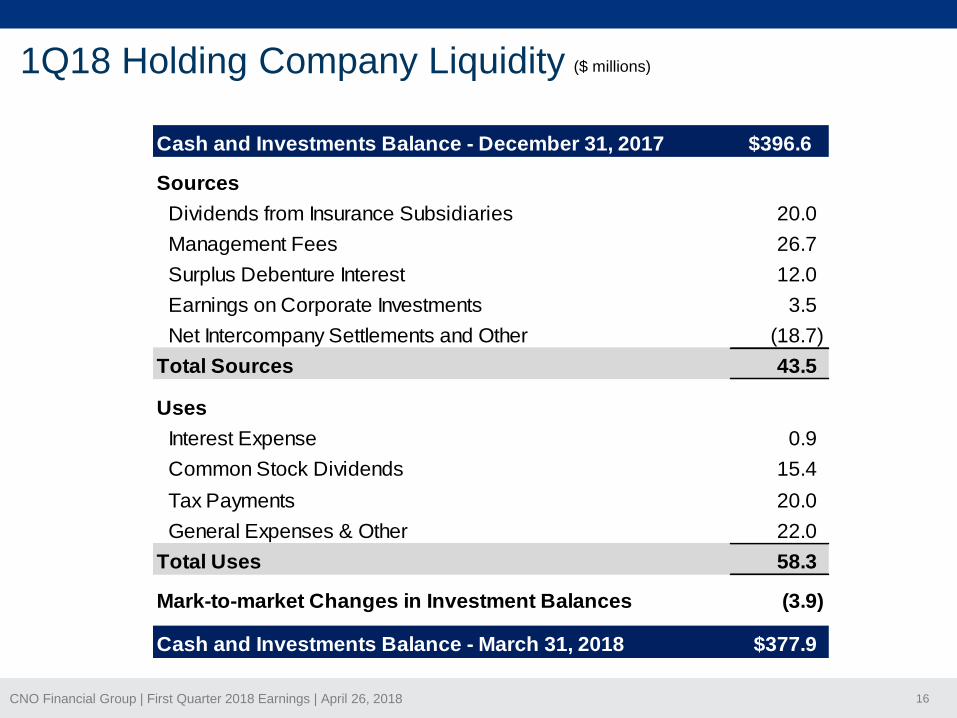
1Q18 Holding Company Liquidity ($ millions)
Cash and Investments Balance - December 31, 2017 $396.6
Sources
Dividends from Insurance Subsidiaries 20.0
Management Fees 26.7
Surplus Debenture Interest 12.0
Earnings on Corporate Investments 3.5
Net Intercompany Settlements and Other (18.7)
Total Sources 43.5
Uses
Interest Expense 0.9
Common Stock Dividends 15.4
Tax Payments 20.0
General Expenses & Other 22.0
Total Uses 58.3
Mark-to-market Changes in Investment Balances (3.9)
Cash and Investments Balance - March 31, 2018 $377.9

CNO Financial Group | First Quarter 2018 Earnings | April 26, 2018 17
Loss Carryforwards Valuation Allowance
Non-Life(1) $484
Tax Asset Summary ($ millions)
Loss Carryforwards Details
▪ Total estimated economic value
of NOLs of $265 million @ 10%
discount rate (~$1.57 on per
share basis)
▪ NOLs are expected to offset
100% of the taxable income of
our non-life companies and
35% of the taxable income of
our life insurance companies
through 2023
1 Excludes $10 million related to state operating loss carryforwards.
2 Excludes $7 million related to state operating loss carryforwards.
Non-Life(2)
$77

CNO Financial Group | First Quarter 2018 Earnings | April 26, 2018 18
Policies Inforce
1Q17 2Q17 3Q17 4Q17 1Q18
Policies inforce:
Bankers Life 1,519,474 1,515,445 1,510,160 1,500,573 1,485,235
Washington National 964,642 964,519 963,141 964,138 969,525
Colonial Penn 853,307 849,353 845,135 840,979 841,944
Long-term care in run-off 10,068 9,769 9,473 9,265 9,044
Total policies inforce 3,347,491 3,339,086 3,327,909 3,314,955 3,305,748
Third party policies inforce sold by
Bankers Life agents 154,005 156,308 155,430 171,421 162,784
Total policies inforce and third party policies
inforce sold by Bankers Life agents 3,501,496 3,495,394 3,483,339 3,486,376 3,468,532
The following summarizes total policies inforce as of the end of the period indicated.
CNO Financial Group | First Quarter 2018 Earnings | April 26, 2018 19
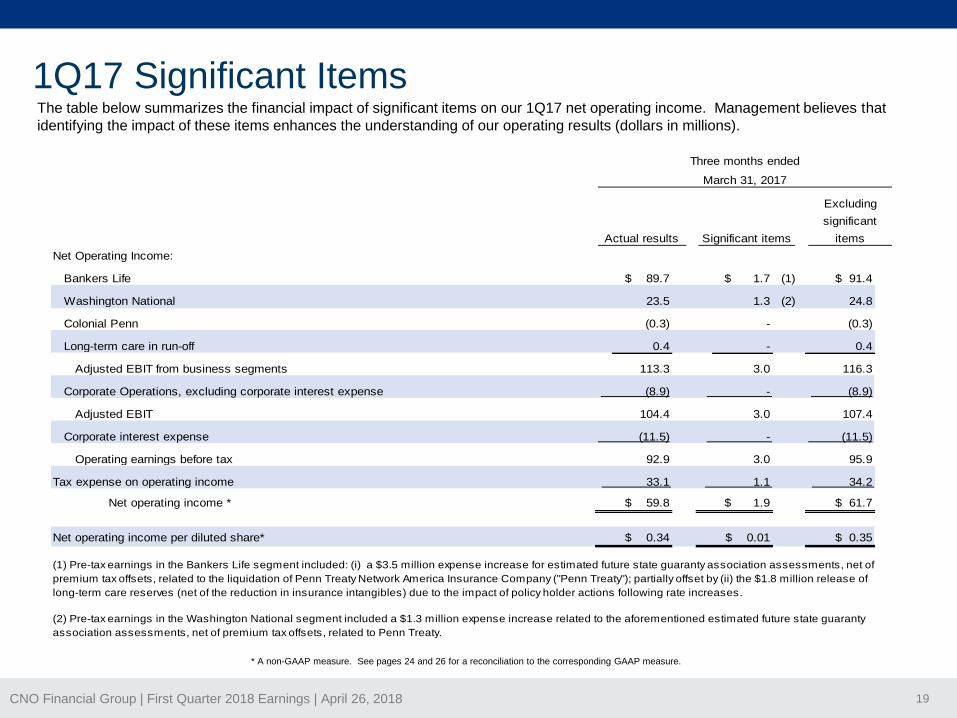
Net Operating Income:
Bankers Life $ 89.7 $ 1.7 (1) $ 91.4
Washington National (2)
Colonial Penn
Long-term care in run-off 0.4 -
Adjusted EBIT from business segments
Corporate Operations, excluding corporate interest expense
Adjusted EBIT
Corporate interest expense
Operating earnings before tax
Tax expense on operating income
Net operating income * $ 59.8 $ 1.9 $ 61.7
Net operating income per diluted share* $ 0.34 $ 0.01 $ 0.35
Three months ended
March 31, 2017
Actual results Significant items
Excluding
significant
items
23.5 1.3 24.8
0.4
116.3
3.0 107.4
(0.3) - (0.3)
113.3 3.0
(8.9) - (8.9)
34.2
104.4
(11.5) - (11.5)
(1) Pre-tax earnings in the Bankers Life segment included: (i) a $3.5 million expense increase for estimated future state guaranty association assessments, net of
premium tax offsets, related to the liquidation of Penn Treaty Network America Insurance Company ("Penn Treaty"); partially offset by (ii) the $1.8 million release of
long-term care reserves (net of the reduction in insurance intangibles) due to the impact of policy holder actions following rate increases.
(2) Pre-tax earnings in the Washington National segment included a $1.3 million expense increase related to the aforementioned estimated future state guaranty
association assessments, net of premium tax offsets, related to Penn Treaty.
92.9 3.0 95.9
33.1 1.1
The table below summarizes the financial impact of significant items on our 1Q17 net operating income. Management believes that
identifying the impact of these items enhances the understanding of our operating results (dollars in millions).
1Q17 Significant Items
* A non-GAAP measure. See pages 24 and 26 for a reconciliation to the corresponding GAAP measure.

CNO Financial Group | First Quarter 2018 Earnings | April 26, 2018 20
Net Operating Income:
Bankers Life $ 112.6 $ (9.4) (1) $ 103.2
Washington National
Colonial Penn
Long-term care in run-off 1.7 -
Adjusted EBIT from business segments
Corporate Operations, excluding corporate interest expense
Adjusted EBIT
Corporate interest expense
Operating earnings before tax
Tax expense on operating income
Net operating income * $ 78.6 $ (6.1) $ 72.5
Net operating income per diluted share* $ 0.45 $ 0.03 $ 0.42
(1) Pre-tax earnings in the Bankers Life segment included: (i) favorable persistency (including the results of extensive procedures performed to identify policies that
had terminated prior to June 30, 2017 due to death); and (ii) policy holder actions following long-term care rate increases. These items resulted in a release of
reserves, primarily related to the long-term care business in the Bankers Life segment, which totaled $9.4 million.
121.1 (9.4) 111.7
42.5 (3.3)
(13.2) - (13.2)
39.2
132.7
(11.6) - (11.6)
123.3
8.0 - 8.0
145.9 (9.4)
23.6 - 23.6
1.7
136.5
(9.4)
Three months ended
June 30, 2017
Actual results Significant items
Excluding
significant
items
The table below summarizes the financial impact of significant items on our 2Q17 net operating income. Management believes that
identifying the impact of these items enhances the understanding of our operating results (dollars in millions).
2Q17 Significant Items
* A non-GAAP measure. See pages 24 and 26 for a reconciliation to the corresponding GAAP measure.

CNO Financial Group | First Quarter 2018 Earnings | April 26, 2018 21
Net Operating Income:
Bankers Life $ 106.9 $ - $ 106.9
Washington National
Colonial Penn (1)
Long-term care in run-off (1.0) -
Adjusted EBIT from business segments
Corporate Operations, excluding corporate interest expense
Adjusted EBIT
Corporate interest expense
Operating earnings before tax
Tax expense on operating income
Net operating income * $ 76.7 $ (2.0) $ 74.7
Net operating income per diluted share* $ 0.45 $ (0.01) $ 0.44
Three months ended
September 30, 2017
Actual results Significant items
Excluding
significant
items
27.5 - 27.5
(1.0)
139.4
(3.0) 124.5
9.0 (3.0) 6.0
142.4 (3.0)
(14.9) - (14.9)
38.1
127.5
(11.7) - (11.7)
(1) Pre-tax earnings in the Colonial Penn segment reflects a $3.0 million out-of-period adjustment and refinement to liabilities for insurance products identified in
conjunction with periodic updating of assumptions.
115.8 (3.0) 112.8
39.1 (1.0)
The table below summarizes the financial impact of significant items on our 3Q17 net operating income. Management believes that
identifying the impact of these items enhances the understanding of our operating results (dollars in millions).
3Q17 Significant Items
* A non-GAAP measure. See pages 24 and 26 for a reconciliation to the corresponding GAAP measure.

CNO Financial Group | First Quarter 2018 Earnings | April 26, 2018 22
Net Operating Income:
Bankers Life $ 109.7 $ (10.8) (1) $ 98.9
Washington National (1)
Colonial Penn
Long-term care in run-off 0.6 -
Adjusted EBIT from business segments
Corporate Operations, excluding corporate interest expense
Adjusted EBIT
Corporate interest expense
Operating earnings before tax
Tax expense on operating income
Net operating income * $ 85.8 $ (6.4) $ 79.4
Net operating income per diluted share* $ 0.51 $ (0.04) $ 0.47
Three months ended
December 31, 2017
Actual results Significant items
Excluding
significant
items
23.7 1.0 24.7
0.6
130.1
(9.8) 126.8
5.9 - 5.9
139.9 (9.8)
(3.3) - (3.3)
35.7
136.6
(11.7) - (11.7)
(1) Pre-tax earnings in the Bankers Life and Washington National segments reflect $10.8 million of favorable impacts and $1.0 million of unfavorable impacts,
respectively, from our comprehensive annual actuarial review of assumptions.
124.9 (9.8) 115.1
39.1 (3.4)
The table below summarizes the financial impact of significant items on our 4Q17 net operating income. Management believes that
identifying the impact of these items enhances the understanding of our operating results (dollars in millions).
4Q17 Significant Items
* A non-GAAP measure. See pages 24 and 26 for a reconciliation to the corresponding GAAP measure.

CNO Financial Group | First Quarter 2018 Earnings | April 26, 2018 23
Net Operating Income:
Bankers Life $ 89.5 $ (2.3) (1) $ 87.2
Washington National
Colonial Penn (2)
Long-term care in run-off - -
Adjusted EBIT from business segments
Corporate Operations, excluding corporate interest expense
Adjusted EBIT
Corporate interest expense
Operating earnings before tax
Tax expense on operating income
Net operating income * $ 73.9 $ (0.9) $ 73.0
Net operating income per diluted share* $ 0.44 $ (0.01) $ 0.43
(1.2)
(0.4)
34.3 34.3
Excluding
significant
items
121.1
(1.2)
122.3
(11.9)
-
(11.9)
Three months ended
March 31, 2018
Actual results Significant items
(1.5) 1.1
(0.3)
-
(15.5) - (15.5)
20.7
106.8
-
105.6
(1) Pre-tax earnings in the Bankers Life segment included the $2.3 million release of long-term care reserves (net of the reduction in insurance intangibles) due to the
impact of policyholder actions following rate increases.
(2) Pre-tax earnings in the Colonial Penn segment included a $1.1 million out-of-period adjustment which increased reserves on closed block payout annuities.
94.9 (1.2) 93.7
21.0
The table below summarizes the financial impact of significant items on our 1Q18 net operating income. Management believes that
identifying the impact of these items enhances the understanding of our operating results (dollars in millions).
1Q18 Significant Items
* A non-GAAP measure. See pages 24 and 26 for a reconciliation to the corresponding GAAP measure.

CNO Financial Group | First Quarter 2018 Earnings | April 26, 2018 24
Quarterly Earnings
*Management believes that an analysis of earnings before net realized investment gains (losses), fair value changes in embedded derivative liabilities, fair value changes related to the
agent deferred compensation plan, other non-operating items, corporate interest expense and taxes (“Adjusted EBIT,” a non-GAAP financial measure) provides a clearer comparison of
the operating results of the company quarter-over-quarter because it excludes: (1) net realized investment gains (losses); (2) fair value changes due to fluctuations in the interest rates
used to discount embedded derivative liabilities related to our fixed index annuities that are unrelated to the company’s underlying fundamentals; (3) fair value changes related to the
agent deferred compensation plan; (4) charges in the valuation allowance for deferred tax assets and other tax items; and (5) other non-operating items consisting primarily of earnings
attributable to variable interest entities. The table above provides a reconciliation of Adjusted EBIT to net income.
1Q17 2Q17 3Q17 4Q17 1Q18
Bankers Life 89.7$ 112.6$ 106.9$ 109.7$ 89.5$
Washington National 23.5 23.6 27.5 23.7 34.3
Colonial Penn (0.3) 8.0 9.0 5.9 (1.5)
Long-term care in run-off 0.4 1.7 (1.0) 0.6 -
Adjusted EBIT from business segments 113.3 145.9 142.4 139.9 122.3
Corporate operations, excluding interest expense (8.9) (13.2) (14.9) (3.3) (15.5)
Adjusted EBIT* 104.4 132.7 127.5 136.6 106.8
Corporate interest expense (11.5) (11.6) (11.7) (11.7) (11.9)
Operating earnings before taxes 92.9 121.1 115.8 124.9 94.9
Tax expense on period income 33.1 42.5 39.1 39.1 21.0
Net operating income 59.8 78.6 76.7 85.8 73.9
Net realized investment gains (losses), net of related amortization 7.9 14.9 28.5 (2.0) (15.2)
Fair value changes in embedded derivative liabilities, net of related amortization (4.4) (5.9) 2.3 5.5 25.1
Fair value changes related to the agent deferred compensation plan - - (13.4) 1.2 -
Other 0.3 (1.6) (3.3) (4.2) 3.3
Non-operating income before taxes 3.8 7.4 14.1 0.5 13.2
Income tax expense (benefit):
On non-operating income (loss) 1.3 2.6 5.0 0.1 2.8
Valuation allowance for deferred tax assets and other tax items - - (15.0) 157.1 -
Net non-operating income (loss) 2.5 4.8 24.1 (156.7) 10.4
Net income (loss) 62.3$ 83.4$ 100.8$ (70.9)$ 84.3$
($ millions)

CNO Financial Group | First Quarter 2018 Earnings | April 26, 2018 25
The following provides additional information regarding certain non-GAAP measures used in this presentation. A non-GAAP measure is a numerical measure of a company’s performance, financial position, or cash flows that excludes or includes amounts that are normally excluded or included in the most directly comparable measure calculated and presented in accordance with GAAP. While management believes these measures are useful to enhance understanding and comparability of our financial results, these non-GAAP measures should not be considered as substitutes for the most directly comparable GAAP measures. Additional information concerning non-GAAP measures is included in our periodic filings with the Securities and Exchange Commission that are available in the “Investors – SEC Filings” section of CNO’s website, www.CNOinc.com.
Operating earnings measuresManagement believes that an analysis of net income applicable to common stock before net realized investment gains or losses, fair value changes due to fluctuations in the interest rates used to discount embedded derivative liabilities related to our fixed index annuities, fair value changes related to the agent deferred compensation plan, changes in the valuation allowance for deferred tax assets and other tax items and other non-operating items consisting primarily of earnings attributable to variable interest entities (“net operating income,” a non-GAAP financial measure) is important to evaluate the financial performance of the Company and is a key measure commonly used in the life insurance industry. Management uses this measure to evaluate performance because the items excluded from net operating income can be affected by events that are unrelated to the Company’s underlying fundamentals.
Information Related to Certain Non-GAAP Financial Measures

CNO Financial Group | First Quarter 2018 Earnings | April 26, 2018 26
Information Related to Certain Non-GAAP Financial Measures
A reconciliation of net income(loss) applicable to common stock to net operating income (and related per-share amounts) is as
follows (dollars in millions, except per-share amounts):
1Q17 2Q17 3Q17 4Q17 1Q18
Net income(loss) applicable to common stock 62.3$ 83.4$ 100.8$ (70.9)$ 84.3$
Non-operating items:
Net realized investment (gains) losses, net of related amortization (7.9) (14.9) (28.5) 2.0 15.2
Fair value changes in embedded derivative liabilities, net of related amortization 4.4 5.9 (2.3) (5.5) (25.1)
Fair value changes related to the agent deferred compensation plan - - 13.4 (1.2) -
Other (0.3) 1.6 3.3 4.2 (3.3)
Non-operating (income) loss before taxes (3.8) (7.4) (14.1) (0.5) (13.2)
Income tax (expense) benefit:
On non-operating (income) loss (1.3) (2.6) (5.0) (0.1) (2.8)
Valuation allowance for deferred tax assets and other tax items - - 15.0 (157.1) -
Net non-operating (income) loss (2.5) (4.8) (24.1) 156.7 (10.4)
Net operating income (a non-GAAP financial measure) 59.8$ 78.6$ 76.7$ 85.8$ 73.9$
Per diluted share:
Net income(loss) 0.36$ 0.48$ 0.59$ (0.42)$ 0.50$
Net realized investment (gains) losses (net of related amortization and taxes) (0.03) (0.06) (0.11) 0.01 0.07
Fair value changes in embedded derivative liabilities (net of related amortization and taxes) 0.01 0.02 (0.01) (0.02) (0.12)
Fair value changes related to the agent deferred compensation plan (net of taxes) - - 0.05 (0.01) -
Valuation allowance for deferred tax assets and other tax items - - (0.09) 0.94 -
Other - 0.01 0.02 0.01 (0.01)
Net operating income (a non-GAAP financial measure) 0.34$ 0.45$ 0.45$ 0.51$ 0.44$

CNO Financial Group | First Quarter 2018 Earnings | April 26, 2018 27
1Q17 2Q17 3Q17 4Q17 (a) 1Q18
Operating income 59.8$ 78.6$ 76.7$ 85.8$ 73.9$
Weighted average shares outstanding for basic earnings per share 173,431 170,556 168,684 167,428 167,060
Effect of dilutive securities on weighted average shares:
Stock options, restricted stock and performance units 1,634 1,796 2,298 - 2,617
Weighted average shares outstanding for diluted earnings per share 175,065 172,352 170,982 167,428 169,677
Net operating income per diluted share 0.34$ 0.45$ 0.45$ 0.51$ 0.44$
A reconciliation of operating income and shares used to calculate basic and diluted operating earnings per share is as
follows (dollars in millions, except per-share amounts, and shares in thousands):
Information Related to Certain Non-GAAP Financial Measures
(a) Equivalent common shares of 2,750 were not included in the diluted weighted average shares outstanding due to the net loss recognized in 4Q17.

CNO Financial Group | First Quarter 2018 Earnings | April 26, 2018 28
Book value per diluted share
Book value per diluted share reflects the potential dilution that could occur if outstanding stock options were exercised, restricted stock and performance units
were vested and convertible securities were converted. The dilution from options, restricted shares and performance units is calculated using the treasury stock
method. Under this method, we assume the proceeds from the exercise of the options (or the unrecognized compensation expense with respect to restricted
stock and performance units) will be used to purchase shares of our common stock at the closing market price on the last day of the period. In addition, the
calculation of this non-GAAP measure differs from the corresponding GAAP measure because accumulated other comprehensive income (loss) has been
excluded from the value of capital used to determine this measure. Management believes this non-GAAP measure is useful because it removes the volatility
that arises from changes in the unrealized appreciation (depreciation) of our investments. Management believes this adjustment to the December 31, 2017 non-
GAAP measure is useful because it removes the tax effects stranded in accumulated other comprehensive income as a result of accounting rules which require
the effects of the Tax Reform Act on deferred tax balances to be recorded in earnings, even if the balance was originally recorded in accumulated other
comprehensive income.
1Q17 2Q17 3Q17 4Q17 1Q18
Total shareholders' equity 4,606.8$ 4,779.3$ 4,881.7$ 4,847.5$ 4,617.2$
Shares outstanding for the period 172,103,802 169,018,890 167,762,323 166,857,931 167,354,255
Book value per share 26.77$ 28.28$ 29.10$ 29.05$ 27.59$
Total shareholders' equity 4,606.8$ 4,779.3$ 4,881.7$ 4,847.5$ 4,617.2$
Less accumulated other comprehensive income (729.6) (894.5) (933.6) (1,212.1) (894.3)
Adjusted shareholders' equity excluding AOCI 3,877.2$ 3,884.8$ 3,948.1$ 3,635.4$ 3,722.9$
Shares outstanding for the period 172,103,802 169,018,890 167,762,323 166,857,931 167,354,255
Dilutive common stock equivalents related to:
Stock options, restricted stock and performance units 1,714,212 1,840,391 2,474,837 2,796,385 2,351,172
Diluted shares outstanding 173,818,014 170,859,281 170,237,160 169,654,316 169,705,427
Book value per diluted share (a non-GAAP financial measure) 22.31$ 22.74$ 23.19$ 21.43$ 21.94$
A reconciliation from book value per share to book value per diluted share, excluding accumulated other comprehensive income (loss) is as follows (dollars in
millions, except per share amounts):
Information Related to Certain Non-GAAP Financial Measures

CNO Financial Group | First Quarter 2018 Earnings | April 26, 2018 29
Information Related to Certain Non-GAAP Financial Measures
The interest-adjusted benefit ratio (a non-GAAP measure) is calculated by dividing the product's insurance policy benefits less
imputed interest income on the accumulated assets backing the insurance liabilities by insurance policy income. Interest income is
an important factor in measuring the performance of longer duration health products. The net cash flows generally cause an
accumulation of amounts in the early years of a policy (accounted for as reserve increases), which will be paid out as benefits in
later policy years (accounted for as reserve decreases). Accordingly, as the policies age, the benefit ratio will typically increase, but
the increase in the change in reserve will be partially offset by the imputed interest income earned on the accumulated assets. The
interest-adjusted benefit ratio reflects the effects of such interest income offset. Since interest income is an important factor in
measuring the performance of these products, management believes a benefit ratio, which includes the effect of interest income, is
useful in analyzing product performance. The interest-adjusted benefit ratio excluding the impact of rate increases and other one-
time impacts eliminates the release of reserves due to the impact of policyholder actions following rate increases and other one-time
impacts.
(Dollars in millions)1Q17 2Q17 3Q17 4Q17 1Q18
Bankers Life
Long-term care benefit ratios
Earned premium 115.6$ 113.7$ 112.7$ 111.1$ 109.5$
Benefit ratio before imputed interest income on reserves 132.6% 126.9% 134.2% 135.3% 133.4%
Interest-adjusted benefit ratio 72.5% 66.2% 72.9% 73.1% 70.2%
Interest-adjusted benefit ratio, excluding the impact of reserve releases due to rate increases and other one-time impacts 74.2% 74.4% 72.9% 73.1% 72.6%
Underwriting margin (earned premium plus imputed interest income on reserves less policy benefits) 31.8$ 38.4$ 30.5$ 29.9$ 32.6$
Adjusted underwriting margin (excluding the impact of reserve releases due to rate increases and other one-time impacts) 29.8 29.0 30.5 29.9 30.0
Washington National
Supplemental health benefit ratios
Earned premium 145.6$ 146.3$ 147.2$ 149.4$ 151.3$
Benefit ratio before imputed interest income on reserves 84.6% 84.5% 83.2% 80.7% 78.3%
Interest-adjusted benefit ratio 60.6% 60.4% 59.0% 56.6% 54.4%
Underwriting margin (earned premium plus imputed interest income on reserves less policy benefits) 57.3$ 57.9$ 60.4$ 64.8$ 69.0$
Interest-adjusted benefit ratios

CNO Financial Group | First Quarter 2018 Earnings | April 26, 2018 30
Information Related to Certain Non-GAAP Financial Measures
Operating return measures
Management believes that an analysis of net income applicable to common stock before net realized investment gains or losses,
fair value changes due to fluctuations in the interest rates used to discount embedded derivative liabilities related to our fixed
index annuities, fair value changes and amendment related to the agent deferred compensation plan, loss on reinsurance
transaction, changes in the valuation allowance for deferred tax assets and other tax items, loss on extinguishment of debt and
other non-operating items consisting primarily of earnings attributable to variable interest entities (“net operating income,” a non-
GAAP financial measure) is important to evaluate the financial performance of the Company and is a key measure commonly
used in the life insurance industry. Management uses this measure to evaluate performance because the items excluded from net
operating income can be affected by events that are unrelated to the Company’s underlying fundamentals.
Management also believes that an operating return, excluding significant items, is important as the impact of these items
enhances the understanding of our operating results.
This non-GAAP financial measure also differs from return on equity because accumulated other comprehensive income (loss) has
been excluded from the value of equity used to determine this ratio. Management believes this non-GAAP financial measure is
useful because it removes the volatility that arises from changes in accumulated other comprehensive income (loss). Such
volatility is often caused by changes in the estimated fair value of our investment portfolio resulting from changes in general
market interest rates rather than the business decisions made by management.
In addition, our equity includes the value of significant net operating loss carryforwards (included in income tax assets). In
accordance with GAAP, these assets are not discounted, and accordingly will not provide a return to shareholders (until after it is
realized as a reduction to taxes that would otherwise be paid). Management believes that excluding this value from the equity
component of this measure enhances the understanding of the effect these non-discounted assets have on operating returns and
the comparability of these measures from period-to-period. Operating return measures are used in measuring the performance of
our business units and are used as a basis for incentive compensation.

CNO Financial Group | First Quarter 2018 Earnings | April 26, 2018 31
Information Related to Certain Non-GAAP Financial MeasuresThe calculations of: (i) operating return on equity, excluding accumulated other comprehensive income (loss) and net
operating loss carryforwards (a non-GAAP financial measure); (ii) operating return, excluding significant items, on
equity, excluding accumulated other comprehensive income (loss) and net operating loss carryforwards (a non-
GAAP financial measure); and (iii) return on equity are as follows (dollars in millions):
1Q17 2Q17 3Q17 4Q17 1Q18
Operating income 272.7$ 287.6$ 300.0$ 300.9$ 315.0$
Operating income, excluding significant items 244.2$ 255.9$ 269.7$ 288.3$ 299.6$
Net Income 375.0$ 398.5$ 480.7$ 175.6$ 197.6$
Average common equity, excluding accumulated other
comprehensive income (loss) and net operating loss
carryforwards (a non-GAAP financial measure) 3,083.9$ 3,148.2$ 3,220.5$ 3,263.2$ 3,275.4$
Average common shareholders' equity 4,463.4$ 4,551.3$ 4,640.2$ 4,733.8$ 4,780.1$
Operating return on equity, excluding accumulated other
comprehensive income (loss) and net operating loss
carryforwards (a non-GAAP financial measure) 8.8% 9.1% 9.3% 9.2% 9.6%
Operating return, excluding significant items, on equity, excluding
accumulated other comprehensive income (loss) and net
operating loss carryforwards (a non-GAAP financial measure) 7.9% 8.1% 8.4% 8.8% 9.1%
Return on equity 8.4% 8.8% 10.4% 3.7% 4.1%
Trailing Twelve Months Ended
(Continued on next page)
CNO Financial Group | First Quarter 2018 Earnings | April 26, 2018 32
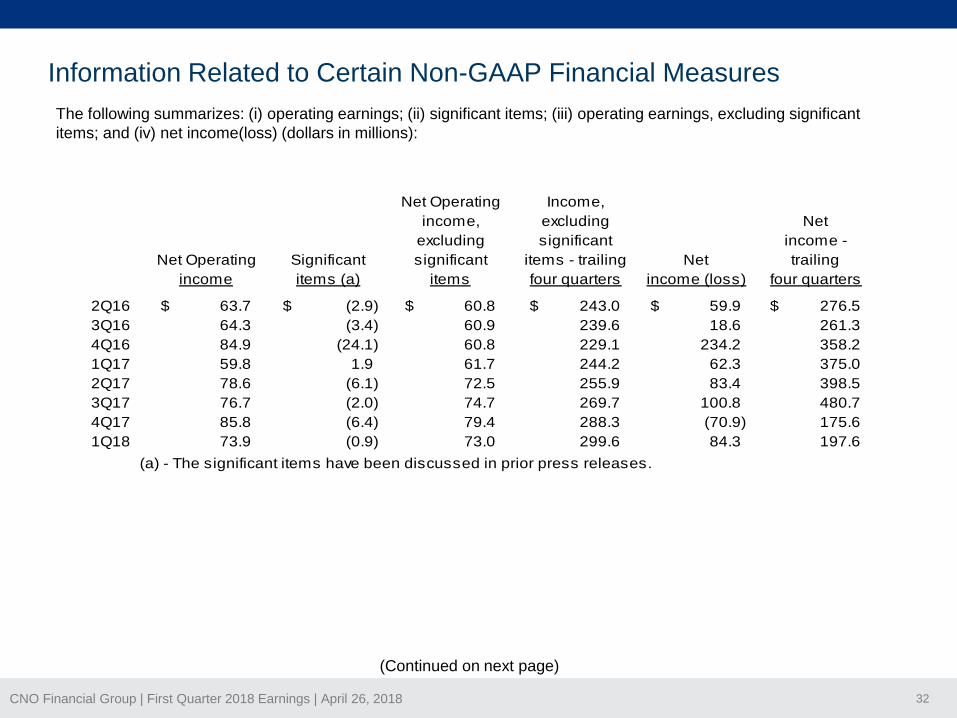
Information Related to Certain Non-GAAP Financial Measures
The following summarizes: (i) operating earnings; (ii) significant items; (iii) operating earnings, excluding significant
items; and (iv) net income(loss) (dollars in millions):
Net Operating Income,
income, excluding Net
excluding significant income -
Net Operating Significant significant items - trailing Net trailing
income items (a) items four quarters income (loss) four quarters
2Q16 63.7$ (2.9)$ 60.8$ 243.0$ 59.9$ 276.5$
3Q16 64.3 (3.4) 60.9 239.6 18.6 261.3
4Q16 84.9 (24.1) 60.8 229.1 234.2 358.2
1Q17 59.8 1.9 61.7 244.2 62.3 375.0
2Q17 78.6 (6.1) 72.5 255.9 83.4 398.5
3Q17 76.7 (2.0) 74.7 269.7 100.8 480.7
4Q17 85.8 (6.4) 79.4 288.3 (70.9) 175.6
1Q18 73.9 (0.9) 73.0 299.6 84.3 197.6
(a) - The significant items have been discussed in prior press releases.
(Continued on next page)

CNO Financial Group | First Quarter 2018 Earnings | April 26, 2018 33
Information Related to Certain Non-GAAP Financial Measures
A reconciliation of pretax operating earnings (a non-GAAP financial measure) to net income is as follows (dollars in
millions):
1Q17 2Q17 3Q17 4Q17 1Q18
Pretax operating earnings (a non-GAAP financial measure) 425.6$ 447.3$ 464.8$ 454.7$ 456.7$
Income tax expense (152.9) (159.7) (164.8) (153.8) (141.7)
Operating return 272.7 287.6 300.0 300.9 315.0
Non-operating items:
Net realized investment gains (losses), net of related amortization 16.5 19.4 36.5 49.3 26.2
Fair value changes in embedded derivative liabilities, net of related amortization 34.7 45.3 38.2 (2.5) 27.0
Fair value changes and amendment related to the agent deferred compensation plan 9.1 21.4 1.7 (12.2) (12.2)
Loss on reinsurance transaction (75.4) (75.4) - - -
Other (1.1) (2.8) (5.4) (8.8) (5.8)
Non-operating income (loss) before taxes (16.2) 7.9 71.0 25.8 35.2
Income tax expense (benefit):
On non-operating income (loss) (5.7) 2.8 24.9 9.0 10.5
Valuation allowance for deferred tax assets and other tax items (112.8) (105.8) (134.6) 142.1 142.1
Net non-operating income (loss) 102.3 110.9 180.7 (125.3) (117.4)
Net income 375.0$ 398.5$ 480.7$ 175.6$ 197.6$
Twelve Months Ended
(Continued on next page)
CNO Financial Group | First Quarter 2018 Earnings | April 26, 2018 34
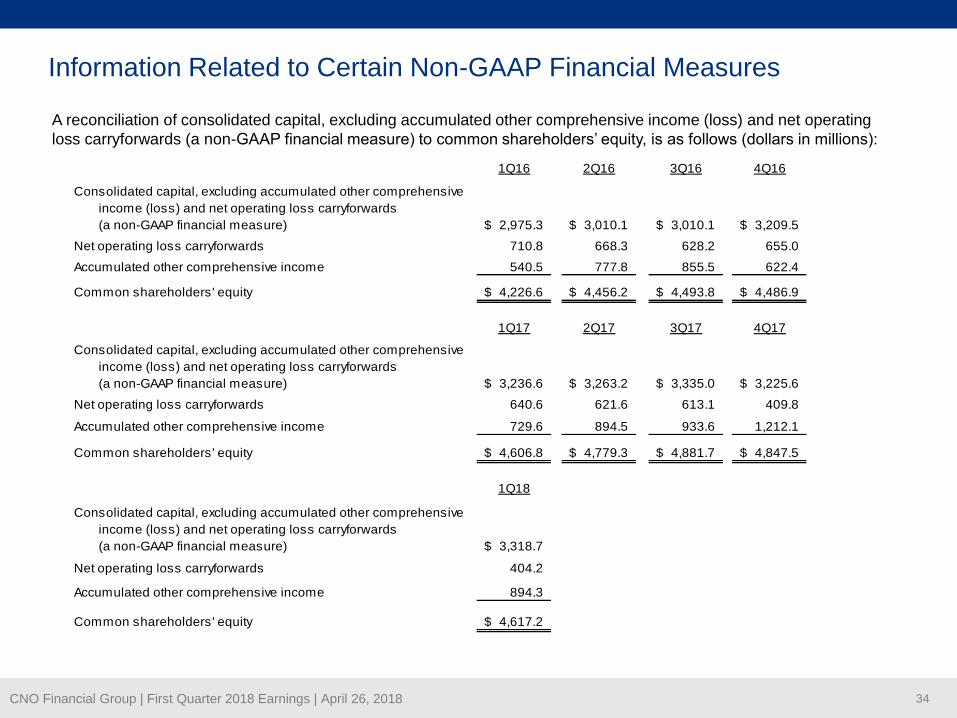
Information Related to Certain Non-GAAP Financial Measures
A reconciliation of consolidated capital, excluding accumulated other comprehensive income (loss) and net operating
loss carryforwards (a non-GAAP financial measure) to common shareholders’ equity, is as follows (dollars in millions):
1Q16 2Q16 3Q16 4Q16
Consolidated capital, excluding accumulated other comprehensive
income (loss) and net operating loss carryforwards
(a non-GAAP financial measure) 2,975.3$ 3,010.1$ 3,010.1$ 3,209.5$
Net operating loss carryforwards 710.8 668.3 628.2 655.0
Accumulated other comprehensive income 540.5 777.8 855.5 622.4
Common shareholders' equity 4,226.6$ 4,456.2$ 4,493.8$ 4,486.9$
1Q17 2Q17 3Q17 4Q17
Consolidated capital, excluding accumulated other comprehensive
income (loss) and net operating loss carryforwards
(a non-GAAP financial measure) 3,236.6$ 3,263.2$ 3,335.0$ 3,225.6$
Net operating loss carryforwards 640.6 621.6 613.1 409.8
Accumulated other comprehensive income 729.6 894.5 933.6 1,212.1
Common shareholders' equity 4,606.8$ 4,779.3$ 4,881.7$ 4,847.5$
1Q18
Consolidated capital, excluding accumulated other comprehensive
income (loss) and net operating loss carryforwards
(a non-GAAP financial measure) 3,318.7$
Net operating loss carryforwards 404.2
Accumulated other comprehensive income 894.3
Common shareholders' equity 4,617.2$
CNO Financial Group | First Quarter 2018 Earnings | April 26, 2018 35
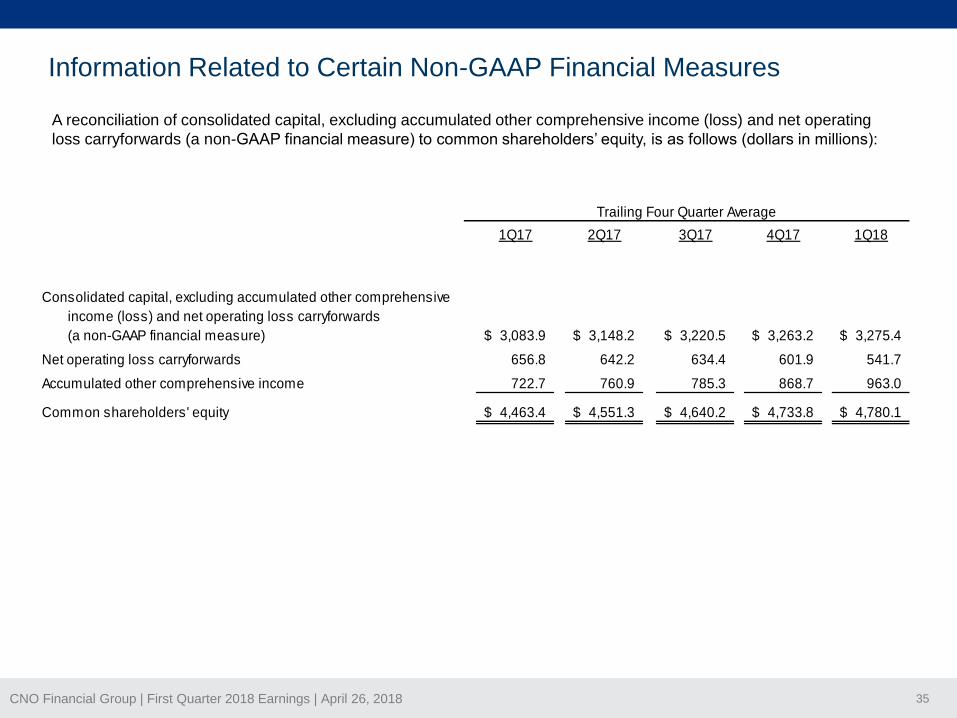
Information Related to Certain Non-GAAP Financial Measures
A reconciliation of consolidated capital, excluding accumulated other comprehensive income (loss) and net operating
loss carryforwards (a non-GAAP financial measure) to common shareholders’ equity, is as follows (dollars in millions):
1Q17 2Q17 3Q17 4Q17 1Q18
Consolidated capital, excluding accumulated other comprehensive
income (loss) and net operating loss carryforwards
(a non-GAAP financial measure) 3,083.9$ 3,148.2$ 3,220.5$ 3,263.2$ 3,275.4$
Net operating loss carryforwards 656.8 642.2 634.4 601.9 541.7
Accumulated other comprehensive income 722.7 760.9 785.3 868.7 963.0
Common shareholders' equity 4,463.4$ 4,551.3$ 4,640.2$ 4,733.8$ 4,780.1$
Trailing Four Quarter Average

CNO Financial Group | First Quarter 2018 Earnings | April 26, 2018 36
Information Related to Certain Non-GAAP Financial Measures
1Q17 2Q17 3Q17 4Q17 1Q18
Corporate notes payable 913.4$ 913.9$ 914.4$ 914.6$ 915.1$
Total shareholders' equity 4,606.8 4,779.3 4,881.7 4,847.5 4,617.2
Total capital 5,520.2$ 5,693.2$ 5,796.1$ 5,762.1$ 5,532.3$
Corporate debt to capital 16.5% 16.1% 15.8% 15.9% 16.5%
Corporate notes payable 913.4$ 913.9$ 914.4$ 914.6$ 915.1$
Total shareholders' equity 4,606.8 4,779.3 4,881.7 4,847.5 4,617.2
Less accumulated other comprehensive income (729.6) (894.5) (933.6) (1,212.1) (894.3)
Total capital 4,790.6$ 4,798.7$ 4,862.5$ 4,550.0$ 4,638.0$
Debt to total capital ratio, excluding AOCI (a
non-GAAP financial measure) 19.1% 19.0% 18.8% 20.1% 19.7%
Debt to capital ratio, excluding accumulated other comprehensive income (loss)
The debt to capital ratio, excluding accumulated other comprehensive income (loss), differs from the debt to capital ratio because accumulated
other comprehensive income (loss) has been excluded from the value of capital used to determine this measure. Management believes this non-
GAAP financial measure is useful because it removes the volatility that arises from changes in accumulated other comprehensive income (loss).
Such volatility is often caused by changes in the estimated fair value of our investment portfolio resulting from changes in general market interest
rates rather than the business decisions made by management. A reconciliation of these ratios is as follows (dollars in millions):