Embed Size (px)
Citation preview

www.ripplesadvisory.com
INDIAN MARKET:
OTHER INDICES:
OVERALL ADVANCES/ DECLINES:
INDEX OPEN HIGH LOW CLOSE % CHANGE
NIFTY SPOT11953.7
512103.0
511769.5
11870.65
.43
BANKNIFTY 31406.05 31752.7 30627.05 31066.55 .98
USDINR 69.590 69.367 69.030 69.468 .16
Indices Prev CloseLast
TradedChange
(Pts) % Change
NIFTY 50 11843.75 11870.65 +26.9 +0.23
NIFTY IT 16012.1 16109.85 +97.75 +0.61
NIFTY NEXT 50 27374.15 27382.75 +8.6 +0.03
NIFTY BANK 30857.4 31066.55 +209.15 +0.68
NIFTY 500 9722.5 9735.85 +13.35 +0.14
NIFTY 100 11932.95 11957.05 +24.1 +0.2
NIFTY MIDCAP 50 4917.5 4920.7 +3.2 +0.07
NIFTY REALTY 280.7 279.35 -1.35 -0.48
NIFTY INFRA 3321.0 3316.7 -4.3 -0.13
INDIA VIX 15.525 14.8575 -0.67 -4.3
ADVANCES DECLINES UNCHANGED TOTAL
705 1057 330 2092
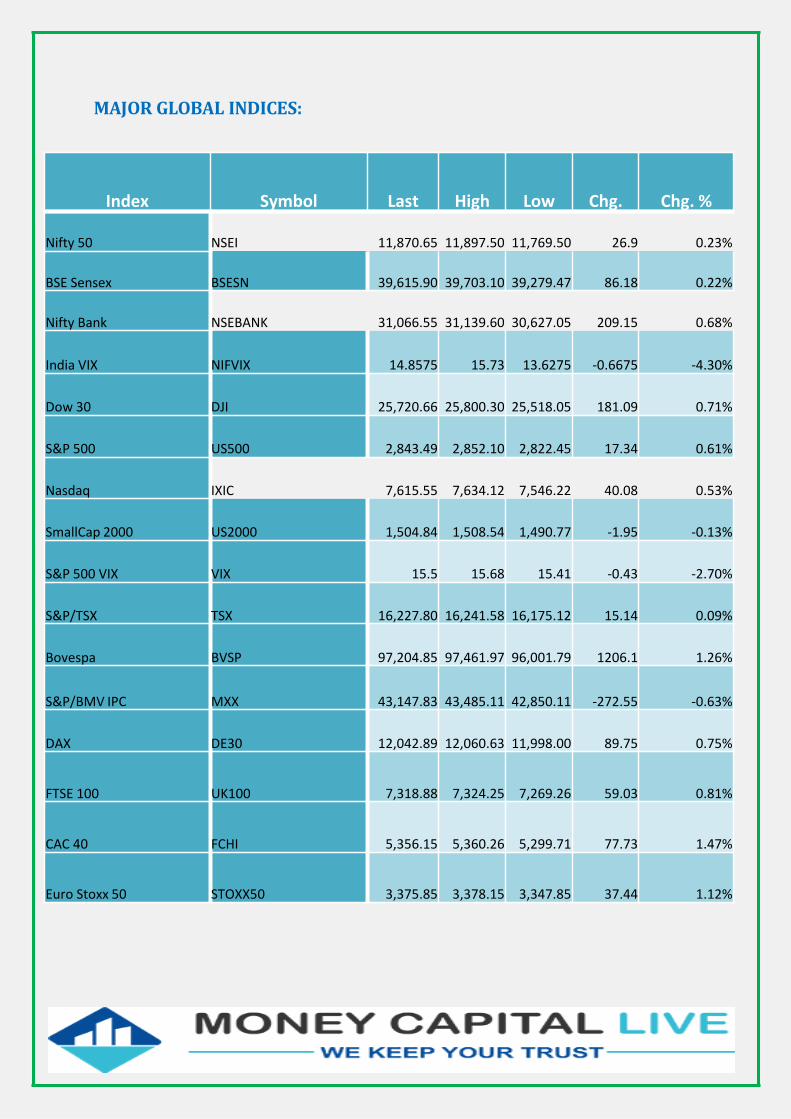
MAJOR GLOBAL INDICES:
Index Symbol Last High Low Chg. Chg. %
Nifty 50 NSEI 11,870.65 11,897.50 11,769.50 26.9 0.23%
BSE Sensex BSESN 39,615.90 39,703.10 39,279.47 86.18 0.22%
Nifty Bank NSEBANK 31,066.55 31,139.60 30,627.05 209.15 0.68%
India VIX NIFVIX 14.8575 15.73 13.6275 -0.6675 -4.30%
Dow 30 DJI 25,720.66 25,800.30 25,518.05 181.09 0.71%
S&P 500 US500 2,843.49 2,852.10 2,822.45 17.34 0.61%
Nasdaq IXIC 7,615.55 7,634.12 7,546.22 40.08 0.53%
SmallCap 2000 US2000 1,504.84 1,508.54 1,490.77 -1.95 -0.13%
S&P 500 VIX VIX 15.5 15.68 15.41 -0.43 -2.70%
S&P/TSX TSX 16,227.80 16,241.58 16,175.12 15.14 0.09%
Bovespa BVSP 97,204.85 97,461.97 96,001.79 1206.1 1.26%
S&P/BMV IPC MXX 43,147.83 43,485.11 42,850.11 -272.55 -0.63%
DAX DE30 12,042.89 12,060.63 11,998.00 89.75 0.75%
FTSE 100 UK100 7,318.88 7,324.25 7,269.26 59.03 0.81%
CAC 40 FCHI 5,356.15 5,360.26 5,299.71 77.73 1.47%
Euro Stoxx 50 STOXX50 3,375.85 3,378.15 3,347.85 37.44 1.12%

WEEKLY GAINERS:
WEEKLY LOSERS:
CompanyPrev Close (Rs)
Current Price (Rs) % Change
Coal India 253.50 265.55 + 4.75
Bharti Infratel Ltd. 269.00 279.65 + 3.96
Hero MotoCorp 2,680.25 2,762.80 + 3.08
Wipro Ltd 286.40 295.05 + 3.02
Titan Company 1,235.75 1,268.95 + 2.69
CompanyPrev Close (Rs)
Current Price (Rs) % Change
GAIL (India) Ltd. 361.00 313.85 -13.06
Indiabulls Housing F 786.55 731.10 -7.05
YES Bank Ltd. 147.80 139.90 -5.35
Zee Entertainment En 357.45 340.20 -4.83
Hind. Petrol 324.25 311.40 -3.96
www.ripplesadvisory.com
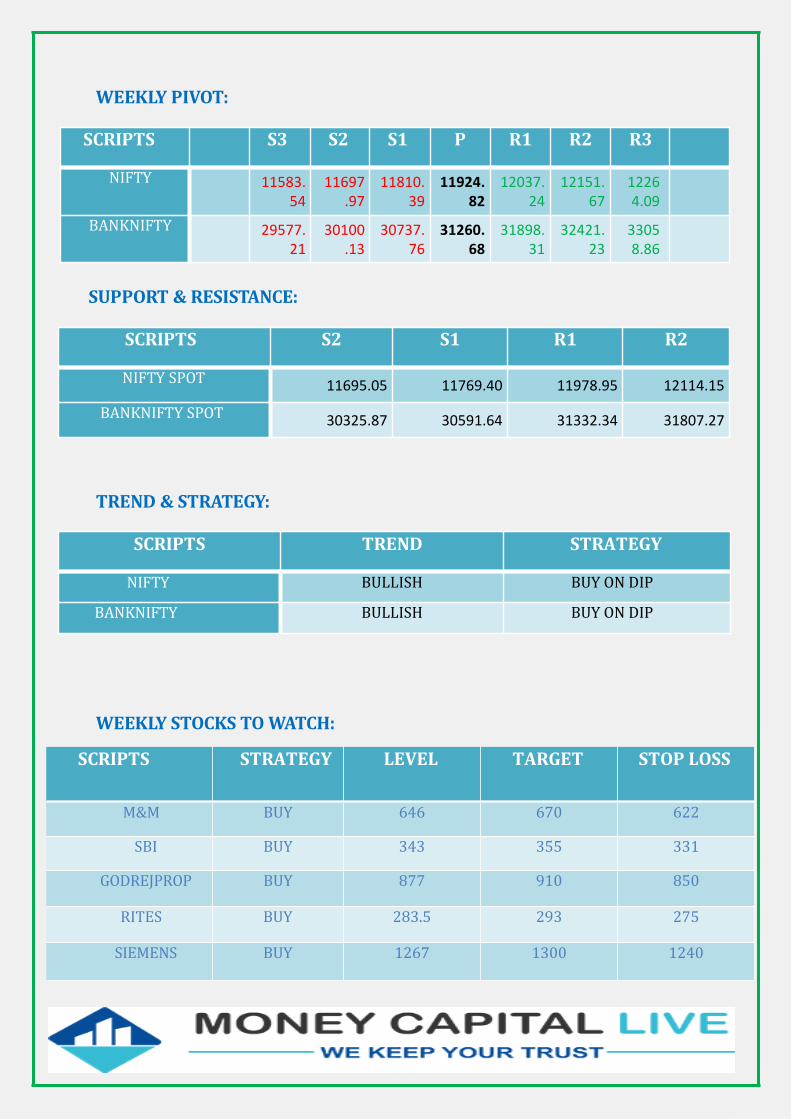
WEEKLY PIVOT:
SUPPORT & RESISTANCE:
TREND & STRATEGY:
WEEKLY STOCKS TO WATCH:
SCRIPTS S3 S2 S1 P R1 R2 R3
NIFTY 11583.54
11697.97
11810.39
11924.82
12037.24
12151.67
12264.09
BANKNIFTY 29577.21
30100.13
30737.76
31260.68
31898.31
32421.23
33058.86
SCRIPTS S2 S1 R1 R2
NIFTY SPOT 11695.05 11769.40 11978.95 12114.15
BANKNIFTY SPOT 30325.87 30591.64 31332.34 31807.27
SCRIPTS TREND STRATEGY
NIFTY BULLISH BUY ON DIP
BANKNIFTY BULLISH BUY ON DIP
SCRIPTS STRATEGY LEVEL TARGET STOP LOSS
M&M BUY 646 670 622
SBI BUY 343 355 331
GODREJPROP BUY 877 910 850
RITES BUY 283.5 293 275
SIEMENS BUY 1267 1300 1240

CHART ANALYSIS
NIFTYSPOT:-

DISCLAIMER
The information and views in this report, our website & all the service we provide are believed to be reliable, but wedo not accept any responsibility (or liability) for errors of fact or opinion. Users have the right to choose theproduct/s that suits them the most. Investment in Stocks has its own risks. Sincere efforts have been made to presentthe right investment perspective. The information contained herein is based on analysis and up on sources that weconsider reliable. We, however, do not vouch for the accuracy or the completeness thereof. This material is forpersonal information and we are not responsible for any loss incurred based upon it & takes no responsibilitywhatsoever for any financial profit s or loss which may arise from the recommendations above. The stock priceprojections shown are not necessarily indicative of future price performance. The information herein, together withall estimates and forecasts, can change without notice. money capital live. does not purport to be an invitation or anoffer to buy or sell any financial instrument. Analyst or any person related to money capital live. might be holdingpositions in the stocks recommended. It is understood that anyone who is browsing through the site has done so athis free will and does not read any views expressed as a recommendation for which either the site or its owners oranyone can be held responsible for. Any surfing and reading of the information is the acceptance of this disclaimer
Our Clients (Paid or Unpaid), any third party or anyone else have no rights to forward or share our calls or SMS orReport or Any Information Provided by us to/with anyone which is received directly or indirectly by them. If foundso then Serious Legal Actions can be taken. Any surfing and reading of the information is the acceptance of thisdisclaimer.