Embed Size (px)
Citation preview

Pozzolanic Reactivity Study of Flyash R.J . LEONARD, Assistant Professor of Civ i l Engineering, University of Delaware, and D. T. DAVIDSON, Professor of Civi l Engineering, Iowa Engineering Experiment Station, Iowa State College
In recent years much interest has been shown in soil stabilization methods uti l izing the pozzolanic reaction. L ime-flyash stabilization is probably the best known and most thoroughly investigated of these methods. Unfortunately, l i t t le is known of the nature of the reaction or reactions involved, or of the reaction products that are formed. This information is needed fo r evaluating the reactants and improving the reaction.
This paper describes a program of basic research on the nature of the pozzolanic reaction between lime and f l y -ash. Six flyashes of various physical and chemical properties were investigated. The reaction between the f l y -ashes and calcium hydroxide was followed by means of an electroconductivity procedure. The reaction was studied at several temperatures and f o r several concentrations. The reaction products were investigated by means of x - ray diffract ion and differential thermal analysis techniques.
Calcium hydroxide absorption tests, using electroconductivity procedures, onflyashes gave essentially the same evaluation results as those obtained f r o m compressive strength results. The influence of temperature on the re action was most significant in the 20 to 60 deg C range. A crystalline reaction product was detected, but this may be a secondary product.
An explanation is offered f o r the mechanism of the pozzolanic reaction. The rate l imi t ing step of the reaction is explained on the basis of diffusion.
9 D U E TO increased interest in pozzolans f o r soil stabilization and other purposes, there have been many investigations of certain materialspossessingpozzolanic activity. (The t e rm pozzolanic activity i s used to describe the ease with which lime reacts at ordinary temperature with any natural or a r t i f i c i a l siliceous or aluminous material in the presence of water to f o r m stable, insoluble compoimds possessing cementing proper t ies . ) For largely economic reasons flyash has received much attention and study as a pozzolan. However, the majori ty of the investigations have dealt only with the strength contributing properties of the flyashes and not with the fundamental chemical aspects of the pozzolanic reaction.
Basic studies of the pozzolanic activity of flyashes and other pozzolanic materials are necessary f o r both practical and theoretical reasons. Explanations f o r the behavior of a given flyash under given f i e l d conditions, such as density and temperature, are of practical importance. Theoretically, i f the mechanism and the nature of the reaction products were better known, i t might be possible to improve the reaction.
A few basic studies have been made of pozzolans (9, 10, 13). Among these studies. Lea {9, 10) and Moran and Gil l i land (14) are noteworthy. Many of the basic concepts of pozzolanic activity postulated by Lea over twenty years ago have not been improved upon. Lea theorized that the reaction was a surface reaction between the dissolved l ime and the solid resultant product. He also stated that equilibrium would not be reached except after long periods of t ime.
Many of the factors that influence the pozzolanic reaction have been recognized, but have not been investigated thoroughly. Recognized factors of the pozzolanic reaction are: temperature, nature of the pozzolan, surface area, carbon content, a lkal i and
1
sulfate content, carbon dioxide, hydrogen ion concentration, l ime variables, including the calcium to magnesium ratio moisture and t ime.
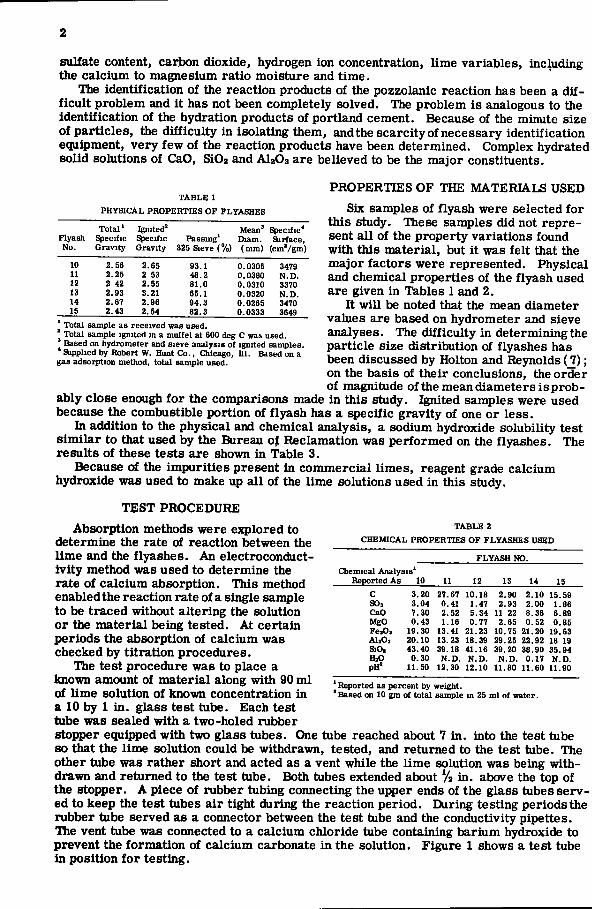
The Identification of the reaction products of the pozzolanic reaction has been a d i f f i cu l t problem and i t has not been completely solved. The problem is analogous to the identification of the hydration products of portland cement. Because of the minute size of particles, the d i f f icul ty in isolating them, and the scarcity of necessary identification equipment, very few of the reaction products have been determined. Complex hydrated solid solutions of CaO, SiOs and AI2O3 are believed to be the major constituents.
T A B L E 1
PHYSICAL PROPERTIES O F FLYASHES
Total' Ignited^ Mean^ Eiiecific* Flyash Specific Specific Passing' Diam. Surface, No. Gravity Gravity 325 Sieve (%) (mm) (cmVgm)
10 2.56 2.65 93.1 0.0305 3479 11 2.25 2 53 48.2 0.0380 N.D. 12 2 42 2.55 81.0 0.0310 3370 13 2.93 3.21 65.1 0.0320 N.D. 14 2.67 2.96 94.3 0.0265 3470 15 2.43 2.54 82.3 0.0333 3649
PROPERTIES OF THE MATERIALS USED
Six samples of flyash were selected fo r this study. These samples did not represent a l l of the property variations found with this material , but i t was fe l t that the major factors were represented. Physical and chemical properties of the f lyash used are given in Tables 1 and 2.
I t w i l l be noted that the mean diameter values are based on hydrometer and sieve analyses. The di f f icul ty in determining the particle size distribution of flyashes has been discussed by Holton and Reynolds (J7); on the basis of their conclusions, the order of magnitude of the mean diameter s i s prob
ably close enough f o r the comparisons made in this study. Ignited samples were used because the combustible portion of flyash has a specific gravity of one or less.
In addition to the physical and chemical analysis, a sodium hydroxide solubility test s imi lar to that used by the Bureau of Reclamation was performed on the flyashes. The results of these tests are shown i n Table 3.
Because of the impuri t ies present in commercial l imes, reagent grade calcium hydroxide was used to make up a l l of the l ime solutions used in this study.
I Total sample as received was used. ^ Total sample ignited in a muffel at 600 deg C was used. ' Based on hydrometer and sieve analysis of ignited samples.
Supplied by Robert W. Hunt Co . , Chicago, L I . Based on a gas adsorption method, total sample used.
TEST PROCEDURE T A B L E 2
CHEMICAL PROPERTIES O F FLYASHES USED
FLYASH NO. Chemical Analysis'
10 11 13 14 C 3.20 27.67 10.18 2.90 2.10 15.59 S03 3.04 0.41 1.47 2.93 2.00 1.86 CaO 7.30 2.52 5.34 11 22 8.36 6.89 MgO 0.43 1.16 0.77 2.65 0.52 0.85 FejOs 19.30 13.41 21.23 10.75 21.20 19.63 AhOs 20.10 13.23 18.39 29.25 22.92 18 19 SiOi 43.40 39.18 41.16 39.20 38.90 35.94 H2O 0.30 N.D. N.D. N.D. 0.17 N.D. PH' 11.50 12.30 12.10 11.80 11.60 11.90
Absorption methods were explored to determine the rate of reaction between the l ime and the flyashes. An electroconduct-Ivl ty method was used to determine the rate of calcium absorption. This method enabled the reaction rate of a single sample to be traced without altering the solution or the material being tested. At certain periods the absorption of calcium was checked by t i t ra t ion procedures.
Hie test procedure was to place a known amount of material along with 90 m l of l ime solution of known concentration in a 10 by 1 i n . glass test tube. Each test tube was sealed with a two-holed rubber stopper equipped wi th two glass tubes. One tube reached about 7 i n . into the test tube so that the lime solution could be withdrawn, tested, and returned to the test tube. The other tube was rather short and acted as a vent while the l ime solution was being wi th drawn and returned to the test tube. Both tubes extended about % i n . above the top of the stopper. A piece of rubber tubing connecting the upper ends of the glass tubes served to keep the test tubes air tight during the reaction period. During testing periods the rubber tube served as a connector between the test tube and the conductivity pipettes. The vent tube was connected to a calcium chloride tube containing barium hydroxide to prevent the formation of calcium carbonate in the solution. Figure 1 shows a test tube in position f o r testing.
' Reported as percent by weight. 'Based on 10 gm of total sample m 25 ml of water.

T A B L E 3
P E R C E N T REDUCTION IN ALKALINITY OF THE FLYASHES
Flyash No. Percent Reduction in Alkalinity, R^
10 62.80 11 39.36 12 50.60 13 61 34 14 59.79 15 56.17
Ba[OH]-
Because of the dpcrease in solubility of Ca(0H)2 with increased temperature and alkalinity, the concentration of Ca(0H)2 solutions used were well below the maximum solubility values. This was done to insure against the precipitation of Ca(0H)2 in the test tube during the reaction period. Concentrations of about 1 .1, 1.0, 0.9 and0.8 gm per l i te r were used fo r reaction temperatures of 20, 40, 60 and 80 deg C respectively. At f i r s t deionized water was used to make up the solutions, but later i t was found that more satisfactory solutions could be made by double f i l t e r ing Ca(OH)2 solutions made with disti l led water. Fi l ter ing was necessary to remove small amounts of CaCOs which was formed by calcium combining with small amounts of CO2 in the dist i l led water.
After f i l t e r ing , the concentrations of the Ca( OH) 2 solutions were checked by t i t ra t ion methods.
Test tubes were escposedto concentrated Ca( OH) 2 solutions at the specified temperature before being used. A check of the r e actions by electroconductivity methods showed very l i t t l e reaction between the p re -treated glass and Ca(0H)2.
The samples were placed in constant temperature baths and ovens. Constant
temperature baths were used to maintain reaction temperatures of 2 0 ± l d e g C and 40 + 1 deg C. Ovens were used to maintain the higher temperatures of 6 0 ± 1 degC and 8 0 + l d e g C .
Cementation of particles of the reactive material had to be prevented so that the complete sample would remain exposed. In order to prevent cementation the samples were rodded and shaken frequently during the testing period.
Conductivity readings were taken at specified intervals by means of a pipette type conducticity cel l (Cenco 700-72). The cell was part ial ly encased in a small water tight plastic box ( F i g . 1 ) . Water f r o m the constant temperature bath was pumped through the box to insure a constant temperature during the conductivity reading operation. Samples in the constant temperature baths were tested at their respective temperatures, whereas samples f r o m the ovens were placed in the 40 + 1 deg C bath and tested at this t emperature .
The set-up fo r testing a sample is shown in Figure 1. Conductivity readings were taken using a nul l point conductivity bridge ( Indust r ia l Instruments Type RC16 B ) . Readings were taken at 1,000 cycles per sec in order to prevent r e actions at the electrodes. A l l a i r coming in contact with the solution passed through calcium chloride tubes containing barium hydroxide to prevent the formation of calcium carbonate during the testing period. Immediately after testing, the 60 and 80 deg C samples were placed in their respective ovens. About two hours was required f o r the oven samples to reach the bath temperature and be tested and returned to the oven.
Cell constants of the conductivity pipettes were determined using K C l solutions of known specific conductance. Curves giving the relationship between measured resistances and Ca(OH) 2 concentrations were prepared f o r each testing temperature. Specif i c conductivity data given by Lea {10) f o r Ca(0H)2 solutions were uti l ized f o r these curves.
Conductivity pipette Leods to conductivity
bridge
Test tube in position
-Water both
Figure 1. Calcium abBorptian test apparatus in position for testing.

For a given reaction temperature, three test tubes of each material were prepared. These samples were used to obtain a set of average readings fo r the in i t ia l reaction period and to provide samples f o r testing the solutions at given time intervals, usually 15, 30 and 45 days after being exposed to the solid material . At the end of the given time intervals, a sample was removed and judiciously f i l te red to separate the solution f r o m the solid material . The lime concentration of each f i l t e red solution was determined by means of Versenate t i t rat ions. The solid material was oven dried at 60 deg C in contact with barium hydroxide to prevent the formation of calcium carbonate.
DISCUSSION OF RESULTS
Three gram samples of each flyash were allowed to react with Ca(OH)2 solutions at 20 deg C f o r a period of one year. The absorption of l ime was followed by electroconductivity methods and checked by Versenate titrations at 90, 180 and 365 days. The values obtained by these two methods checked to within 5 percent. The results of these absorption tests are shown in Figures 2 and 3.
Flyash 10 absorbed the most lime over the 365 day test period and also had the highest rate of l ime absorption. The differences between the flyashes were less apparent at the end of the test period than in the in i t ia l stages because of the original concentration factor . The absorption by flyash 11, the high carbon flyash, was p a r t i cularly slow during the in i t ia l period, but at the end of 365 days i t had absorbed approximately the same amount of l ime as samples 12, 13, 14 and 15. The amounts absorbed were l imited by the amount of calcium put into solution. Thus, the major differences between the flyashes at this temperature were shown most readily during the in i t ia l l ime absorption testing period of about 45 days.
It w i l l be noted that negative values of lime absorption were observed. These negative values can be explained by the solubility of compounds in the flyash and perhaps by cation exchange. Sodium, magnesium and calcium compoimds reported in flyashes are soluble in part ia l ly saturated Ca(OH)2 solutions. According to Lerch (12), alkali solutions cannot exist in equil ib r ium with saturated lime solutions. Refe r r ing to Table 2, i t i s seen that flyash 13 has the largest amount of calcium and
Figure 2 . Absorption of calcium by flyash samples 10, 11 and 12 at 20 deg C over a
one year period.
magnesium compoimds, 13.87 percent (reported as oxides); the greatest amount of negative absorption is observed with sample 13. Sample 11 has the smallest amount of calcium and magnesium oxides, 3.68 percent, and only a slight amount of negative absorption was observed f o r sample 11 . Samples 10, 12, 14 and 15 had approximately the same amounts of calcium and magnesium compounds, 7.73, 6.11, 8.88 and 7.45 percent respectively, and these have intermediate negative absorption values.
If the absorption results are compared with the compressive strength results shown in Figure 4, i t w i l l be noted that the in i t ia l 45 day absorption results seem to agree with the compressive strength results. In some cases the compressive strength and absorption curves are very s imi lar in shape. The corresponding s imi la r i ty between the slopes of the compression curves and the absorption curves is par t icular i ly s t r ik ing.
Figure 3. Absorption of calcium by flyash samples 13, l l ^ and 15 at 20 deg C over a
one year period.

It i s evident that flyash 10 is the best pozzolan cn the basis of compressive strength and lime absorption. The second best pozzolan appears to be sample 12; this conclusion is reached f r o m both the absorption and the compressive strength results. Sample 15 had a rather f la t and constant slope in both absorption and compressive strength curves. Sample 11 did not achieve an apparent equilibrium unt i l after about
300 days. The very shallow constant slope of the absorption curve for sample 11 agrees very well with the slope of the strength curve fo r this f lyash.
From the compressive strength and absorption data i t appears that a quantitative or semi-quantitative relationship exists between calcium absorption by flyash and its compressive strength in l ime-flyash
Figure k. Ifticonfined coirpresslve strengths of four flyash mortars with 8 percent Ca(0H)2 cured at 20 deg C (^). Strengths are for 2 i n . diameter hy 2 i n . specimenB at near standard Proctor density which were moist cured at 20 deg C for indicated times, then Iimnersed in water Zh hours
before testing.
Sl20
2 4 6 e 10 12
Mammum absorbtlon roll > 10*, g of Co |OH{^ of sompta/dsy mixtures. By comparing the maximum slope of the compressive strength curves to the maximum slope of the absorption curves in the figures previously discussed, the relationship given in Figure 5 was obtained. The relationship given in this f i g ure is significant in that i t indicates a correlation between absorption and strength; however this relationship i s l ikely to vary with temperature and concentration factors and other physical factors . If a relationship is to be established i t should be on the basis of standardized tests.
Figure 5- Maximum rate of conrpresslve strength development versus maximum rate of Ca(0H)2 absorption based on stand
ardized t e s t s .
15 20 25 Time In doys
Figure 6. Absorption of calcium at 20 deg C by flyash samples 10. 11 and 12 (3 gm
saniples).
INFLUENCE OF TEMPERATURE
Each sample of f lyash was tested by means of the lime absorption method at 20, 40, 60 and 80 deg C. The results of these tests are shown in Figures 6 through 13.
Although 20 deg C absorption curves f o r the six flyashes have been discussed previously, the cui^es presented in Figures 6 and 7 represent another set of test data. One day readings are shown in these curves. I t w i l l be noted that there was an apparent in i t i a l absorption of calcium before the negative absorption that was evident in Figures 2 and 3. There are two plausible explana-

15 20 25 30 Time in doyt
Figure 7. Absorption of calcium at 20 deg C by flyash Bamples 13, ik and 15 (3 gm
sasiples).
15 20 25 30 Time in days
Figure 8. Absorption of calcium at hO deg C by flyash samples 10. 11 and 12 (3 gm
samples). lions f o r the in i t i a l up-take of calcium. Possibly i t is due to an ion exchange reaction, such as calcium ions replacing other ions in the f lyash. Another possibility i s that i t is due to charge deficiencies that exist with the flyash as a consequence of i t non-crystalline glassy nature.
The influence of temperature on the rate of absorption of Ca(OH)2 by the flyashes was very pronounced with a l l flyashes. In a l l cases, after in i t i a l reactions, the rate of absorption increased with temperature. After examining these figures, i t is obvious that the pozzolanic reaction or reactions observed were endothermic reactions, that is, f lyash Ca(OH)2, and H2O pozzolanic reaction products. Increasing the amount of heat drives the reaction faster to the r ight . This increase in reaction rate due to an increase in temperature has been termed the Arrhenius effect (6).
It w i l l be noted that the periods of in i t i a l and negative absorption decrease as the temperature increases. At 60 deg C very
„ short periods of negative absorption were observed. Neither in i t i a l reactions or negative absorptions were evident during the 80 deg C test period. A l l curves at 80 deg C have the same shape and the maximum ordinates are essentially the same. High temperature results are of l i t t le use fo r the selection of desirable pozzolans because of the rapidity of the reaction.
-
— 0 * 13
1 1 1 1 1 1
10 15 20 25 30 Time in days
35 40 45
1 ' ^
8
Figure 9. Absorption of calclxmi at 1+0 deg C by flyash samples 13. l ^ ^ and 15 (3 gm
saniples;.
The curves shown in Figure 14 i l l u s trate the over-a l l effect of the temperature range used on the six flyashes studied. Because of the in i t i a l reactions and solub i l i ty effects observed, the times given f o r one-half of the original Ca(0H)2 concentrations to be depleted are not true half ILfes. By means of Figure 14 i t is possible to estimate the effect of temperature on the pozzolanic reaction for the flyashes beyond the range of temperature used in this study. Relatively speaking, l i t t le was gained by raising the reaction temperature above 50 deg C. However,
_ n U 0 0 0
-n a ' »>• —
^ 1 0 — 8 — 0 — ^
J 1 1 L _ 1 20 25 30
Time in days 35 40 45
Figure 10. Absorption of calcium at 60 deg C by flyash samples 10, 11 and 12
(3 gm saarples).

^16
u
•84
-
1 1 . - 1 1 1
" 0 5 10 15 20 25 30 35 40 45 Time in days
Figure 11. Absorption of calcium at 6o dfig C by flyash samples 13, I't and 15
(3 gm samples).
15 20 25 30 35 40 45 Time in dayt
Figure 12. Absorption of calcium at 80 deg C by flyash samples 10, 11 and 12
(3 gm sanqples).
between 20 and 50 deg C the influence of temperature on the reactions was quite noticeable. Only at temperatures less than 50 deg C was i t possible to distinquish between the flyashes f r o m their absorption rates. The curves shown in Figure 14 asymptotically approach time inf ini ty as the temperature decreases below 20 deg C. For p rac t i cal purposes, at temperatures below 20 deg C most of the flyashes can be assumed to be almost non-reactive.
Compressive strengths of l ime-flyash mortars at 60 deg C using four of the six f l y ashes are shown in Figure 15. The strength differences between the flyashes at this temperature are more pronounced than at 20 deg C ( F i g . 4 ) . F rom the figure i t is
noted that samples 10 and 11 are respectively the most satisfactory and the most unsatisfactory pozzolans; this is also the case when the mortars were cured at 20 deg C. Unlike the compressive strengths at the 20 deg C curing temperature, a l l samples reached about 90 percent of their strengths in about seven days. From F i g -
is 20 25 30 35 40 45
Time in doys
Figure 13. Absorption of calcium at 80 deg C by flyash samples 13, l'*- and 15
(3 gm santples).
ures 10 and 11, i t can be seen that the major portion of the lime absorption occurred within the f i r s t ten days. The rates of in i t ia l strength gains correspond with the rates of in i t ia l calcium absorption for each flyash. However, the maximum ordinates of the absorption curves are nearly the same, due to calcium depletion whereas the maximum ordinates of the compressive strength curves are considerably different . Hierefore, i t i s evident that there i s a relationship between the absorption of lime and the compressive strength, but the total strength development of lime-pozzolan mortars is dependent on factors in additions to the pozzolanic reaction.
INFLUENCE OF PARTICLE SIZE ON THE REACTION
The influence of particle size on the reaction was studied by using material passing the number 200 sieve (0.074 mm) and the number 325 sieve (0.044 mm) f r o m flyashes
50 SO 70 so 90 100 110 ItO 130 HO T I m t In d d y »
Figure ik. Effect of temperature on time required for one-half of Ca(0H)2 to be
absorbed.

rooo
• i s o o
1200
to a 90 T l i M l i t i a n
Figure 15. Uaconflned compressive strengths of four flyash mortars with 8 percent Ca.(,aE)^ cured at 60 deg C (^). Strengths ere tor 2 In. diameter by 2 i n . specimens at near standard Proctor density which were moist cured at 60 deg C for indicated times, then immersed i n water
Zh hours before testing.
The major i ty of the larger particles i n flyashes are composed of unburned coal and coke which is reported as loss-on-ignition in Table 4. From this table the decrease in organic content with grain size is very evident. The larger flyash p a r t i cles are not very active. Also, the larger particles have low specific gravity, less
10 and 11 . Flyash 10 was used because a l l tests indicated i t was the most reactive flyash of the six tested, whereas flyash 11 was used because a l l tests indicated i t was unsuitable as a pozzolan. Ca(0H)2 solutions used at each temperature were of equal concentrations. Three gram samples were used.
Figures 16 and 17 are two sets of curves given to illustrate the influence of particle size on Ca{ OH) 2 absorption at a given temperature. Practically speaking, there was l i t t le difference between the rates of absorption and the maximum amounts of absorption f o r the different fractions at a given temperature.
An increase in reaction rate with i n creasing surface area was not evident in these tests; this may be explained on the basis of another property of the flyashes.
« 16
o »
l o u •S 4
- jv-O-*' " ~ °
1
1 Total tomple 2 Passing no 2 0 0 3 Passing no. 32 5
- J 1 1 1 1
sieve sieve
J 1 15 20 25
Time in days 30 35 40 45
116
r 1 Total somple 2 Passing no. 200 sieve 3 Potsing no 32 5 sieve
Figure l 6 . Influence of grain size of flyash sample 10 on calcium absorption
at 1̂ 0 deg C.
than 1.0. Hence, there was l i t t le change in the amount of active surface area p re sent when the particle size samples used were compared on the basis of weight. Although the presence of organic material had l i t t le effect on the chemical activity of the flyashes, there is reason to believe that i t influences the compressive strength results; this w i l l be discussed later .
INFLUENCE OF THE U M E -FLYASH RATIO
The influence of the l ime-f lyash ratio on the reaction was studied by decreasing sample weights one-half while keeping Ca( OH) 2 concentrations constant. The
curves obtained had essentially the same characteristicsasthe 3gram sample curves. However, at any t ime interval, the amount of Ca(OH)2 absorbed per gram by the 1̂ /2 gram samples was nearly twice that absorbed by the 3 gram samples. Hie influence of concentration on the reaction w i l l be discussed on the basis of diffusion later in th i s report .
Time
Figure 17. Influence of grain size of flyash sample 11 on calcium absorption
at kO deg C.
9
T A B L E 4
INFLUENCE O F P A R T I C L E SIZE ON LOSS-ON-IGNITION
Percent increases in compressive strengths due to doubling the amount of Ca(OH)2 at two temperatures are shown in Tables 5 and 6. At 20 deg C negative values were obtained f o r some of the 7 and 14 day test periods. This probably indi cates that cementation had not taken place to a significant extent during the test period and that the Ca( OH) 2 decreased the shear strength by acting as a lubricant during the
in i t i a l period. Although a l l of the 45 daypercenta^e increases in compressive strengths are positive they are erratic and do not correspond to the increases in absorption. The compressive strengths of the l ime-flyash mixtures increased with increasing amounts of Ca( OH) 2, but the amount of increase was dependent on other factors in addition to absorption factors.
Size Fraction Percent Loss on-lgnition Finer Hian Flyash 10 Flyash 11
0.420 mm 3.20 27.67 0.074 mm 2 34 19.55 0.044 mm 2.11 10.32
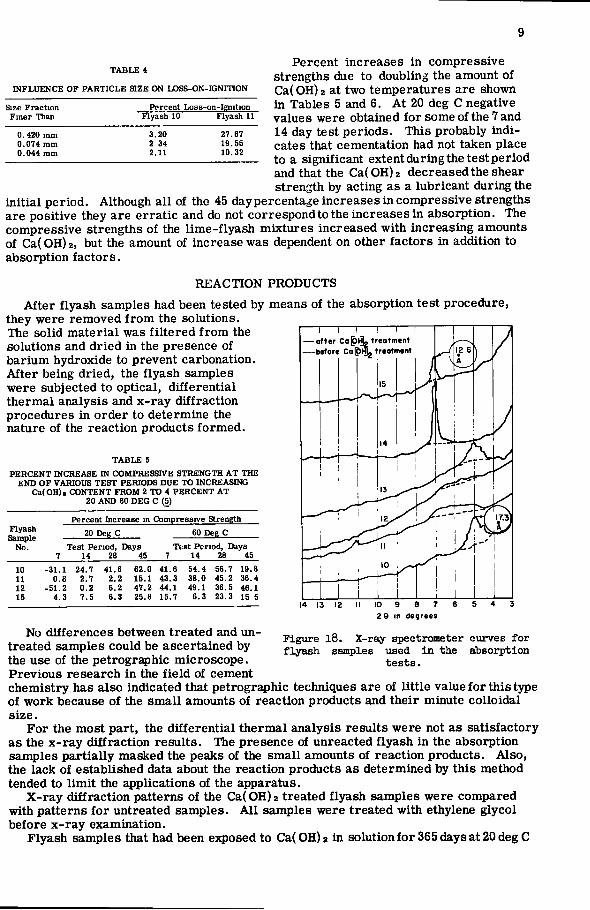
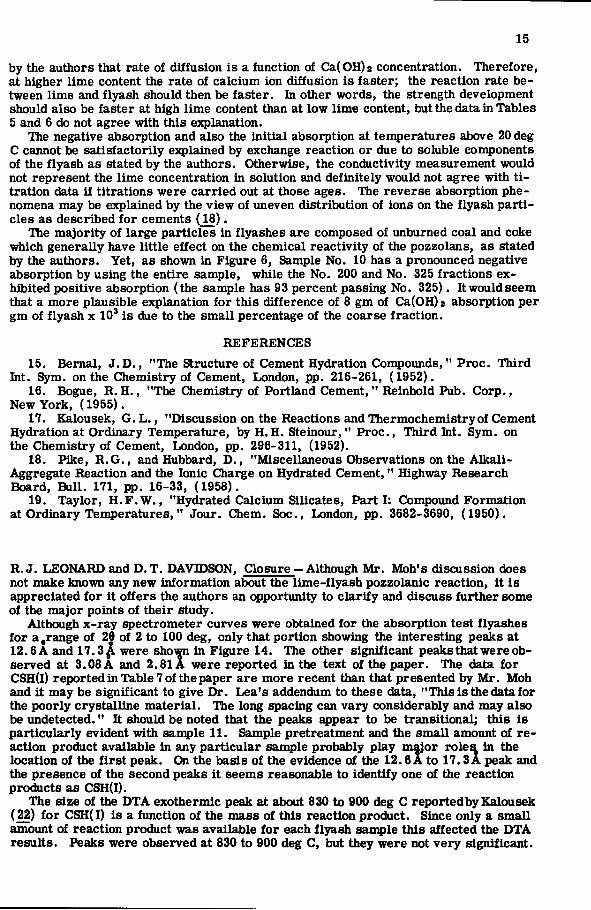
REACTION PRODUCTS
Af te r flyash samples had been tested by means of the absorption test procedure, they were removed f r o m the solutions. The solid material was f i l t e red f r o m the solutions and dried in the presence of barium hydroxide to prevent carbonation. Af te r being dried, the flyash samples were subjected to optical, differential thermal analysis and x- ray diffract ion procedures in order to determine the nature of the reaction products formed.
T A B L E 5
P E R C E N T INCREASE IN COMPRESSIVE STRENGTH A T THE END O F VARIOUS T E S T PERIODS DUE TO INCREASING
Ca(0H )2 CONTENT FROM 2 TO 4 P E R C E N T AT 20 AND 60 D E G C (5)
Flyash Sample
No.
Percent Increase in Compressive Strength
20 Deg C 60 Dee C
Test Period, Days 14 28 45
Test Period, Days 7 14 28 45
10 11 12 15
-31.1 24.7 0.8 2.7
-51.2 0.2 4.3 7.5
41.6 2.2 6.2 6.3
62.0 15.1 47.2 25.8
41.6 43.3 44.1 15.7
54.4 56.7 19.8 38.0 45.2 36.4 49.1 36.5 46.1
6.3 23.3 15 5
I i I treatment treatment
I I otter CoR)H
—before Co
14 13 12 10 9 8 7 2 6 in d e g r e e s
Figure l 8 . X-ray spectrometer curves for flyash samples used i n the absorption
t e s t s .
No differences between treated and untreated samples could be ascertained by the use of the petrographic microscope. Previous research i n the f i e l d of cement chemistry has also indicated that petrographic techniques are of l i t t le value fo r this type of work because of the small amounts of reaction products and their minute colloidal size.
For the most part, the differential thermal analysis results were not as satisfactory as the x- ray diffract ion results. The presence of unreacted flyash in the absorption samples part ia l ly masked the peaks of the small amounts of reaction products. Also, the lack of established data about the reaction products as determined by this method tended to l i m i t the applications of the apparatus.
X - r a y diffract ion patterns of the Ca(OH)2 treated fljrash samples were compared with patterns f o r untreated samples. A l l samples were treated with ethylene glycol before x- ray examination.
Flyash samples that had been exposed to Ca(OH)2 in solution f o r 365 days at 20 deg C

1 0
yielded x- ray diffract ion patterns that indicated a reaction product. The significant peaks obtained for the six fljrashes tested are shown in Figure 1 8 . The dotted lines indicate the x- ray diffract ion pattern obtained f r o m untreated samples of the same f l y ash. From the f igure, i t i s obvious that a reaction product was formed and that i t is crystalline, as shown by the definite peaks indicating an orderly arrangement of atoms. Two distinct spacings are shown in Figure 1 5 , one at 1 2 . 6 A and another at 1 2 . 3 A ; these spacings may be transitional as evidenced by the broad peaks obtained f r o m samples 1 1 and 1 2 . In addition to the peaks in Figure 18 , faint peaks were obtained for samples 1 0 and 1 4 at 29 deg. This corresponds to a spacing of about 3 . 0 8 A - Carbonate peaks that were obtained f r o m the untreated samples were not obtained f r o m the treated samples. Ca(0H)2 peaks were not obtained f r o m the x-ray diffract ion of the treated samples.
The x- ray diffract ion pattern obtained TABLE 6 lor the 365 day samples is s imilar to the
PERCENT INCREASE IN COMPRESSIVE STRENGTH AT THE two major peaks of calcium silicate hydrate END OF VARIOUS TEST PERIODS DUE TO INCREASING j . s n a o i n j s o f t h i s o n m n o u n d a r p ffivpn
ca(OH). CMNTENT FROM 4 TO 8 PERCENT AT ^' ^tte spacmgs 01 tnis compouno are given 20 AND 60 DEG c (5) ui Table 7. Calcium silicate hydrate I has
been studied and reported by several Flyash Sample
No.
Percent increase m Compressive Strength Flyash Sample
No. 20 DeK C 60 Deg C
Flyash Sample
No. 7
Test Period, Days 14 28 45
Test Period, Days 7 14 28 45
10 11 12 15
-3.7 -4.5 8.6
60.8
-10.8 6.0 11.0 9.8 15.8 30.0
34.4 12.5 18.2 32.0 33.4 40.3
6.9 17.6 19.0 36.6 11.7 21.2 17.7 27.3 25.4 34.4 78.0 86.0 45.9 39.9 39.6 73.1
investigators in connection with portland cement hydration products ( J , 1 1 ) . I t is frequently observed at temperatures below 100 deg C with various molar ratios of CaO to Si02 ( 2 ) . The diffuse scattering of x-rays by calcium silicate hydrate I has
T A B L E 7 POWDER X - R A Y DIFFRACTION PEAKS FOR
CALCIUM SILICATE HYDRATE I (J^) 0
d l^acings in A Relative Intensity 9-14 (highly variable) 10 3.06 10 2.81 8 1.83 8 1.67 4 1.53 2 1.40 4 1.17 1 1.11 2 1.07 1
been attributed to water. Previous research indicates that i t i s a layer type mineral s imi lar in structure to montmorillonite and other swelling clay minerals ( 2 ) . The basal reflections vary with the amount of water between the layers. Treatment of the samples with ethylene glycol permits a shift in the C-dimension of the mineral due to the absorption of the organic molecules between the individual layers. This usually results in sharper x- ray diffract ion peaks.
Examination of x- ray diffract ion patterns f o r the flyash samples f r o m the higher temperature absorption tests did not reveal a crystalline reaction product. Also, r e action product peaks were not observed in the diffract ion patterns f o r 2 0 deg C absorption samples that were removed f r o m the Ca(OH)2 solutions at 45 days and less. A l l absorption test results indicated that the reaction period f o r most samples was over at the end of 4 5 days. Furthermore, normally imder hydrothermal conditions, crystals grow in thickness with time and the largest crystal growths occur, though more slowly, at ordinary temperatures. Hence, i t appears that a crystalline product did not f o r m as the reaction proceeded and that the crystalline product developedfromanon-crystalline reaction product. This Intermediate product i s probably a gel. Aside f r o m the existence of regular atomic order in the calcium silicate hydrate crystal l i tes, there probably is l i t t le difference between the crystall i tes and the amorphous gels. According to Bemal (2), the size of the particles that make up some classical gels are well within the range of the calculated dimensions of calcium silicate hydrate I .
FACTORS AND MECHANISM OF THE REACTION
The presence of cementitious reaction products was proved indirectly by the compressive strength tests and the absorption tests. Apparently the compressive strength of l ime-f lyash mortars is dependent on the amount and number of contacts of the cementitious mater ia l . The presence of coke and other organic, non-reacting materials

T A B L E 8
K CONSTANTS FOR FLYASH SAMPLES
1 1
prevents contacts of the cementitious mate r i a l that fo rms on the surface of the poz-zolan and may be a gel that later fo rms a cyrstalline product.
H the desired cementitious product fo rms on the surface, i t follows that in order f o r any more reaction product to be formed, the necessary calcium must pass through the reacted layer to react with the enclosed pozzolan. Thus, the mechanism of the pozzolanic reaction is one of simultaneous diffusion and chemical reaction of the cal cium . The activity of the reacting material i s l imi ted by the rate of diffusion of calcium through the reaction product.
The mathematical theory of diffusion in isotropic substances, according to Crank ( 4 ) and Bar re r (_1) , i s based on the hypothesis that the rate of diffusion t h r o u ^ a unit area of section is proportional to the concentration gradient normal to the section, that is , dQ p. £ where dQ is the
d f " " " x dt rate of transfer per unit area of section, c is the concentration of the diffusing substance, X is the space coordinate measured
normal to the section, and D is called the diffusion coefficient. I t i s assumed that the ra te- l imi t ing step is diffusion of calcium through the reaction
zone. Hie reacting material i s assumed to be in the f o r m of a sphere. I t i s also assumed that the thickness of the reaction zone is negligible in comparison to the diameter of the reacting material so the surface can be considered a plane, and the following mathematical development can be made.
Ryash Sample
No.
Solution Temperature,
deg C
Constant K x 10' cm'/day/gm/liter
3gm Sample iVi gm Sample
10 20 5.88 16.52 40 7.37 21.50 60 9.80 37.40 80 14.15 55.40
11 20 1.43 3.25 40 3.02 9.60 60 6.10 20.60 80 8. S3 27.60
12 20 3.43 7.64 40 4.66 16.00 60 6.40 20.90 80 9.10 25.60
13 20 0.00 0.00 40 4.91 19.58 60 9.98 24.90 80 12.00 31.00
14 20 3.48 14.45 40 5.18 18.20 60 8.05 32.50 80 11.25 49.80
15 20 3.95 14.10 40 7.02 18.45 60 9.98 29.80 80 14.03 49.10
Let
If then
X = Q = V = c = Cb = R =
X =
thickness of reacting zone amount of Ca(OH)2 which has reacted/unit area molar volume of the product concentration of Ca(OH)2 at any time in i t i a l concentration of Ca(OH)a total amount of Ca(OH)2 reacting specific surface of solid
QV
dQ dt
D C DC = — = •
X QV The amount removed by reaction w i l l be V (Co
V (Co - C) = a QS
where a i s a "rat io of small whole numbers." Hence
C = C o - - 5 ^ = C o - p Q
where p = a ^
C ) . By reaction stoichiometry
hence dQ dt
thus D t V
D ( C o - PQ)

12
Expanding the equation by M a c L a u r i n ' s power s e r i e s the equation becomes
_ _ _ _ | ^ 0 + / 2 ^ - c ^ ^ - j + +^Co>/ n ^
H _ P Q i s l e s s than 0.1 then a l l t e r m s greater than the th ird t e r m a r e negligible. Co
Then Dt V
and Q
If K =
and R =
2Co
(t)
The following relationship i s obtained
R = K S (t) ^'
Assuming that the reacting part ic les are spher ica l in shape and heterogeneous, the
following equation may be used for the specif ic surface .
^ " 4-irr^X X r 3
where Y and r a r e , respectively, the specif ic gravity of the mater ia l and the mean radius of the reacting matter. Hence, the following relationship can be obtained
R = 3K(t ) '^ '
T h i s equation i s va l id only for c a s e s where the concentration i s high. The K values given in this report are for the in i t ia l portion of the reaction. The relationship for the lower concentrations can be developed using the adjustable parameters p and D instead of K .
Absorption data for the f lyashes in Ca( OH) 2 solutions satisf ied the relationship given previously since l inear plots of R v e r s u s ^ t ~ were obtained until the concentration of C a ( O H ) 2 dropped to about 0.1 g m / l i t e r . F r o m the slopes of these plots, average values of K were calculated. The K values obtained for the f lyash samples are given in Table 8.
The K values indicated a r e not diffusion coefficients, but they do indicate the trend of the diffusion coeff icients . It w i l l be noted, f rom Table 8, that the rate of diffusion increases with temperature. The relationship
log KCo = C i + ^
where T i s the absolute temperature, may be used to express the influence of temperature on the rate of diffusion. Secondly, the rate of diffusion was increased by d e c r e a s ing the amount of reacting sample while keeping the concentration of the Ca( OH) 2 constant.
It w i l l be further noted that the better f lyashes , a s determined by the other tests , also give the higher K values . Probably, this resu l t s f rom the fact that there i s normally more reactive mater ia l in these san9>les and they have a higher specif ic surface a r e a .
C O N C L U S I O N S
The rate of compress ive strength development by l lme- f lyash mortars i s direct ly related to the rate of l ime absorption of the f l yash . The greater the rate of l ime ab-

13
sorption, the greater the rate of compress ive strength development. The rate of l ime absorption i s l imited by the rate of diffusion of the ca lc ium through the reaction p r o duct. The rate of diffusion, which i s increased by increas ing the temperature and the l ime concentration, v a r i e s with the type of f lyash used. At temperatures l e s s than 20 deg C most f lyashes may be considered non-react ive.
The source of the strength of l ime- f lyash mortars i s the reaction products thatform as the result of the pozzolanic reaction. F r o m x - r a y diffraction studies, it appears that a crystal l ine product does not f o r m at f i r s t , but develops f r o m a non-crystal l ine reaction product. The in i t ia l product i s probably a gel . Hie f ina l crystal l ine product i s believed to be ca lc ium si l icate hydrate I , a reaction product that has been found in set Portland cement pastes .
Unbumed organic mater ia l that i s found in most f lyashes i s nonreactive with ca lc ium hydroxide and its presence seems to indicate a f lyash of coarse grain s ize in both the organic and inorganic phases . Since the total mortar strength developed depends on the number of contacts of the cementitious reaction products, the organic mater ia l breaks the continuity of this system and thus decreases the total strength.
A C K N O W L E D G M E N T S
The subject matter of this report was obtained a s part of the r e s e a r c h being done under Project 283-S of the Engineering Experiment Station of Iowa State College. T h i s project , entitled "The L o e s s and G l a c i a l T i l l Materials of Iowa; A n Investigation of D i e i r Phys i ca l and Chemica l Propert ies and Techniques for Process ing D i e m to Increase The i r Al l -Weather Stability for Road Construct ion," i s being c a r r i e d on under contract with the Iowa State Highway Commiss ion and under the sponsorship of the Iowa Highway Research Board and i s supported by funds supplied by the Commiss ion .
Thanks are given to D r . J . B . Sheeler and D r . R . L . Handy and other members of the Engineering Experiment Station for contributions to this investigation.
R E F E R E N C E S
1. B a r r e r , R ichard M . , "Diffusion In and Through So l ids ," Univ. of Cambridge P r e s s , Cambridge, (1951) .
2. B e r n a l , J . D . , "The Structures of Cement Hydration Compounds," P r o c . of the T h i r d Symposium on the Chem. of Cement, London, 1952:216-261, (1954) .
3. Bessey , G . E . , "The Est imation of F r e e Calc ium Hydroxide in Pozzolan M i x e s , " P r o c . of the F i r s t Symposium on the Chemistry of Cement, Stockholm, 1938:484-488, (1939) .
4. Crank, J . , "The Mathematics of Di f fus ion," Oxford on the Claredon P r e s s , London, (1956) .
5. Davidson, D . T . , Delbricfee, Norman C , J r . , and Sheeler, J . B . , "Reactivity of Four Types of F l y a s h e s with L i m e , " Highway R e s e a r c h Board, B u l l . 193, (1958) .
6. F r o s t , Arthur A . , and Pearson , Ralph G . , "Kinetics and Mechani sm," John Wiley and Sons, New Y o r k , (1953) .
7. Holton, W . C . , and Reynolds, Dana F . , J r . , "A Comparison of S ize -Cons i s t Determinations of Duplicate Samples of F l y a s h , " Combustion, 14:41-46, (1954) .
8. Klug, H . P . , and Alexander, L . E . , " X - r a y Diffraction Procedures for P o l y c r y -stalline and Amorphous M a t e r i a l s , " John Wiley and Sons, New Y o r k , (1954) .
9. L e a , F . M . , "The Chemistry of Pozzo lans ," P r o c . of the F i r s t Symposium on the Chemistry of Cement, Stockholm, 1938:460-490, ( 1 9 3 9 ) .
10. , "Investigation on Pozzo lans ," G r e a t Br i t ian Dept. of Scientific and Industrial Building and R e s e a r c h , T e c h . Paper No. 27, (1940) .
11. and Desch , C . H . , "The Chemistry of Cement and Concrete, " St. Martins P r e s s , New Y o r k , (1956) .
12. L e r c h , W. C , "Studies of Some Method of Avoiding E:g)ansion and Pattern Cracking Associated With the Alkali-Aggregate React ion ," A m . Soc. for Testing Mater ia l s , Spec. T e c h . P u b . , No. 99, pp. 153-178, (1950) .
13. Mielenz, R . C , Ramaley , D . , Benton, E . J . , and G e i e r , F . H . , "Pozzolans andCement-Pozzo lanReact ions ," U . S . Bureau of Reclamation, Petrographic laboratory Report No. 102, (1952) .

14
14. Moran, W. T . , and Gi l l i land, J . L . , "Summary of Methods for Determining Pozzolanic Act iv i ty ," A m . Soc. for Testing Mater ia ls , Spec. Tech . Pub. No. 99, pp. 109-131, (1950) .
Discussion Z . C . MOH, Massachusetts Institute of Technology — In the past few y e a r s considerable increase in the interest in using pozzolanic mater ia l s , both natural and synthetic, has led to the recognition of the importance of understanding the nature of the pozzolanic activity and the reaction products. The authors have made an important contribution in this respect . However, some of the conclusions described in the paper seem to be somewhat inconsistent with the data presented. The wri ter wishes to d i scuss these inconsistencies .
The authors interpreted the products of the reaction between lime and f lyash after one year a s ca lc ium si l icate hydrate I ( C S H - I ) based on their x - r a y diffraction pattern. However, the evidence, a s shown in F igure 18 ,o i s not conclusive. The x - r a y patterns revea l only the presence of one l ine, the 12.6 A l ine,which i s onlyo one of thegstrong l ines of C S H - I (Table 9 ) . The two strongest l ines of C S H - I , 3.06 A^and 2.80A {15j 16,_19), are not present in the authors' data. Furthermore , the 17.3 A of f lyash No. 10 does not correspond with any ca lc ium si l icate hydrate pattern reported in the l i terature . Moreover, C S H - I has a v e r y large exothermic peak at about 830 to 900 deg C on the D T A pattern ( 1 7 ) . The authors did not indicate such.
According to B o g u e T l S ) , Taylor {19), and others, the calc ium si l icate hydrates formed in a lime solution of concentration wel l below saturation are low in l ime . If one accepts the authors' interpretation of the end products a s C S H - I , this naturally would be the low l ime hydrous s i l icate , that i s , CaO- SiOs aq. The maximum lime absorption after one year at 20 deg C , a s reported in the paper, was 2 .5 gm Ca(0H)2 /gm of f lyash x 10* ( f lyash No. 10 in F i g . 2 ) . T h i s value i s equivalent to 0.0189 gm C a O / g m of f lyash . With CaO-to-Si02 ratio of one, this means only 0.0435 gm/gm of the f lyash was reacted ( f lyash No. 10 has 43.4 percent SiOs); that i s , only 4 percent of the pozzolan participated in the reaction in a period of one year . Furthermore , in
the authors' experiments the f lyash was prevented f rom cementation. Hie total surface a r e a exposed to the reaction would undoubtedly be much greater than that in a compacted l ime- f lyash mortar . In other words, if the experiments described rea l ly represent the type of reaction postulated by the authors in a l ime- f lyash mixture, it i s inconceivable that such a s m a l l percentage of reactants was able to bind a l l the fine part i c l e s providing f a i r l y high compress ive strength. (Although there are no strength data of mixtures with 2 to 4 percent l ime
T A B L E 9
X - R A Y DIFFRACTION PATTERNS O F CALCIUM S I U C A T E I
0 Relative References d Spacing m A Intensity Taylor (,15) 10.0 - 11.5 Strong
3.03 Very strong 2.80 Medium strong 1.81 Medium strong
Bogue (,19) 13.72 100 3.06 100 2.80 100
Bemal ( J ^ ) ' 10 - 15 7 Bemal ( J ^ ) ' 3.1 10 2.8 9
'Interpreted from ime diagram. presented in the paper, however, it can be deduced f r o m Figure 4 and from Tables 5
and 6 that the one-year strength of such mixtures would be fa i r ly high.) F u r t h e r m o r e , the decreases in strength (20 deg C) at 7 and 14 days by increasing
the ca lc ium hydroxide contents in the mixture ( T a b l e s 5 and 6) contradict the absorption data d iscussed. The increase in absorption by l ime at a l l curing ages would indicate to the wr i t er an increase in the total amount of reaction product at a l l curing ages. Hence, higher strength would be expected—as stated by the authors: "The strength of l i m e - f l y ash m o r t a r s i s dependent on the amount and number of contacts of the cementitious m a t e r i a l s . " Therefore , it seems l ikely that the absorption test i s not adequate to a c count for the proposed mechanism.
The authors explained the reaction rate on the bas i s of diffusion. It i s c l ear ly stated
15
by the authors that rate of diffusion i s a function of Ca(OH)g concentration. Therefore , at higher l ime content the rate of calc ium ion diffusion i s faster; the reaction rate between lime and f lyash should then be fas ter . In other words, the strength development should also be faster at high l ime content than at low l ime content, but the data in Tables 5 and 6 do not agree with this explanation.
The negative absorption and also the init ial absorption at temperatures above 20 deg C cannot be sat isfactori ly explained by exchange reaction or due to soluble components of the f lyash as stated by the authors. Otherwise, the conductivity measurement would not represent the l ime concentration in solution and definitely would not agree with t i tration data if titrations were c a r r i e d out at those ages. The r e v e r s e absorption phenomena may be explained by the view of uneven distribution of ions on the f lyash p a r t i c l e s a s described for cements (_18).
The majority of large part i c l e s in f lyashes are composed of tmburned coal and coke which generally have little effect on the chemical reactivity of the pozzolans, as stated by the authors. Yet , a s shown in F igure 6, Sample No. 10 has a pronounced negative absorption by using the entire sample, while the No. 200 and No. 325 fract ions exhibited positive absorption (the sample has 93 percent passing No. 325) . It would seem that a more plausible explanation for this difference of 8 gm of Ca(OH) 2 absorption per gm of f lyash x 10^ i s due to the s m a l l percentage of the coarse fract ion.
R E F E R E N C E S
15. B e m a l , J . D . , "The Structure of Cement Hydration Compounds," P r o c . T h i r d Int. Sym. on the Chemistry of Cement, London, pp. 216-261, (1952) .
16. Bogue, R . H . , "The Chemistry of Portland Cement ," Reinhold Pub. C o r p . , New Y o r k , (1955) .
17. Kalousek, G . L . , "Discussion on the Reactions and Thermochemistry of Cement Hydration at Ordinary Temperature, by H . H . Steinour, " P r o c , T h i r d Int. Sym. on the Chemistry of Cement, London, pp. 296-311, (1952).
18. P ike , R . G . , and Hubbard, D . , "Miscellaneous Observations on the A l k a l i -^ g r e g a t e Reaction and the Ionic Charge on Hydrated Cement ," Highway R e s e a r c h Board, B u l l . 171, pp. 16-33, (1958) .
19. Tay lor , H . F . W . , "Hydrated Calc ium Si l icates , P a r t i : Compound Formation at Ordinary T e m p e r a t u r e s , " J o u r . Chem. S o c , London, pp. 3682-3690, (1950) .
R . J . L E O N A R D and D . T . DAVIDSON, C l o s u r e - A l t h o u g h M r . Moh's discussion does not make known any new information about the l ime- f lyash pozzolanic reaction, it i s appreciated for it offers the authors an opportunity to c lar i fy and d iscuss further some of the major points of their study.
Although x - r a y spectrometer curves were obtained for the absorption test f lyashes for a ,range of 26 of 2 to 100 deg, only that portion showing the interesting peaks at 1 2 . 6 A and 1 7 . 3 ^ were shown in F igure 14. The other significant peaks that were observed at 3 . 0 8 A and 2.81 A were reported in the text of the paper. The data for CSH(I) reported in Table 7 of the paper a r e more recent than that presented by M r . Moh and it may be significant to give D r . L e a ' s addendum to these data, "This i s the data for the poorly crysta l l ine mater ia l . The long spacing can v a r y considerably and may also be imdetected." It should be noted that the peaks appear to be transitional; this i s part icu lar ly evident with sample 11. Sample pretreatment and the s m a l l amount of r e action product available in any part icu lar sample probably play major r o l e s in the location of the f i r s t peak. On the bas i s of the evidence of the 12.6 A to 17.3 A peak and the presence of the second peaks it seems reasonable to identify one of the reaction products a s CSH(I) .
The s ize of the D T A exothermic peak at about 830 to 900 deg C reportedby Kalousek (22) for C S H ( I ) i s a function of the m a s s of this reaction product. Since only a s m a l l amount of reaction product was available for each f lyash s a n ^ l e this affected the D T A resu l t s . Peaks were observed at 830 to 900 deg C , but they were not very significant.

16
A l s o , the large amounts of unbumed carbonaceous mater ia l in some of the f lyashes caused some drift despite the fact that a nitrogen atmosfphere was used in the furnace . In addition to Kalousek's (22) work, Greenberg (21) and others have done D T A work on C S H ( I ) ; however, most r e s e a r c h e r s pre fer the use of x - r a y diffraction procedures for the examination of crysta l l ine minera l s of this type. None of these reports include information on the reaction of line with f lyash and the resulting products; also most of the reports dealt with pure mixtures of Ca(OH)2 with s i l i c a gel or minera l s that had been e^Qiosed to solutions of high concentrations of Ca(OH)2 for long periods of t ime.
At the 38th Annual Meeting of the Highway R e s e a r c h Board, Benton (JO) of the Bureau of Reclamation, presented some information on the reaction products of poz-zolans. M r . Benton indicated that there were two reaction products of the l ime- f lyash reaction, one product i s C S H ( I ) and the other i s a calc ium-alumino-hydrate . The latter product may or may not contribute to the strength of the l ime- f lyash mixture.
The l ime-absorption reported in F igure 2 should not be misconstrued to be the maximum amount of Ca(OH) 2 that these f lyashes can possibly absorb in that length of t ime and at that temperature. The curves shown in F i g u r e s 2 and 3 represent the amounts absorbed f r o m an original Ca(0H)2 solution of slightly l e s s than saturated concentration. At 20 deg C a saturated Ca(OH)a solution i s 0.165 gm per 100 gm of water (23). The concentrations of the solutions used were kept below the saturated concentration because of the presence of soluble constituents in the f l jrashes. Any p r e cipitation of ca lc ium in the solution would make the absorption test meaningless.
Since the pozzolanic reaction i s between calc ium and the reactive constituents that occur on the surface of the f lyash part i c l e s , total exposure of the f lyash surface a r e a i s necessary for the absorption test resu l t s to be s i ^ i f i c a n t . Although No. 10 f lyash has 43 .4 percent SiOs not a l l of this Si02 wi l l be available for immediate reaction. The amount reacted for a part icu lar pozzolan wi l l be dependent on the surface a r e a of the f lyash , the rate of diffusion of ca lc ium through the reaction product that f o r m s on the surface of the par t i c l e s and the availabil ity of ca lc ium in the sys tem. L e a (24) , among others, has estimated that under normal conditions a pozzolan wi l l not react in a year with more than about 20 percent of i ts weight of l ime .
Due to concentration res tr ic t ions only a s m a l l amount of the f lyash was reacted in the absorption tests , nevertheless , there was enough ca lc ium present to cause cementation of the p a r t i c l e s . The samples were s t i r r e d to prevent this cementation f r o m forming aggregates. Some of the f lyashes have enough calc ium to provide significant compress ive strength without the addition of l ime .
M r . Moh has confused the t e r m mechanism; it i s not c l ear whether he means chemica l or mechanical mechanism. The authors sought to explain the chemical mechanism of the pozzolanic react ion. B y the use of absorption tests and x - r a y spectrometer methods the chemical react ions were investigated. H there were no reactions that produced the cementitious mater ia l there would be no strength development, hence the importance of the chemica l mechanism should be obvious.
D i e r e are var ious phys ica l factors in addition to the chemical factors that affect the development of compress ive strength. Hie strength of l ime- f lyash mortars i s dependent on the amount and number of contacts of the cementitious mater ia l ; therefore, anything that affects either the amount or number of contacts wi l l affect the strength. P h y s i c a l effects such a s the depletion of l ime at certain points in the mortar , or an excess of l ime may even prevent the cementitious mater ia l f r o m making contact; these factors may a r i s e f r o m inadequate mixing of the m o r t a r s . Non-reactive mater ia l may prevent contact of the cementitious mater ia l . Density i s another phys ica l factor that may affect the strength (26 ) ; increasing the density of the mortar increases its c o m pres s ive strength. However, despite the phys ica l effects it seems reasonable there must be a relationship between the chemical reactions and the strength development of the l i m e - f l y a s h m o r t a r s .
H i e rate of compress ive strength development of l ime- f lyash m o r t a r s at ordinary temperatures generally i s low init ial ly, then the strength development i s rapid and f inal ly the rate decreases significantly, but the strength continues to increase; this was shown tn F igure 4 of the paper. The rate of absorption of f lyashes in Ca(OH)i solutions proceeds in the same manner. The rapid increase in s tre i^th i s due to the cementitious

17
mater ia l produced by the l ime- f lyash reaction, and the decrease in compress ive strength i s due to the local depletion of l ime and limitation due to the diffusion of c a l c ium through the reaction products. By increasing the concentration of the l ime the rate of strength development wi l l be increased after the init ial period, but the rate of strength development wi l l not be exactly the same as the rate of absorption. T h i s i s due to the phys ica l factors that are not involved in the absorption tests . It was noted in the paper that f lyashes having a high rate of ca lc ium absorption also have a high rate of compressive s tre i^th development. Therefore , the correlat ion between the rate of absorption and the rate of s tre i^th development must be made on the bas i s of standardized tests if it i s to have interpretation meaning.
The negative absorption can be sat isfactori ly explained by the presence of soluble components in the f lyashes . The presence of ca lc ium compounds in the f lyashes w i l l be noted in the chemical analys i s of the f lyashes given in Table 2 of the paper. Some of the f lyashes possess enough soluble ca lc ium to be weakly cementitious without the addition of l ime . The solubility of these f lyash compounds i s of little importance to the pozzolanic chemical mechanism<- The inconsequental init ial absorption values may be due to charge deficiencies that are associated with g lasses , or other phenomena; they do not enter into any of the calculations. L e a (24) chooses to ignore the init ial reactions in h i s studies.
F r o m the phys ica l data given in Table 4 and the discussion given in the paper it should be obvious that the minor differences are due to the coarse fraction; the major role of the coarse fraction, containing the majority of the unbumed coal and coke, i s not in the chemical reactivity of the pozzolans, but in the phys ica l factor of preventing the contact of cementitious mater ia l . The presence of unbumed coal and coke also generally indicates a c o a r s e r f lyash and hence a lower specif ic surface .
R E F E R E N C E S
20. Benton, E . J . , "Cement Pozzolan React ions ," Highway R e s e a r c h Board, B u l l . 239, (1960) .
21. Greenberg, Sidney A . , "The Chemisorption of Ca lc ium Hydroxide by S i l i c a , " J o u r . Phys . C h e m . , 60:325-330, (1956) .
22. Kalousek, George L . , "The Reactions of Cement Hydration at Elevated Temperatures , " P r o c . of the T h i r d Sym. on the Chemistry of Cement, London, 1952:334-356, (1954) .
23. Lange, Norbert A . , "Handbook of Chemistry , " 9th Edit ion, Handbook Pub. U s h e r s , Sandusky, Ohio, (1956) .
24. L e a , F . M . , "The Chemistry of Pozzolana, " P r o c . of the F i r s t Sym. on the Chemistry of Cement, Stockholm, 1938:460-490, (1939) .
25. L e a , F . M . , and Desch , C . H . , "The Chemistry of Cement and Concre te ," St. Martins P r e s s , New Y o r k , (1956) .
26. Veskochi l , Ralph H . , "Effect of Density on Unconfined Compress ive Strength, Absorption and Volume Change of L ime and F l y a s h Stabilized S o i l s , " Unpublished M . S . T h e s i s , Iowa State College L i b r a r y , A m e s , Iowa, (1956) .