Embed Size (px)
Citation preview
PPMI Cognitive-Behavioral Working Group
PPMI Annual Meeting - May 13-14, 2015
Daniel Weintraub, MD

Membership Daniel Weintraub – WG Chair
Tanya Simuni – Steering Committee Shirley Lasch – IND
Chris Coffey, Chelsea Caspell-Garcia – Statistics Core Dag Aarsland Roy Alcalay Paolo Barone Melanie Braddabur David Burn Cindy Casacelli Lama Chahine William Cho Thomas Comery Autilia Cozzolino Johnna Devoto Chris Dodds Jamie Eberling Alberto Espay Stewart Factor Hubert Fernandez Regan Fong Douglas Galasko Sandeep Gupta
Keith Hawkins David Hewitt Jim Leverenz Irene Litvan Anita McCoy Susanne Ostrowitzki Bernard Ravina Alistair Reith Irene Richard Liana Rosenthal Holly Shill Andrew Siderowf John Sims Gretchen Todd Eduardo Tolosa Matt Troyer Michael Ward Michele York

Overview
• Review of assessments • Baseline manuscript from CBWG • Preliminary longitudinal results • Individuals’ work

Study Assessments
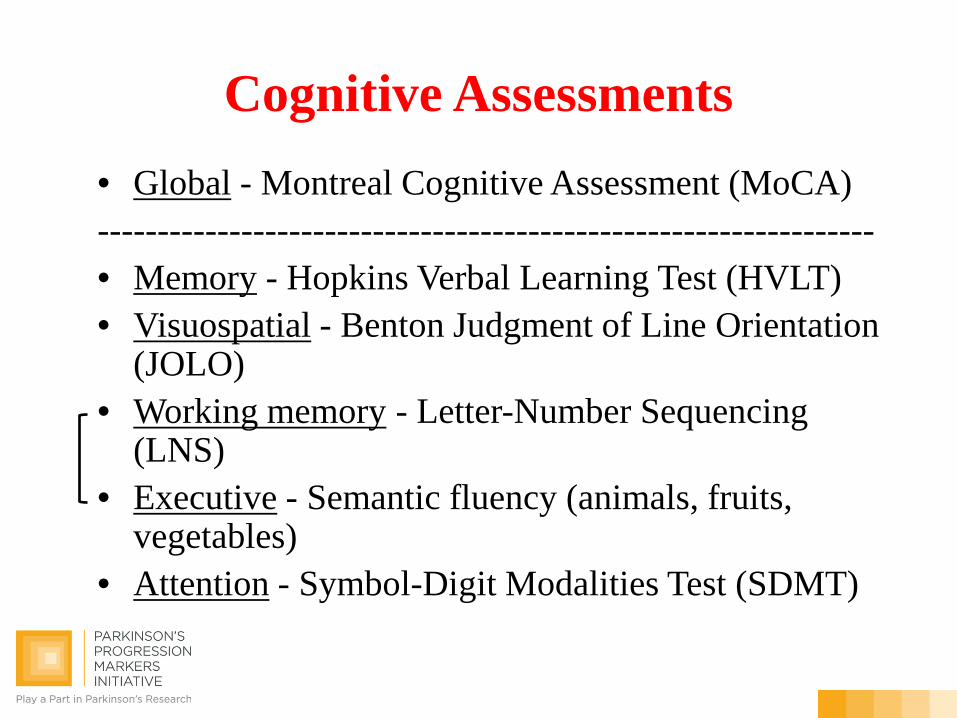
Cognitive Assessments • Global - Montreal Cognitive Assessment (MoCA) ----------------------------------------------------------------- • Memory - Hopkins Verbal Learning Test (HVLT) • Visuospatial - Benton Judgment of Line Orientation
(JOLO) • Working memory - Letter-Number Sequencing
(LNS) • Executive - Semantic fluency (animals, fruits,
vegetables) • Attention - Symbol-Digit Modalities Test (SDMT)
Behavioral Assessments
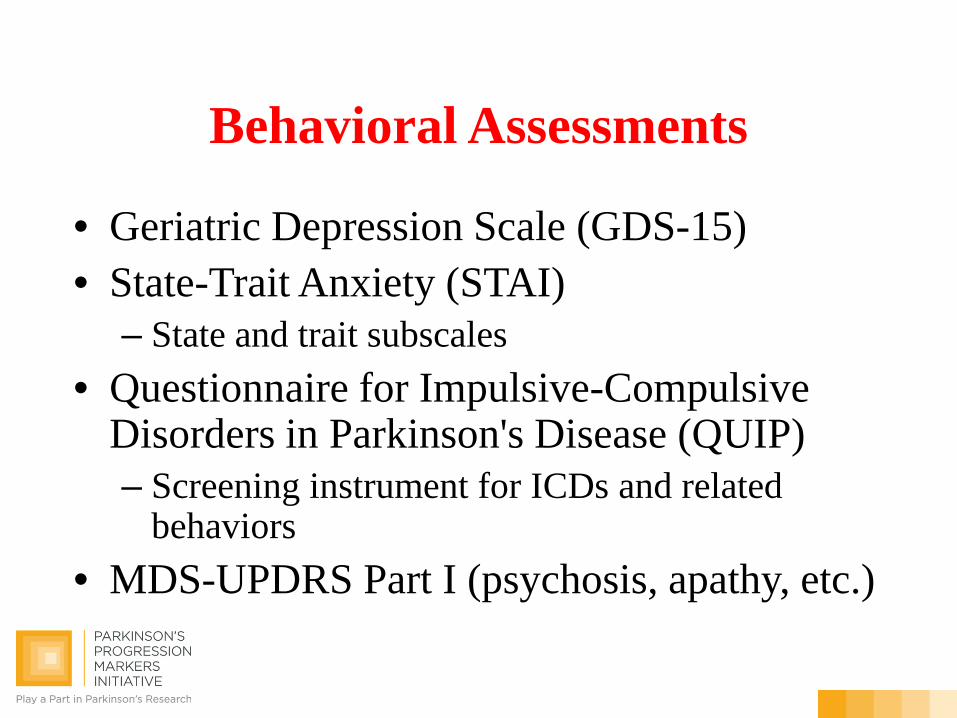
• Geriatric Depression Scale (GDS-15) • State-Trait Anxiety (STAI)
– State and trait subscales • Questionnaire for Impulsive-Compulsive
Disorders in Parkinson's Disease (QUIP) – Screening instrument for ICDs and related
behaviors • MDS-UPDRS Part I (psychosis, apathy, etc.)
Steps for Determining Annual Cognitive Diagnosis in PPMI
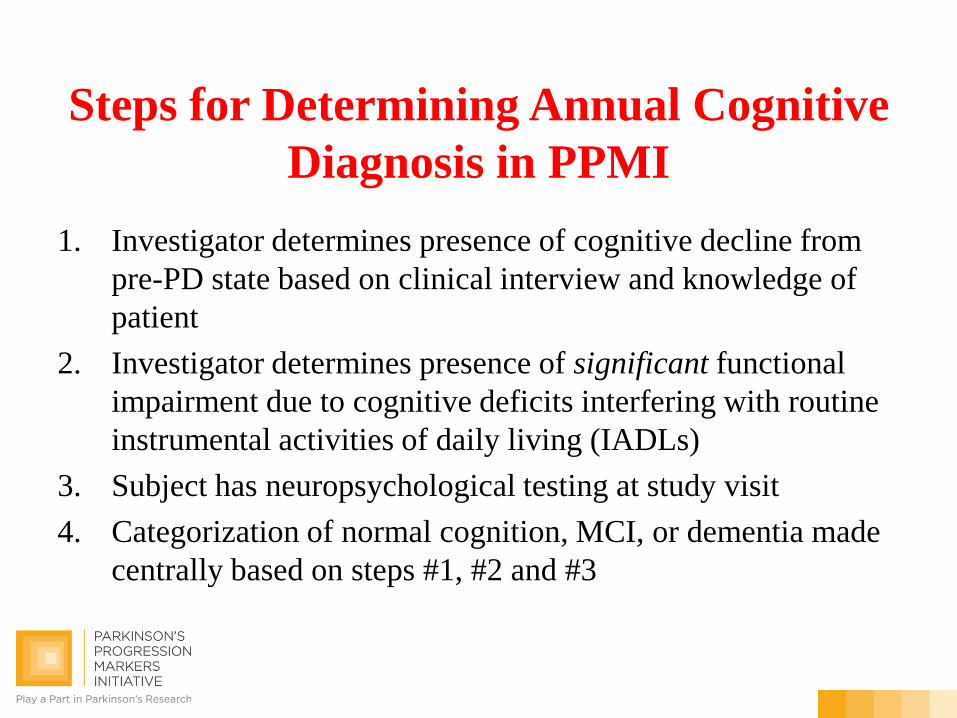
1. Investigator determines presence of cognitive decline from pre-PD state based on clinical interview and knowledge of patient
2. Investigator determines presence of significant functional impairment due to cognitive deficits interfering with routine instrumental activities of daily living (IADLs)
3. Subject has neuropsychological testing at study visit 4. Categorization of normal cognition, MCI, or dementia made
centrally based on steps #1, #2 and #3

Baseline CBWG Manuscript
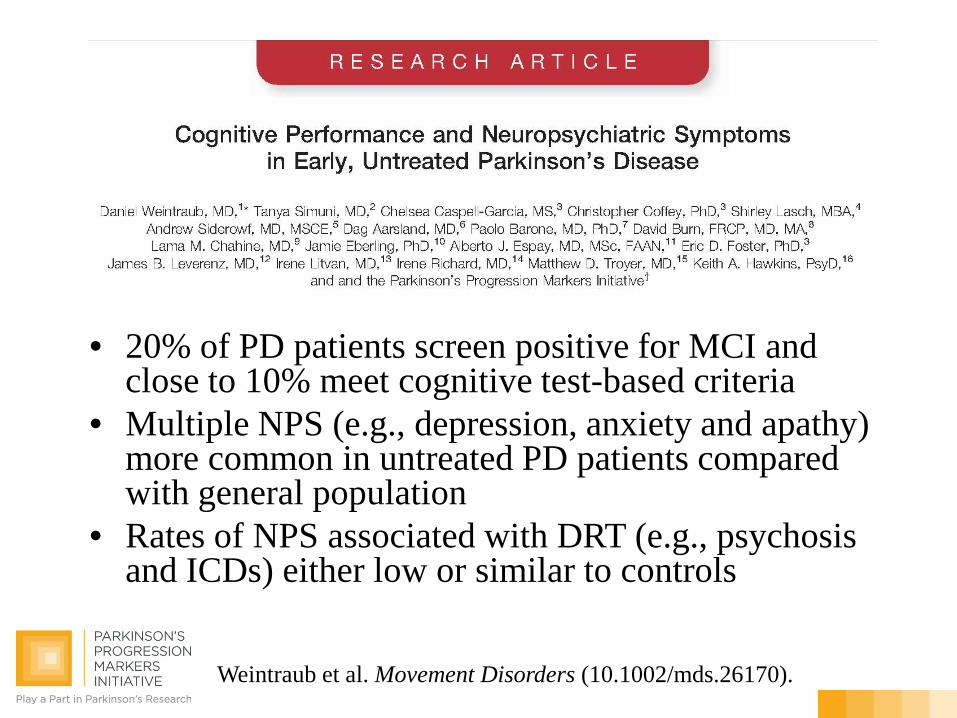
• 20% of PD patients screen positive for MCI and close to 10% meet cognitive test-based criteria
• Multiple NPS (e.g., depression, anxiety and apathy) more common in untreated PD patients compared with general population
• Rates of NPS associated with DRT (e.g., psychosis and ICDs) either low or similar to controls
Weintraub et al. Movement Disorders (10.1002/mds.26170).
Preliminary Longitudinal Results: Cognition and Biomarkers
Courtesy Chelsea Caspell-Garcia, MS
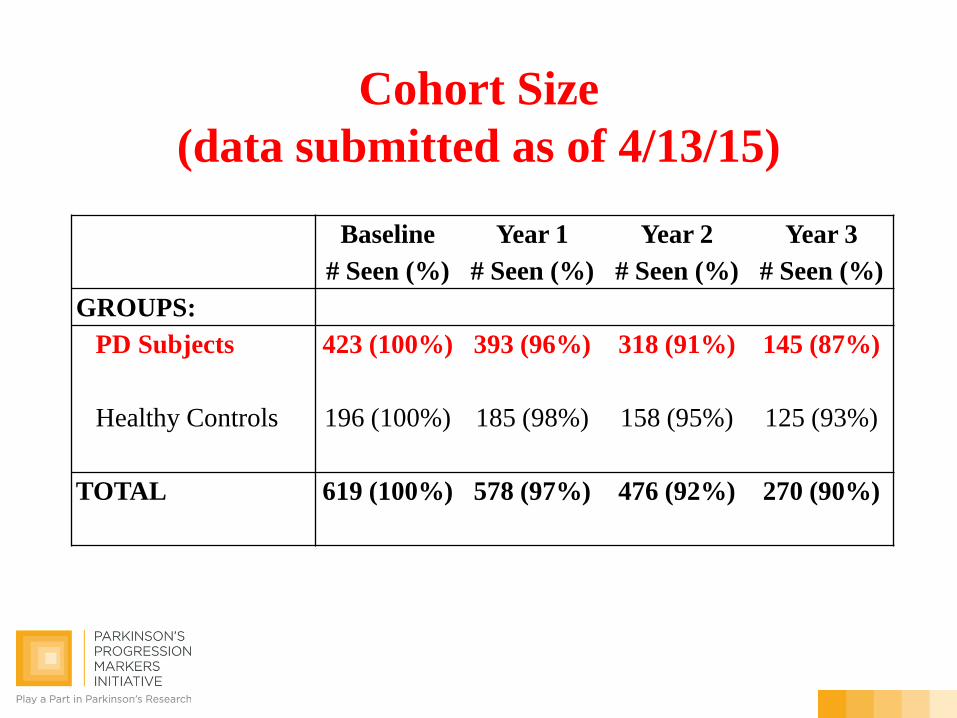
Cohort Size (data submitted as of 4/13/15)
Baseline Year 1 Year 2 Year 3 # Seen (%) # Seen (%) # Seen (%) # Seen (%) GROUPS: PD Subjects
423 (100%) 393 (96%) 318 (91%) 145 (87%)
Healthy Controls
196 (100%) 185 (98%) 158 (95%) 125 (93%)
TOTAL
619 (100%) 578 (97%) 476 (92%) 270 (90%)
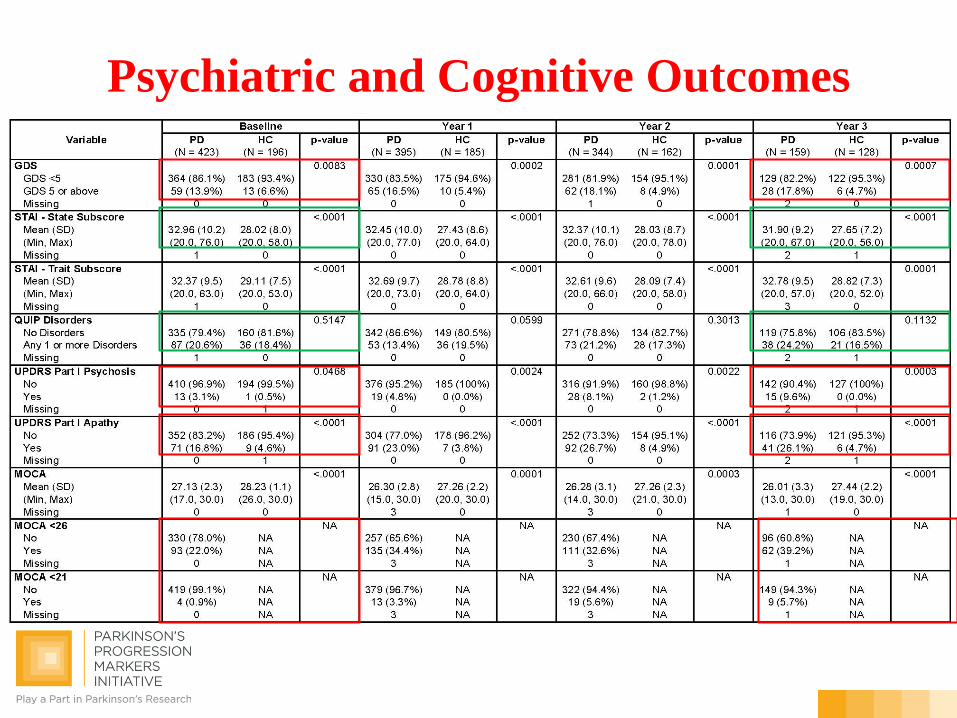
Psychiatric and Cognitive Outcomes
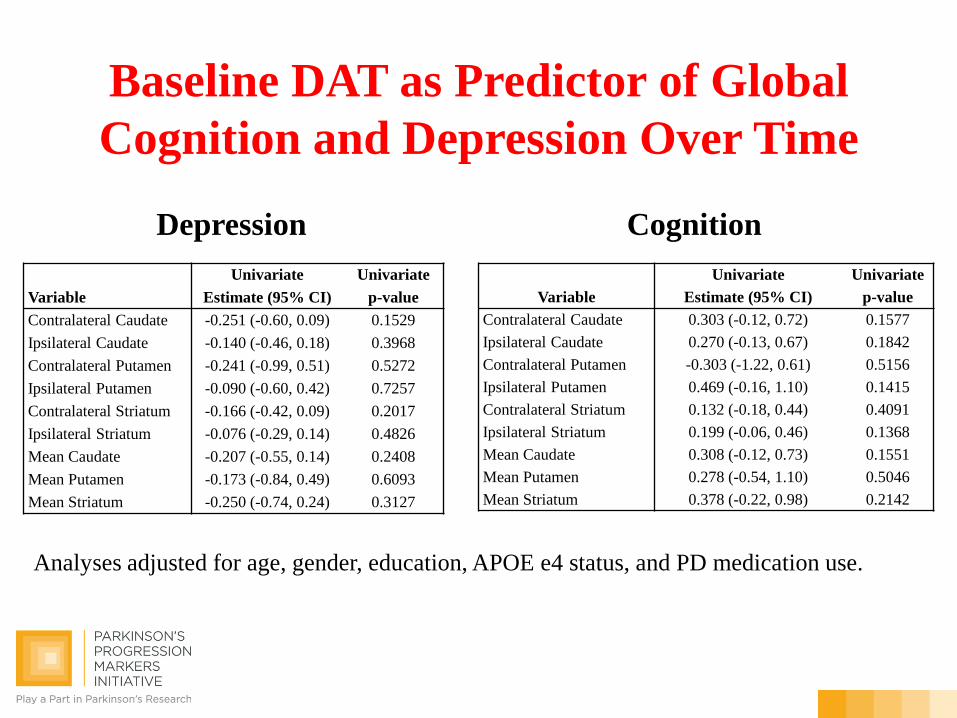
Baseline DAT as Predictor of Global Cognition and Depression Over Time
Univariate Univariate Variable Estimate (95% CI) p-value Contralateral Caudate -0.251 (-0.60, 0.09) 0.1529 Ipsilateral Caudate -0.140 (-0.46, 0.18) 0.3968 Contralateral Putamen -0.241 (-0.99, 0.51) 0.5272 Ipsilateral Putamen -0.090 (-0.60, 0.42) 0.7257 Contralateral Striatum -0.166 (-0.42, 0.09) 0.2017 Ipsilateral Striatum -0.076 (-0.29, 0.14) 0.4826 Mean Caudate -0.207 (-0.55, 0.14) 0.2408 Mean Putamen -0.173 (-0.84, 0.49) 0.6093 Mean Striatum -0.250 (-0.74, 0.24) 0.3127
Depression
Analyses adjusted for age, gender, education, APOE e4 status, and PD medication use.
Cognition Univariate Univariate
Variable Estimate (95% CI) p-value Contralateral Caudate 0.303 (-0.12, 0.72) 0.1577 Ipsilateral Caudate 0.270 (-0.13, 0.67) 0.1842 Contralateral Putamen -0.303 (-1.22, 0.61) 0.5156 Ipsilateral Putamen 0.469 (-0.16, 1.10) 0.1415 Contralateral Striatum 0.132 (-0.18, 0.44) 0.4091 Ipsilateral Striatum 0.199 (-0.06, 0.46) 0.1368 Mean Caudate 0.308 (-0.12, 0.73) 0.1551 Mean Putamen 0.278 (-0.54, 1.10) 0.5046 Mean Striatum 0.378 (-0.22, 0.98) 0.2142
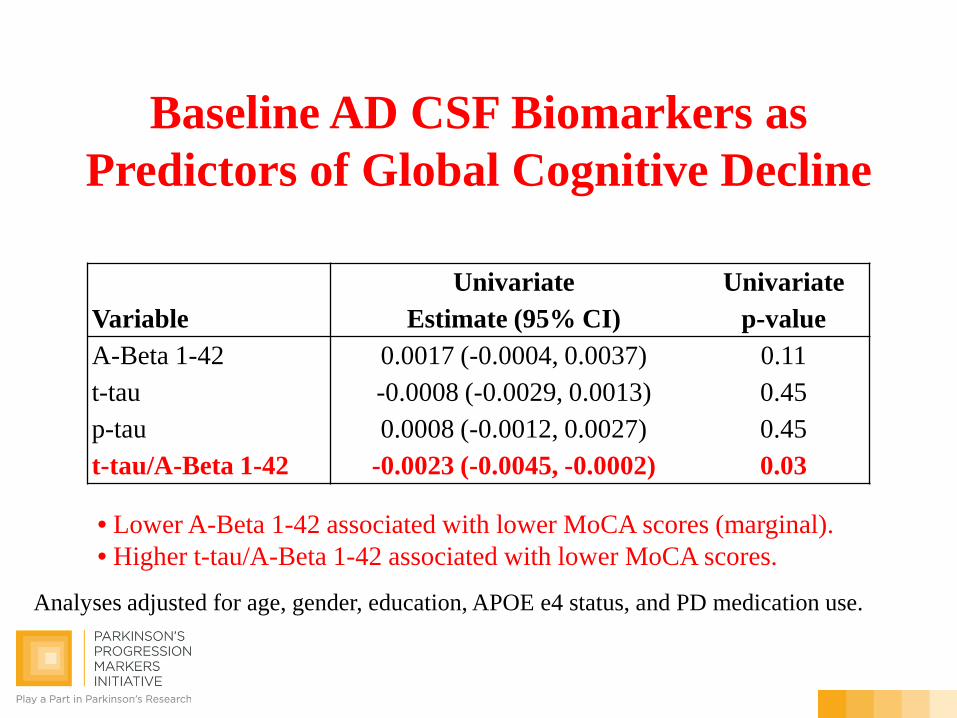
Baseline AD CSF Biomarkers as Predictors of Global Cognitive Decline
Univariate Univariate Variable Estimate (95% CI) p-value A-Beta 1-42 0.0017 (-0.0004, 0.0037) 0.11 t-tau -0.0008 (-0.0029, 0.0013) 0.45 p-tau 0.0008 (-0.0012, 0.0027) 0.45 t-tau/A-Beta 1-42 -0.0023 (-0.0045, -0.0002) 0.03
Analyses adjusted for age, gender, education, APOE e4 status, and PD medication use.
• Lower A-Beta 1-42 associated with lower MoCA scores (marginal). • Higher t-tau/A-Beta 1-42 associated with lower MoCA scores.

Draft Planned Analyses Baseline Change in Cognitive STATUS From Baseline Change in Individual
Cognition SCORES From Baseline
MoCA score MoCA <26 Any 2 tests >1.5 SD below mean
NEW MoCA <26 (last point)
LAST MoCA >3 point decrease from
BL
NEW any last 2 tests >1.5 SD below
mean
NEW MCI diagnosis
NEW dementia diagnosis
Cognitive Clinical Outcome N/A N (%) N (%) N (%) N (%) N (%) N (%) N (%) N/A Biomarker
Baseline Change BL to Year 1
CSF 1. A-syn 2. t-tau 3. ptau181 4. AB1-42 5. t-tau/AB1-42 6. ptau181/AB1-42 7. p-tau181/t-tau
CSF 1. A-syn 2. t-tau 3. ptau181 4. AB1-42 5. t-tau/AB1-42 6.ptau181/AB1-42 7. p-tau181/t-tau
Plasma 1. Urate 2. α-synuclein 3. IGF Structural MRI 1. Major ROI’s 2. Cortical thickness 3. Subcortical
Structural MRI 1. Major ROI’s 2. Cortical thickness 3. Subcortical
DTI 1. FA (anisotropy) 2. MD (diffusivity)
DTI 1. FA (anisotropy) 2. MD (diffusivity)
DAT 1. Mean striatal 2. Mean putamen 3. Mean caudate 4. Ipsi. caudate 5. Contra. caudate 6. Ipsi. putamen 7. Contra. putamen
DAT 1. Mean striatal 2. Mean putamen 3. Mean caudate 4. Ipsi. caudate 5. Contra. caudate 6. Ipsi. putamen 7. Contra. putamen
Genetics 1. APOE 2. GBA 3. LRRK 4. Synuclein (SNCA) 5. MAPT 6. COMT 7. HLA 8. KLOTHO

Individuals’ Work
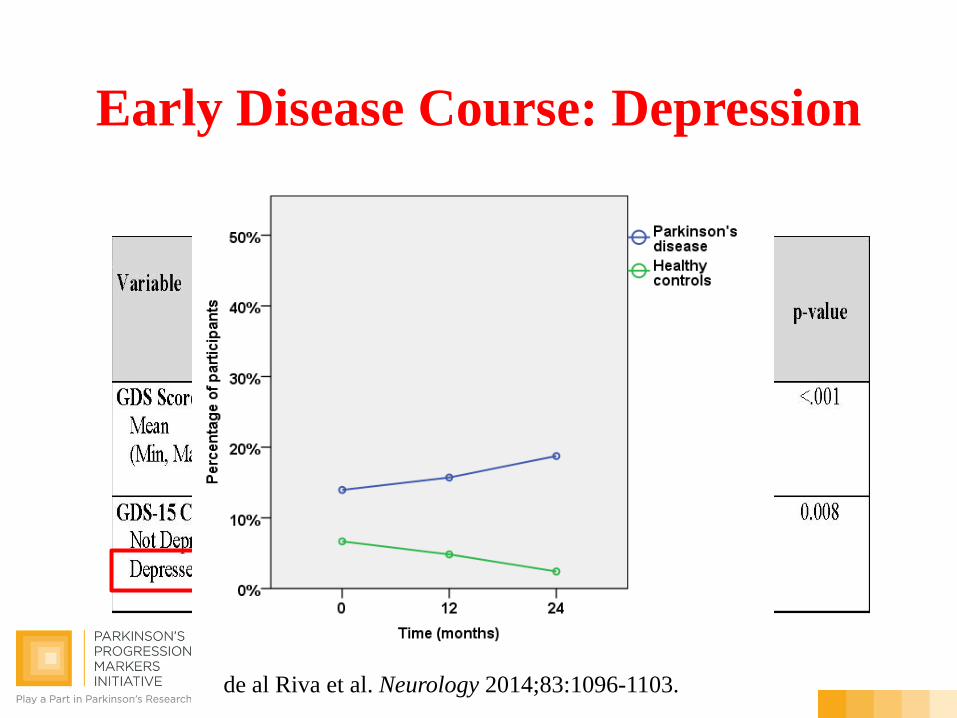
Early Disease Course: Depression
de al Riva et al. Neurology 2014;83:1096-1103.
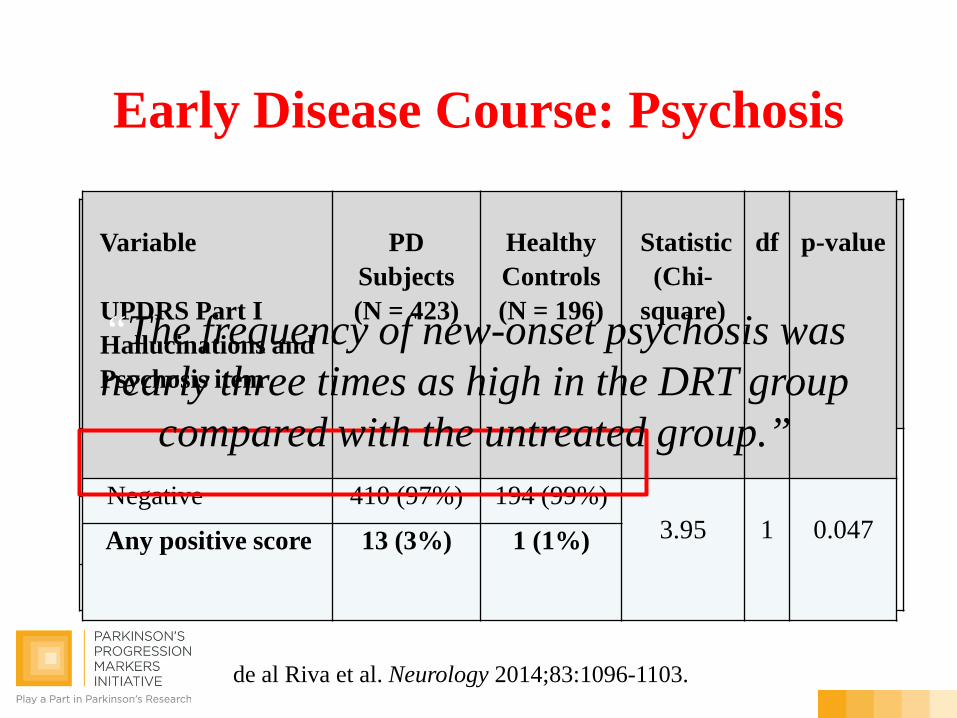
Early Disease Course: Psychosis
Psychosis (% present)
BL
12 months
24 months
Change in PD
over time
Change between groups
over time
PD 3.1% (13/423)
5.4 % (14/261)
10.4% (10/96)
11.64 (2), p=0.003
1.49 (2), 0.59 HC 0.5%
(1/195) 0%
(0/145) 2.4% (2/83)
Fischer test, p 0.076 0.003 0.038
de al Riva et al. Neurology 2014;83:1096-1103.
Variable UPDRS Part I Hallucinations and Psychosis item
PD
Subjects (N = 423)
Healthy Controls (N = 196)
Statistic
(Chi-square)
df
p-value
Negative 410 (97%) 194 (99%) 3.95
1
0.047
Any positive score 13 (3%) 1 (1%)
“The frequency of new-onset psychosis was nearly three times as high in the DRT group
compared with the untreated group.”
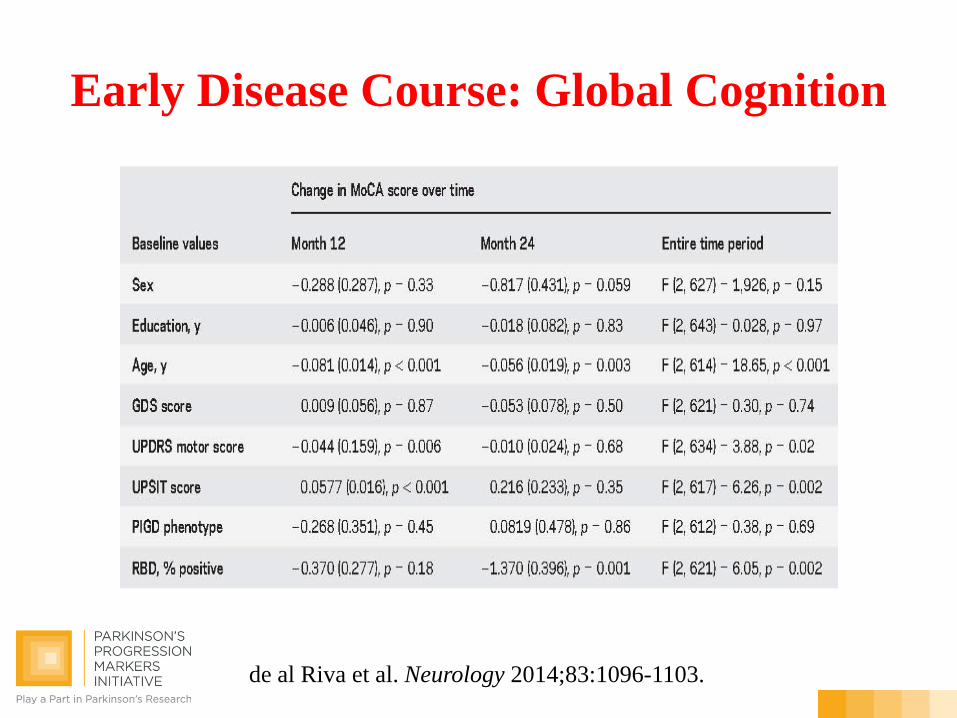
Early Disease Course: Global Cognition
de al Riva et al. Neurology 2014;83:1096-1103.
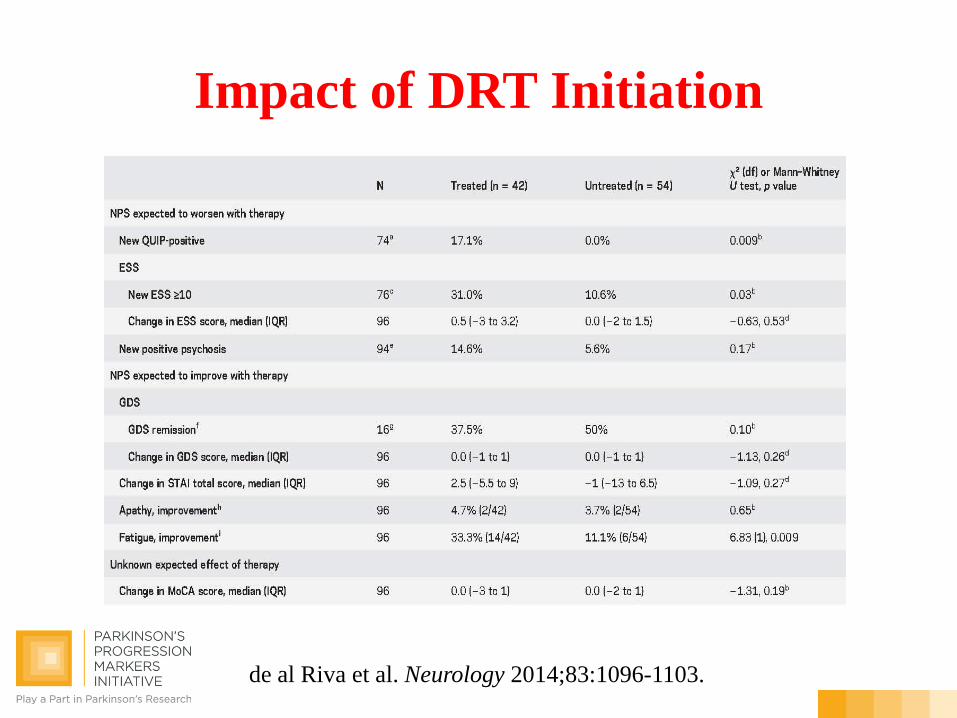
Impact of DRT Initiation
de al Riva et al. Neurology 2014;83:1096-1103.
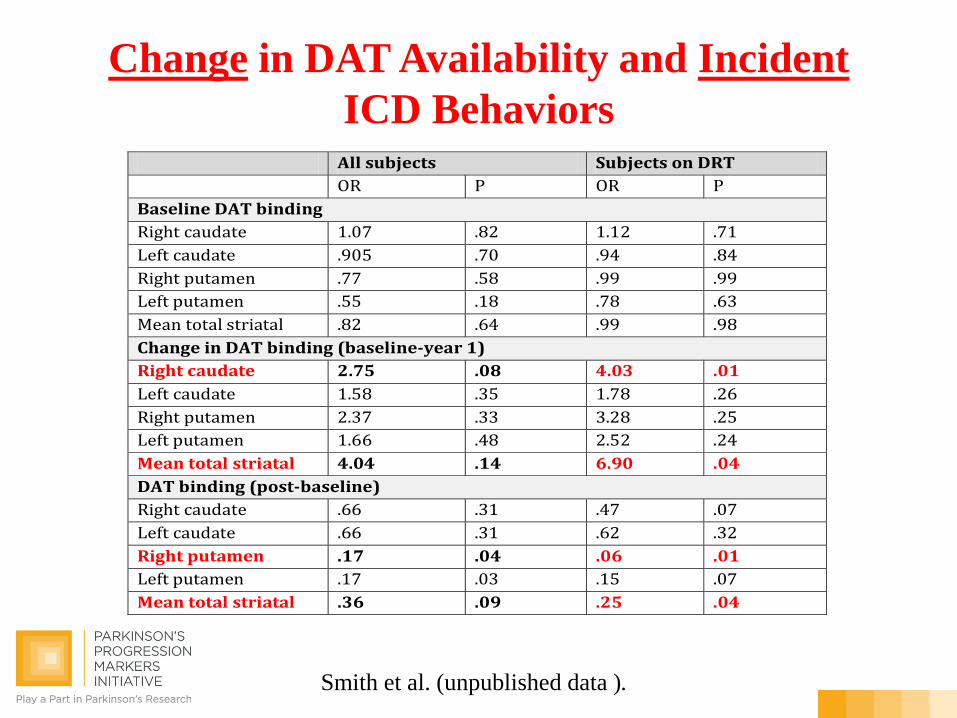
Change in DAT Availability and Incident ICD Behaviors
All subjects Subjects on DRT OR P OR P Baseline DAT binding Right caudate 1.07 .82 1.12 .71 Left caudate .905 .70 .94 .84 Right putamen .77 .58 .99 .99 Left putamen .55 .18 .78 .63 Mean total striatal .82 .64 .99 .98 Change in DAT binding (baseline-year 1) Right caudate 2.75 .08 4.03 .01 Left caudate 1.58 .35 1.78 .26 Right putamen 2.37 .33 3.28 .25 Left putamen 1.66 .48 2.52 .24 Mean total striatal 4.04 .14 6.90 .04 DAT binding (post-baseline) Right caudate .66 .31 .47 .07 Left caudate .66 .31 .62 .32 Right putamen .17 .04 .06 .01 Left putamen .17 .03 .15 .07 Mean total striatal .36 .09 .25 .04
Smith et al. (unpublished data ).
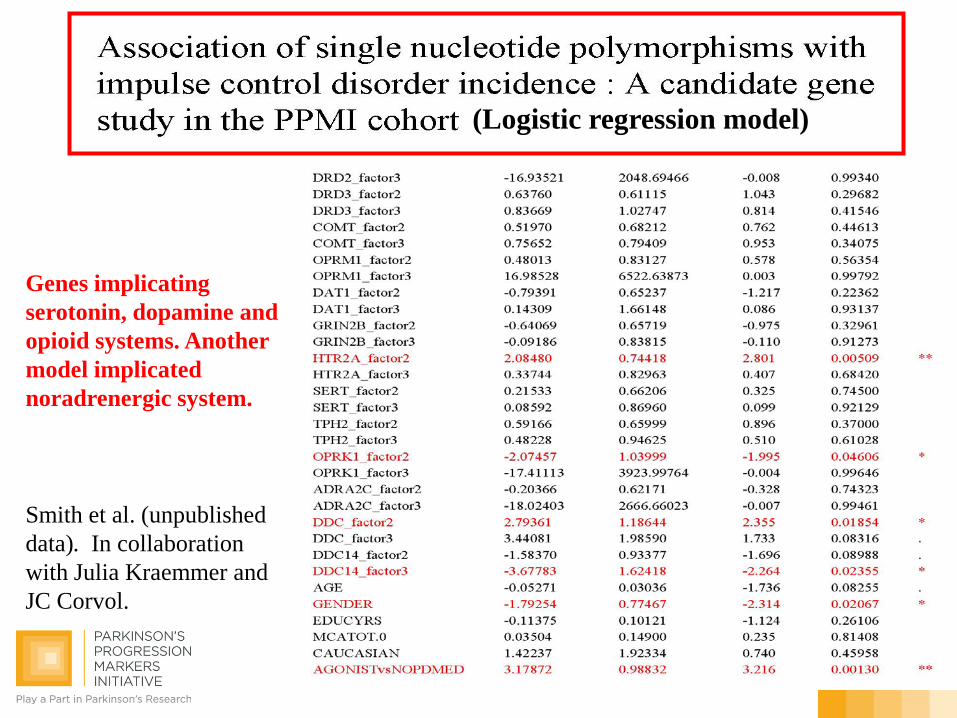
Smith et al. (unpublished data). In collaboration with Julia Kraemmer and JC Corvol.
(Logistic regression model)
Genes implicating serotonin, dopamine and opioid systems. Another model implicated noradrenergic system.
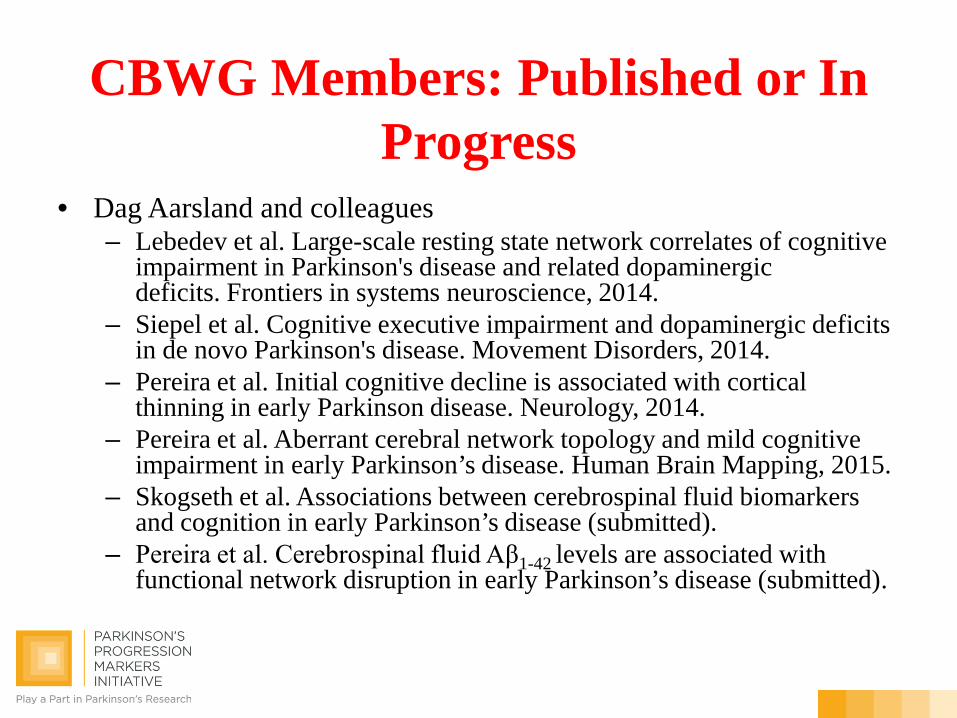
CBWG Members: Published or In Progress
• Dag Aarsland and colleagues – Lebedev et al. Large-scale resting state network correlates of cognitive
impairment in Parkinson's disease and related dopaminergic deficits. Frontiers in systems neuroscience, 2014.
– Siepel et al. Cognitive executive impairment and dopaminergic deficits in de novo Parkinson's disease. Movement Disorders, 2014.
– Pereira et al. Initial cognitive decline is associated with cortical thinning in early Parkinson disease. Neurology, 2014.
– Pereira et al. Aberrant cerebral network topology and mild cognitive impairment in early Parkinson’s disease. Human Brain Mapping, 2015.
– Skogseth et al. Associations between cerebrospinal fluid biomarkers and cognition in early Parkinson’s disease (submitted).
– Pereira et al. Cerebrospinal fluid Aβ1-42 levels are associated with functional network disruption in early Parkinson’s disease (submitted).
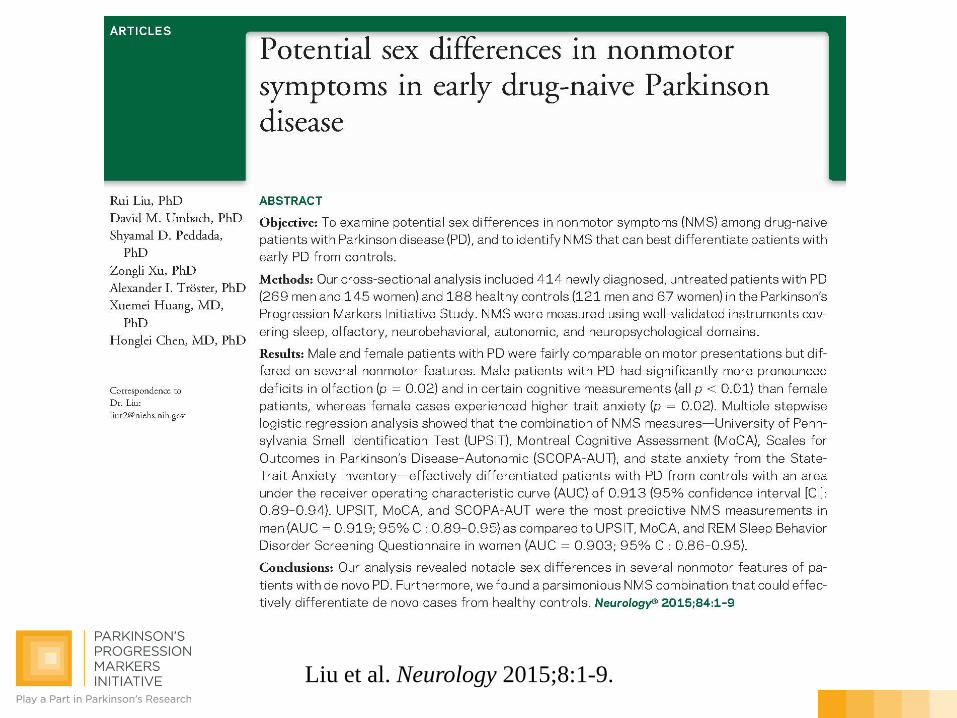
Liu et al. Neurology 2015;8:1-9.
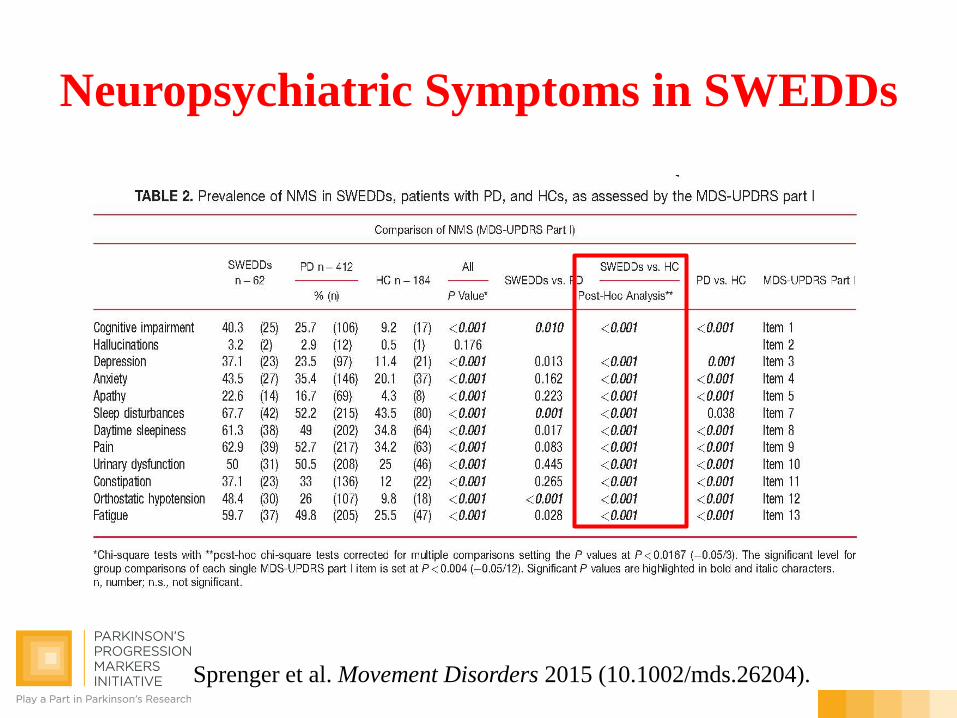
Neuropsychiatric Symptoms in SWEDDs
Sprenger et al. Movement Disorders 2015 (10.1002/mds.26204).
CPWG Members: Sampling of Ongoing Work
• Lama Chahine - Baseline sleep and daytime sleepiness symptoms as predictors of cognitive decline
• Alberto Espay - Differential effect of dopaminergic medications on depression and anxiety symptoms
• Maria Teresa Pellecchia and Paolo Barone - Insulin-like growth factor-1 (IGF) as biomarker for early cognitive impairment
• Roy Alcalay - CSF β-amyloid 1-42 predicting progression to cognitive impairment


![Behavioral/Systems/Cognitive ... · Behavioral/Systems/Cognitive AcuteCocaineInducesFastActivationofD1Receptorand ProgressiveDeactivationofD2ReceptorStriatalNeurons: InVivoOpticalMicroprobe[Ca2]](https://img.pdfslide.net/doc/110x75/6013f75e26e57852b94803cb/behavioralsystemscognitive-behavioralsystemscognitive-acutecocaineinducesfastactivationofd1receptorand.jpg)