Embed Size (px)
Citation preview

PPRI Pharma Profile
Norway 2015


PPRI Pharma Profile Norway
Update: June 2015
PPRI Representatives
Norwegian Medicines Agency: Helga Festøy
Drug Procurement Cooperation: Torfinn Aanes
Authors
Norwegian Medicines Agency: Helga Festøy
Drug Procurement Cooperation: Anne Helen Ognøy
Editors
PPRI Secretariat, Gesundheit Österreich GmbH (Austrian Public Health Institute)
Reviewed by
Nina Zimmermann, PPRI Secretariat
Disclaimer
The data provided in this document by the members of the PPRI network and other authors
represent the current situation. The data have no legally binding value and are meant espe-
cially for the information of PPRI network members who are committed to sharing information
on pharmaceutical pricing and reimbursement.


Acknowledgements
The Norwegian Medicines Agency is grateful for contributions from:
Solveig Sakshaug, National Institute of Public Health
Karianne Johansen, Norwegian Association of Pharmaceutical Manufacturers
Stian Lekang, Farmastat


V
Introduction
PPRI Pharma Profiles: national reporting systems on pharmaceutical pricing and
reimbursement
The need for accurate and up-to-date country information has been broadly acknowledged.
Information about specific issues of a country is of key importance for decision makers and
researchers, even if their needs with regard to the level of detail may vary.
Within the framework of the PPRI (Pharmaceutical Pricing and Reimbursement Information)
research project (2005 – beginning of 2008), the project consortium, consisting of the Austri-
an Public Health Institute (Gesundheit Österreich GmbH / Österreichisches Bundesinstitut für
Gesundheitswesen) and the World Health Organization (WHO) developed the so-called
“PPRI Pharma Profiles” as a tool for understanding, collecting and analysing pharmaceutical
pricing and reimbursement information. A key principle of the PPRI Pharma Profiles was that
the Profiles were written by national country experts, usually staff of competent authorities for
pharmaceutical pricing and reimbursement (Ministries of Health, Medicines Agencies, Social
Health Insurance institutions) represented in the PPRI network and that they were critically
reviewed by project consortium members.
PPRI Pharma Profiles, which primarily focused on the out-patient pharmaceutical sector, for
23 countries were published within the years 2007 to 2009. Even if the PPRI project officially
ended at the beginning of the year 2008, the PPRI network members continued contributing
by updating the PPRI Pharma Profiles.
As a further development, information on the in-patient sector was integrated: The PHIS
(Pharmaceutical Health Information System) project surveyed, for the first time, information
about the in-patient pharmaceutical sector. The PHIS project consortium, including the
Austrian Public Health Institute, the International Healthcare and Health Insurance Institute
(IHHII) in Bulgaria and the Slovak Medicines Agency (SUKL), developed the PHIS Hospital
Pharma report about medicines management in the hospital sector and the PHIS Pharma
Profile as a comprehensive report about the pharmaceutical out-patient and in-patient sec-
tors. The principle of involving national experts as authors remained the same. 19 PHIS
Hospital Pharma reports and 5 PHIS Pharma Profiles were published. All published country
reports and profiles are publicly accessible at the website of WHO Collaborating Centre for
Pharmaceutical Pricing and Reimbursement Policies at
http://whocc.goeg.at/Publications/CountryReports.
Additionally, in order to allow information at a glance, posters about pharmaceutical systems
and policies were produced. They are also available at the WHO Collaborating Centre’s
website at http://whocc.goeg.at/Publications/CountryPosters.
In order to support the production of the PPRI and PHIS Pharma Profiles, templates were
matched and were made available to the authors. In the course of the years, the templates
for the comprehensive profiles (in 2015 the “PPRI/PHIS Pharma Profiles were renamed
again to “PPRI Pharma Profiles”) were revised, further developed and updated.
VI
The PPRI Pharma Profile 2015 is designed to comprise up-to-date information as of 2015 (or
latest available year) about pharmaceutical pricing and reimbursement in both the out-patient
and in-patient sectors and data for the latest available years.
Templates and glossaries
All PPRI Pharma Profiles are based on a template which provides a homogenous outline for
reporting. The templates were developed in the PPRI and PHIS projects, were circulated for
review and feed-back to the PPRI/PHIS network members, were tested by the authors of the
profiles and afterwards revised by consortium members, taking into account the experiences
made.
Editorial guidelines provide advice to authors and reviewers and aim to increase the readabil-
ity of the profiles. Readers can expect a universal approach with regard to citations, data
presentations, spelling etc. across the PPRI Pharma Profiles.
To achieve clarity for authors, reviewers and readers and thus to create a common under-
standing of the concepts and terms used, a glossary was developed in the early times of the
PPRI project. It has been regularly updated since. The most updated version of the Glossary
of WHO Collaborating Centre for Pharmaceutical Pricing and Reimbursement Policies can
be found at the WHO Collaborating Centre’s website at http://whocc.goeg.at/Glossary/About.
Authors of the PPRI Pharma Profiles are requested to adhere to the Glossary.
PPRI, PHIS, and WHO Collaborating Centre
Pharmaceutical Pricing and Reimbursement Information (PPRI) was originally a research
project, co-funded by the European Commission, Directorate-General Public Health and
Consumers. It was performed from 2005 till early 2008. In the course of the project the PPRI
network was established, and a set of pharmaceutical indicators, filled with real data from 27
PPRI countries, as well as more than 20 country reports (PPRI Pharma Profiles) and brief
overviews on the pharmaceutical systems (country information) were produced.
Today, Pharmaceutical Pricing and Reimbursement Information (PPRI) is a networking and
information-sharing initiative on burning issues of pharmaceutical policies from a public
health perspective. The PPRI network involves representatives from around 80 institutions:
These are public authorities and third party payers from 45 countries (mainly European
countries, including all 28 EU Member States) as well as European and international institu-
tions such as European Commission services and agencies, OECD, WHO (HQ and Regional
Office for Europe) and World Bank.
In the on-going PPRI initiative, the networking of the public authorities continues via regular
networking meetings and continuous sharing of relevant information for decision-making,
including updates of country-specific information. The PPRI secretariat is hosted at the WHO
Collaborating Centre for Pharmaceutical Pricing and Reimbursement Policies (see below).
The PPRI project was selected by the Executive Agency for Health and Consumers, in
collaboration with the Health Programme’s National Focal Points (NFP) and the Directorate

VII
General for Health and Consumers (DG SANCO), as a good practice example of EU Public
Health projects with an important impact for EU Member States
(http://whocc.goeg.at/Literaturliste/Dokumente/FurtherReading/EAHC_NFP_EUHealthProgra
mme_ImpactProjects.pdf).
Pharmaceutical Health Information System (PHIS) was a European Commission co-funded
project which ran from September 2008 to April 2011. The project aimed to increase
knowledge and exchange of information on pharmaceutical policies, in particular on pricing
and reimbursement, in the EU Member States, covering both the out-patient and the in-
patient sectors. A special focus of the project was on Hospital Pharma, with a European
survey of medicines management in hospitals in the EU Member States and an investigation
and analysis of official and actual prices of medicines in hospitals in selected case study
countries. Methodology tools, in particular with regard to terminology, indicators and report-
ing tools, were further developed based on work started in PPRI.
The Health Economics Department of the Austrian Public Health Institute was nominated as
WHO Collaborating Centre for Pharmaceutical Pricing and Reimbursement Policies in
summer 2010 and re-designated in 2014. The Centre continues methodology work started
under the framework of the PPRI and PHIS projects: One of the Centre’s explicit tasks is to
develop the tool for for describing and analysing national pharmaceutical pricing and reim-
bursement systems ("Pharma Profiles"). WHO Collaborating Centre staff are also involved as
experts in the development of the WHO Pharmaceutical Country Profiles by supporting to
expand the current tool of the “PPRI Pharma Profiles” for the European countries, and
adapting it so that it can describe the pharmaceutical sector in other health system arrange-
ments.
Within the PPRI and PHIS projects, websites were established. Policy makers, researchers
and the interested public are thus offered open access to our findings and methodological
tools developed. The PPRI and PHIS project websites are no longer maintained, all relevant
PPRI and PHIS information was integrated in the website of the WHO Collaborating Centre
for Pharmaceutical Pricing and Reimbursement Policies: http://whocc.goeg.at. The website
of the Centre is designed to serve as an information platform about pharmaceutical policies,
and it includes published profiles, indicators of the PHIS database, glossaries and templates
for reporting of pharmaceutical pricing and reimbursement information.

VIII
Table of content
Acknowledgements ............................................................................................................................... III
Introduction ............................................................................................................................................ V
List of tables .......................................................................................................................................... X
List of abbreviations ............................................................................................................................ XI
1 Health care system ............................................................................................................................ 1
1.1 Population and age structure .................................................................................................. 1
1.2 Organisation of the health care system .................................................................................. 1
1.3 Health expenditure .................................................................................................................. 3
1.4 Sources of funding .................................................................................................................. 3
2 Pharmaceutical system .................................................................................................................... 5
2.1 Organisation of the pharmaceutical system ............................................................................ 5
2.2 Availability of and access to medicines .................................................................................10
2.3 Development of the pharmaceutical sales ............................................................................10
2.4 Pharmaceutical consumption ................................................................................................11
2.5 Generics ................................................................................................................................12
2.6 Top 10 medicines ..................................................................................................................12
2.7 Market players .......................................................................................................................13
2.7.1 Industry .............................................................................................................................13
2.7.2 Wholesalers ......................................................................................................................14
2.7.3 Retailers ............................................................................................................................15
2.8 Pharmaceutical expenditure ..................................................................................................18
2.9 Sources of funding ................................................................................................................19
3 Pricing, reimbursement and volume control in the out-patient sector......................................20
3.1 Organisation of the out-patient sector ...................................................................................20
3.2 Pricing of medicines ..............................................................................................................20
3.2.1 Pricing policies ..................................................................................................................20
3.2.2 Pricing Procedures ...........................................................................................................22
3.2.3 Discounts / rebates ...........................................................................................................23
3.2.4 Remuneration of wholesalers and pharmacists ................................................................23
3.2.5 Taxes ................................................................................................................................24
3.3 Reimbursement of medicines ................................................................................................24
3.3.1 Reimbursement policies ...................................................................................................25
3.3.2 Reimbursement procedure ...............................................................................................26

IX
3.3.3 Private pharmaceutical expenses .....................................................................................32
3.4 Volume control ......................................................................................................................33
3.4.1 Generic substitution ..........................................................................................................33
3.4.2 INN prescribing .................................................................................................................34
3.4.3 Other generic promotion ...................................................................................................34
3.4.4 Claw-backs .......................................................................................................................35
3.4.5 Managed-entry agreements ..............................................................................................35
3.5 Evaluation ..............................................................................................................................35
3.5.1 Prescription monitoring .....................................................................................................35
3.5.2 Pharmaceutical consumption monitoring ..........................................................................36
3.5.3 Decision making tools .......................................................................................................36
4 Pricing, reimbursement and volume control in the in-patient sector ........................................37
4.1 Organisation of the in-patient sector .....................................................................................37
4.2 Pricing and purchasing policies.............................................................................................37
4.3 Procurement ..........................................................................................................................38
4.4 Reimbursement .....................................................................................................................40
4.4.1 Hospital pharmaceutical formularies ................................................................................40
4.4.2 Pharmaceutical and Therapeutic Committees ..................................................................40
4.5 Volume Control in the in-patient sector .................................................................................41
4.5.1 Monitoring .........................................................................................................................41
4.5.2 Decision-making tools .......................................................................................................41
4.5.3 Evaluation of measures ....................................................................................................42
4.5.4 Reports and results ...........................................................................................................42
5 Interface management and developments ...................................................................................43
5.1 Interface management ..........................................................................................................43
5.2 Developments .......................................................................................................................44
6 Bibliography .....................................................................................................................................46
6.1 Literature ...............................................................................................................................46
6.2 Legislation .............................................................................................................................46
6.3 Web links ...............................................................................................................................46

X
List of tables
Table 1.1: Norway – Demographic indicators 2000, 2005, 2010–2013 .................................................. 1
Table 1.2: Norway – Health expenditure 2000, 2005, 2010–2013 ......................................................... 3
Table 2.1: Norway – Legal basis and actors of the pharmaceutical system, 2015 ................................. 8
Table 2.2: Norway – Annual prescriptions in the out-patient sector 2000, 2005, 2010–2014 ..............10
Table 2.3: Norway – Number of new molecular entities with Marketing Authorisation, 2003-2013 .....10
Table 2.4: Norway– Development of the generic shares in volume and value, 2008, 2013 ................12
Table 2.5: Norway – Top 10 active ingredients in value in the out-patient sector, 2014 ......................12
Table 2.6: Norway – Top 10 active ingredients in value in the in-patient sector, 2014 ........................13
Table 2.7: Norway – Retailers of medicines 2000, 2005, 2010–2013 .................................................17
Table 2.8: Norway – Total pharmaceutical expenditure 2006, 2008, 2010–2014 ................................18

XI
List of abbreviations
ATC Anatomic therapeutic chemical classification
DRG Diagnosis related group
INN International Non-proprietary Name
GDP Gross domestic product
GP General practitioner
HE Health expenditure
HELFO Norwegian Health Economics Administration
HOD Ministry of Health and Care Services
HTA Health technology assessment
LIS The Norwegian Drug Procurement Cooperation
LMI Norwegian Association of Pharmaceutical Manufacturers
NCU National currency unit
NIS National Insurance Scheme
NorPD The Norwegian Prescription Database
NPA The Norwegian Pharmacy Association
Mio. Million
OECD Organisation for Economic Co-operation and Development
OPP Out-of-pocket payment
OTC Over-the-counter medicine
PE Pharmaceutical expenditure
POM Prescription-only medicine
PPP Pharmacy Purchasing Price
PPRI Pharmaceutical Pricing and Reimbursement Information project
PRP Pharmacy retail price

XII
QALY Quality adjusted life year
RHA Regional Health Authority
THE Total health expenditure
TPE Total pharmaceutical expenditure
VAT Value added tax
WHO World Health Organisation

PPRI Pharma Profile 2015
Norway
1
1 Health care system
This section gives a brief introduction to the demographic and economic situation of the
country as well as on the access to the health care system.
1.1 Population and age structure
Table 1.1: Norway – Demographic indicators 2000, 2005, 2010–2013
Demography 2000 2005 2010 2011 2012 2013
Total population* 4,503,436 4,640,219 4,920,305 4,985,870 5,051,275 5,109,056
Population aged 0-14* 902,431 906,811 921,709 923,575 927,384 930,845
Population aged 15-64* 2,922,179 3,050,939 3,256,353 3,294,281 3,333,277 3,365,653
Population aged > 64* 678,826 682,469 742,243 768,014 790,614 812,558
Life expectancy at birth 78.7 80.2 81.0 81.3 81.5 81.7
Life expectancy at age 65 83.0 84.0 84.5 84.7 84.7 84.9
*1st of January following year
Source: Statistics Norway
The population of Norway reached 5.1 Mio. in 2013. This corresponds to an average of 15.8
people per km2. The population is unevenly distributed. The major urban areas are located
along the coastline of southern Norway, especially in the Oslo, Stavanger, Bergen, and
Trondheim areas. The inland and the northern parts of Norway are more scarcely populated.
The average life expectancy has been increasing steadily and is still increasing. In 2013 the
average life expectancy was 79.7 years for men and 83.6 years for women. The percentage
of the population over 64 years is rising slowly. It is expected to increase significantly as a
result of the ageing of the post-war generations.
The total number of deaths in 2012 was 41,992. Diseases of the circulatory system are still
the leading cause of deaths, accounting for approximately 31% (2012) of the total. There
has, however, been a significant reduction in mortality due to lower rates of diseases of the
circulatory system since the 1970s. Malign tumours accounted for 26% of deaths and dis-
eases in the respiratory system accounted for 10% (2012).
1.2 Organisation of the health care system
The Norwegian health care system has developed gradually in the context of welfare policy
in Norway, where equality and justice are highly valued. All individuals should have equal
access to a decent standard of living, work, a place to live, and coverage of crucial health
and social services, independently of where they reside or their economic situation.

PPRI Pharma Profile 2015
Norway
2
Following from this welfare policy, a key feature of the health care system is the predomi-
nance of tax-financed public provision. The hospitals and the primary health care system
have been financed largely by block grants from the central authorities and reimbursement
from the state-owned National Insurance Scheme (NIS). Membership of this programme is
mandatory and universal, and is financed by compulsory contributions from tax-payers. The
NIS covers retirement pensions, disablement benefits, sickness benefits, unemployment
benefits and health care, including pharmaceuticals.
The health care system in Norway is organized on three levels: the central State, the four
regional authorities and the municipalities. While the role of the State is to provide national
health policy, to prepare and oversee legislation and to allocate funds, the main responsibility
for the provision of health care services lies with the four health regions and the 428 munici-
palities.
At the national level, the political decision-making body is the Parliament. The executive body
is the Government, along with the Ministry of Health and Care Services (HOD). The respon-
sibilities of the national bodies include determining policy, preparing legislation, undertaking
national budgeting and planning, licensing institutions and capacity expansion. The munici-
palities provide primary health care, including nursing care for the disabled and the elderly,
while responsibility for specialised health care lies with the Regional Health Authorities that
are owned by the central Government. Dental care is still part of the county’s responsibilities.
The municipalities are responsible for the provision and funding of primary health care and
social services. All citizens have the right to health care services in their community. Nor-
way’s four Regional Health Authorities (RHAs) are responsible for the financing, planning
and provision of specialised care. This includes somatic care and care of individuals with
mental health problems as well as substance abusers, along with other specialised medical
services, such as laboratory-based work, radiology and paramedical services. There are 25
health enterprises under the four RHAs.
The health care system is mostly publicly owned, although there are some contracts with
private agencies, mainly between municipalities and general practitioners (GPs), and be-
tween the RHAs and specialist physicians. The HOD provides instructions to the RHAs by a
“letter of commission”, which is prepared individually for each of the four authorities. The
governance of the municipalities relating to primary health care is mainly an interplay be-
tween the HOD and the Ministry of Local Government and Regional Development.
Principal health policy objectives and frameworks are determined by the central Government
and form the basis for the management of the health enterprises, while day-to-day manage-
ment is the responsibility of the general manager and the executive board of the RHA. The
municipalities are governed by locally elected politicians. Health care is one of many areas
for which they are responsible.
Important acts that form the basis for the Norwegian health care system:
The Health and Care Services Act - 2011
The Specialist Health Care Services Act - 1999

PPRI Pharma Profile 2015
Norway
3
The Dental health Care Act - 1983
The Mental Health Care Act - 1999
The Patients Rights Act - 1999
1.3 Health expenditure
Table 1.2: Norway – Health expenditure 2000, 2005, 2010–2013
Health expenditure in NCU = NOK, mill.
2000 2005 2010 2011 2012 2013
GDP 1,481,242 1,958,907 2,544,266 2,750,780 2,908,924 3,011,410
THE 124,728 176,984 239,730 255,366 270,052 288,283
- thereof public HE, % 82.5 83.5 84.7 84.8 85.0 85.5
- thereof private HE, % 17.5 16.5 15.3 15.2 15.0 14.5
HE in the out-patient sector n.a. n.a. n.a. n.a. n.a. n.a.
- thereof public n.a. n.a. n.a. n.a. n.a. n.a.
- thereof private n.a. n.a. n.a. n.a. n.a. n.a.
HE in the in-patient sector n.a. n.a. n.a. n.a. n.a. n.a.
- thereof public n.a. n.a. n.a. n.a. n.a. n.a.
- thereof private n.a. n.a. n.a. n.a. n.a. n.a.
Exchange rate (NCU per €) 8.11 8.01 8.01 7.79 7.47 7.81
GDP = gross domestic product, HE = health expenditure, NCU = national currency unit, THE = total health expenditure
Source: Statistics – Norway, European Central Bank
1.4 Sources of funding
Sources of revenue for health care in Norway include budgets from government and munici-
pal level, the National Insurance Scheme (NIS) and private expenditure. The Norwegian
health care system is primarily funded by taxes. However, dental care is mainly funded by
private expenditure. There is no specific health tax in Norway, and the Regional Health
Authorities cannot themselves draw taxes.
All residents of Norway or people working in the country are insured under the National
Insurance Scheme (NIS), which is run by central Government. People insured under the NIS
are entitled to retirement, survivors’ and disability pensions, basic benefits and attendance
benefit in case of disability, rehabilitation or occupational injury. There are also benefits for
single parents, cash benefits in case of sickness, maternity, adoption and unemployment,
and medical benefits in case of sickness and maternity. Private health insurance does not
play a significant role in Norway, but is increasing. In 2013 approximately 340,000 persons

PPRI Pharma Profile 2015
Norway
4
were covered by additional private health insurance. Employers paid the insurance for nine
out of ten. (Source: www.vg.no/Finance Norway).
The Regional Health Authorities, funded by the central Government, fund the health enter-
prises which in turn fund the local hospitals. The hospitals are remunerated by a mixture of
ex-ante fixed budgeting (50%) and a diagnosis-related group (DRG) system (50%) for somat-
ic care/services. Other services are mainly funded by ex-ante fixed budgets.
Treatment for patients from abroad is billed to the patient’s insurance scheme. There is no
particular billing for medicines only.
Informal payments play no part in funding of health care in Norway.
PPRI Pharma Profile 2015
Norway
5
2 Pharmaceutical system
This section provides a description of the pharmaceutical system; its organisation, regulatory
framework and authorities, the market players and the funding of the system for the out-
patient and the in-patient sectors as of 2015.
2.1 Organisation of the pharmaceutical system
Norway, as part of the European Economic Area, adheres to EU-regulations regarding
marketing authorisations (MA). The Norwegian Medicines Agency (NoMA) contributes to the
work of the European Medicines Agency (EMA), alongside agencies from the EU-member
states.
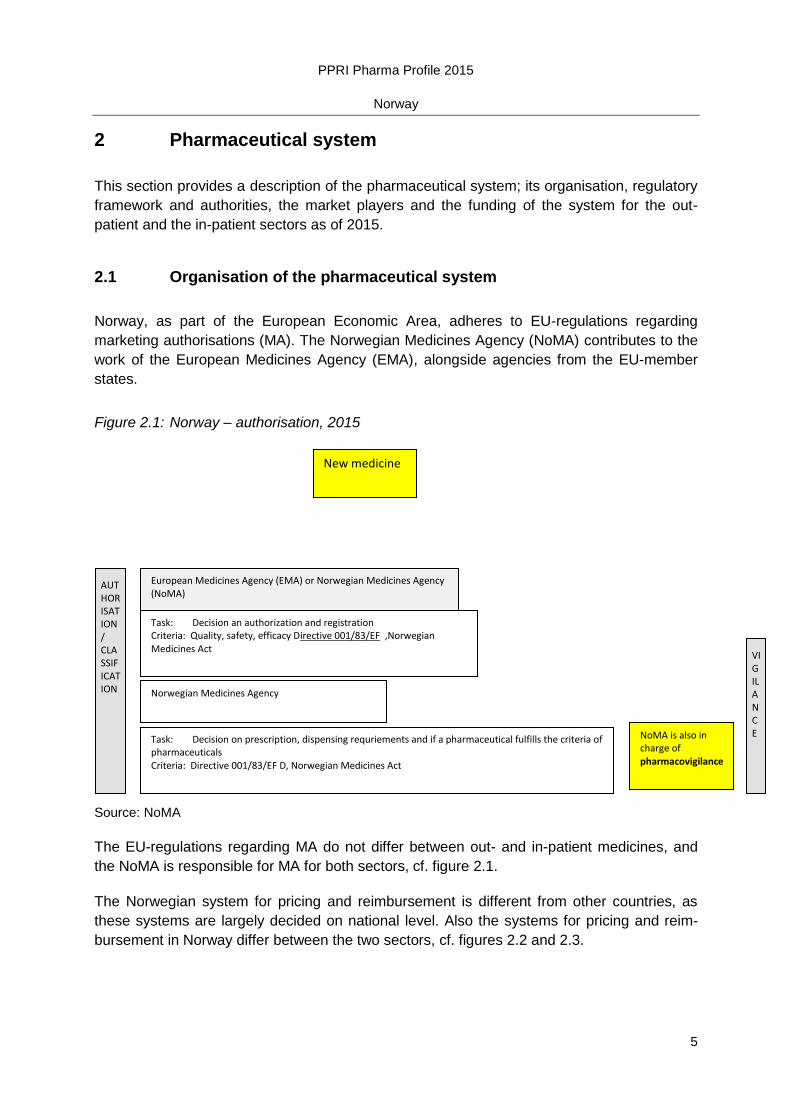
Figure 2.1: Norway – authorisation, 2015
Source: NoMA
The EU-regulations regarding MA do not differ between out- and in-patient medicines, and
the NoMA is responsible for MA for both sectors, cf. figure 2.1.
The Norwegian system for pricing and reimbursement is different from other countries, as
these systems are largely decided on national level. Also the systems for pricing and reim-
bursement in Norway differ between the two sectors, cf. figures 2.2 and 2.3.
New medicine
European Medicines Agency (EMA) or Norwegian Medicines Agency (NoMA)
Task: Decision an authorization and registration Criteria: Quality, safety, efficacy Directive 001/83/EF ,Norwegian Medicines Act
Norwegian Medicines Agency
Task: Decision on prescription, dispensing requriements and if a pharmaceutical fulfills the criteria of pharmaceuticals Criteria: Directive 001/83/EF D, Norwegian Medicines Act
AUTHORISATION/ CLASSIFICATION
NoMA is also in charge of pharmacovigilance
VIGILANCE

PPRI Pharma Profile 2015
Norway
6
Figure 2.2: Norway – Flowchart of pricing and reimbursement in out-patient sector, 2015
Source: NoMA
HELFO, the Norwegian Health Economics Administration, is responsible for the actual
reimbursement of all services, medical devices and pharmaceuticals that are covered by the
NIS.
PRICING at ex-factory level is not regulated in Norway
Pharmacies Maximum pharmacy purchasing price and pharmacy mark-up scheme set by the NoMA
PRICING at
pharmacy level
NoMA In consultation with
National Advisory Commit-tee for Drug Reimbursement
Task: Decision on the reimbursement status Criteria: Pharmacological, medical therapeutic, pharmaeconomic criteria
REIMBURSEMENT
Reimbursable medicines
Reimbursement only on individual basis
National Reimbursement Code
Preapproved prescription
Preapproved prescription, subject to particular conditions
Individual application, approval by HELFO subject to particular conditions
OUT-PATIENT

PPRI Pharma Profile 2015
Norway
7
Figure 2.3: Norway – Flowchart of pricing and reimbursement in in-patient sector, 2015
Source: NoMA
Regional Health Authorities
Commissions evaluations from:
Norwegian Medicines Agency
Hospital pharmacies, pharmacists, departments and pharmaceutical and therapeutic committees
In consultation with:
Hospital purchasing body: Drug Procurement Cooperation (LIS)
Health Enter-prise/hospital
Pharmaceutical and Therapeutic Committee
Task: Decision on use of medicines in specific hospitals
List of preferred products/suppliers
Task: Tendering of medicines Criteria: Depending on the product or on the market situation of the medicine
In consultation with:
Evaluates cost-effectiveness of selected in-patient medicines.
Cooperate/align decisions on reimbursement of costly medicines.

PPRI Pharma Profile 2015
Norway
8
Table 2.1: Norway – Legal basis and actors of the pharmaceutical system, 2015
Fields Legal basis Scope (in-patient, out-patient
sector)
Authorities in English (local name, ‚
local abbreviation)
Activity / responsibility in the pharmaceutical
system
Actors and interest associa-tions in English
(local name, local abbreviati-on)
Market authorisation The Norwegian Act on Medicinal Products
Norwegian Regulation relating to Medicinal Products
In- and out-patient sector. All registered/licensed pharmaceuticals (POM, OTC).
The Norwegian Medicines Agency (Statens legemid-delverk, SLV)
In charge of market authori-sation, classification and pharmaco-vigilance.
Norwegian Association of Pharmaceutical Manufacturers (LMI)
Norwegian Association of Generics-oriented Pharmaceu-tical Manufacturers ( NIGeL)
Pricing / Purchasing The Norwegian Act on Medicinal Products.
Norwegian Regulation relating to Medicinal Products
All registered POM.
In-patient
The Norwegian Medicines Agency (Statens legemid-delverk, SLV)
LIS
In charge of pricing. LMI
NIGeL
Norwegian Pharmacy Associa-tion
Reimbursement The Norwegian Act on Medicinal Products.
Norwegian Regulation relating to Medicinal Products
Out-patient sector:
Registered POM (and some OTC) pharmaceuti-cals.
In-patient
The Norwegian Medicines Agency (Statens legemid-delverk, SLV),
Norwegian Health Econom-ics Administration (HELFO)
Regional Health Authori-ties/Health Enterprises
In charge of deciding reimbursement-status
In charge of reimbursing. Subordinate of The Director-ate of Health (Helsedirektor-atet),
LMI
NIGeL
Patient organisations
Promotion The Norwegian Act on Medicinal Products.
Norwegian Regulation relating to Medicinal Products
All interaction between manufacturers/MA-holders and health personnel/ patients/distribution chain.
The Norwegian Medicines Agency (Statens legemid-delverk, SLV)
In charge of monitoring information/promotion activities.
LMI
NIGel
Distribution The Norwegian Act on Medicinal Products.
Regulation on wholesalers
All market players in the distribution chain
The Norwegian Medicines Agency (Statens legemid-delverk, SLV)
In charge of supervising importers, wholesalers and pharmacies.
Wholesalers,
Pharmaceutical Wholesalers Association (Legemiddel-grossist-foreningen)

PPRI Pharma Profile 2015
Norway
9
Fields Legal basis Scope (in-patient, out-patient
sector)
Authorities in English (local name, ‚
local abbreviation)
Activity / responsibility in the pharmaceutical
system
Actors and interest associa-tions in English
(local name, local abbreviati-on)
Vigilance The Norwegian Act on Medicinal Products.
Norwegian Regulation relating to Medicinal Products
MA-holder The Norwegian Medicines Agency (Statens legemid-delverk, SLV)
In charge of pharmaco-vigilance.
LMI
NIGeL
Source: NoMA
The legal basis and the actors in the pharmaceutical system have been stable since 2002
.

10
2.2 Availability of and access to medicines
Table 2.2: Norway – Annual prescriptions in the out-patient sector 2000, 2005, 2010–2014
*Prescription in volume = number of prescriptions settled in pharmacies, human and veterinary. Source: NPA **Prescription in value = public expenditure of prescribed medicines. Source: NorPD, NIPH
*In the electronic prescription system each package is defined as a prescription, whereas
there can be several packages prescribed on a paper prescription. Implementation of elec-
tronic prescriptions started in 2011. In 2012 15% of the prescriptions were electronic, in 2014
75%. The number of prescriptions 2011 – 2014 is therefore not comparable. The growth in
prescriptions from 2013 to 2014, by the definition of electronic prescriptions, was 1.8%.
(Norwegian Pharmacies Association, NPA)
The figures also include “H-prescriptions”. These are prescriptions that are reimbursed by the
hospitals, cf. section 4.1. In 2014 0.3% of the prescriptions were “H-prescriptions”. The
medicines on “H-prescriptions” are rather costly, and their value (PRP) in 2014 was NOK 2.0
billion, approximately 11% of the total prescriptions. (NPA)
Table 2.3: Norway – Number of new molecular entities with Marketing Authorisation,
2003-2013
New molecular entities 2003 – 2013 2008 – 2013
Number of new molecular entities
450 212
Source: NoMA, LMI Tall og fakta 2014
The time it takes from a new medicine is granted a market authorisation (MA), to it actually
being available on the market, can vary a lot. Some products that are granted a MA never
actually hit the market. After obtaining a MA, the MA-holder must apply for a maximum
pharmacy purchasing price before the product can be marketed. The average processing
time of a price-application was 26 days in the first quarter in 2015. Applications for general
reimbursement were in average processed in 78 days in 2014. The maximum processing
times are 90 and 180 days respectively.
2.3 Development of the pharmaceutical sales
The overall market has been steadily growing. However, the growth is slowing down. There
are several reasons for this. The introduction of a pricing regime linked to prices in other
European countries has had a moderating effect on the Norwegian price level. The “step-
Prescriptions 2005 2010 2011 2012 2013 2014
No. of prescriptions (in volume)* 25,646 30,658 32,640 43,729* 48,833* 49,878*
Prescriptions in value ** (NOK)
12,268 13,199 13,118 13,524 13,901 15,332

PPRI Pharma Profile 2015
Norway
11
price” system for generics, introduced in 2005, has ensured that prices for generics have
fallen (cf. section 3.2.1).
Important steps towards cost-containment have also been taken for reimbursable medicines.
The use of a “preferred product” system is one tool that has been put to use, cf. section
3.3.1.
Areas with significant growth are in biological pharmaceuticals and novel therapies for
cancer.
Parallell import was in 2014 1.5% of the total volume (POM, packages) and 2.5% of value
(Farmastat).
2.4 Pharmaceutical consumption
Table 2.4: Norway – Annual pharmaceutical consumption 2000, 2005, 2010–2013*
DDD = defined daily doses, n.a. = not available
* Including sales of products with approved market authorisation in Norway, excluding sales of veterinary medicines.
** Exluding sales of some vaccines and blood products.
*** Including only the ATC groups where DDDs are assigned.
Source: Norwegian Drug Wholesales Statistics, Norwegian Institute of Public Health
Consumption
(mio.)
2000** 2005 2010 2011 2012 2013
Total pharmaceutical consumption
In packs 68.7 81.1 84.7 87.0 88.6 88.7
In DDD*** 1,754 2,230 2,582 2,625 2,689 2,734
Pharmaceutical consumption in the in-patient sector
In packs n.a. n.a. n.a. n.a. n.a. n.a.
In DDD n.a. n.a. n.a. n.a. n.a. n.a.
Pharmaceutical consumption in the out-patient sector
In packs n.a. n.a. n.a. n.a. n.a. n.a.
In DDD n.a. n.a. n.a. n.a. n.a. n.a.

PPRI Pharma Profile 2015
Norway
12
2.5 Generics
Table 2.4: Norway– Development of the generic shares in volume and value, 2008, 2013
Generic share Volume - DDD Value
2008 2013 2008 2013
Shares in % of total market (in-patient/ out-patient)
39.8 44.6 n.a. n.a.
Shares in % of total out-patient market
n.a. n.a. n.a. n.a.
Shares in % of out-patient reimbursement market
n.a. n.a. n.a. n.a.
Shares in % of out-patient off-patent market
n.a. n.a. n.a. n.a.
Shares in % of the in-patient market
n.a. n.a. n.a. n.a.
Source: LMI
The volume of generics in the total market has been growing the last ten years. There are
several causes for this. Generic substitution in pharmacies was implemented in 2001 and
patents of several major medicines have expired during the period.
There are no specific legal regulations regarding marketing authorisations for generics in
Norway. EU-regulations apply (cf. section 2.1).
2.6 Top 10 medicines
Table 2.5: Norway – Top 10 active ingredients in value in the out-patient sector, 2014
Position Top active ingredients used in the out-patient sector, ranked with regard to consumption* 2013
Position Top active ingredients used in the out-patient sector, ranked with regard to
expenditure** 2014
1 J01CE02 Phenoxymethylpenicillin 1 R03AK06 Salmeterol
2 M01AB05 Diclofenac 2 N02BE01 Paracetamol
3 N02BE01 Paracetamol 3 R03AK07 Formoterol
4 N02AA59 Codeine, comb. Excl. phycholeptics
4 B02BD02 Coagulation factor VIII
5 B01AC06 Acetylic Acid 5 J05AX15 Sofosbuvir
6 N05CF01 Zopiclone 6 N07BA01 Nicotine
7 C10AA01 Simvastatine 7 M01AE01 Ibuprophen
8 R06AE07 Cetirizine 8 A02BC05 Esomeprazole
9 C07AB02 Metoprolol 9 R03BB04 Tiotropiumbromid
10 R05DA01 Ethylmorphine 10 N06BA04 Metylphenidate
* Ranked by number of users of POM, Source: NIPH/NorPD
** Ranked by sales from community pharmacies (excl. of hospital pharmacies and “H-prescriptions”).
Source: NPA

PPRI Pharma Profile 2015
Norway
13
Table 2.6: Norway – Top 10 active ingredients in value in the in-patient sector, 2014
Position Top active ingredients used in the in-patient sector, ranked with regard
to consumption
Position Top active ingredients used in the in-patient sector, ranked with regard to
expenditure
1 n.a. n.a. 1 L04AB04 Adalimumab
2 n.a. n.a. 2 L04AB01 Etanercept
3 n.a. n.a. 3 L04AB02 Infliximab
4 n.a. n.a. 4 L01XG02 Rituximab
5 n.a. n.a. 5 L04AA27 Fingolimod
6 n.a. n.a. 6 L04AB06 Golimumab
7 n.a. n.a. 7 L02BX03 Aberatiron
8 n.a. n.a. 8 L01XC03 Trastuzumab
9 n.a. n.a. 9 L04AA23 Natalizumab
10 n.a. n.a. 10 L04AB05 Certolizumab pegol
“H-prescriptions” included
Source: LIS
2.7 Market players
2.7.1 Industry
All the major pharmaceutical companies are represented in Norway, but only a few of them
have established their own manufacturing units in the country. Nine companies have produc-
tion facilities in Norway. The biggest ones are GE, Takeda and Fresenius Kabi.
Biotechnological companies emerge in increasing numbers, such as in the cancer medicines
area, neurological disorders, maritime and technical fields of industry.
The main industry organisations and the dominating characteristics of their members are:
Legemiddelindustrien (Norwegian Association of Pharmaceutical Manufacturers, LMI)
– research-orientated companies, with or without a generics portfolio and small-
medium sized Norwegian biotech companies. In addition all pharmaceutical compa-
nies specialising in aquacultures are members. Most of the Norwegian pharmaceuti-
cal industry is represented by LMI.
Norsk Industriforening for Generiske Legemidler (Norwegian Association of Generics-
orientated Pharmaceutical Manufacturers, NIGeL) – generics-orientated companies;
Direct distribution from the manufacturer to the end-user is in general not allowed. As a result
all distribution, with some minor exceptions, is done by a wholesaler. The main bulk of
pharmaceuticals are then further distributed by pharmacies. An important exception is a
limited selection of over-the-counter medicines that can be sold to the end user by other
channels as well (cf. section 2.7.3).

PPRI Pharma Profile 2015
Norway
14
The industry does not take direct part in policy-making, but new policies and changes in the
legal framework are normally not put into action before all parties affected have been given
an opportunity to formally express their views and present their alternative solutions. The
industry organisations may also take part in working groups on specific issues related to
policy-making.
The importance of Norway’s domestic pharmaceutical industry to the national economy is
rather small. The estimated value of exported pharmaceutical products was approximately
NOK 4.6 billion /€ 550 Mio.) in 2013 (LMI 2014).
In 2012, the pharmaceutical industry in Norway invested approximately NOK 1 billion / € 120
Mio. in science and development (LMI 2014).The industry has approximately 3,800 (LMI
members) employees and contributes to the accumulation and diffusion of relevant scientific
knowledge in hospitals and private business involved in science.
2.7.2 Wholesalers
There are three major wholesalers of medicines in Norway, each with their own pharmacy
chain. They belong to the leading European pharmaceutical distribution companies. The
companies are listed in the table below.
Table 2.7: Norway - Wholesalers, 2014
Company Market share (%) Ownership
Apokjeden Distribusjon AS 33.0
Tamro OY/Phoenix
Alliance Healthcare Norge AS 14.7 Alliance Boots Ltd
NMD AS 52.3 Celesio AG
Source: LMI and NPA
In general, pharmacies get supplies from the wholesalers on a daily basis. As of January
2015 the obligation on wholesalers that distribute to pharmacies, to sell the full range of
medicines with market authorisation was omitted.
As of January 2015 Alliance Healthcare took over as wholesaler for hospitals and hospital
pharmacies after NMD. The market share of the latter will therefore be lower from 2015 and
higher for Alliance.
Parallel trade wholesalers do not exist per se, but the major wholesalers engage in parallel
export. There are also 2-3 companies that specialise in parallel import.

PPRI Pharma Profile 2015
Norway
15
2.7.3 Retailers
In general only community and hospital pharmacists are allowed to dispense medicines,
along with small outlets belonging to the pharmacies. Other dispensaries (drug stores,
supermarkets, kiosks and petrol stations), are allowed to distribute a small selection of OTC.
2.7.3.1 Community pharmacies
The pharmacies’ activities are regulated by the Norwegian Pharmacy Act and the associated
regulations on pharmacies. The 768 community pharmacies (as of January 2015) are priva-
tely owned. Until 2001 one had to be a pharmacist to own a pharmacy. Since 2001 anyone
can own a pharmacy, but one has to be a pharmacist to run it. Since 2001 there have been
no limitations on establishing new pharmacies. Since 2001 the pharmacy chains have bought
most of the existing pharmacies in Norway and established a lot of new ones. A total of 84%
of the private pharmacies are totally owned by a wholesale company.
Pharmacy chains are allowed. There are three vertical integrated pharmacy chains operating
in Norway, owning a total of 643 pharmacies. In addition there is a chain of semi-
independent pharmacies and a few independent pharmacies.
There are approximately 6,400 inhabitants per pharmacy (incl. hospital pharmacies, NPA).
The Norwegian Pharmacy Association represents the interests of the owners of the pharma-
cies. The Norwegian Association of Pharmacists represents the interests of the profession.
The pharmacies’ margin for prescription-only medicines (POM) is regulated, but the total
margin is not.
Subvention, according to specific criteria, can be applied for to operate pharmacies in rural
areas to ensure accessibility to pharmacy. In addition, pharmacies may apply for 50% refund
of freight costs when patients are too sick or have too long or burdensome journeys to the
nearest pharmacy.
Mail orders or sale by Internet of POM from the pharmacy to the end-user, is allowed only in
the geographical district of the pharmacy, whereas over-the-counter-medicines may be sold
outside of the geographical district. The Government plans to alter the regulation in order to
allow sale also outside of the geographical district. This will probably make sale by Internet
more profitable for the pharmacies.
2.7.3.2 Dispensing doctors
Out-patient doctors are in general not allowed to dispense medicines beyond what is regard-
ed as necessary for the start of treatment before the patient can get access to a pharmacy.
Doctors are not allowed to own any part of a pharmacy.
Doctors in the rural areas operating far from a pharmacy are allowed to dispense medicines
when normal availability is restricted due to weather or geographical complications. The Act

PPRI Pharma Profile 2015
Norway
16
on Medicinal Products § 17 gives the legal basis for this. The number of doctors with such a
licence is estimated to be around 10. The dispensing doctors are allowed to add a 10% extra
mark-up on the fixed prices.
Nurses may dispense medicines under the same regulations as for dispensing doctors, i.e.
when it is highly complicated for the patient to reach a pharmacy or medical doctor. Public
health nurses may prescribe contraceptive pills.
2.7.3.3 Hospital pharmacies
The hospital pharmacies are owned by the Regional Health Authorities. The 32 hospital
pharmacies are responsible for procurement of medicines, production of ready to use injecti-
on/infusion and pharmaceutical services including clinical pharmacies (some clinical phar-
macy).
The principal task of hospital pharmacies is to provide pharmaceuticals for the hospital.
However, all hospital pharmacies have a department open to the public, mainly to serve
patients, hospital employees and visitors. The pharmacies dispense prescriptions and sell
health related products.
Pharmacies, wholesalers and suppliers are allowed to deliver medicines to hospitals. Phar-
macies are allowed to deliver any medicine to hospitals and wholesalers are entitled to
deliver medicines on a specified list. Suppliers may act as wholesalers and deliver their own
products. In practice most medicines are delivered to hospitals by a pharmacy, mostly by a
hospital pharmacy. There is an agreement/contract between each hospital pharmacy and the
hospital. The distribution to the hospitals (cf. section 4.2) is organized by a contract with one
wholesaler.
2.7.3.4 Other POM dispensaries
Many pharmacies in rural areas have established pharmacy outlets from which medicines
are handed out to patients under the supervision of the pharmacy. There exist about 900
such outlets, mainly in the grocery stores. These outlets are located where there are no
regular pharmacies (at least 10 km distance from any other pharmacy or outlet). They keep
in stock a small selection of over-the-counter (OTC) products and can dispense prescription
medicines sent by the pharmacy. The legal basis for these outlets is Act on Medicinal Prod-
ucts § 16.

PPRI Pharma Profile 2015
Norway
17
2.7.3.5 Other retailers
Grocery stores, gasoline stations, health stores, etc. are allowed to distribute a restricted list
of OTC; these are known as medicines sold outside of the pharmacies (LUA). These outlets
are not connected to a pharmacy and don’t employ pharmacists. Staff handling the medici-
nes is not allowed to give patients any kind of recommendation, nor to engage in marketing
of the products. The legal basis for these outlets is Act on Medicinal Products § 16.
Table 2.7: Norway – Retailers of medicines 2000, 2005, 2010–2013
Retailers 2000 2005 2010 2011 2012 2013
No. of community pharmacies1
369 506 650 682 714 739
Thereof:
No. of private pharmacies2
369 506 650 682 714 739
Thereof:
No. of public pharmacies
0 0 0 0 0 0
No. of hospital pharmacies for out-
patients
28 30 33 32 32 32
No. of dispensing doctors n.a. n.a. n.a. n.a. n.a. n.a.
No. of other POM disp. n.appl. n.a. n.a. n.a. n.a. ≈900
Total no. of POM dispensaries
No. of internet pharmacies n.appl. n.appl. n.appl. n.appl. n.appl. n.appl.
No. of OTC disp., like drugstores 0 7,000 7,000 7,000 7,000 7,000
Disp. = dispensaries, No. = number, OTC = over-the-counter medicines, POM = prescription-only medicines
POM dispensaries are facilities that are allowed to sell POM to out-patients
1hospital pharmacies dispensing to out-patients are not included in this figure
2Private pharmacies are pharmacies owned by private persons or entities; public pharmacies are in public ownership.
Data as of 1 January
Source: NPA
PPRI Pharma Profile 2015
Norway
18
2.8 Pharmaceutical expenditure
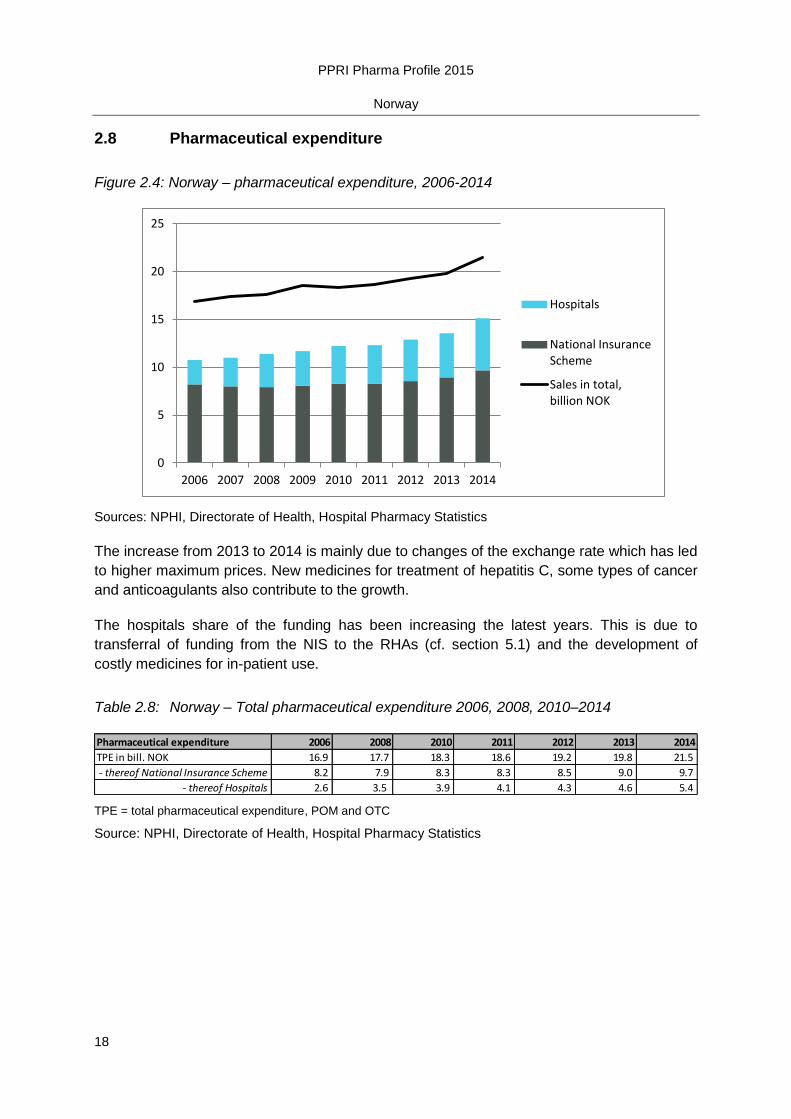
Figure 2.4: Norway – pharmaceutical expenditure, 2006-2014
Sources: NPHI, Directorate of Health, Hospital Pharmacy Statistics
The increase from 2013 to 2014 is mainly due to changes of the exchange rate which has led
to higher maximum prices. New medicines for treatment of hepatitis C, some types of cancer
and anticoagulants also contribute to the growth.
The hospitals share of the funding has been increasing the latest years. This is due to
transferral of funding from the NIS to the RHAs (cf. section 5.1) and the development of
costly medicines for in-patient use.
Table 2.8: Norway – Total pharmaceutical expenditure 2006, 2008, 2010–2014
TPE = total pharmaceutical expenditure, POM and OTC
Source: NPHI, Directorate of Health, Hospital Pharmacy Statistics
0
5
10
15
20
25
2006 2007 2008 2009 2010 2011 2012 2013 2014
Hospitals
National Insurance Scheme
Sales in total, billion NOK
Pharmaceutical expenditure 2006 2008 2010 2011 2012 2013 2014
TPE in bill. NOK 16.9 17.7 18.3 18.6 19.2 19.8 21.5
- thereof National Insurance Scheme 8.2 7.9 8.3 8.3 8.5 9.0 9.7
- thereof Hospitals 2.6 3.5 3.9 4.1 4.3 4.6 5.4

PPRI Pharma Profile 2015
Norway
19
2.9 Sources of funding
Figure 2.5 Norway – Split of funding of medicines, 2013
Source: LMI/Farmastat
National Insurance Scheme
reimbursement 47%
Other public funding of POM
0%
Hospitals 24%
POM, payed by patients
12%
Copayments 6%
OTC 11%
Funding of pharmaceutical consumption

PPRI Pharma Profile 2015
Norway
20
3 Pricing, reimbursement and volume control in the out-
patient sector
This section covers a description of the organisation of the pricing system and policies. It
describes also the organisation of the reimbursement system, the reimbursement schemes,
reference price system, private pharmaceutical expenses and the volume control mecha-
nisms in the out-patient sector as of 2015.
3.1 Organisation of the out-patient sector
Refer to figure 2.2 and table 2.1 for an overview of the organization of the pricing and reim-
bursement systems in the out-patient sector.
3.2 Pricing of medicines
3.2.1 Pricing policies
All prescription-only medicines are given maximum prices by the Norwegian Medicines
Agency (NoMA). NoMA sets maximum prices for all POM at the pharmacy purchasing price-
level. The pharmacy retail price (PRP) is regulated upwards by a maximum pharmacy mark-
up set by NoMA. The maximum price is set due to external reference pricing. The current
system was implemented in 2002. It is regulated by law – the Norwegian Act on Medicinal
Products.
The Market Authorisation Holder (MAH) has to apply for a maximum price before entering
the market. NoMA re-evaluates most of the maximum prices on a yearly basis. The Norwe-
gian maximum prices are in general based on the average of the three lowest PPP in Swe-
den, Finland, Denmark, Germany, United Kingdom, the Netherlands, Austria, Belgium and
Ireland.
For generics there is a special price model, the stepped price model (Trinnprismodellen). It
was introduced in January 2005 to reduce costs incurred by the National Insurance Scheme
and patients in relation to the use of generic medicines. In the model the price of a pharma-
ceutical product is reduced stepwise through predefined rates. This occurs after the pharma-
ceutical product has lost patent protection and hence is exposed to generic competition. The
model has been modified three times after its introduction with the aim of reducing medicine
prices. The latest change was implemented in January 2015.

PPRI Pharma Profile 2015
Norway
21
Table 3.1: Norway - Overview of the stepped price system (Trinnprismodellen), 2015
Sales PRP, 12 months before generic competi-tion
< 100 Mio. NOK > 100 Mio. NOK
Time of price-cut
1st step Start of generic competition 35% 35%
2nd
step 6 months after generic competition 59% 81%
Sales PRP, >= 12 months after 2nd
step > 15 Mio. NOK > 30 Mio. or < 100
Mio. NOK > 100 Mio.
NOK
Time of price-cut
3rd
step >= 12 months after 2nd step 69% 88% 90%
NOK = Norwegian Krone, PRP = Pharmaceutical Retail Price
Source: NoMA
The stepped price is the maximum price reimbursed by the National Insurance Scheme, or
the price that patients pay for a pharmaceutical product that is incorporated in the system.
NoMA publishes a list of substances that are included in the system and a list of their current
prices1.
The maximum reimbursement price for a generic substance is set as a percentage of the
maximum pharmacy purchasing price (PPP) of the original medicine at the time it was
exposed to generic competition. The price is cut by two or three steps. The first price-cut
takes place when generic competition arises. The second cut is implemented six months
after generic competition has occurred. The third step is applicable 12 months or more after
the time of the second step. The maximum pharmacy mark-up (cf. section 3.2.4) is added to
the reduced PPP. The reduction rates depend on the annual sale of the product prior to
generic competition. There are specific cut rates for simvastatine and atorvastatine, 96 and
94% respectively. The NOMA may, on a discretionary basis, decide lower cuts than the
standard cut rates. This is sometimes done when the turn-over of the substance is very low.
The pharmacies are obliged to secure the capacity to deliver at least one pharmaceutical
product at a retail price equal to the stepped price. If a medicine is delivered in both small
and large packages, the pharmacy is obliged to deliver both small and large packages at the
stepped price. The wholesalers are obliged to offer the pharmacies medicines that enable
them to fulfil these obligations.
Parallel traded medicines are given the same maximum price as the directly imported medi-
cines. The stepped price system also applies to parallel traded medicines.
Price notification is not part of the statutory pricing system in Norway.
There is no regulation of prices at manufacturer level in Norway.
1 www.noma.no
PPRI Pharma Profile 2015
Norway
22
3.2.2 Pricing Procedures
There is external price referencing on all POM marketed in Norway. According to Regulation
on Medicinal Products, § 12-2 the price decision should take into account the price of the
pharmaceutical in other countries in the EEA (European Economic Area). This has been
operationalised by setting the price at the mean of the three lowest market prices of that
product in a selection of countries. The price that is set is the maximum pharmacy purchas-
ing price (PPP). This system was implemented in 2000. The countries which are included in
the price comparison group are: Sweden, Finland, Denmark, Germany, United Kingdom, the
Netherlands, Austria, Belgium and Ireland.
When setting the price of a medicine, comparison will mainly be drawn with the same product
in the reference countries. If a medicine is marketed under different product names in differ-
ent reference countries they will still be compared for pricing. Price comparison is based on
the price in the local currency, converted to NOK. The mean exchange rate of the last six
whole months, as presented by the Central Bank of Norway, is used for the conversion.
Different varieties of the same product may also be taken into consideration when comparing
prices. In several of the countries which are included in the price comparison group, only
small pack sizes have been registered. If there is a lower price per tablet in a small package
than in a large package, the price per tablet in the large package is set at the same level as
the price per tablet in the small package.
Each Market Authorisation Holder (MAH) is obliged, on request, to give NoMA details of
prices in other countries. The time limit for submission of price details is 21 days from the
time of enquiry. The prices are to be stated at the pharmacy purchasing price (PPP) level.
The price which is set by NoMA is the permitted maximum price to the pharmacy (PPP). The
product can freely be sold at a lower price than the maximum price. The pharmacies’ mark-
up on the PPP is regulated as well, so in fact the maximum pharmacy retail price (PRP) is
regulated.
NoMA revises the price of the 250 top-selling active ingredients on a yearly basis. This is to
make sure that the price level in Norway stays at the right level compared to the reference
countries. NoMA also revises several of the products that sell less to make sure that most
prices will be revised at some point.
Normally prices will not be adjusted more often than once a year.

PPRI Pharma Profile 2015
Norway
23
Table 3.2: Norway – Pricing procedures, 2015
Pricing procedure In use: yes / no
Price type1 Scope2
External price referencing Yes Pharmacy purchasing price All prescription only medicines for humans
Internal price referencing Yes Pharmacy retail price Prescription only medicines with generic competition
Cost-plus pricing No
Indirect profit control No
Risk/cost sharing No
Price/volume agreements No
1 Price type = the level (manufacturer, pharmacy purchasing, pharmacy retail) at which the price is set.
2 Scope = a pricing procedure does not always refer to all medicines: e.g. a pricing procedure could only refer to reimbursable medicines, whereas for Over-The-Counter medicines there is free pricing.
Source: NoMA
3.2.3 Discounts / rebates
The statutory prices are maximum prices, and discounts are allowed. However all discounts
should be given simultaneously with the sale, and all prices reported to the authorities should
be reported as net-prices (Law on Medicinal Products §§ 6 and 14). However, due to the
market situation and the existence of a third-party payer, the discounts on the pharmacy
purchasing price and the pharmacy retail price are negligible.
3.2.4 Remuneration of wholesalers and pharmacists
Pharmacy mark-ups are regulated (by decree) by the NoMA, according to Regulation on
Medicinal Products § 12-3. The established pharmacy mark-up is a maximum mark-up and is
applied for all price-regulated medicines, including both reimbursed and non-reimbursed
medicines. The scheme is regressive. The scheme was revised as of the 1st of January 2014
and was made more regressive as the percentage for medicines with a PPP > NOK 200 was
reduced from 4 to 3%. The fixed mark-up was increased from NOK 22 to 25.

PPRI Pharma Profile 2015
Norway
24
Table 3.3: Norway – Pharmacy mark-up scheme, 2015
Pharmacy purchasing price in € Maximum mark-up in % of pharmacy purchasing price
NOK 0 - 200 / € 0 – 24 7%
From NOK 200 / € 24 3%
Fixed mark-up per package
All POM packages NOK 25 / € 3
Additional for addictive drugs/narcotics NOK 10 / € 1
Source: NoMA
The pharmacy margin for POM that are not included in the stepped price model was in 2008
17%. The same year the average pharmacy margin for all POM was 19%.2
The wholesale mark-up is not regulated.
3.2.5 Taxes
All pharmaceuticals follow the standard value-added tax (VAT) rate in Norway which is 25%.
There is a pharmaceutical tax of 0.55% of the pharmacy purchasing price. It applies to all
medicines, including OTC products, and is paid by the retailers. The amount is not included
in the price build-up. The tax is collected by the wholesalers who in turn pay the tax to the
authorities. Some of the tax is redistributed to the pharmacies as subsidies.
There is also a pharmaceutical tax of 0.6% of the wholesalers purchasing price. The tax is
collected by NoMA from the Market Authorisation Holder.
There is a tax of 1.6% on sales in other retailers than pharmacies, such as grocery stores,
gasoline stations etc, cf. section 2.7.5. The tax is paid by the wholesalers.
3.3 Reimbursement of medicines
This chapter describes the scope of the reimbursement system, the regulatory framework
and the main authorities in the out-patient sector.
2 Average pharmacy margin for all POM calculated by using data from diagram 3 and 4 in report “Evaluering av
apotekavansen 29. juni 2010. : NoMA

PPRI Pharma Profile 2015
Norway
25
3.3.1 Reimbursement policies
The pricing and reimbursement process is regulated in detail in Regulation No. 1839 of
18 December 2009 relating to pharmaceutical products (the Pharmaceutical Products Regu-
lations), Sections 12 and 14.
The reimbursement schemes are important tools for the Norwegian health authorities to
achieve goals in societal health and welfare policies. Central political principles provide the
rationale behind the criteria which serve as a framework for the reimbursement systems in
Norway.
These main principles are:
1. Principles concerning medical needs and solidarity in the population:
Everyone should have the same access to necessary medicines regardless of their
ability to pay.
2. Principles concerning rationality:
The reimbursement system should encourage clinically rational and cost-effective use
of medicines as a tool to ensure investment in health care services.
Reimbursement is provided only for "long-term" medication for chronic diseases, defined as
more than three months' of medication per year. In general the reimbursement programme
does not cover short-term therapy (e.g. antibiotics for pneumonia). Over-the-counter (OTC)
products are in general exempt from reimbursement.
The main system is general reimbursement on the basis of positive lists. There is also a
system for individual application.

PPRI Pharma Profile 2015
Norway
26
3.3.2 Reimbursement procedure

PPRI Pharma Profile 2015
Norway
27
Decision making process
Figure 3.1: Norway - The decision-making process for reimbursement
NoMA = Norwegian Medicines Agency
1a = approve, 1b = reject, 2 = pass to the Ministry of Health and Care Services (HOD), 3 = bring the case before Parliament in the form a Budget Bill,
Source: NoMA
Figure 3.1 displays the decision-making process for reimbursement of medicines. A company
may send a reimbursement application for a prescription medicine to the Norwegian Medi-
cines Agency (NoMA). A price application may be submitted in parallel (a fixed initial maxi-
mum price is a prerequisite for reimbursement). The time allocated to NoMA for dealing with
both pricing and reimbursement is 180 days. If the NoMA has questions about the applica-
tion, the company has a maximum of three months to answer. Cf. section 2.2 for information
on processing time.
If the reimbursement application involves a generic product, a new strength, formulation or
package size (line extension) which is no more costly than the relevant reimbursed product,
the procedure is usually swift and the NoMA will approve the application (cf. 1a in figure 3.1).
Reimbursement is then granted in the National Insurance Scheme. If the application con-
cerns a new chemical entity, a new combination, a new indication or an extension of indica-
tion which will have an annual incremental fiscal impact above NOK 25 Mio. / € 3.2 Mio. by
the fifth year after approval, the NoMA is not authorized to grant reimbursement. In this case,
provided that the application fullfills the other conditions, the NoMA will pass its appraisal on
to the Ministry of Health and Care Services (HOD) who will assess the matter further (cf. 2 in
figure 3.1). In this process, the NoMA may be advised by an external reimbursement commit-
tee (= National Advisory Committee for Drug Reimbursement) on issues pertaining to the
application (i.e. verification of documentation, severity of disease, clinical criteria). Should the

PPRI Pharma Profile 2015
Norway
28
Ministry favour the approval, it will have to bring the case before Parliament in the form of a
Budget Bill (c.f. 3 in figure 3.1). The Budget Bill is voted on in the Parliament, and so far the
Parliament has voted in favour of reimbursement in every case.
In 2014 the NoMA approved on 102 applications for reimbursement. In addition 5 cases
exceeded the limit of NOK 5 Mio. / € 0.6 Mio. and were submitted to the HOD. The limit was
however raised to NOK 25 Mio. / € 3 Mio. in 2015 and the 5 cases that had been submitted
to the HOD were granted reimbursement. 1 application was rejected.
With a complete market authorisation for its product the marketing authorisation holder
(MAH) can either send an application for maximum price and an application for reimburse-
ment simultaneously or apply for maximum price first. In general the maximum price is set
according to the general rule, cf. section 3.1.2.1. Nevertheless the price is a decisive factor in
cost-effectiveness for any product and therefore also the reimbursement process. Some-
times the MAH will therefore agree to put a lower price on the product in order to make the
medicine cost-effective.
Pharmaco-economic evaluation
A pharmaco-economic evaluation in connection with applications to join the reimbursement
scheme has been compulsory since 1 January 2002. A company needs to follow the Norwe-
gian guidelines3 for pharmaco-economic evaluation.
The guidelines require an explanation of the choice of comparison, the time frame for the
analysis, data collection methods, analysis methods and costs. Pharmaco-economic evalua-
tion is carried out for all medicines for which an application for reimbursement is submitted,
with the exception of the following cases.
Pharmaceuticals with the same active ingredient as medicines for which reimburse-
ment has already been granted, i.e.: generic pharmaceuticals, parallel imported
preparations and preparations in new packaging. This holds under the condition that
the medicine for which the application is being made has the same approved indica-
tion as the reimbursement-approved medicine and that the costs are not higher or the
health outcomes different than that of a medicine with which comparison is natural.
Pharmaceuticals where a new formulation clearly does not change the costs and
health outcomes of treatment.
Over-the-counter (OTC) medicines are in general not reimbursed and therefore no phar-
maco-economic evaluation is necessary.
There are few absolute economic criteria for an application as long as a pharmaco-economic
evaluation is performed. However, the evaluation should show and explain why the medicine
should be reimbursed. Normally, this is carried out using the cost-effectiveness ratio. There
3 www.noma.no

PPRI Pharma Profile 2015
Norway
29
is no cut-off ratio determined in Norway. Pharmaco-economic analyses performed in the
given context are to be evaluated on behalf of the society and should therefore be carried out
both from a societal perspective (or where relevant, a health service perspective), and the
perspective of the payer, i.e. the National Insurance Scheme (NIS). This therefore means
that the economic consequences the illness and any interventions will have, for society as a
whole and the NIS, should be clearly explained throughout the process.
The applicant may appeal against decisions made by the NoMA within three weeks of the
date of the decision. If the NoMA decides not to consent to the appeal, the NoMA must
submit the appeal to the Ministry, according to the Public Administration Act.
Reimbursement schemes
The legal framework for the reimbursement scheme is the Social Services Act and Regula-
tion on Medicinal Products.
There are four main ways in which medicines can be covered (Table 3.4). Schedule 2 re-
quires that the medicine has been approved for reimbursement. Pharmaceuticals in these
schedules will, when initially approved by the authorities, be reimbursed automatically, while
medicines in Schedules 3a and 3b require a formal application for each patient. The purpose
of schedule 4 is to eliminate severe communicable diseases.
Approximately 73% of the total reimbursement expenditure of NOK 9.7 billion / €? arose from
Schedule 2 in 2014. Schedule 3a and 3b accounted for respectively 14 and 6% of total
reimbursement. Reimbursement by schedule 4 was 7% of total reimbursement. (Directorate
of health)
Eligibility schemes
All members of the National Insurance Scheme are eligible for reimbursement, cf. section
1.4.
Reimbursement lists
Norway has a reimbursement list (positive list) regarding general reimbursement (schedule
2), which is updated by the Norwegian Medicines Agency (NoMA) once a month. The list of
reimbursable medicines and associated criteria is published on the NoMA website4 as a
searchable database on the web. The list is organized at the drug substance level and gives
the subscriber precise information on the part of a drugs indication approved for reimburse-
ment. The reimbursement indication is described both in text and according to two different
diagnostic codes (ICD-10 and ICPC-2).
4
www.noma.no

PPRI Pharma Profile 2015
Norway
30
In the database, the search criteria can be the pharmaceutical’s product name, the generic
name, the ATC-code, the diagnostic code or the name of the disease it has been granted
reimbursement for.
The reimbursement status of a medicine does not change automatically as a result of new
evidence, price changes, etc. However, this is an ongoing process that depends on the
specific pharmaceutical’s cost-effectiveness. If a more cost-effective competitor is entering
the market, the well-established medicine may become the second-line treatment. This will
only take place after the company with the well-established medicine has had the opportunity
to prove otherwise. A similar situation occurs in the case of new evidence.
Reimbursement categories and reimbursement rates
Table 3.4: Norway – Reimbursement categories of medicines, 2015
Reimbursement category
Reimbursement rate (%)
Description
Schedule 2 62 / 1001
For medicines on the reimbursement list, which are reimbursed in case of specified diagnoses in the list and only for long-term (> 3 months) treatment.
Schedule 3a 62 / 1001 For medicines other than those under Schedules 2, 4 and 3b. In
this case reimbursement can be granted upon submission of an individual application and only for long-term (> 3 months) treatment.
Schedule 3b 62 / 1001 For medicines used to treat rare diseases, which are reim-
bursed upon submission of an individual application and only for long-term (>3 months) treatment.
Schedule 4 100 For medicines used to treat serious contagious diseases such as tuberculosis, hepatitis C or HIV/AIDS.
1 Cf. section 3.3.3
Source: NoMA
Copayments are included in the cost-ceiling scheme that was introduced in the early 1980s.
All copayments for consultations with specialists and general practitioners, for ambulatory
care, X-rays, laboratory tests and medicines go under the ceiling. In 2015 the ceiling is NOK
2,185 / € 2605. When the cost ceiling has been reached in any calendar year, most of addi-
tional out-of-pocket expenses are reimbursed by the NIS, and any remaining treatment in
that calendar year is therefore free of charge. In 2012 approximately 29% of the population
(age over 16) reached this ceiling (www.helfo.no).
General reimbursement – Schedule 2
Schedule 2 is basically a “positive list” system, based on a list with medicines that can be
reimbursed for specified diagnoses, provided other given criteria are fulfilled. The Norwegian
Medicines Agency (NoMA) handles the reimbursement list of product brand names that has
5 Exchange rate as of 5
th of August 2014: 8,39 NOK per Euro
PPRI Pharma Profile 2015
Norway
31
been accepted for reimbursement for the defined diagnoses. Reimbursement is granted only
under the condition that the patient has a serious and chronic disease, for which “long-term”
medication (more than three months per year) is necessary. Furthermore, the medicines in
question must have market authorisation and therefore need to have satisfactory documenta-
tion of clinical effect and safety. General reimbursement is granted only for treatment of
disease states or conditions that are covered by the product’s medical indication. NOK 9.0
billion / €? were reimbursed on schedule 2 in 2014, for 2.3 million individual persons.
Individual reimbursement – Schedule 3a and 3b
Under certain conditions reimbursement is granted on the basis of individual patient applica-
tions for products not included in the list for general reimbursement. If a patient suffers from a
serious disease or condition which requires long-term treatment, and the accepted products
available for general reimbursement do not provide sufficient effect or cause unacceptable
adverse reactions, reimbursement for an alternative product can be applied for, on an indi-
vidual basis. This refers to Schedule 3a in Table 3.4.
Reimbursement may also be granted on an individual basis for medicines used in the long-
term treatment of conditions which are considered to be serious and rare, but for which no
medicines are included in the list for general reimbursement. This refers to Schedule 3b in
Table 3.4.
In contrast to the preapproved medicines available for general reimbursement, it is not a
prerequisite that the product has obtained a market authorisation to be individually reim-
bursed. This implies that several medicines will achieve significant reimbursed sales before
market authorisation in Norway, with no statutory maximum pharmacy purchasing price.
In 2014 NOK 1.3 and 0.6 billion / € 15.5 and 72 Mio. were reimbursed on schedule 3a and 3b
respectively. 101,000 individuals received medicines reimbursed on schedule 3a. The corre-
sponding figure for 3b was 16,000.
Pharmaceuticals for dangerous contagious illnesses – Schedule 4
A reimbursement system has also been established to ensure that all patients with serious
communicable diseases are given adequate treatment without cost to the patient. There is no
patient co-payment for these medicines and the patient does not have to be a member of the
National Insurance Scheme. Medicines used to treat, e.g. HIV/AIDS, Hepatitis C or tubercu-
losis are reimbursed in this category. Also, vaccines against communicable diseases are
reimbursed. All medicines with ATC-code L03A (immunostimulants) and most medicines
within ATC-code J (i.e. antiinfectives for systemic use) are automatically included in this
schedule. No further application is necessary to obtain 100% reimbursement. Long-term
treatment is not a prerequisite for Schedule 4.
Reimbursement of some new and expensive medicines against Hepatitis C was restricted as
of November 2014. The patient must be a member of the National Insurance Scheme. The
medicines must be prescribed by a specialist or a hospital department, and are only reim-

PPRI Pharma Profile 2015
Norway
32
bursed on the basis of individual application. Criteria regarding severity, benefit and cost
effectiveness were also introduced. Ribavirin and peginterferon are however still preap-
proved for reimbursement under schedule 4, also for non-members.
In 2014 NOK 0.7 billion / € 83 Mio. were reimbursed on schedule 4, regarding 35,000 indi-
vidual persons.
Contribution system
Some prescription medicines are not ordinarily reimbursed by any of the above-mentioned
systems. However, a contribution system has been established to ensure that all patients
have access to necessary medical treatment. The contribution system is valid for prescription
only medicines. If a ceiling of NOK 1,732 / € 206 is reached, a patient can claim reimburse-
ment for 90% of all further expenses. The system requires initial out-of-pocket payment
(OPP). Receipts from the pharmacy serve to document the claim. In 2014 71 Mio. / € 8.5
Mio. were reimbursed by the contribution system (Directorate of Health).
There is no need to document the severity or duration of the disease, nor is it necessary to
document effect or cost-effectiveness of the products used. There is a negative list attached
to this system, and medicines on this negative list are not reimbursed. Generally, expenses
for medicines used to treat erectile dysfunction, smoking cessation, hair-loss and addictive
medicines are not reimbursed by this system.
For contraceptives for women of age 16-20 the contribution system covers a cost of NOK
108 / € 13 per three months. Infertility treatment is also subsidised as the NIS covers costs
that supersede NOK 15,887 / € 1,900.
Reference price system
In Norway external price reference pricing is used for setting of maximum pricing. There is
also reference pricing of medicines on generic substitution (the stepped price system). Cf.
section 3.2.1. There is no therapeutic reference price system in place.
3.3.3 Private pharmaceutical expenses
In 2013 29% of the total pharmaceutical costs are covered directly by the patients. This
number is derived from non-reimbursed prescription-only medicines (12%), OTC medicines
(11 %) and patient co-payment of reimbursable medicines (6%). Cf. diagram in section 2.9.

PPRI Pharma Profile 2015
Norway
33
Table 3.5: Norway – Out-of-pocket payments for medicines, 2015
Out-of-pocket payments Amount Vulnerable groups
Fixed co-payments n.a. -
Percentage payments 38%, max. NOK 520 / € 62 per prescrip-tion
Low-income pensioners and children under 16 are exempt
Deductibles NOK 2,185 /€ 260 -
Reference price system Price difference between stepped price and maximum price when patient refuses generic substitution.
-
Source: www.helfo.no
3.4 Volume control
The reimbursement system regulates prescription practices to a certain degree since the
prescribing party in general will prescribe a reimbursed pharmaceutical instead of a non-
reimbursed therapeutically equivalent pharmaceutical. In addition a substantial amount of the
reimbursement decisions made by the Norwegian Medicines Agency are based on conditi-
ons that have to be fulfilled for the pharmaceutical to be reimbursed. Examples of such
conditions can be that the patient has to be in a severe stage of the disease, that reimbur-
sement is only granted to patients within a certain age-segment, or that another named
pharmaceutical must be tried first.
In general doctors are obliged to prescribe the cheapest equivalent product unless there are
serious medical reasons for prescribing a more expensive alternative.
Pharmaceutical budgets are not implemented in the out-patient sector.
3.4.1 Generic substitution
Generic substitution has been allowed in Norway since 2001. According to The Norwegian
Pharmacy Association’s survey “Apotekbarometeret” 72% of the consumers experienced a
suggestion to generic substitution from a pharmacist in 2013. 8 out of 10 were positive or
indifferent to this experience, whereas 2 out of 10 had a negative experience.
Pharmacies are obliged to inform patients if there is a cheaper generic alternative available.
If the patient does not want to switch to the cheaper alternative s/he will have to pay out-of-
pocket the price difference between the two alternatives if the product is reimbursed. The
doctor may put a reservation on the prescription when substitution should be avoided for
medical reasons. Doctors reserve against substitution for 7 – 8 % of the prescribed medi-
cines (Hdir). In such cases the National Insurance Scheme will reimburse the cost with no
extra payment for the patient.
Pharmacies have financial incentives for generic substitution. In Norway there is vertical
integration between wholesalers and pharmacies. Generic competition increases the whole-

PPRI Pharma Profile 2015
Norway
34
salers’ margins dramatically and this leads to an incentive for generic substitution. Pharma-
cies are not allowed to substitute therapeutically (i.e. dispense a medicine with equal thera-
peutic benefits).
The NoMA evaluates new pharmaceuticals on the norwegian market regarding their substi-
tutability. If the pharmaceutical is regarded as substitutable with an existing product, the
substitutable packages are put on a list. The updated “substitution-list” is published monthly
and is distributed to all pharmacies and doctors.6
3.4.2 INN prescribing
Doctors are allowed, but not obliged, to prescribe by INN. The system for electronic prescrib-
ing, which was implemented in 2011, facilitates INN prescription.
There is no system for systematic evaluation of the doctor’s prescribing habits in Norway.
3.4.3 Other generic promotion
Pharmacies promote generic substitution for economic reasons. They do so by offering the
generic at a lower price than the original product. The use of generic medicines is promoted
by the authorities for cost-containment reasons. The NoMA informs about generic substituti-
on in various ways to make prescribers and patients better understand the purpose of gene-
ric substitution. Information is distributed by NoMAs website, brochures to pharmacies,
presentations in seminars/conferences and by interviews and articles in the media.
Due to generic substitution and the stepped price model NoMA assumes that the NIS and
the patients save in all approximately NOK 2 billion / €? 238 mio. every year. These savings
are substantial in view of the fact that the NIS reimbursed medicines for NOK 9.0 billion /€
1,100 Mio. in 2013 (Directorate of Health).
Generics are permitted to have the same maximum prices as the original product. This
makes the processing of the price application rather simple. Regarding reimbursement, if the
generic has the same indications as the original and the MA-holder also applies for reim-
bursement for the same indications, the processing of the application will also be simple and
swift.
There is no minimum ratio (percentage) of generic prescription that doctors would have to
fulfil.
6 www.noma.no

PPRI Pharma Profile 2015
Norway
35
3.4.4 Claw-backs
Claw-backs are not used in Norway.
3.4.5 Managed-entry agreements
Managed-entry agreements are currently not used on the out-patient sector in Norway.
3.5 Evaluation
As stated in section 3.3.2, a pharmaco-economic evaluation has to be performed for all
medicines for which an application for reimbursement is submitted, with a few exceptions.
When a pharmaco-economic evaluation has to be performed, the Market Authorisation
Holder (MAH) should follow the Norwegian guidelines for pharmaco-economic evaluation in
connection with applications for reimbursement.
The guidelines ask for an explanation of the choice of comparison, the time frame of the
analysis, data collection methods, analysis methods and costs.
The Norwegian Knowledge Centre for the Health Services performs health technology
assessments. When relevant, they are considered for reimbursement decisions. The Centre
publishes all HTAs on the website: http://www.kunnskapssenteret.no.
3.5.1 Prescription monitoring
The HELFO performs random checks to see if the doctors prescribe according to the criteria.
Prescriptions are selected for control, and the prescribing doctors are asked to provide
relevant information from the patient’s journal.
The frequency and scope of NoMA’s monitoring of prescribing may vary, depending on the
importance of the measure and the expected value of new information. The preferred prod-
uct-scheme for tiazides and statins were evaluated by external parties.7
Refer also to section 3.5.2 as the monitoring of prescriptions and consumption often over-
laps.
7 Sakshaug S, Furu K, Karlstad Ø, Rønning, M, Skurtveit, S. Switching statins in Norway after new reimburse-
ment policy—a nationwide prescription study. Br J Clin Pharmacol 2007, doi:10.1111/j.1365-2125.2007.02907.x
http://www3.interscience.wiley.com/journal/117977741/abstract?CRETRY=1&SRETRY=0
Tiazides: Evaluering av nytt refusjonsvilkår for blodtrykksbehandling (tiazidregelen) Fretheim A, Håvelsrud K,
MacLennan G, Kristoffersen DT, Oxman A. Notat 2006. ISBN 82-8121-079-6 www.kunnskapssenteret.no

PPRI Pharma Profile 2015
Norway
36
3.5.2 Pharmaceutical consumption monitoring
The pharmaceutical consumption is monitored by the Norwegian Institute of Public Health
Institute on a yearly basis, cf. to the report “Drug consumption in Norway”8. NIPH also pro-
duces an annual report based on the Norwegian Prescription Database9.
The NoMA monitors consumption as an input to reimbursement decisions.
Research institutions and universities also monitor consumption when it is relevant to their
research field/assignments.
Consumption is also monitored by private parties:
LMI’s “Facts and figures”10
Norwegian Association of Pharmacies’ “Facts and figures”11
3.5.3 Decision making tools
As stated in section 3.3.2 a pharmaco-economic evaluation in connection with applications
for the reimbursement scheme has been mandatory since 1 January 2002. The applicant is
obliged to perform pharmaco-economic analyses. The NoMA assesses the quality of the
analysis as part of the processing of the application and sometimes performs such analysis
as part of the processing. The NoMA has published guidelines for pharmaco-economic
evaluations since 2002, latest revision in 2012.12
A medicine can obtain market authorisation and a maximum price without a pharmaco-
economic evaluation. But a pharmaco-economic evaluation has to be performed for all
medicines for which an application for reimbursement is submitted, with the exception of
some instances.
Cost-effectiveness analysis is well established in Norway and the use of quality-adjusted life
years (QALYs) as an effect parameter is increasing. Norway has not defined a maximum
willingness to pay per quality-adjusted life year (QALY). The Directorate of Health has pub-
lished guidelines for assessment of societal effects in the health sector.13
8http://www.fhi.no/eway/default.aspx?pid=240&trg=Content_6899&Main_6664=6898:0:25,7586:1:0:0:::0:0&Conte
nt_6899=6689:112847::1:6891:2:::0:0 9 http://www.norpd.no/BadUrlError.aspx
10 http://www.lmi.no/tall-og-fakta
11 http://www.apotek.no/Files/Filer_2014/B%c3%b8ker%20og%20brosjyrer/key%20figures%202015.pdf
12 www.noma.no
13 https://helsedirektoratet.no/statistikk-og-analyse/samfunnsokonomiske-analyser/veiledere-helseeffekter-i-
samfunnsokonomiske-analyser

PPRI Pharma Profile 2015
Norway
37
4 Pricing, reimbursement and volume control in the in-
patient sector
This section describes the organisation of the pricing system and policies in the hospital
sector. It covers the reimbursement and the volume control and the reimbursement related
cost-containing measures in the in-patient sector.
4.1 Organisation of the in-patient sector
Refer to chapter 1.2 for information about the organization of the in-patient sector. Refer also
to figure 2.3 and table 2.1 for an overview of actors and legal basis for pricing and reimbur-
sement.
Regarding organization of pricing and reimbursement in the specialized health care system,
there are some features that differ from the general rule because the hospitals reimburse
some medicines for treatment outside of the hospital. This concerns medicines prescribed on
“H-prescriptions” and medicines for rehabilitation of drug-abusers.
Since 2006 doctors in specialized care have issued “H-prescriptions”.14 “H” stands for health
enterprise. The medicine will be reimbursed by the health enterprise. The patient will collect
the pharmaceutical in a community or hospital pharmacy. Until 2013 “H-prescriptions” have
been used for TNF-inhibitors and MS-medicines and for about NOK 1.5 billion / € 180 mio.
were reimbursed per year. From 2014 they are also in use for some cancer medicines. Cf.
section 5.1 for more information.
In 2004 the main responsibility for treatment of substance abusers was transferred from the
municipalities to the health enterprises. The abusers are however partly treated by general
practitioners and partly by the health enterprises. The general practitioners may prescribe
methadone and buprenorphine (incl. combinations) to users that have enlisted in a program
for rehabilitation. In these cases the user may collect the medicine in any pharmacy, but the
expenditure is reimbursed by the health enterprise. In 2013 medicines for NOK 208 Mio. /€
25 Mio. were handed out to users by the pharmacies (www.reseptregisteret.no).
4.2 Pricing and purchasing policies
The main pricing policy in Norwegian hospitals is tendering.
The Norwegian Drug Procurement Cooperation (LIS) negotiates the pharmacy purchasing
price on behalf of the hospitals. The Regional Health Authorities (RHAs) or sometimes
14
Doctors in specialized care are either employed by the hospital or private specialists contracted by the health
enterprises.

PPRI Pharma Profile 2015
Norway
38
hospitals decide on or negotiate the pharmacy mark-up. Other discounts than the ones given
in the tendering process are not common. As of June 2015 LIS has been merged with HINAS
– a joint Procurement Organization of the RHAs. HINAS has since 2003 been responsible for
procurement for the health enterprises of other goods than pharmaceuticals.
The wholesale services are subject to a separate tender. One wholesaler is selected for
providing distribution services to the hospitals for a period of three years. The tender is
performed by the Hospital Pharmacies Health Enterprise, on behalf of the four RHAs.
The tenders include all publicly funded hospitals, the information on purchasing is therefore
available to these hospitals. The exchange of information is organised by LIS. There is no
legal obligation for hospitals or hospital owners to publish the pharmaceutical prices or to
notify the price to a competent authority.
The tendering may in some cases encourage a lowering of prices for initial treatment in
hospital in order to increase the number of patients in primary care being treated with the
medicine in question.
Hospitals spent NOK 5.4 / € 0.64 billion on medicines in 2014, including 25% value added
tax (Meld. St. 28 (2014-2015).
LIS performs tenders on all pharmaceuticals financed by the hospitals. This is done on a
yearly basis. The only exceptions are solutions and x-ray contrasts where the procurement
process takes place every second year. All suppliers, manufacturers and wholesalers are
addressed and the Public Procurement Law applies. This law is in line with the European
Union procurement law.
This ensures that prices for patent-protected medicines offered by the industry to the hospi-
tals are in general lower than the prices offered by the industry for distribution to the out-
patient sector. This may in some cases encourage a lowering of prices for initial treatment in
hospital in order to increase the number of patients in primary care being treated with the
medicine in question.
LIS tenders gave in 2014 a price reduction of 28% in average for the Norwegian hospitals,
compared to the statutory maximum prices (for information on statutory prices c.f section
3.2). In the out-patient sector the products are usually sold at maximum prices. The coopera-
tion also contributes to more efficient and better use of the medicines in hospitals.
4.3 Procurement
The LIS, hospital pharmacies, hospital pharmacists, hospitals with pharmaceutical and
therapeutic committees (PTC) and hospital departments are involved in the procurement
process for medicines for use in hospitals.

PPRI Pharma Profile 2015
Norway
39
In Norway, almost all publicly funded hospitals are members of LIS. Hospitals purchase
medicines according to public procurement regulations within their budget. The regional
health authorities (RHAs) settle annual framework agreements through LIS and the hospitals’
purchases are then considered to be in accordance with this agreement.
LIS has all prices hospitals pay for medicines. All prices are the same for all hospitals. The
tenders are published in the Doffin15 and TED16 database, due to legal provision.
The process is co-ordinated by LIS.
The assignment criteria are the following:
price,
functional characteristics, such as durability and ability to blend,
packages such as unit-dose,
labelling (readability, strength specification),
generic name (according to European Pharmacopoeia),
package varieties (unity),
product variety such as administration form,
formulation,
strength varieties,
service such as training (product knowledge) and
help with medical enquiries and delivery.
There is no bundling of products in the tendering process.
The hospitals buy the medicines from pharmacies and the selected wholesaler. The largest
quantities of medicines are bought from the hospital pharmacies. There is an agreement or
contract between each hospital pharmacy and the hospital. Some hospital pharmacies serve
more than one hospital. Smaller quantities are also bought by smaller hospitals from com-
munity pharmacies.
Some hospital pharmacies supply the hospitals with single dose units. Other pharmacies
supply the hospitals with a patient labelled dose unit.
15
http://www.doffin.no 16
http://ted.europa.eu

PPRI Pharma Profile 2015
Norway
40
4.4 Reimbursement
Pharmaceutical expenditure in publicly funded hospitals is covered by the hospital budgets.
The patients do not have to pay for the medicines used in their treatment as long as the
treatment takes place in the hospital, i.e. the medicines are purchased and paid by the
hospital. In each of the four RHAs, a hospital medicines committee works out a limited list of
medicines. This limited list of medicines is an advisory list to guide the hospitals’ choice of
medicines. The hospitals’ committees consist of doctors from specialised clinical areas and
hospital pharmacists. For information on the funding of the hospitals, cf. sections 1.2 and 1.4.
A major reason for growth in pharmaceutical expenditure of hospitals the last years is the
transferral of the funding of products from the budget of the National Insurance Scheme
(NIS) to the hospital budgets cf. section 5.1.
The share of private funding in specialized care is low. In 2013 it was 1.7 percent of total
expenditure in specialized care17.
There are no out-of pocket payments (OPP) for in-patient treatment. When patients are
treated in the hospitals out-patient departments however, OPPs are required for consulta-
tions and medicines that are reimbursed by the NIS.
4.4.1 Hospital pharmaceutical formularies
There are no hospital pharmaceutical formularies in Norway.
4.4.2 Pharmaceutical and Therapeutic Committees
In almost every health enterprise there is a pharmaceutical and therapeutic committees
(PTC). The PTCs consist of doctors from specialized clinical areas, hospital pharmacists
and sometimes specialists in procurement. The PTCs work out a list of preferred prod-
ucts/suppliers. The lists usually include the 300 most commonly used substances with
corresponding products/suppliers. The criteria for selecting products/suppliers for the list are
the same as referred in section 4.3. The lists are indicative to the doctor’s choice of products
and the doctor may choose other medicines for treatment for medical reasons. The lists are
updated on a yearly basis. They are available for internal use in the hospital and are not
published externally.
The medicines on the list are covered by the hospital budgets, in the same way as any other
pharmaceutical provided for in-patient care at the hospital.
17
Statistics Norway

PPRI Pharma Profile 2015
Norway
41
4.5 Volume Control in the in-patient sector
4.5.1 Monitoring
This section provides an overview of the programmes and methods used to evaluate the
pharmaceutical policies and system in the in-patient sector, and its impact on health, access
to medicines, and cost-containment. It mainly focuses on monitoring of prices, pharmaceuti-
cal expenditure and consumption.
The pharmacies and wholesaler give statistics on prices, expenditure per article and active
substance. The hospital is the owner of the statistics. A computer system is used by the
pharmacies to track supply to the hospitals. The pharmacy can track the consumption of
medicines for the hospital and each department in the hospital per volume and price at any
time.
The LIS also has the prices the hospitals pay for the medicines. The prices are the same for
all hospitals. Prices of a few medicines on new and expensive cancer-drugs are however
confidential, cf section 5.2.
The total national consumption of medicines in hospitals is provided from the LIS annually by
expenditure per active ingredient and expenditure per package per article. The statistics can
be given by LIS on request.
Refer also to section 3.5.2 for information on other statistics that also cover the in-patient
sector.
4.5.2 Decision-making tools
Refer to chapter 5.2 for information about new system for introduction of new health techno-
logies.
The Norwegian Ministry of Health and Care Services established the Norwegian Council for
Quality Improvement and Priority Setting in Health Care. First and foremost, the Council shall
secure a comprehensive national approach to the work on quality and prioritisation. The
council does not do health technology assessments. Stakeholders can discuss and deal with
key issues associated with quality and prioritisation by their collective participation in the
Council. With the Government’s National Health Plan for Norway as starting point, they will
initiate professional analyses when necessary and assess the various aspects of complex
issues. Assessments of patient benefit, cost-effectiveness and total costs will provide an
important foundation for the Council’s evaluations.
Reports are published and can be downloaded from the website of the Council18.
18
http://www.kvalitetogprioritering.no

PPRI Pharma Profile 2015
Norway
42
4.5.3 Evaluation of measures
Refer to section 5.2.
4.5.4 Reports and results
Refer to section 5.2 for information about new system for introduction of new health techno-
logies. The reports are published at https://nyemetoder.no/metoder.

PPRI Pharma Profile 2015
Norway
43
5 Interface management and developments
This concluding chapter covers information about the interface management and the most
important pharmaceutical developments for the health care system.
5.1 Interface management
Reform for better interaction between primary and secondary healthcare systems
The Government is implementing a reform for better interaction between the primary and
secondary healthcare systems.19 The reform gives incentives to the municipalities to prevent
disease and injury in their population. From 2012 a co-payment from the municipalities is
required for some treatments in specialized healthcare. Municipalities have to pay 20 per
cent of the cost of consultations and treatment at hospitals for all patients resident in their
municipality with somatic diseases/injuries. Municipalities must also pay for patients who
have finished their treatment at hospital and are waiting to be moved to their municipality.
The municipality pays NOK 4000 / € 480 per extra day the patient stays in the hospital after
treatment there is finished. NOK 5,000 Mio. / € 4 Mio. has been transferred from the hospi-
tals budgets to the municipalities in order to fund their co-payment. The age of the population
decides how the amount is distributed between the municipalities.
The municipalities will be obliged to provide acute help and 24 hours-services for patients in
need of treatment or observation. This will be implemented within 2015.
The Government also aims at a gradual implementation of economic incentives for treatment
of substance abuse and mental health care.
“H-prescriptions”
Interface management between the in-patient and out-patient sector in Norway exists with
regard to specific medicines as hospitals pay for medicines that patients need after discharge
of the hospital. These medicines include tumor necrosis factor (TNF) medicines and medi-
cines for the treatment of Multiple Sclerosis (MS). The funding of these products was trans-
ferred from the budget of the National Insurance Scheme (NIS) to hospital budgets in 2006
and 2008 respectively. This was mainly due to the fact that some products in this field were
funded by the NIS and some products were funded by the hospital. This created the econom-
ic incentive for hospitals to prescribe products funded by NIS. Also it was an aim to achieve
more competition and lower prices.
19
https://www.regjeringen.no/nb/tema/helse-og-omsorg/helse--og-omsorgstjenester-i-
kommunene/samhandlingsreformen/status-samhandling/id708254/

PPRI Pharma Profile 2015
Norway
44
In 2014 further medicines have been transferred from the NIS to the hospitals:
Vemurafenib (Zelboraf), dabrafenib (Tafinlar) and trametinib (Mekinist) for treatment
of malign melanom
Abirateronacetat (Zytiga) (prostatakreft) and enzalutamide (Xtandi) for treatment of
prostate cancer
Rituksimab (MabThera) for treatment of Non-Hodgkins lymphome, trastuzumab (Her-
ceptin) for metastatic breast cancer, tocilizumab (RoActemra) for rheumatoid arthritis
and denosumab (Xgeva) for bone metastases.
The Government has also delegated to the Directorate of Health to decide on further trans-
fers.
The aforementioned medicines are prescribed on “H-prescription”, cf. sections 2.2 and 4.1.
5.2 Developments
National system for introduction of new health technologies
A national system for the introduction of new health technologies within the specialist health
service has been implemented in 2013-2014.20 The purpose of this system is to promote
better and safer patient care. This will be made possible through the systematic assessment
of new health technologies with regard to effect, safety and consequences for patients, the
health service and society in general.
The key elements of the new system are:
Horizon scanning
Health technology assessment
Prioritisation and decision making
Implementation
The systematic introduction of new pharmaceuticals within the specialist health service will
be carried out as health technology assessments (HTAs) or single technology assessments
(STA). The HTAs will be conducted by the Norwegian Knowledge Centre for Health Services.
An STA is an appraisal of a single pharmaceutical in relation to a particular area of
use/indication, at an early stage. The NoMA will conduct the STAs on a national level.
The Regional Health Authorities (RHA) commissions the STAs from NoMA. The RHAs have
established a Forum for the commissioning. Stakeholders will be encouraged to submit
proposals on potential topics for consideration. The RHA Forum will then prioritise and
decide which assessments should be carried out. Since the start in 2013 the NoMA has
20
https://nyemetoder.no/english
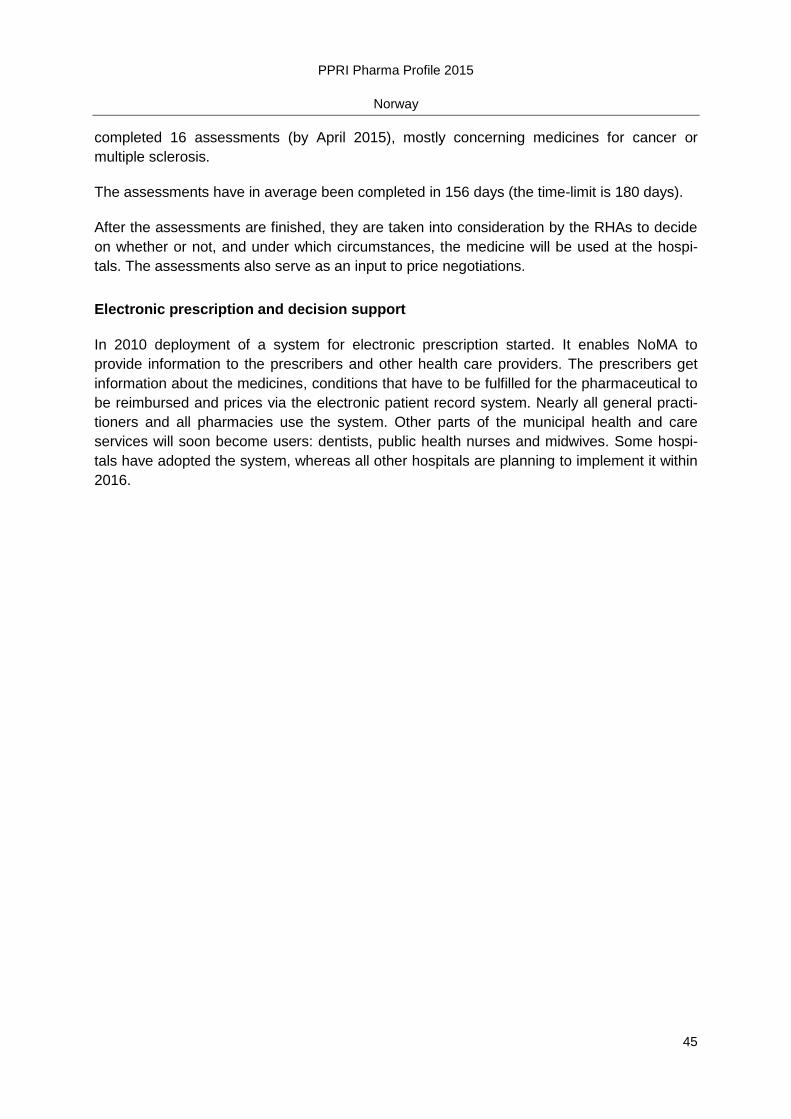
PPRI Pharma Profile 2015
Norway
45
completed 16 assessments (by April 2015), mostly concerning medicines for cancer or
multiple sclerosis.
The assessments have in average been completed in 156 days (the time-limit is 180 days).
After the assessments are finished, they are taken into consideration by the RHAs to decide
on whether or not, and under which circumstances, the medicine will be used at the hospi-
tals. The assessments also serve as an input to price negotiations.
Electronic prescription and decision support
In 2010 deployment of a system for electronic prescription started. It enables NoMA to
provide information to the prescribers and other health care providers. The prescribers get
information about the medicines, conditions that have to be fulfilled for the pharmaceutical to
be reimbursed and prices via the electronic patient record system. Nearly all general practi-
tioners and all pharmacies use the system. Other parts of the municipal health and care
services will soon become users: dentists, public health nurses and midwives. Some hospi-
tals have adopted the system, whereas all other hospitals are planning to implement it within
2016.

PPRI Pharma Profile 2015
Norway
46
6 Bibliography
6.1 Literature
All references to articles, publications e.g. are included in the text in chapter 1 - 5.
6.2 Legislation
Refer to section 1.2.
6.3 Web links
Relevant web links are included in the text in chapter 1 – 5.