Embed Size (px)
Citation preview
Trust in water 1
PR19 IAP cost assessment webinar
7 February 2019

Trust in water 2
Agenda
Introduction 1200 to 1210 Alison, Ynon
Base econometric models 1210 to 1225 Milton
Unmodelled costs 1225 to 1230 Paul
Enhancement costs 1230 to 1300 Alison, Sonia, Paul, Simon
Cost adjustment claims 1300 to 1305 Alison
Actions for companies 1305 to 1310 Alison
Q&A 1310 to 1330 All
Trust in water 3
Introduction

Trust in water 4
Building blocks of our totex assessments
Building block Costs included Assessment approach Efficiency challenge
Modelled base costs Opex (excluding costs
included in unmodelled base
costs)
Capital maintenance
Econometric models using
historical data and our own
forecast of cost drivers for
2020-25
Wholesale: upper quartile
plus 1.5% annual frontier
shift
Retail: forward looking upper
quartile
Un-modelled base costs
(wholesale services only)
•Business rates
•Abstraction charges
•Traffic Management Act
costs
•Wastewater Industrial
Emissions Directive costs;
•Etc.
Various methods as
appropriate
Bespoke through
assessment of specific cost
Enhancement
expenditure (wholesale
services only)
Enhancement capex (and
some opex)
Various methods as
appropriate:
•Benchmarking of historical
data
•Benchmarking of business
plan data
•Deep dive
•Shallow dive
Bespoke challenge
depending on model quality
or company efficiency
in wider plan.
Adjustments Cost adjustment claims
submitted by companies
Gates approach (deep dive
assessment of evidence
provided in plans)
As appropriate
Efficient modelled
base costs
Efficient unmodelledbase costs
Efficient enhancement
costs
Efficient Adjustments
Efficient total cost
allowance

Trust in water 5
These building blocks come together to determine our view of efficient costs
Base Costs
Unmodelled
Costs
Enhancements
Cost
Adjustment
claims
Efficient modelled
base costs
Efficient unmodelledbase costs
Efficient enhancement
costs
Efficient Adjustments
Efficient total cost
allowance
https://www.ofwat.gov.uk/wp-
content/uploads/2019/01/Dataflow-of-
models-PR19-IAP-flowchart.pdf

Trust in water 6
We have published our IAP models

Trust in water 7
We have published our IAP cost models (2)

Trust in water 8
Base econometric models

Trust in water 9
High level summary of approach
• We use econometric models to produce parameters
• We use a panel data structure
• For wholesale we use seven years of historical data (2011-12 to 2017-18)
• For retail we use five years of historical data (2013-14 to 2017-18)
• In wholesale, we use Feeder model 1 which contains cost and driver data from companies’ tables and
external sources.
• Companies can replicate those using our published Stata “ do” files.
• In wholesale, we include our catch-up efficiency challenge (see feeder model 2)
• The following elements are used to determine our view of efficient modelled base costs (feeder model 4):
• The parameters and catch up produced in feeder model 2;
• Forecasts of costs drivers (produced in feeder model 3); and
• frontier shift
• In retail we use forward looking efficiency challenge, as opposed to catch up efficiency challenge and frontier
shift. Forward looking efficiency challenge is BP costs divided by our modelled costs.
• We apply an upper quartile efficiency challenge to adjust our econometric results from average to efficient. This
means that we set the efficiency bar at the level that 25% of the companies have achieved (wholesale) or are
forecasting to achieve (retail).
• Since we have more than one model in several business areas we triangulate the results to estimate our base
costs allowance.
• In wholesale, our models don’t align with price control levels. Hence, our allowance is apportioned into the
different price controls. To determine control level cost allowances we apply the proportions of business plan base
costs to our efficient wholesale modelled base costs
Modelled base costs
Efficient modelled
base costs
Efficient unmodelledbase costs
Efficient enhancement
costs
Efficient Adjustments
Efficient total cost
allowance
Trust in water 10
Unmodelled costs

Trust in water 11
High level summary of approach
• Abstraction charges – we undertook a qualitative approach based on each
company’s circumstances
• Business rates – we performed our own calculations based on the 2017
revaluation and compared to company actual 2017-18 data. We made
adjustments for companies that have not fully transitioned to the 2017 level yet
and instead compared to the 2020-21 forecast data. We did not make
adjustments for companies’ forecast changes due to revaluation or changes in
asset stock.
• Traffic Management Act costs – we applied company specific efficiency from
econometric models
• Wastewater industrial emissions directive costs – only applies to 3 companies
• Third party/other costs have allowed these and will reconcile to revenue for
these costs
• Pension deficit recovery costs – we followed the PR09 and PR14 approach as
set out in 2013 in an information notice: IN13/17
Un-modelled base costs
Efficient modelled
base costs
Efficient unmodelledbase costs
Efficient enhancement
costs
Efficient Adjustments
Efficient total cost
allowance

Trust in water 12
Enhancement costs

Trust in water 13
Wholesale enhancement expenditure
Efficient modelled
base costs
Efficient unmodelledbase costs
Efficient enhancement
costs
Efficient Adjustments
Efficient total cost
allowance
Reallocation
• We reallocate costs between company defined and standard categories, and between different
standard categories to ensure we are assessing similar programmes across the industry.
We evaluate each category following four approaches
• Models
• Deep dive
• Shallow dive
• Very low materiality items
• Models
• Typically one or two variable regression models and mostly of business plan forecast data
• Covering single or multiple enhancement categories as given in business plan tables WS2 and
WWS2
• Deep Dive
• Bespoke challenge where data allows
• Option selection challenge ~ 20% where we find little evidence of appropriate optioneering
• Cost efficiency challenge ~ company specific assessment

Trust in water 14
Water enhancement assessment
Water enhancement – Ofwat view of capex (after reallocation) £4.5bn allowed of
£6.8bn (34% efficiency challenge)
Figure: Ofwat view of requested enhancement capex – by enhancement category line
Examples shown in pack
Trust in water 15
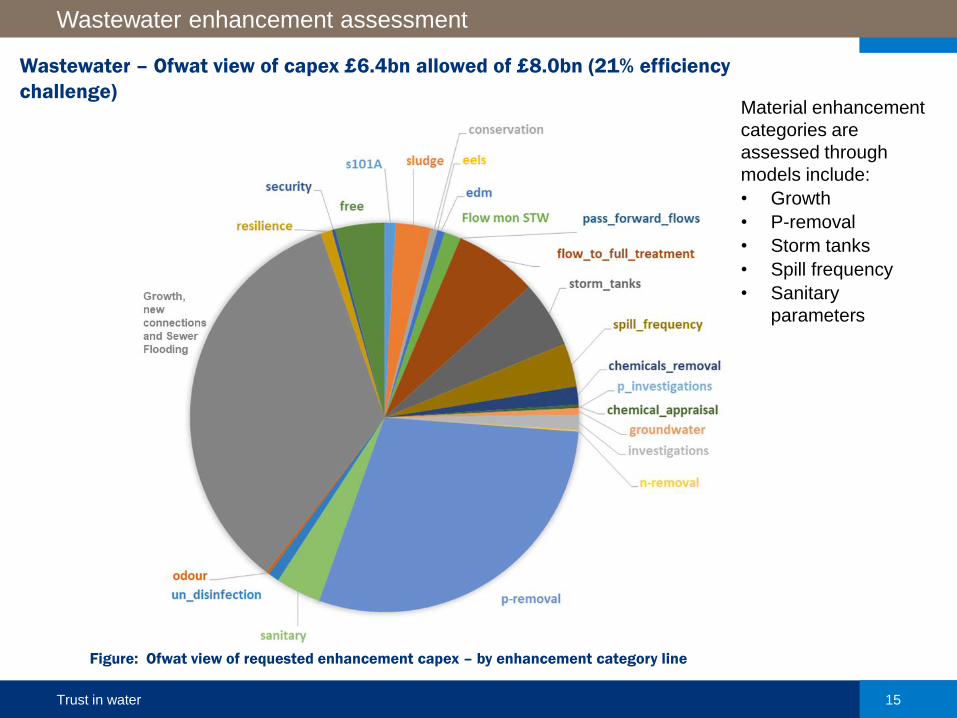
Wastewater enhancement assessment
Wastewater – Ofwat view of capex £6.4bn allowed of £8.0bn (21% efficiency
challenge)Material enhancement
categories are
assessed through
models include:
• Growth
• P-removal
• Storm tanks
• Spill frequency
• Sanitary
parameters
Figure: Ofwat view of requested enhancement capex – by enhancement category line

Trust in water 16
An example of modelled approach to enhancement: Lead standards
Cover sheet
https://www.ofwat.gov.uk/wp-content/uploads/2019/01/FM_E_WW_lead-
standards_IAP.xlsx
Meeting lead standards enhancement feeder model
Objective
To assess enhancement capex expenditure submitted by companies in their PR19 business plan submissions for
meeting lead standards.
Approach
We assess the lead reduction costs using a panel data model where the cost drivers are the number of existing
lead communication pipes and the number of lead communication pipes replaced for water quality. We triangulate
our cost allowance across two models, one using historical data for the period 2011-12 to 2017-18 and other
using forecast data for the period of 2020-21 to 2024-25. Both models are in levels and use smoothed data over a
3-year period. Where companies’ forecasts are below our allowance, we allow the company’s forecast. For
companies whose submissions suggest unique and material costs not captured by our model, we carry out a
deep dive using the information provided within the companies’ submission.

Trust in water 17
An example of deep dive approach to enhancement: drinking water protected areas
Cover sheet
https://www.ofwat.gov.uk/wp-
content/uploads/2019/01/FM_E_WW_drinking-water-protection_IAP.xlsx
Drinking water protected area enhancement feeder model
Objective
To assess enhancement capex expenditure submitted by companies in their PR19 business plan submissions for
drinking water protected areas schemes, Table WS2 line 17 Drinking Water Protected Areas (schemes)
Approach
Shallow or Deep dive assessments are carried out as no suitable cost driver could be identified for econometric
modelling. We consider impacts of misallocation, double counting and regulatory support. We do not apply our
company-specific efficiency challenge to the companies that we shallow dive and allow the costs in full, due to the
low materiality of these proposals. For the deep-dive assessment, we consider the availability and quality of
evidence provided. We also reconcile information that has been identified within the companies’ submissions with
the list of schemes in the EAs’ WINEP3, March 2018.

Trust in water 18
An example of deep dive approach to enhancement: supply-demand balance
Cover sheet
Supply-demand balance enhancement feeder model
Objective
To assess enhancement expenditure submitted by companies in their PR19 business plan submissions as pre-
defined enhancement lines, WS2 lines 7, 8, 9, 10, 46, 47, 48 and 49, WS4 lines 2,3, 4 and 5.
Approach
For our assessment we considered the totex expenditure for supply option expenditure (critical period and dry
year annual average) and demand option expenditure (critical period and dry year annual average) as a
combined supply demand-balance enhancement assessment.
For companies where this total did not represent a material amount we undertook a shallow dive approach
applying the company efficiency, otherwise we completed a deep dive approach using the information provided
within the companies’ submission.
In the deep dive we disaggregated the totex expenditure into six supply-demand balance enhancement
components which we assessed separately. These were:
• 2020-25 supply-demand enhancement
• Long-term supply-demand enhancement
• Leakage enhancement
• Regional strategic solution development
• Internal interconnections
• Investigations and future planning
Wholesale Water Supply-demand balance enhancement – feeder model
• Excel spreadsheet file containing the analysis by company
Wholesale Water Supply-demand balance enhancement – feeder model summary
• Presentation pdf file providing further detail of the approach and a summary of output by company

Trust in water 19
Components of assessment
• 2020-25 enhancement
o Includes new supply and water efficiency schemes delivering SDB benefits in the period 2020-25.
o Assessed through a unit cost approach.
• Leakage enhancement
o Expenditure allocated using forecast leakage change in 2020-25, adjusted to remove benefits
resulting from metering (metering expenditure is assessed in a separate feeder model).
o Assessed through a unit cost approach.
• Long-term enhancement
o ‘Local’ supply schemes delivering SDB benefit (Ml/d) beyond 2025.
o Assessed through a deep-dive approach considering need, option selection, cost efficiency and
customer protection.
• Internal interconnections
o Includes network-improvement schemes providing SDB benefit to overcome localised deficits.
o Assessed through a deep-dive approach considering need, option selection, cost efficiency and
customer protection.
• Investigations and future planning
o Activities and related costs are assumed to be part of the base allowance.
• Strategic regional solution development
o An allowance for the consistent development of multiple strategic regional projects through the
planning stage to determine the optimum long-term solution for the region.
o Effectively assessed through a deep-dive approach considering need and option selection.
Supply-demand balance enhancement: assessment components

Trust in water 20
Structure of outputs
• The basic structure of the SDB feeder model is identical to those previously discussed with initial data
sheets, followed by individual company analysis and an allowance sheet providing the output of the models.
• The following gives details of the common elements of each of the SDB enhancement deep dive tabs
Supply-demand balance enhancement: structure of outputs
• Rows 27 to 38 provide detail of the information submitted in the company business plan and detail of any line reallocation
Breakdown for enhancement cost analysis
Claimed benefit
Ml/d
Claimed
expenditure £m
Allowed
benefit Ml/d
Allowed
expenditure £m NotesComments References
2020-25 supply enhancement
2020-25 demand (non-leakage) enhancement
2020-25 SDB enhancement total
2020-25 leakage enhancement
Long-term enhancement
Strategic regional solution development
Internal interconnections
Investigations and future planning
TOTAL
• Rows 41 to 48 contains both our breakdown of the company’s proposed benefits and expenditure into the six assessment
components, columns C and D (highlighted yellow above) and the results of our assessment of the individual components,
columns E and F (highlighted blue above). Grey cells are not used in the assessment

Trust in water 21
Structure of outputs
Supply-demand balance enhancement: structure of outputs
• Key features specific to the SDB enhancement feeder model include the following sheets:
o Leakage enhancement assessment – leakage assessment tests and results across all companies
to determine the final allowance
o Strategic schemes– derivation of the allowance for development of regional strategic schemes
o Unit costs – derivation of the unit costs used for leakage and 2020-25 enhancements
Wholesale Water Supply-demand balance enhancement – feeder model summary
• Cells C22 and C23 provide the total allowance following the assessment. The split is to identify clearly any additional
allowance made beyond the company’s requested expenditure for development of regional strategic options
• The supporting information in the feeder model summary provides consistently presented company
outputs for the SDB enhancement assessment:
o Tables 1 and 2 – company presented costs and benefits
o Table 3 – disaggregated costs and benefits into the six components
o Table 4 – disaggregated IAP cost allocation presented for six components
Wholesale Water Supply-demand balance enhancement – feeder model

Trust in water 22
Cost adjustment claims

Trust in water 23
Cost adjustment claims
Efficient modelled
base costs
Efficient unmodelledbase costs
Efficient enhancement
costs
Efficient Adjustments
Efficient total cost
allowance
Cost adjustment claims are mechanisms for a company to present evidence of
unique and material circumstances (operating, legal requirements or atypical
expenditure) which drive higher efficient costs for the company relative to its
peers.
Evidence of
uniqueness
Assessment
gates
Materiality
Thresholds test
1% Network+
6% Bio & WR
4% RR
6% BR
Higher efficient
costs
+ Base
+ Enhancement
+ Retail

Trust in water 24
Assessment gates (PR19 Final Methodology, Appendix 11, Box 2)
1. Need for investment • What incremental improvement would the proposal deliver?
• Is there persuasive evidence that an investment is required?
• Where appropriate, is there evidence – assured by the customer challenge group (CCG) – that customers support the project?
2. Need for cost adjustment • Is there persuasive evidence that the cost claim is not included (or, if the models are not known, would be unlikely to be included) in our modelled
baseline?
• Is it clear the allowances would, in the round, be insufficient to accommodate special factors without a claim?
3. Management control • Is the cost driven by factors beyond management control?
• Is there persuasive evidence that the company has taken all reasonable steps to control the cost?
4. Best option for customers • Does the proposal deliver outcomes that reflect customers’ priorities, identified through customer engagement? Is there CCG assurance that the company
has engaged with customers on the project and this engagement been taken account of?
• Did the company consider an appropriate range of options with a robust cost–benefit analysis before concluding that the proposed option should be
pursued?
• Is there persuasive evidence that the proposed solution represents the best value for customers in the long term, including evidence from customer
engagement?
• Has risk been assessed? Have flexible, lower risk solutions been assessed?
• Has the impact on natural capital and the environment been considered?
5. Robustness and efficiency of costs • Is there persuasive evidence that the cost estimates are robust and efficient?
• Is there high quality third party assurance for the robustness of the cost estimates?
6. Customer protection • Are customers protected if the investment is cancelled, delayed or reduced in scope?
• Are the customer benefits that relate to the claim linked to outcomes and to a suitable incentive in the company’s business plan?
7. Affordability • Has the impact on affordability been considered?
• For large investment schemes in particular, is there persuasive evidence that the investment does not raise bills higher than what is affordable?
8. Board assurance • Does the company’s Board provide assurance that investment proposals are robust and deliverable, that a proper appraisal of options has taken place and
that the option proposed is the best one for customers?

Trust in water 25
The two impacts of cost adjustment claims in the IAP
• For the IAP we assessed the quality of evidence
• The quality assessment is independent of whether we add to our view of
costs. as a result of a claim.
• For some high quality claims we add to our view of efficient costs. We first
take account of any implicit allowance from our modelling approaches.
• Where a claim is for standard enhancement investment we typically assess it
as enhancement, rather than as a cost adjustment claim.
We have published a separate cost adjustment claim excel model for each company.

Trust in water 26
Actions for companies
Trust in water 27
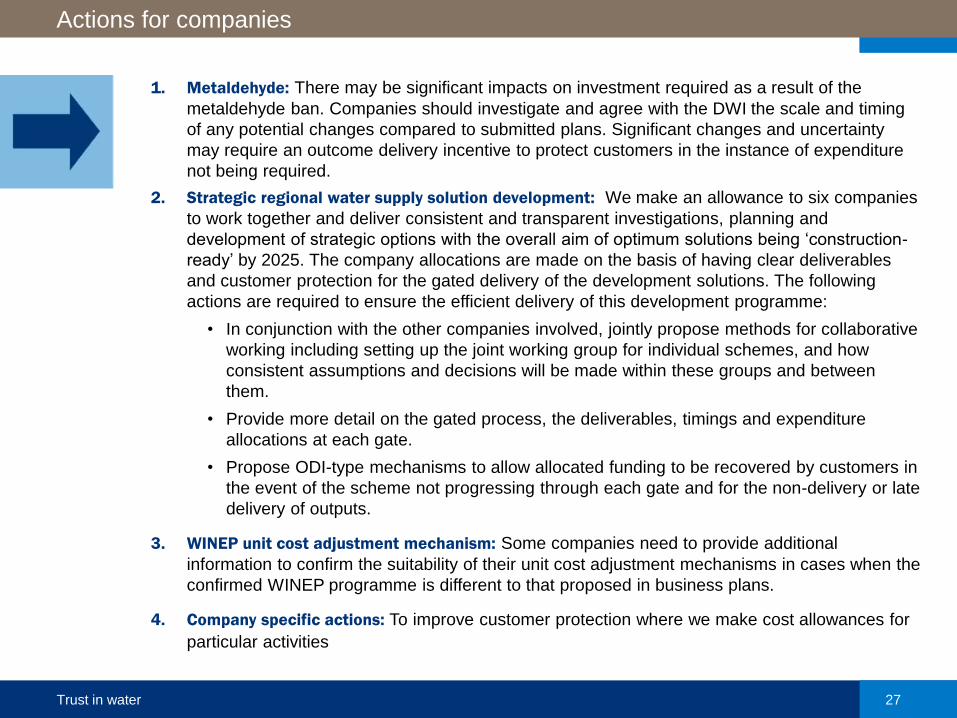
1. Metaldehyde: There may be significant impacts on investment required as a result of the
metaldehyde ban. Companies should investigate and agree with the DWI the scale and timing
of any potential changes compared to submitted plans. Significant changes and uncertainty
may require an outcome delivery incentive to protect customers in the instance of expenditure
not being required.
2. Strategic regional water supply solution development: We make an allowance to six companies
to work together and deliver consistent and transparent investigations, planning and
development of strategic options with the overall aim of optimum solutions being ‘construction-
ready’ by 2025. The company allocations are made on the basis of having clear deliverables
and customer protection for the gated delivery of the development solutions. The following
actions are required to ensure the efficient delivery of this development programme:
• In conjunction with the other companies involved, jointly propose methods for collaborative
working including setting up the joint working group for individual schemes, and how
consistent assumptions and decisions will be made within these groups and between
them.
• Provide more detail on the gated process, the deliverables, timings and expenditure
allocations at each gate.
• Propose ODI-type mechanisms to allow allocated funding to be recovered by customers in
the event of the scheme not progressing through each gate and for the non-delivery or late
delivery of outputs.
3. WINEP unit cost adjustment mechanism: Some companies need to provide additional
information to confirm the suitability of their unit cost adjustment mechanisms in cases when the
confirmed WINEP programme is different to that proposed in business plans.
4. Company specific actions: To improve customer protection where we make cost allowances for
particular activities
Actions for companies

Trust in water 28
www.ofwat.gov.uk
Twitter.com/Ofwat
Thank you and questions


![r( [email protected] [email protected] [email protected]`L](https://img.pdfslide.net/doc/110x75/6207318949d709492c2edac3/r-emailprotected-emailprotected-emailprotectedl.jpg)