Embed Size (px)
Citation preview

PR24 cost assessment working group 3
Draft for discussion
15th July 2021
Improving life through water | Gwella bywyd drwy ddŵr | 2
Contents
Welcome and housekeeping (11:00 to 11:05) 2
Cost assessment principles– Introduction (11:05 to 11:10) 3– Sam Crook, United Utilities (11:10 to 11:20) 6– First break out session and feedback (11:20 to 11:40) 10
Scope of modelled base costs– Introduction (11:40 to 11:50) 11– Robert Holdway, Severn Trent (11:50 to 12:00) 15– Second break out session and feedback (12:00 to 12:20) 24
Break (12:20 to 12:30)
Base cost drivers and explanatory variables– Introduction (12:30 to 12:40) 25– Carlos PinedaBermudez, Thames Water (12:40 to 12:55) 31– Third break out session and feedback (12:55 to 13:20) 42
Next steps (13:20 to 13:30) 43

1. Cost assessment principles
Improving life through water | Gwella bywyd drwy ddŵr | 4
PR19 Approach to Modelling
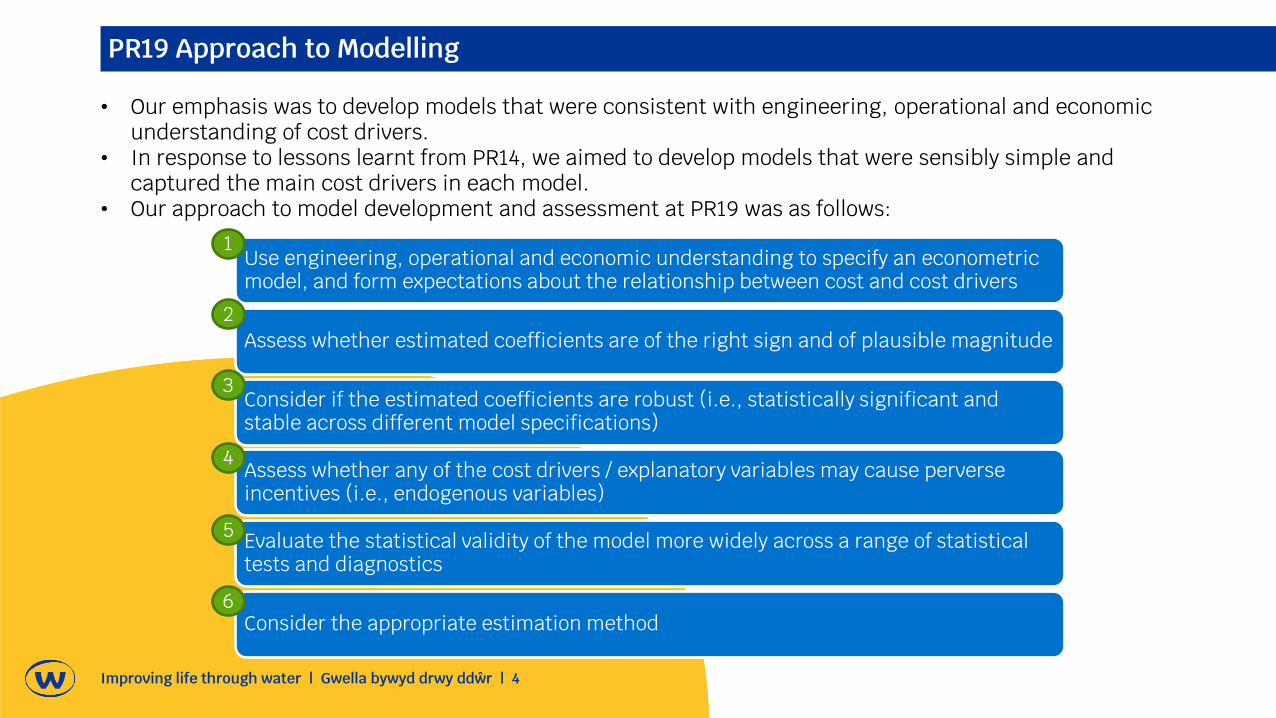
• Our emphasis was to develop models that were consistent with engineering, operational and economic understanding of cost drivers.
• In response to lessons learnt from PR14, we aimed to develop models that were sensibly simple and captured the main cost drivers in each model.
• Our approach to model development and assessment at PR19 was as follows:
Use engineering, operational and economic understanding to specify an econometric model, and form expectations about the relationship between cost and cost drivers
Assess whether estimated coefficients are of the right sign and of plausible magnitude
Consider if the estimated coefficients are robust (i.e., statistically significant and stable across different model specifications)
Assess whether any of the cost drivers / explanatory variables may cause perverse incentives (i.e., endogenous variables)
Evaluate the statistical validity of the model more widely across a range of statistical tests and diagnostics
Consider the appropriate estimation method
1
2
3
4
5
6
Improving life through water | Gwella bywyd drwy ddŵr | 5
PR24 cost assessment
United Utilities have recently completed their first paper is a series of cost assessment papers they intend to contribute to the Future Ideas Lab.
The first paper identifies 6 key principles of cost assessment, which have been shaped from their reflections on cost assessment at PR19, and the challenge that lie ahead at PR24.
Sam will present an overview of their paper before we go into breakout rooms to discuss.
The principles of regulatory cost assessmentCAWG meeting 3, 15th July 2021
Copyright © United Utilities Water Limited 2021 7
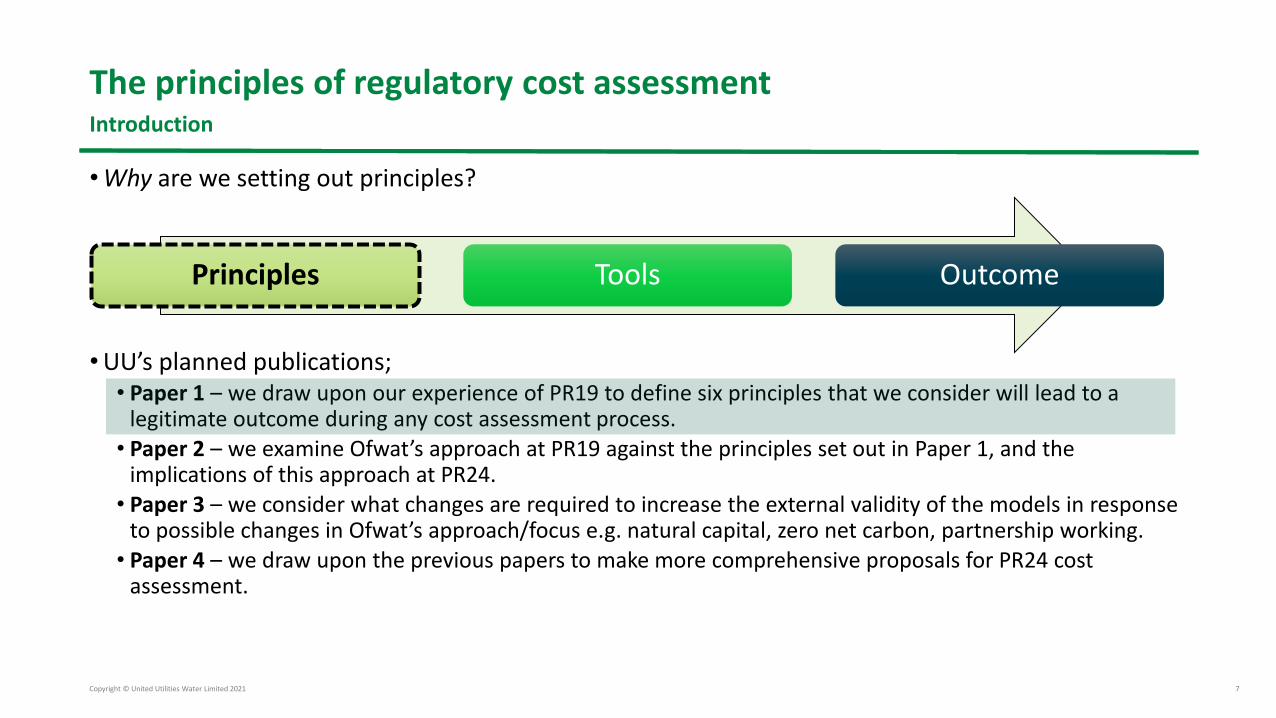
The principles of regulatory cost assessmentIntroduction
• Why are we setting out principles?
• UU’s planned publications;• Paper 1 – we draw upon our experience of PR19 to define six principles that we consider will lead to a
legitimate outcome during any cost assessment process. • Paper 2 – we examine Ofwat’s approach at PR19 against the principles set out in Paper 1, and the
implications of this approach at PR24. • Paper 3 – we consider what changes are required to increase the external validity of the models in response
to possible changes in Ofwat’s approach/focus e.g. natural capital, zero net carbon, partnership working. • Paper 4 – we draw upon the previous papers to make more comprehensive proposals for PR24 cost
assessment.
Principles Tools Outcome
Copyright © United Utilities Water Limited 2021 8
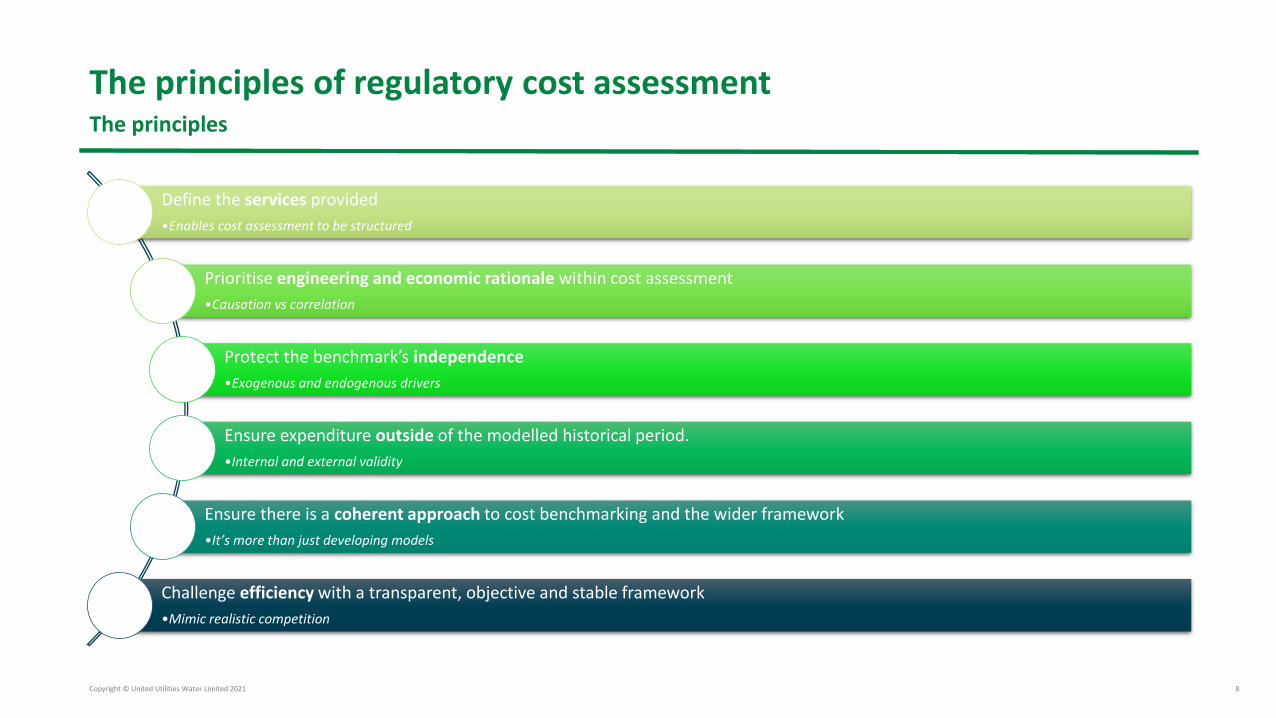
The principles of regulatory cost assessmentThe principles
Define the services provided
•Enables cost assessment to be structured
Prioritise engineering and economic rationale within cost assessment
•Causation vs correlation
Protect the benchmark’s independence
•Exogenous and endogenous drivers
Ensure expenditure outside of the modelled historical period.
•Internal and external validity
Ensure there is a coherent approach to cost benchmarking and the wider framework
•It’s more than just developing models
Challenge efficiency with a transparent, objective and stable framework
•Mimic realistic competition


Improving life through water | Gwella bywyd drwy ddŵr | 10
First breakout room questions
1. Do you agree with the 6 principles identified by United Utilities?
2. Are there any important principles missing?
2. Scope of modelled base costs
Improving life through water | Gwella bywyd drwy ddŵr | 12
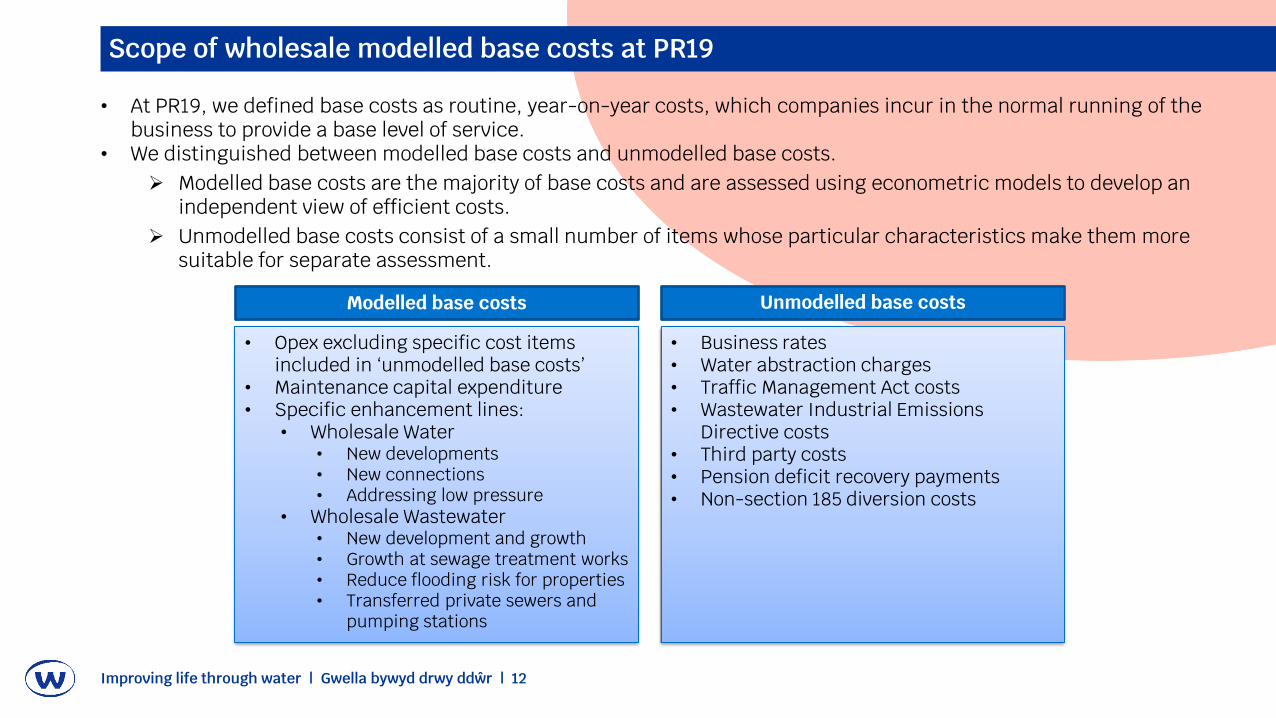
Scope of wholesale modelled base costs at PR19
• At PR19, we defined base costs as routine, year-on-year costs, which companies incur in the normal running of the business to provide a base level of service.
• We distinguished between modelled base costs and unmodelled base costs.➢ Modelled base costs are the majority of base costs and are assessed using econometric models to develop an
independent view of efficient costs.➢ Unmodelled base costs consist of a small number of items whose particular characteristics make them more
suitable for separate assessment.
Modelled base costs Unmodelled base costs
• Opex excluding specific cost items included in ‘unmodelled base costs’
• Maintenance capital expenditure• Specific enhancement lines:
• Wholesale Water• New developments• New connections• Addressing low pressure
• Wholesale Wastewater• New development and growth• Growth at sewage treatment works• Reduce flooding risk for properties• Transferred private sewers and
pumping stations
• Business rates• Water abstraction charges• Traffic Management Act costs• Wastewater Industrial Emissions
Directive costs• Third party costs• Pension deficit recovery payments• Non-section 185 diversion costs
Improving life through water | Gwella bywyd drwy ddŵr | 13
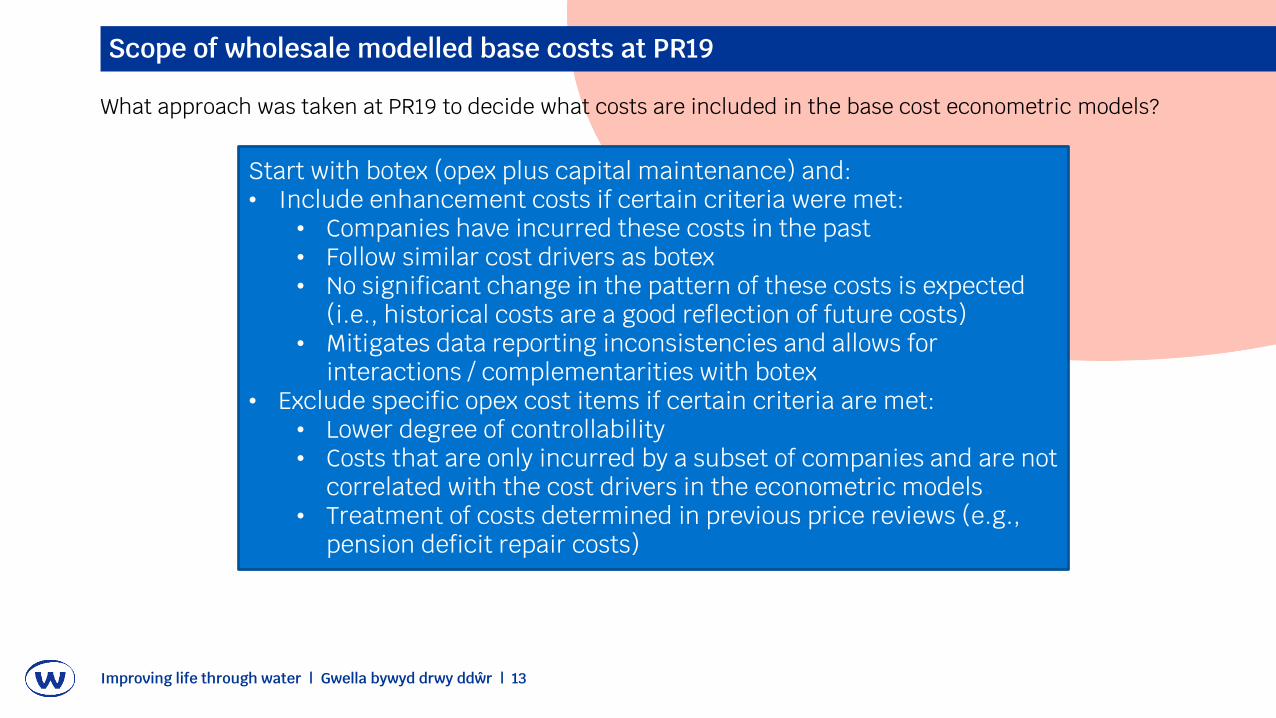
Scope of wholesale modelled base costs at PR19
What approach was taken at PR19 to decide what costs are included in the base cost econometric models?
Start with botex (opex plus capital maintenance) and:• Include enhancement costs if certain criteria were met:
• Companies have incurred these costs in the past• Follow similar cost drivers as botex• No significant change in the pattern of these costs is expected
(i.e., historical costs are a good reflection of future costs)• Mitigates data reporting inconsistencies and allows for
interactions / complementarities with botex• Exclude specific opex cost items if certain criteria are met:
• Lower degree of controllability• Costs that are only incurred by a subset of companies and are not
correlated with the cost drivers in the econometric models• Treatment of costs determined in previous price reviews (e.g.,
pension deficit repair costs)
Improving life through water | Gwella bywyd drwy ddŵr | 14
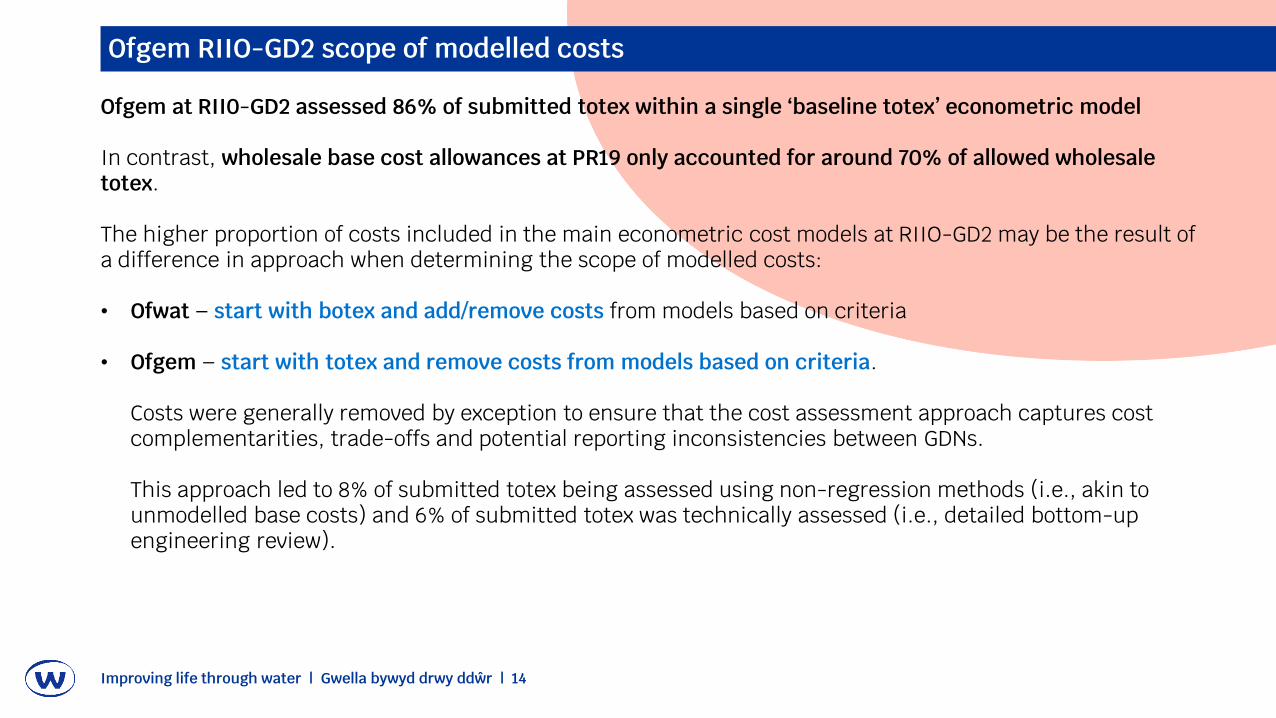
Ofgem RIIO-GD2 scope of modelled costs
Ofgem at RII0-GD2 assessed 86% of submitted totex within a single ‘baseline totex’ econometric model
In contrast, wholesale base cost allowances at PR19 only accounted for around 70% of allowed wholesale totex.
The higher proportion of costs included in the main econometric cost models at RIIO-GD2 may be the result of a difference in approach when determining the scope of modelled costs:
• Ofwat – start with botex and add/remove costs from models based on criteria
• Ofgem – start with totex and remove costs from models based on criteria.
Costs were generally removed by exception to ensure that the cost assessment approach captures cost complementarities, trade-offs and potential reporting inconsistencies between GDNs.
This approach led to 8% of submitted totex being assessed using non-regression methods (i.e., akin to unmodelled base costs) and 6% of submitted totex was technically assessed (i.e., detailed bottom-up engineering review).
15
ST Classification: OFFICIAL PERSONAL
A FRAMEWORK FOR TESTING CHANGES TO MODEL SCOPE
ST Classification: OFFICIAL PERSONAL
1616
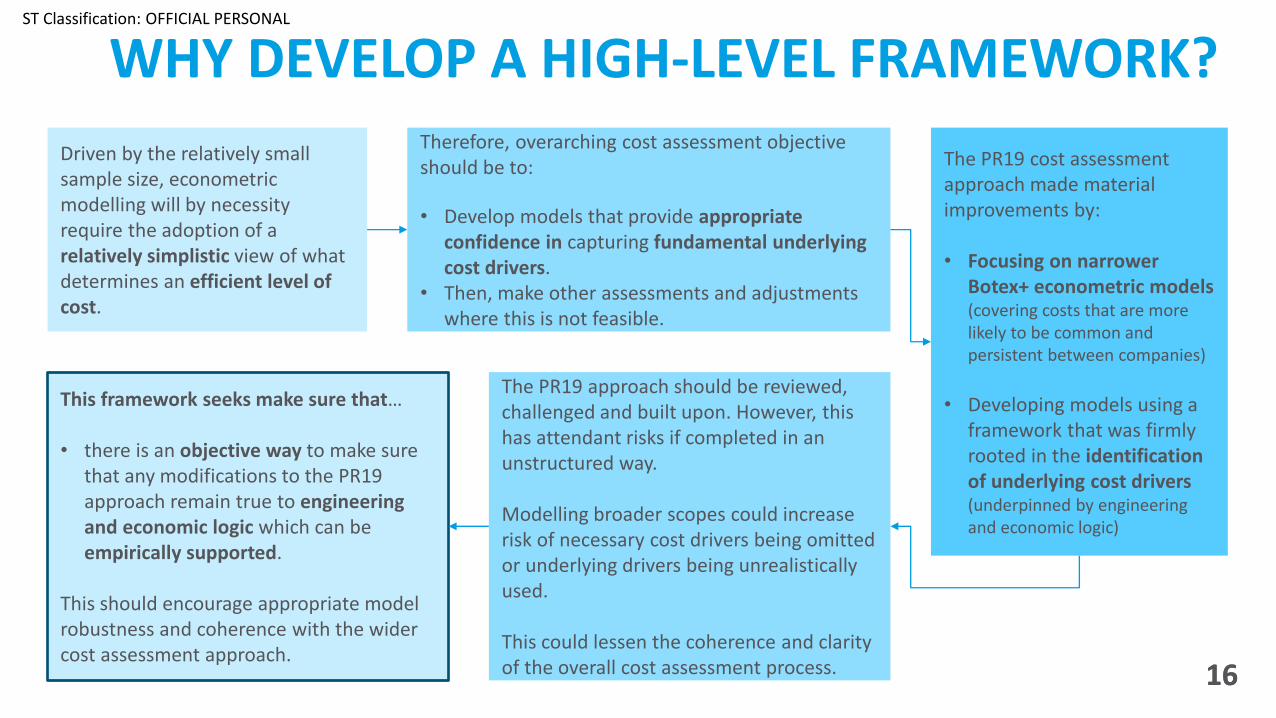
WHY DEVELOP A HIGH-LEVEL FRAMEWORK?
Driven by the relatively small sample size, econometric modelling will by necessity require the adoption of a relatively simplistic view of what determines an efficient level of cost.
Therefore, overarching cost assessment objective should be to:
• Develop models that provide appropriate confidence in capturing fundamental underlying cost drivers.
• Then, make other assessments and adjustments where this is not feasible.
The PR19 cost assessment approach made material improvements by:
• Focusing on narrower Botex+ econometric models (covering costs that are more likely to be common and persistent between companies)
• Developing models using a framework that was firmly rooted in the identification of underlying cost drivers (underpinned by engineering and economic logic)
This framework seeks make sure that…
• there is an objective way to make sure that any modifications to the PR19 approach remain true to engineering and economic logic which can be empirically supported.
This should encourage appropriate model robustness and coherence with the wider cost assessment approach.
The PR19 approach should be reviewed, challenged and built upon. However, this has attendant risks if completed in an unstructured way.
Modelling broader scopes could increase risk of necessary cost drivers being omitted or underlying drivers being unrealistically used.
This could lessen the coherence and clarity of the overall cost assessment process.
ST Classification: OFFICIAL PERSONAL
1717
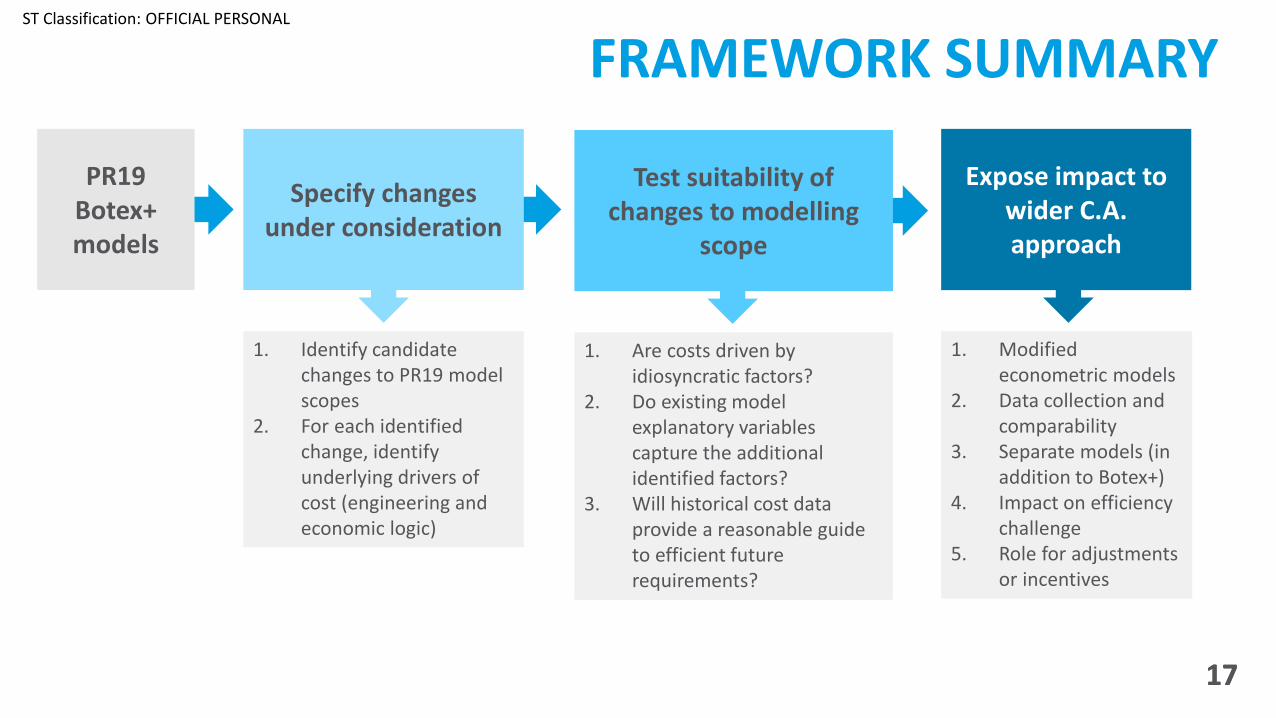
FRAMEWORK SUMMARY
1. Are costs driven by idiosyncratic factors?
2. Do existing model explanatory variables capture the additional identified factors?
3. Will historical cost data provide a reasonable guide to efficient future requirements?
PR19 Botex+ models
1. Identify candidate changes to PR19 model scopes
2. For each identified change, identify underlying drivers of cost (engineering and economic logic)
Specify changes under consideration
Test suitability of changes to modelling
scope
Expose impact to wider C.A. approach
1. Modified econometric models
2. Data collection and comparability
3. Separate models (in addition to Botex+)
4. Impact on efficiency challenge
5. Role for adjustments or incentives
ST Classification: OFFICIAL PERSONAL
1818
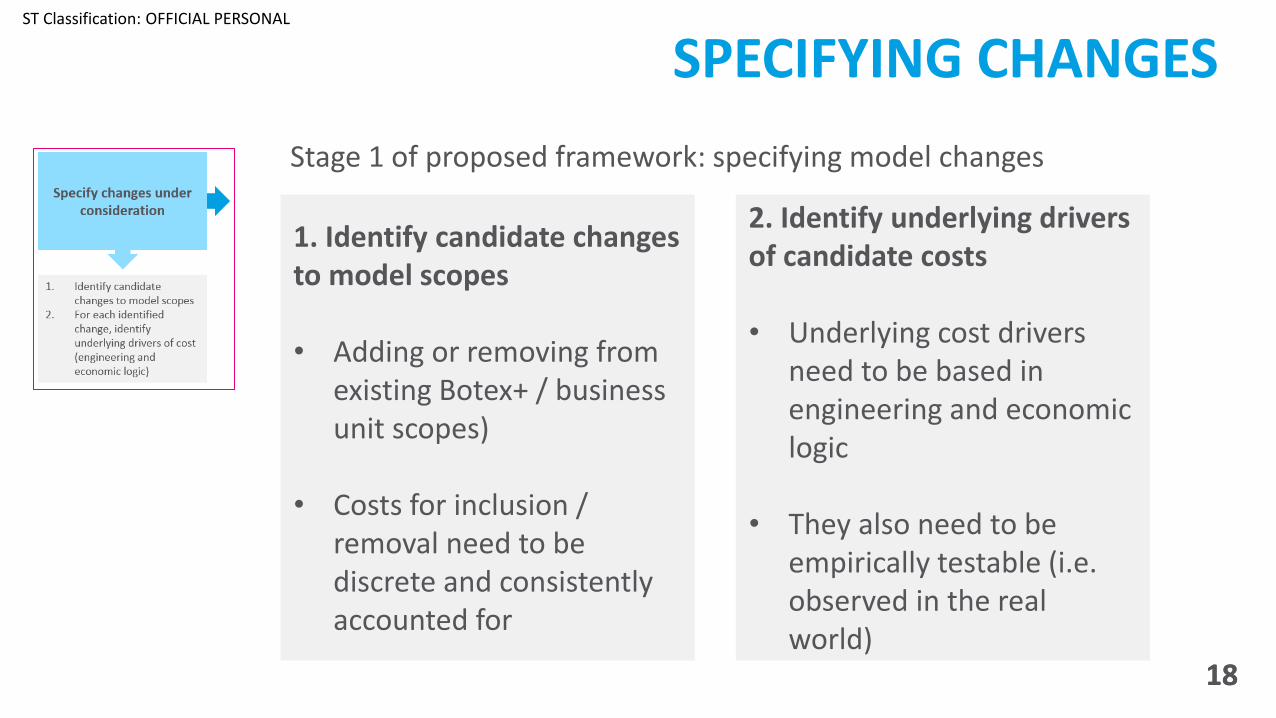
SPECIFYING CHANGES
1. Identify candidate changes to model scopes
• Adding or removing from existing Botex+ / business unit scopes)
• Costs for inclusion / removal need to be discrete and consistently accounted for
2. Identify underlying drivers of candidate costs
• Underlying cost drivers need to be based in engineering and economic logic
• They also need to be empirically testable (i.e. observed in the real world)
Stage 1 of proposed framework: specifying model changes
ST Classification: OFFICIAL PERSONAL
1919
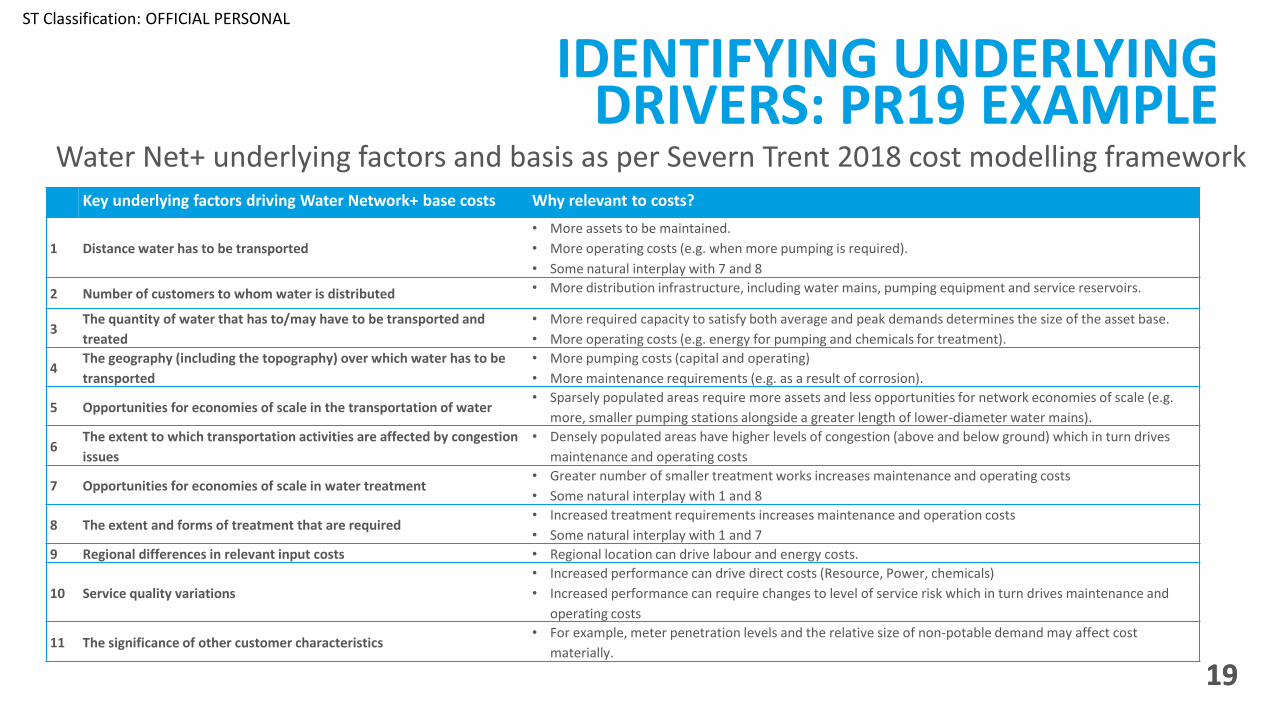
IDENTIFYING UNDERLYING DRIVERS: PR19 EXAMPLE
Key underlying factors driving Water Network+ base costs Why relevant to costs?
1 Distance water has to be transported
• More assets to be maintained.
• More operating costs (e.g. when more pumping is required).
• Some natural interplay with 7 and 8
2 Number of customers to whom water is distributed • More distribution infrastructure, including water mains, pumping equipment and service reservoirs.
3The quantity of water that has to/may have to be transported and
treated
• More required capacity to satisfy both average and peak demands determines the size of the asset base.
• More operating costs (e.g. energy for pumping and chemicals for treatment).
4The geography (including the topography) over which water has to be
transported
• More pumping costs (capital and operating)
• More maintenance requirements (e.g. as a result of corrosion).
5 Opportunities for economies of scale in the transportation of water• Sparsely populated areas require more assets and less opportunities for network economies of scale (e.g.
more, smaller pumping stations alongside a greater length of lower-diameter water mains).
6The extent to which transportation activities are affected by congestion
issues
• Densely populated areas have higher levels of congestion (above and below ground) which in turn drives
maintenance and operating costs
7 Opportunities for economies of scale in water treatment• Greater number of smaller treatment works increases maintenance and operating costs
• Some natural interplay with 1 and 8
8 The extent and forms of treatment that are required• Increased treatment requirements increases maintenance and operation costs
• Some natural interplay with 1 and 7
9 Regional differences in relevant input costs • Regional location can drive labour and energy costs.
10 Service quality variations
• Increased performance can drive direct costs (Resource, Power, chemicals)
• Increased performance can require changes to level of service risk which in turn drives maintenance and
operating costs
11 The significance of other customer characteristics• For example, meter penetration levels and the relative size of non-potable demand may affect cost
materially.
Water Net+ underlying factors and basis as per Severn Trent 2018 cost modelling framework
ST Classification: OFFICIAL PERSONAL
2020
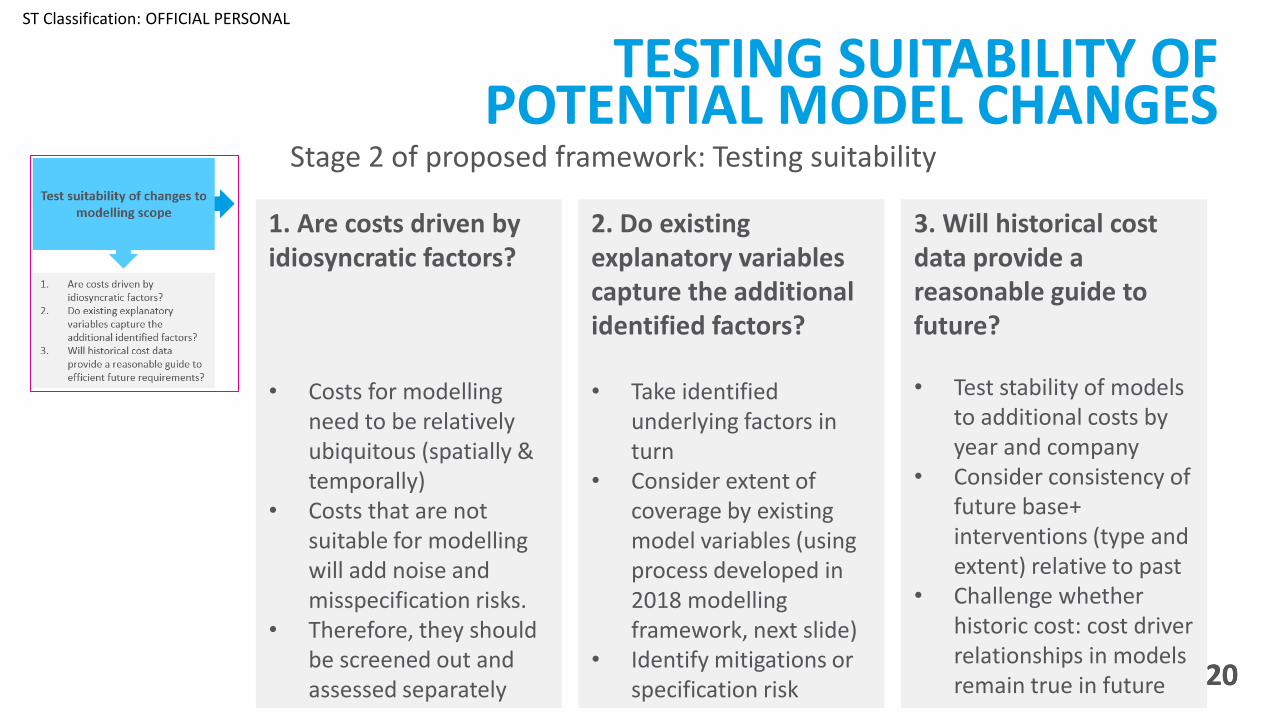
TESTING SUITABILITY OF POTENTIAL MODEL CHANGES
1. Are costs driven by idiosyncratic factors?
• Costs for modelling need to be relatively ubiquitous (spatially & temporally)
• Costs that are not suitable for modelling will add noise and misspecification risks.
• Therefore, they should be screened out and assessed separately
2. Do existing explanatory variables capture the additional identified factors?
• Take identified underlying factors in turn
• Consider extent of coverage by existing model variables (using process developed in 2018 modelling framework, next slide)
• Identify mitigations or specification risk
3. Will historical cost data provide a reasonable guide to future?
• Test stability of models to additional costs by year and company
• Consider consistency of future base+ interventions (type and extent) relative to past
• Challenge whether historic cost: cost driver relationships in models remain true in future
Stage 2 of proposed framework: Testing suitability
ST Classification: OFFICIAL PERSONAL
2121
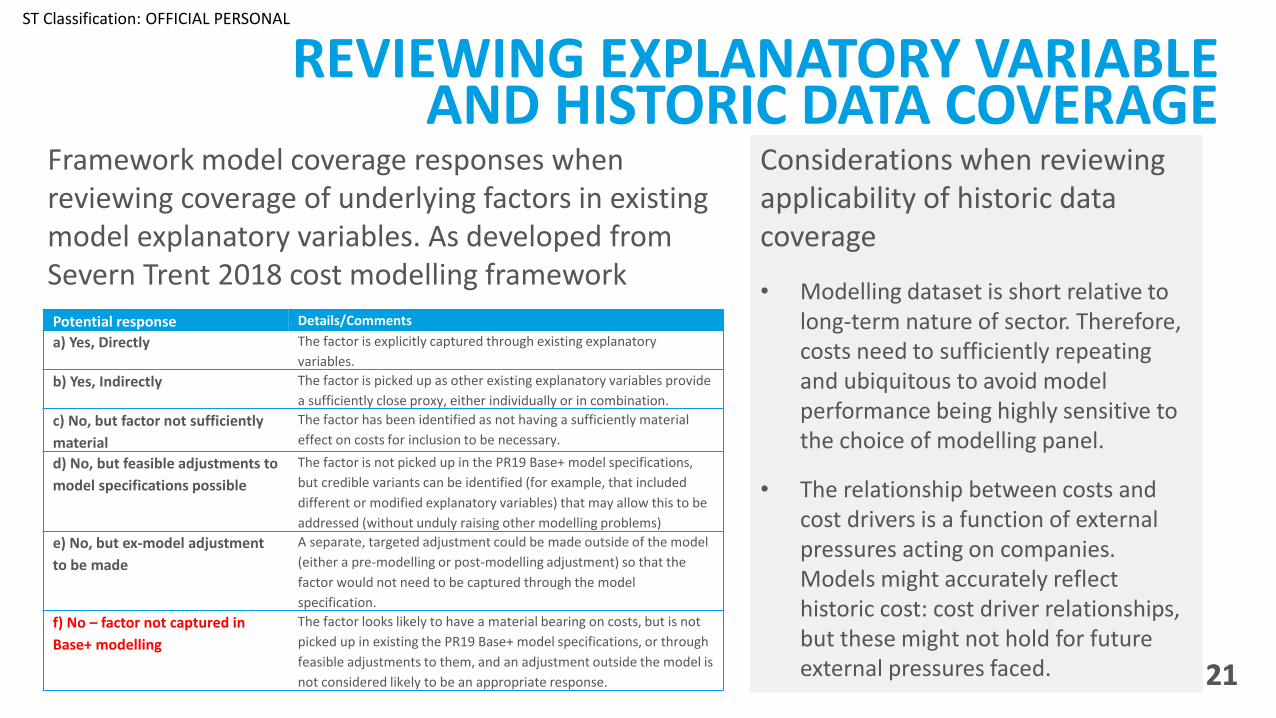
REVIEWING EXPLANATORY VARIABLE AND HISTORIC DATA COVERAGE
Potential response Details/Comments
a) Yes, Directly The factor is explicitly captured through existing explanatory
variables.
b) Yes, Indirectly The factor is picked up as other existing explanatory variables provide
a sufficiently close proxy, either individually or in combination.
c) No, but factor not sufficiently
material
The factor has been identified as not having a sufficiently material
effect on costs for inclusion to be necessary.
d) No, but feasible adjustments to
model specifications possible
The factor is not picked up in the PR19 Base+ model specifications,
but credible variants can be identified (for example, that included
different or modified explanatory variables) that may allow this to be
addressed (without unduly raising other modelling problems)
e) No, but ex-model adjustment
to be made
A separate, targeted adjustment could be made outside of the model
(either a pre-modelling or post-modelling adjustment) so that the
factor would not need to be captured through the model
specification.
f) No – factor not captured in
Base+ modelling
The factor looks likely to have a material bearing on costs, but is not
picked up in existing the PR19 Base+ model specifications, or through
feasible adjustments to them, and an adjustment outside the model is
not considered likely to be an appropriate response.
Framework model coverage responses when reviewing coverage of underlying factors in existing model explanatory variables. As developed from Severn Trent 2018 cost modelling framework
Considerations when reviewing applicability of historic data coverage
• Modelling dataset is short relative to long-term nature of sector. Therefore, costs need to sufficiently repeating and ubiquitous to avoid model performance being highly sensitive to the choice of modelling panel.
• The relationship between costs and cost drivers is a function of external pressures acting on companies. Models might accurately reflect historic cost: cost driver relationships, but these might not hold for future external pressures faced.
ST Classification: OFFICIAL PERSONAL
2222
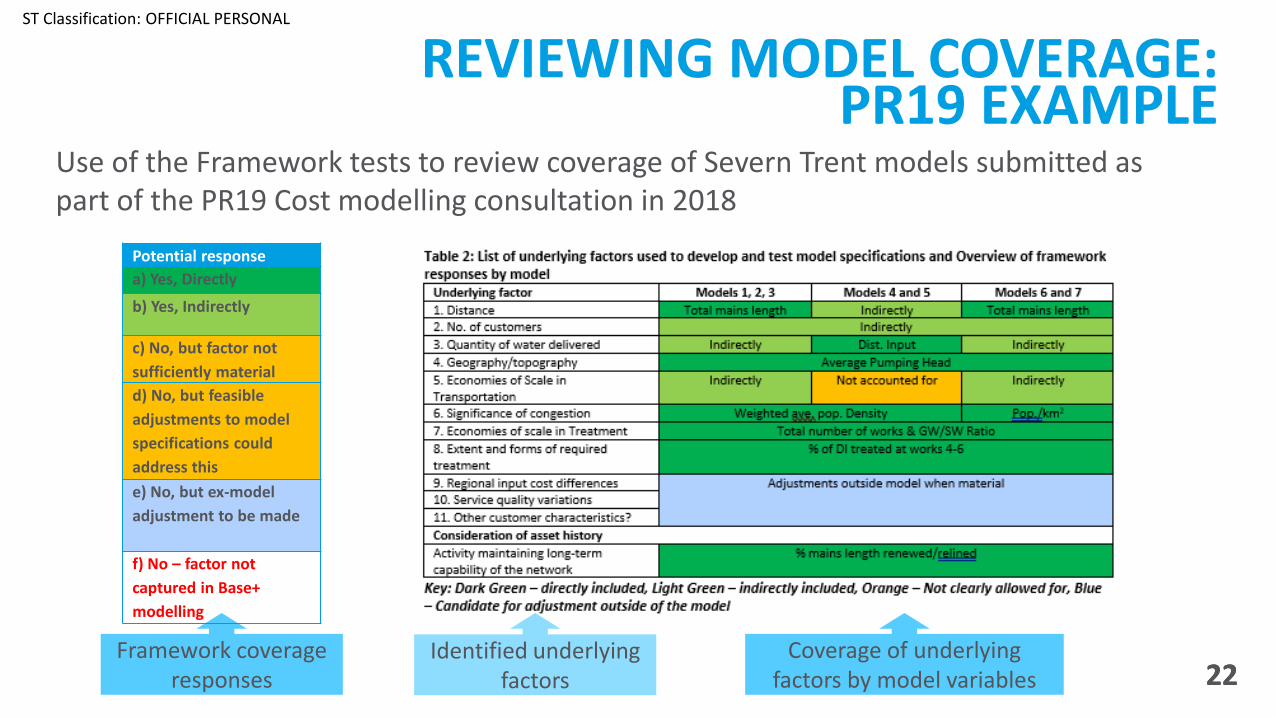
REVIEWING MODEL COVERAGE: PR19 EXAMPLE
Potential response
a) Yes, Directly
b) Yes, Indirectly
c) No, but factor not
sufficiently material
d) No, but feasible
adjustments to model
specifications could
address this
e) No, but ex-model
adjustment to be made
f) No – factor not
captured in Base+
modelling
Use of the Framework tests to review coverage of Severn Trent models submitted as part of the PR19 Cost modelling consultation in 2018
Identified underlying factors
Coverage of underlying factors by model variables
Framework coverage responses
ST Classification: OFFICIAL PERSONAL
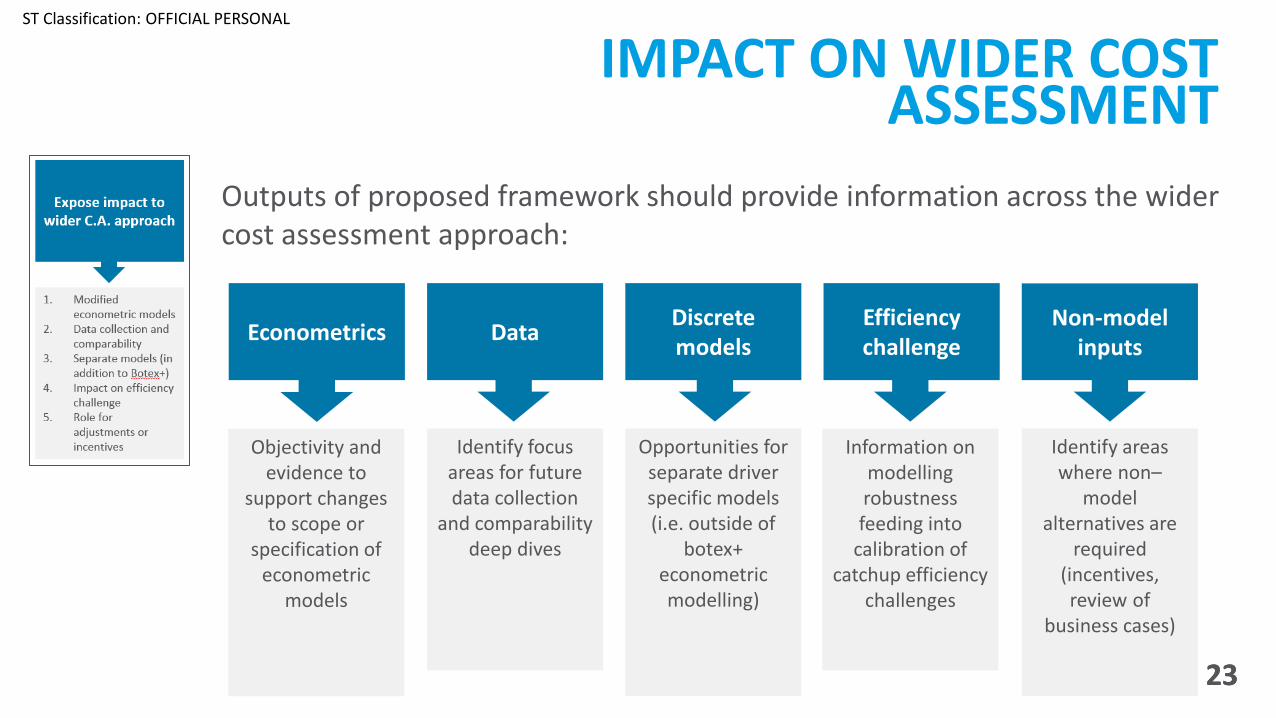
2323
IMPACT ON WIDER COST ASSESSMENT
Outputs of proposed framework should provide information across the wider cost assessment approach:
Objectivity and evidence to
support changes to scope or
specification of econometric
models
Econometrics DataDiscrete models
Efficiency challenge
Non-model inputs
Identify focus areas for future data collection
and comparability deep dives
Opportunities for separate driver specific models (i.e. outside of
botex+ econometric modelling)
Information on modelling robustness feeding into
calibration of catchup efficiency
challenges
Identify areas where non–
model alternatives are
required (incentives, review of
business cases)
Improving life through water | Gwella bywyd drwy ddŵr | 24
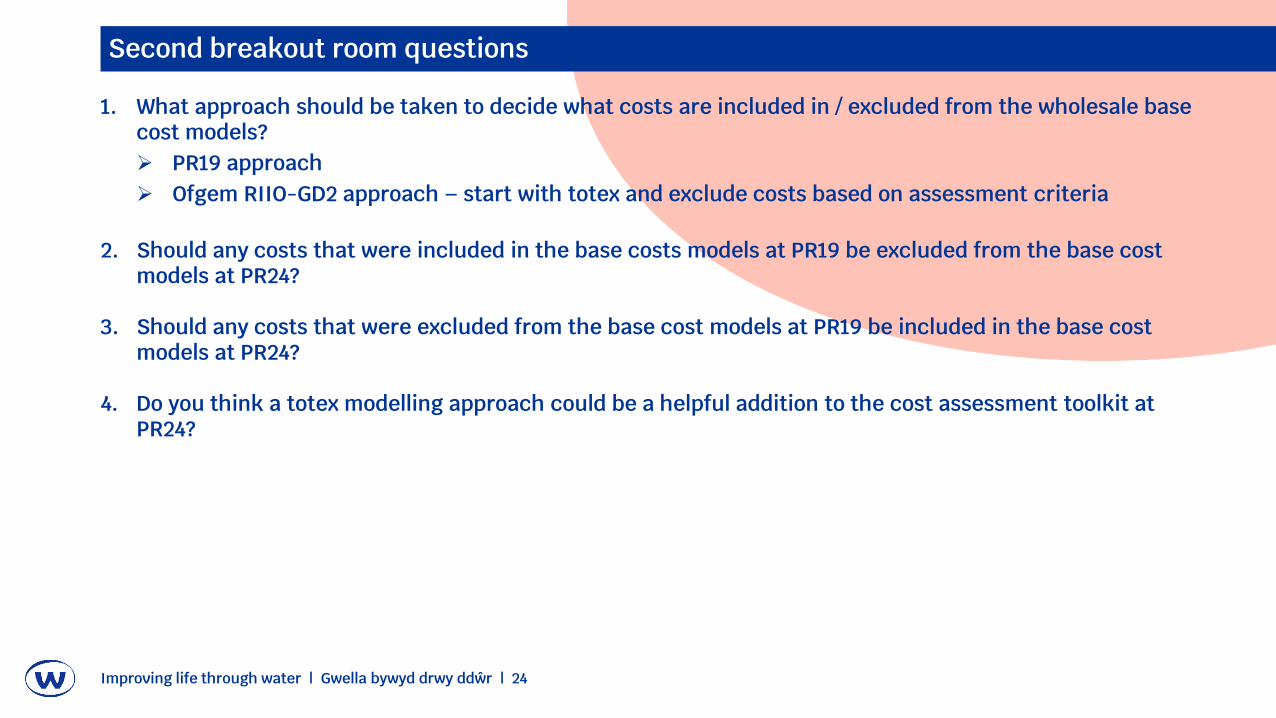
Second breakout room questions
1. What approach should be taken to decide what costs are included in / excluded from the wholesale base cost models?➢ PR19 approach➢ Ofgem RIIO-GD2 approach – start with totex and exclude costs based on assessment criteria
2. Should any costs that were included in the base costs models at PR19 be excluded from the base cost models at PR24?
3. Should any costs that were excluded from the base cost models at PR19 be included in the base cost models at PR24?
4. Do you think a totex modelling approach could be a helpful addition to the cost assessment toolkit at PR24?
3. PR19 wholesale base cost drivers and explanatory variables
Improving life through water | Gwella bywyd drwy ddŵr | 26
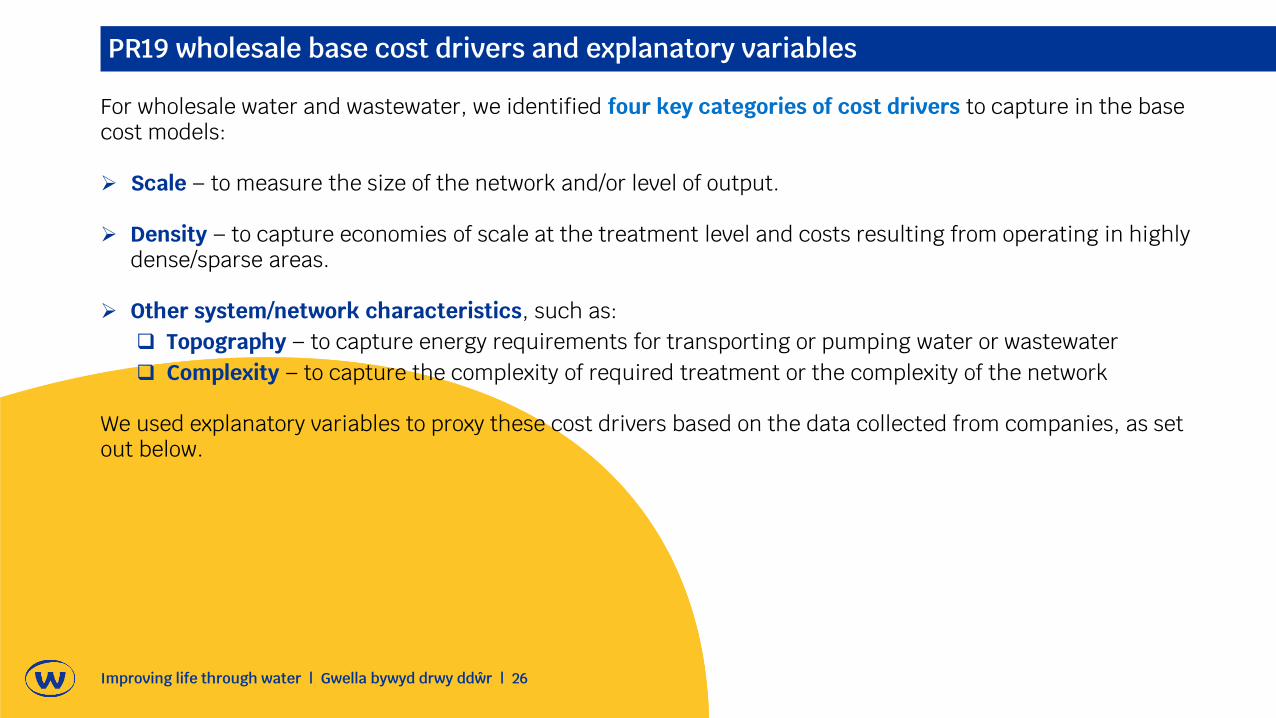
PR19 wholesale base cost drivers and explanatory variables
For wholesale water and wastewater, we identified four key categories of cost drivers to capture in the base cost models:
➢ Scale – to measure the size of the network and/or level of output.
➢ Density – to capture economies of scale at the treatment level and costs resulting from operating in highly dense/sparse areas.
➢ Other system/network characteristics, such as:❑ Topography – to capture energy requirements for transporting or pumping water or wastewater❑ Complexity – to capture the complexity of required treatment or the complexity of the network
We used explanatory variables to proxy these cost drivers based on the data collected from companies, as set out below.
Improving life through water | Gwella bywyd drwy ddŵr | 27
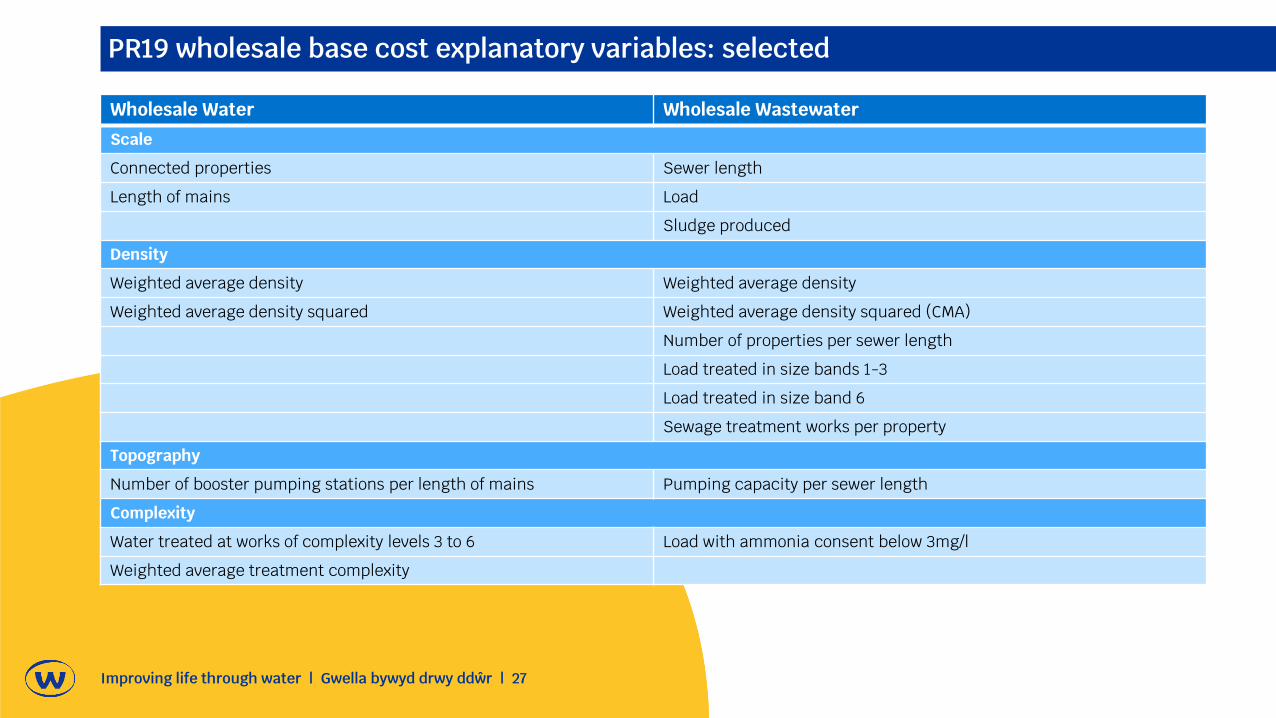
PR19 wholesale base cost explanatory variables: selected
Wholesale Water Wholesale WastewaterScale
Connected properties Sewer length
Length of mains Load
Sludge produced
Density
Weighted average density Weighted average density
Weighted average density squared Weighted average density squared (CMA)
Number of properties per sewer length
Load treated in size bands 1-3
Load treated in size band 6
Sewage treatment works per property
Topography
Number of booster pumping stations per length of mains Pumping capacity per sewer length
Complexity
Water treated at works of complexity levels 3 to 6 Load with ammonia consent below 3mg/l
Weighted average treatment complexity
Improving life through water | Gwella bywyd drwy ddŵr | 28
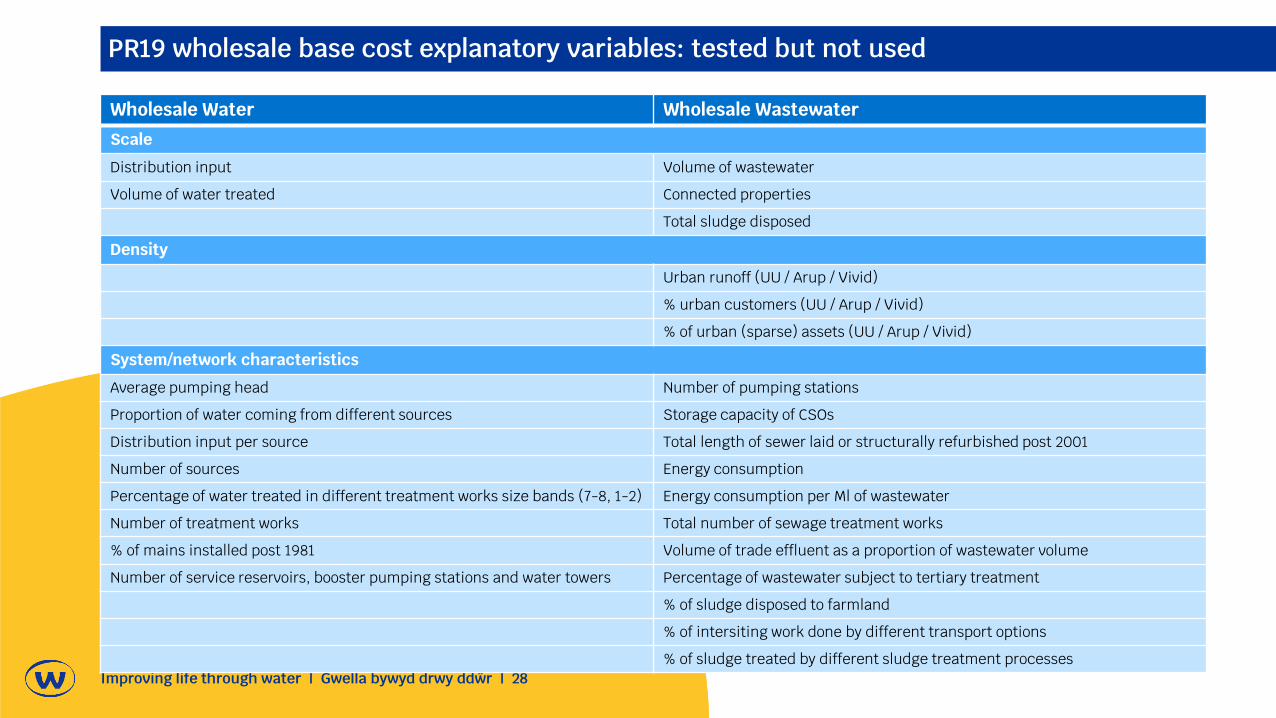
PR19 wholesale base cost explanatory variables: tested but not used
Wholesale Water Wholesale WastewaterScale
Distribution input Volume of wastewater
Volume of water treated Connected properties
Total sludge disposed
Density
Urban runoff (UU / Arup / Vivid)
% urban customers (UU / Arup / Vivid)
% of urban (sparse) assets (UU / Arup / Vivid)
System/network characteristics
Average pumping head Number of pumping stations
Proportion of water coming from different sources Storage capacity of CSOs
Distribution input per source Total length of sewer laid or structurally refurbished post 2001
Number of sources Energy consumption
Percentage of water treated in different treatment works size bands (7-8, 1-2) Energy consumption per Ml of wastewater
Number of treatment works Total number of sewage treatment works
% of mains installed post 1981 Volume of trade effluent as a proportion of wastewater volume
Number of service reservoirs, booster pumping stations and water towers Percentage of wastewater subject to tertiary treatment
% of sludge disposed to farmland
% of intersiting work done by different transport options
% of sludge treated by different sludge treatment processes
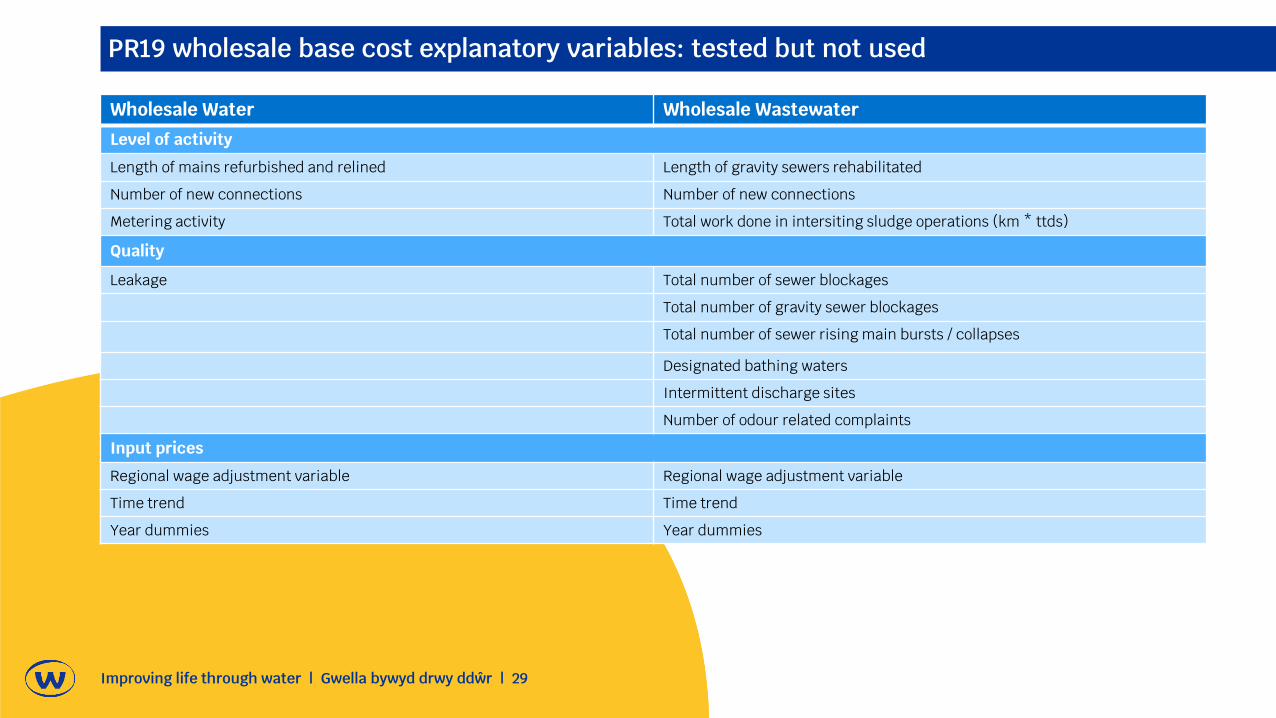
Improving life through water | Gwella bywyd drwy ddŵr | 29
PR19 wholesale base cost explanatory variables: tested but not used
Wholesale Water Wholesale WastewaterLevel of activity
Length of mains refurbished and relined Length of gravity sewers rehabilitated
Number of new connections Number of new connections
Metering activity Total work done in intersiting sludge operations (km * ttds)
Quality
Leakage Total number of sewer blockages
Total number of gravity sewer blockages
Total number of sewer rising main bursts / collapses
Designated bathing waters
Intermittent discharge sites
Number of odour related complaints
Input prices
Regional wage adjustment variable Regional wage adjustment variable
Time trend Time trend
Year dummies Year dummies
Improving life through water | Gwella bywyd drwy ddŵr | 30
PR24 wholesale base cost drivers and explanatory variables
As discussed in CAWG#2, we are interested in company views and feedback on:• Cost drivers and explanatory variables used in the PR19 base cost models• Alternative / additional cost drivers and explanatory variables to consider at PR24.
Thames Water have subsequently developed a set of slides, which explore potential additional / alternative cost drivers and explanatory variables to consider at PR24.
We will consider wholesale enhancement and residential retail cost drivers and explanatory variables at future CAWGs.
July 2021
Third CAWG
Scope of Modelling and Cost Drivers
Confidential-Draft for discussion
Introduction
32
o The aim of this presentation is to provide insights and ideas on how we could improve our
current cost assessment framework for PR24 in a constructive way.
o In particular, we have focused on Ofwat’s requests presented during the last CAWG (see “PR24
cost assessment working group, Draft for discussion, May 2021”).
o This presentation covers the following areas:
1) Cost Drivers and Explanatory Variables
Confidential-Draft for discussion
1) Cost Drivers and Explanatory Variables
33
Feedback on cost drivers and explanatory variables included in PR19 base (and enhancement)
cost models
o We think that the cost drivers at PR19 generally capture a good dimension of the costs. However,
there are areas where the cost drivers can take a more economic approach in addition to the scale,
density and topography view of the current models.
o The enhancement models should take an approach that controls for the lumpiness of this type of
investments. A dynamic model could help to control this lumpiness. Moreover, there are some
drivers that could complement the dynamic component in a dynamic panel model.
Alternative / additional cost drivers and explanatory variables to consider at PR24
We think that the models could be extended/improved with the appropriate inclusion of the following
general cost drivers. We will give a brief description in the next slides:
o Regional Wages
o Stock or Price of Capital
o Scale/Output drivers
o Technological Change (Time trend) and Quality
o Other New Drivers
Confidential-Draft for discussion
Regional Wages
34
o Regional wages (RW) is a proxy for the price of labour in a regulatory framework to avoid perverse incentives (see
Shleifer (1985) or Wolak (1994)). With respect to the construction of RW for PR19 by Ofwat, we identified the following
points that could improve its measure in PR24:
• Potential problems with the allocation of FTE by companies (Inconsistencies;
For example, is hard to understand why some companies have 23% of FTE on
Caring, Leisure and Service Occupations while most of them is nearly 0%)
• There are occupations that seem to be no relevant to the water/waste
industry. How can we define a proper structure of the occupations related to the water/waste
industries? (For instance, Frontier Economics (FE) use seven occupation categories
(SOC) to construct the regional wage for Ofgem models (RIIO-1).
• Only seven companies submitted the SOC classification in PR19.
• Significant differences between SOC across companies might be explained
by the different interpretations that companies have on the occupation Definitions?
• Was the ONS wage deflated at PR19?
• In addition, Ofwat seems to use “the excluding overtime” information instead of
the gross version of hourly pay (FE considered the gross version for Ofgem,
see. p. 32). [All these comments are based on Ofwat’s RW excel file].
o Having a wrong weights/allocation of the occupations, impacts the calculation of the RW. The result of the final
calculation of RW is sensitive to these weights (see Ofwat excel file and try with different scenarios to see the impact;
The occupational weights are an industry simple average no weights were applied).
o The current econometric models might have some endogeneity issues as RW is positively correlated with density
(0.7). Hence, a proper distinction of RW is crucial to avoid inconsistencies.
Confidential-Draft for discussion
Capital Stock (K) or Price of Capital (r)
35
o Should we control for K/r in the costs models? Any microeconomic model of cost functions covers labour
costs (or RW) and capital costs among others.
o Theory suggest if the cost model is being specified as a short-run cost function then it must control for
its capital stock as a fixed input (see microeconomic assumptions on the optimisation problem of the firm
regarding costs).
o K can be measured either by using a capacity measure or a cost measure applying the perpetual
inventory technique, where the latter method is theoretically more appropriate:
• Given the large amount of fixed capital cost in the water industry it is crucial to control for this variable in the
most accurate way to avoid misspecifications of the econometric models (e.g., dgp, omitted variables).
• Cost Measure: A way to measure K would be the use of Modern Equivalent Asset (MEA) methodology (e.g.,
Frontier Economics has an example in the Productivity paper) as a better proxy of RCV (see Bottasso and
Conti (2009)).
• Capacity Measure: Some studies have used proxies for the capital stock such as length of mains among
others (see Faust and Baranzini (2014), Destandau and Garcia (2014), Garcia and Thomas (2001)).
o If we specify a long-run cost function then the cost function must control for the price of capital (r). This r
can be measured in different ways. In Bottasso and Conti (2009) r (rate of return) is measured as:
r = Depreciation Rate + WACC
o Where Depreciation rate = the depreciation and infrastructure renewal charge divided by the capital stock
(K) (see Joskow (2007) or Wolak (1994)).
Confidential-Draft for discussion
Scale/Output Drivers
36
o Scale/Output drivers: for each production process such as abstraction, treatment, and distribution we
need to understand clearly the economic output being produced.
o In principle, the economic output being delivered in the network (e.g., water distribution) has three
dimensions (see Torres and Paul (2005) and Schmalensee (1978)):
• Output (e.g., water volume (scale); Output Quality (leakage, etc.))
• Number of customers (e.g., connections or density)
• Service area size (e.g., distance; length of mains or area in Km2 ; as a potential
new driver, we could distinguish between transmission and distribution mains for a
capital maintenance model for example)
o However, in practice the sample size of the water industry in England and Wales is small and these
variables are likely to be highly correlated causing multicollinearity issues.
o Hence, we could construct an index for some of them such as quality, or an index for output and area
(e.g., Ofgem). Or to consider just the volume of water or wastewater with a measure of density and the
appropriate measure of capital stock (e.g., K measured by MEA) should be another structure of the
models.
o Another example is the case water treatment (e.g., Water Resources Plus) where the volume of water
treated should be treated as the most convenient output being produced at this stage of the value chain
accompanied with a quality dimension.
Confidential-Draft for discussion
Technological Change (Time Trend) and Quality
37
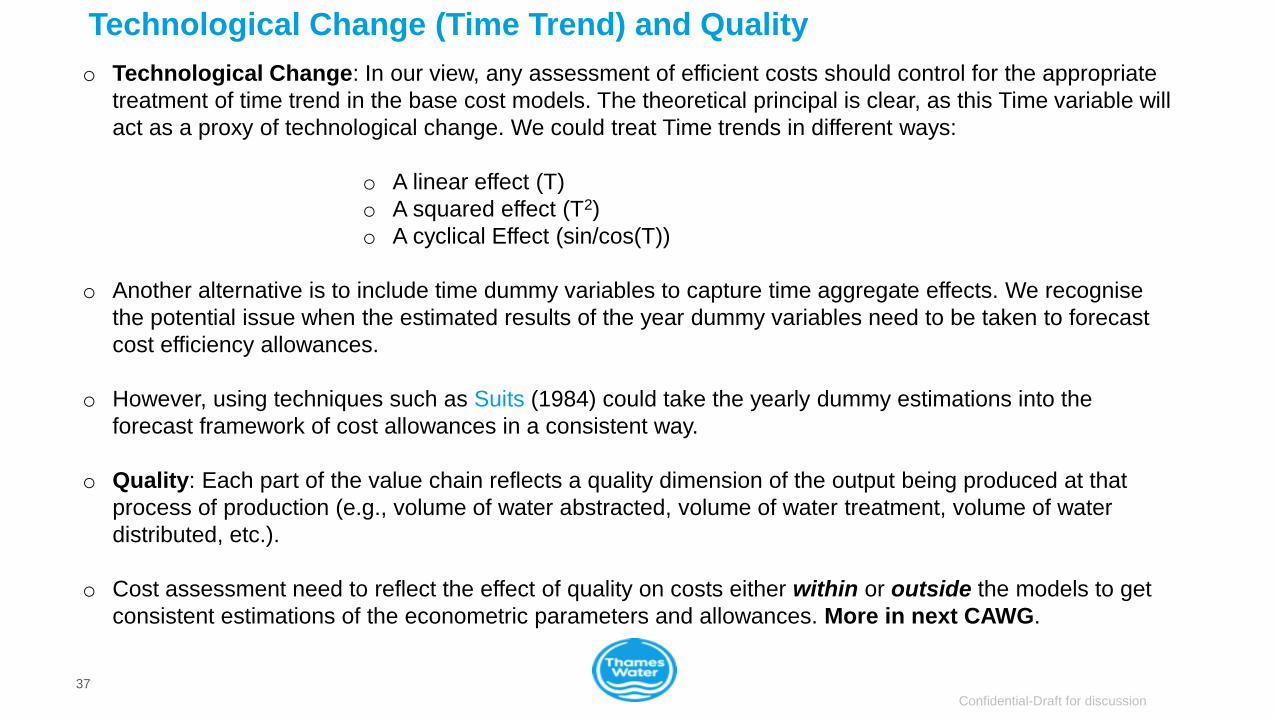
o Technological Change: In our view, any assessment of efficient costs should control for the appropriate
treatment of time trend in the base cost models. The theoretical principal is clear, as this Time variable will
act as a proxy of technological change. We could treat Time trends in different ways:
o A linear effect (T)
o A squared effect (T2)
o A cyclical Effect (sin/cos(T))
o Another alternative is to include time dummy variables to capture time aggregate effects. We recognise
the potential issue when the estimated results of the year dummy variables need to be taken to forecast
cost efficiency allowances.
o However, using techniques such as Suits (1984) could take the yearly dummy estimations into the
forecast framework of cost allowances in a consistent way.
o Quality: Each part of the value chain reflects a quality dimension of the output being produced at that
process of production (e.g., volume of water abstracted, volume of water treatment, volume of water
distributed, etc.).
o Cost assessment need to reflect the effect of quality on costs either within or outside the models to get
consistent estimations of the econometric parameters and allowances. More in next CAWG.
Confidential-Draft for discussion
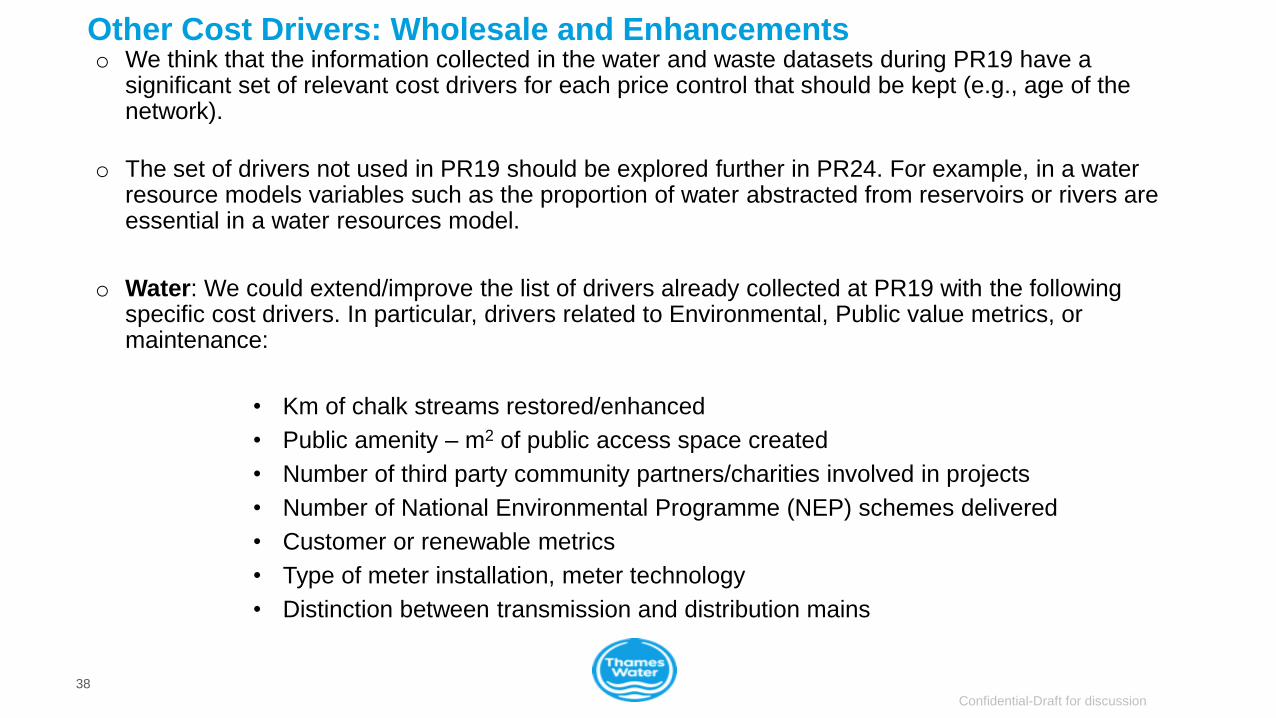
Other Cost Drivers: Wholesale and Enhancementso We think that the information collected in the water and waste datasets during PR19 have a
significant set of relevant cost drivers for each price control that should be kept (e.g., age of the network).
o The set of drivers not used in PR19 should be explored further in PR24. For example, in a water resource models variables such as the proportion of water abstracted from reservoirs or rivers are essential in a water resources model.
o Water: We could extend/improve the list of drivers already collected at PR19 with the following specific cost drivers. In particular, drivers related to Environmental, Public value metrics, or maintenance:
• Km of chalk streams restored/enhanced
• Public amenity – m2 of public access space created
• Number of third party community partners/charities involved in projects
• Number of National Environmental Programme (NEP) schemes delivered
• Customer or renewable metrics
• Type of meter installation, meter technology
• Distinction between transmission and distribution mains
38
Confidential-Draft for discussion
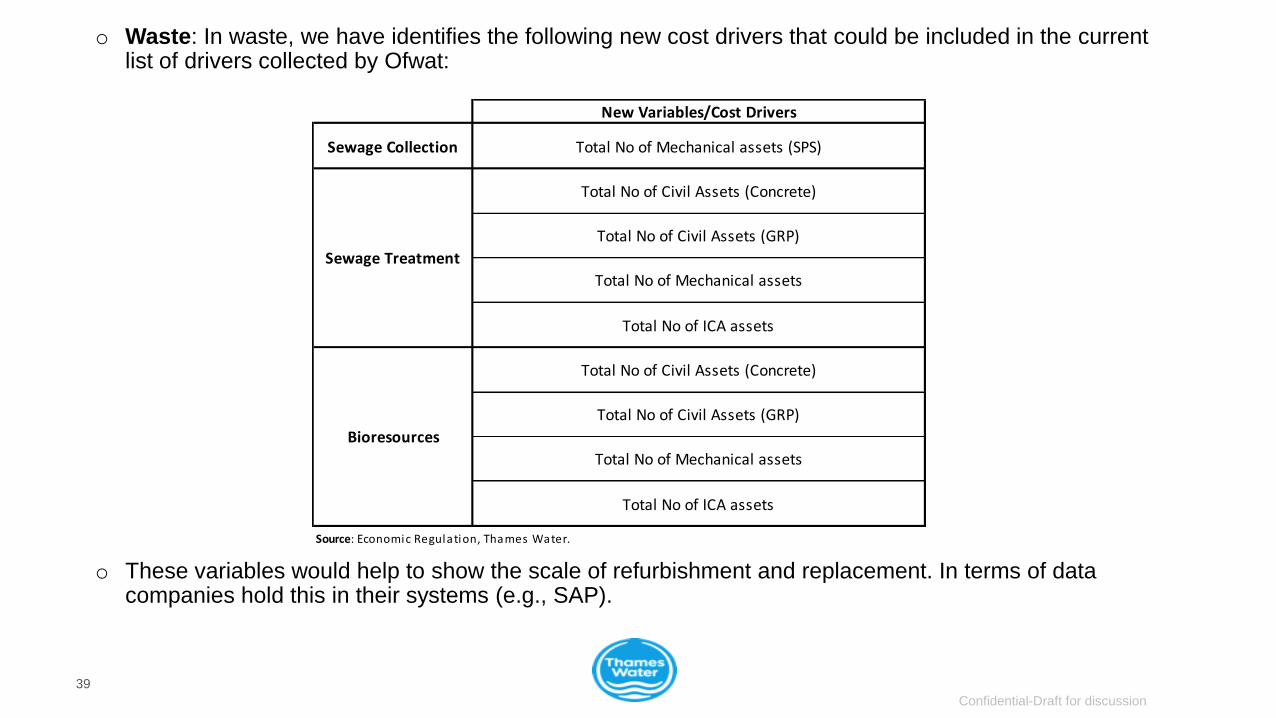
o Waste: In waste, we have identifies the following new cost drivers that could be included in the current list of drivers collected by Ofwat:
o These variables would help to show the scale of refurbishment and replacement. In terms of data companies hold this in their systems (e.g., SAP).
39
New Variables/Cost Drivers
Sewage Collection Total No of Mechanical assets (SPS)
Total No of Civil Assets (Concrete)
Total No of Civil Assets (GRP)
Total No of Mechanical assets
Total No of ICA assets
Total No of Civil Assets (Concrete)
Total No of Civil Assets (GRP)
Total No of Mechanical assets
Total No of ICA assets
Source: Economic Regulation, Thames Water.
Sewage Treatment
Bioresources
Confidential-Draft for discussion
Variables Under Management Control and other Criteria
40
o Management Control (MC): How can we define MC (e.g., objective v subjective; what degree of
MC should we accept)?
• In principle all variables are under MC. In PR19, MC was one of the most common reason Ofwat used to
discard essential cost drivers without any objective definition of MC.
• By doing this we could limited the scope of the models. We can also incur in the wrong dgp which produces
inconsistency in the estimated parameters of the models and could also take us into Type I/II errors (e.g.,
APH v Number of Booster pumping Stations) among other econometric endogeneity issues.
o Other Criteria: In principle, a simplistic approach to the models is always welcome but at the
same time we need to recognise that keeping that approach will not help to resolve the challenges
imposed by the long-term view (e.g., climate change, population growth, ageing of the network,
carbon net zero, capital maintenance, etc.).
o We need to progress and move on from the simplistic approach suggested by CEPA (2011) which
has been the standard approach in the last 10 years in terms of modelling.
o Therefore, some degree of complexity in the models will be required. By complexity we mean, to
implement more advance econometric techniques when applicable (e.g., dynamic panel models,
time series), improvements on the measurement of some drivers such as quality and capital stock,
regional wages and the economic structure of the econometric models.
Confidential-Draft for discussion
References
41
• Bottasso and Conti (2009). “Scale economies, technology and technical change in the water industry: Evidence from the
English water only sector”. Regional Science and Urban Economics, p. 138–147.
• CEPA (2011). Cost Assessment – Use of Panel and Subcompany Data, Ofwat Report, May.
• Destandau and Garcia (2014) “Service quality, scale economies and ownership: an econometric analysis of water supply
costs”. Journal of Regulatory Economics, 46:152–182.
• Faust and Baranzini (2014). “The economic performance of Swiss drinking water utilities”. Journal of Productivity
Analysis, 41: 383-397.
• Garcia and Thomas (2001). “The structure of municipal water supply costs: Application to a panel of French local
communities”. Journal of Productivity Analysis, 16(1), 5–29.
• Schmalensee (1978). “A Note on Economies of Scale and Natural Monopoly in the Distribution of Public Utility Services”.
The Bell Journal of Economics, Vol 9, No. 1.
• Shleifer (1985). “A Theory of Yardstick Competition.” Rand Journal of Economics 16 (3): 319-327.
• Suits (1984). “Dummy Variables: Mechanics V. Interpretation”. Review of Economics and Statistics.
• Torres and Paul (2006). “Driving forces for consolidation or fragmentation of the US water utility industry: A cost function
approach with endogenous output”. Journal of Urban Economics. 59, 104-120.
• Wolak (1994). An Econometric Analysis of the Asymmetric Information, Regulator-Utility Interaction. Annales D’Economie
et de Statistique. N. 34.
Improving life through water | Gwella bywyd drwy ddŵr | 42
Third breakout room questions
1. Do you have any feedback on the cost drivers and explanatory variables included in the PR19 base cost models?
2. Do you think any of the explanatory variables that were tested at PR19 but not included in the final model selection should be reassessed at PR24?
2. What alternative or additional cost drivers should we consider for PR24 (and subsequently collect data on)?
3. Do you have any comments on Thames Water’s cost driver suggestions?

4. Next steps
Improving life through water | Gwella bywyd drwy ddŵr | 44
CAWG additional meeting – residential retail
We would like to have an additional session focusing on residential retail on the afternoon of Thursday 19 August 2021.
Ahead of this, we would welcome your initial thoughts on topics related to this such as:• cost drivers, e.g. those for bad debt;• using external benchmarks to determine efficient costs, e.g. NAVs’ data;• taking account of the impact of Covid-19; and• any other aspects of our methodology, including data and process considerations.
Please send us any thoughts by COP Friday 6 August 2021 to allow us to consider how to reflect this in our discussion. Alternatively, if you would like an initial chat please get in contact with [email protected]
Improving life through water | Gwella bywyd drwy ddŵr | 45
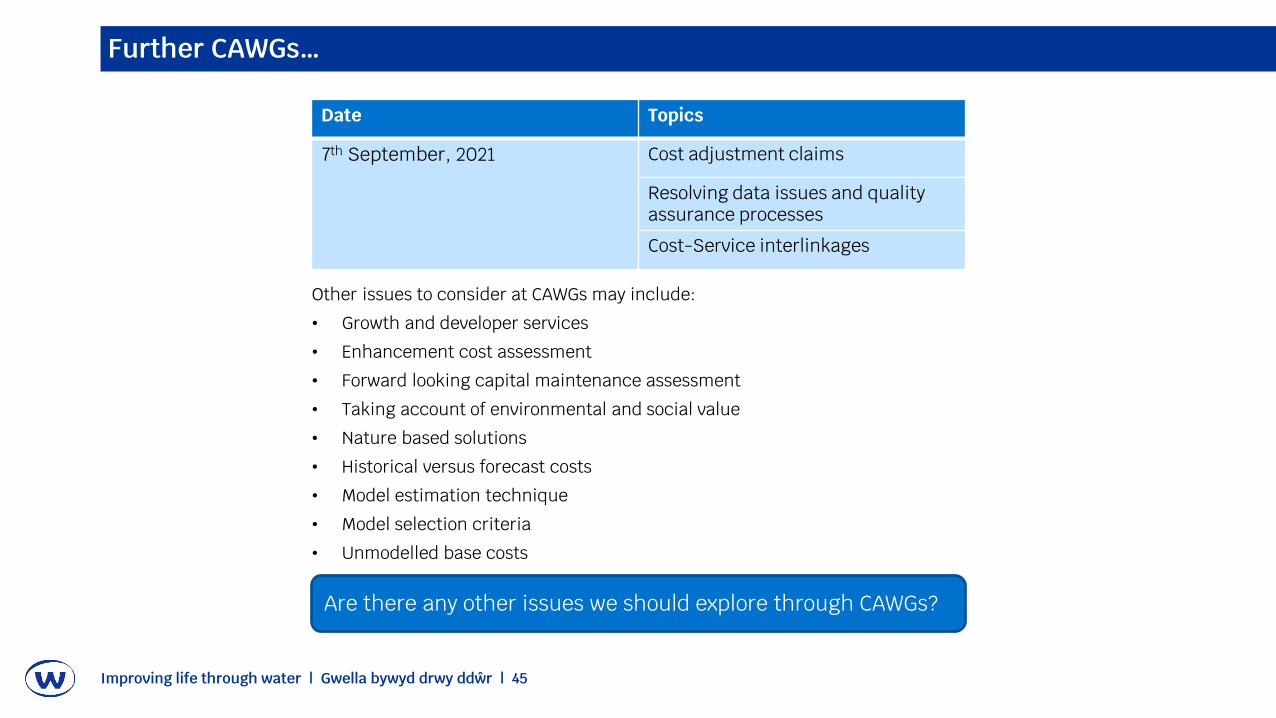
Further CAWGs…
Date Topics
7th September, 2021 Cost adjustment claims
Resolving data issues and quality assurance processes
Cost-Service interlinkages
Other issues to consider at CAWGs may include:
• Growth and developer services
• Enhancement cost assessment
• Forward looking capital maintenance assessment
• Taking account of environmental and social value
• Nature based solutions
• Historical versus forecast costs
• Model estimation technique
• Model selection criteria
• Unmodelled base costs
Are there any other issues we should explore through CAWGs?
Improving life through water | Gwella bywyd drwy ddŵr | 46
Base costs timetable
• CAWGs every 4 to 6 weeks
• Cost assessment strategy and data request (i.e., new cost drivers / explanatory variables) consultation in Nov/Dec 2021.
• As set out in the May PR24 document, we are considering whether it would be possible to publish base cost models early (e.g., Dec 2022).
Do you have any feedback / comments on the proposed timetable?

July 2021
Appendix
Scope of Modelling
Confidential-Draft for discussion
Where is the Link?
Accounting Definition
Ofwat - General View Short-Run Long-Run
Totex = Opex + Capex TC = VC + TFC
Totex = Opex + Capex TC = VC + (FC + SC)
Totex = Opex + (Maintenance + Growth + Other_Enhancements) TC = VC + (FKC + SKC + FNKC + SNKC)
Totex = (Opex + Maintenance) + (Growth + Other_Enhancements)
Totex = Botex + (Growth + Other_Enhancements)
Totex = (Botex + Growth) + Other_Enhancements
Totex = BotexPlus + Other_Enhancements
Source: Economic Regulation, Thames Water Where:
TC=Total Cost FKC=Fixed Capital Costs
VC=Variable Costs SKC=Sunk Capital Costs
TFC=Total Fixed Costs FNKC=Fixed No Capital Costs
FC=Fixed Costs SNKC=Sunk No Capital Costs
SC=Sunk Costs
Economic Definition
TC = (VC + FKC + FNKC) + (SKC + SNKC)
TC = VC + TFC, If Output=0, FC=0
48
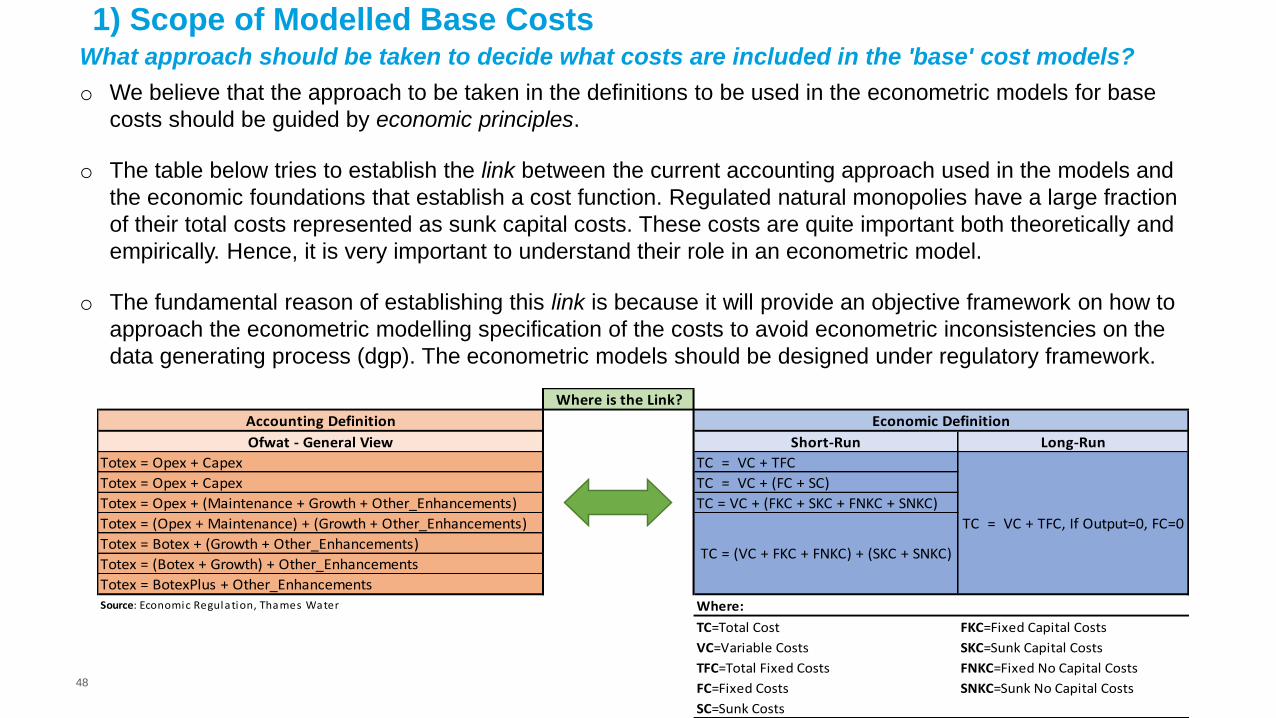
1) Scope of Modelled Base CostsWhat approach should be taken to decide what costs are included in the 'base' cost models?
o We believe that the approach to be taken in the definitions to be used in the econometric models for base
costs should be guided by economic principles.
o The table below tries to establish the link between the current accounting approach used in the models and
the economic foundations that establish a cost function. Regulated natural monopolies have a large fraction
of their total costs represented as sunk capital costs. These costs are quite important both theoretically and
empirically. Hence, it is very important to understand their role in an econometric model.
o The fundamental reason of establishing this link is because it will provide an objective framework on how to
approach the econometric modelling specification of the costs to avoid econometric inconsistencies on the
data generating process (dgp). The econometric models should be designed under regulatory framework.
Confidential-Draft for discussion
49
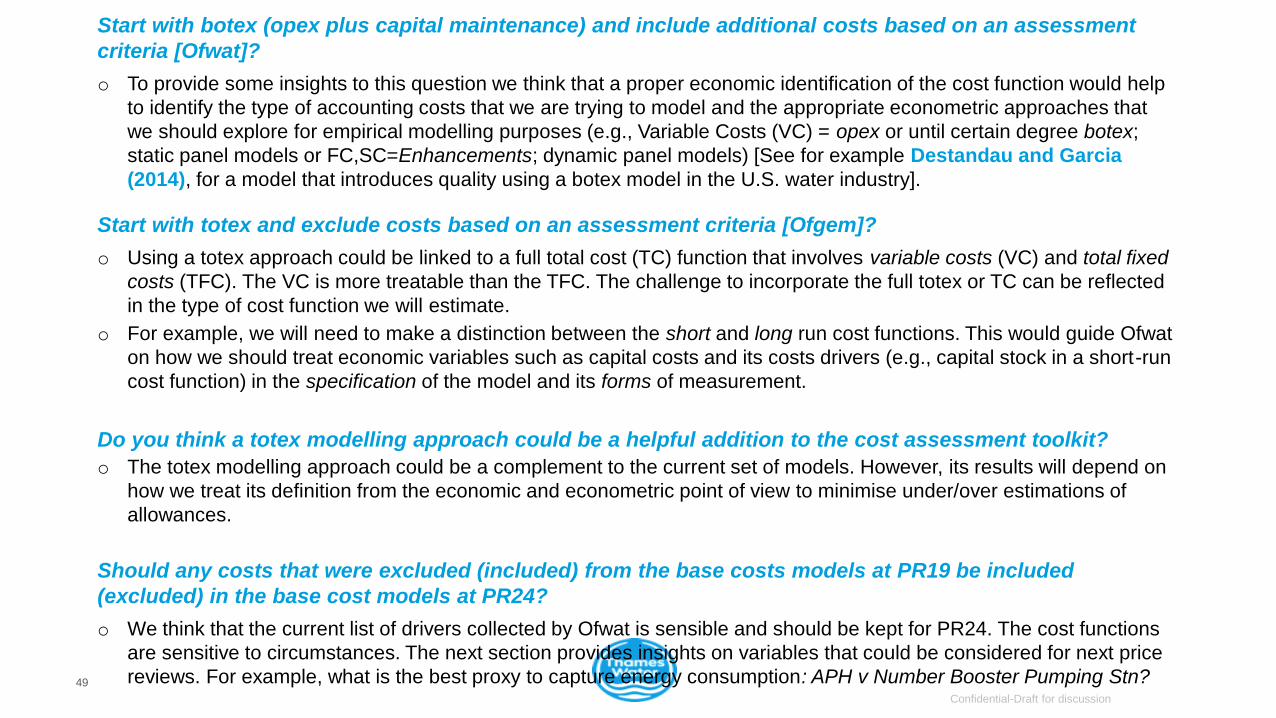
Start with botex (opex plus capital maintenance) and include additional costs based on an assessment
criteria [Ofwat]?
o To provide some insights to this question we think that a proper economic identification of the cost function would help
to identify the type of accounting costs that we are trying to model and the appropriate econometric approaches that
we should explore for empirical modelling purposes (e.g., Variable Costs (VC) = opex or until certain degree botex;
static panel models or FC,SC=Enhancements; dynamic panel models) [See for example Destandau and Garcia
(2014), for a model that introduces quality using a botex model in the U.S. water industry].
Start with totex and exclude costs based on an assessment criteria [Ofgem]?
o Using a totex approach could be linked to a full total cost (TC) function that involves variable costs (VC) and total fixed
costs (TFC). The VC is more treatable than the TFC. The challenge to incorporate the full totex or TC can be reflected
in the type of cost function we will estimate.
o For example, we will need to make a distinction between the short and long run cost functions. This would guide Ofwat
on how we should treat economic variables such as capital costs and its costs drivers (e.g., capital stock in a short-run
cost function) in the specification of the model and its forms of measurement.
Do you think a totex modelling approach could be a helpful addition to the cost assessment toolkit?
o The totex modelling approach could be a complement to the current set of models. However, its results will depend on
how we treat its definition from the economic and econometric point of view to minimise under/over estimations of
allowances.
Should any costs that were excluded (included) from the base costs models at PR19 be included
(excluded) in the base cost models at PR24?
o We think that the current list of drivers collected by Ofwat is sensible and should be kept for PR24. The cost functions
are sensitive to circumstances. The next section provides insights on variables that could be considered for next price
reviews. For example, what is the best proxy to capture energy consumption: APH v Number Booster Pumping Stn?
![[DISCUSSION DRAFT] TH ST CONGRESS SESSION …[Discussion Draft] [DISCUSSION DRAFT] 115TH CONGRESS 1ST SESSION H. R. ll To amend the Foreign Intelligence Surveillance Act of 1978 to](https://img.pdfslide.net/doc/110x75/5ea81ff331363179e019078c/discussion-draft-th-st-congress-session-discussion-draft-discussion-draft.jpg)
![[DISCUSSION DRAFT] TH ST CONGRESS SESSION H. R. ll · [Discussion Draft] [Discussion Draft] [DISCUSSION DRAFT] 114TH CONGRESS 1ST SESSION H. R. ll To provide a bipartisan budget agreement,](https://img.pdfslide.net/doc/110x75/5c77e72409d3f229578c54ab/discussion-draft-th-st-congress-session-h-r-ll-discussion-draft-discussion.jpg)


![[DISCUSSION DRAFT] TH D CONGRESS SESSION H. R. ll › wp-content › ... · [Discussion Draft] [DISCUSSION DRAFT] 116TH CONGRESS 2D SESSION H. R. ll To establish a Pandemic Risk Reinsurance](https://img.pdfslide.net/doc/110x75/5f0b874f7e708231d430f67b/discussion-draft-th-d-congress-session-h-r-ll-a-wp-content-a-discussion.jpg)
![[DISCUSSION DRAFT] TH D CONGRESS SESSION …docs.house.gov/meetings/IF/IF03/20160301/104585/BILLS-114pih-To... · [Discussion Draft] [DISCUSSION DRAFT] 114TH CONGRESS 2D SESSION H](https://img.pdfslide.net/doc/110x75/5b83723e7f8b9a7d3a8cd6a6/discussion-draft-th-d-congress-session-docshousegovmeetingsifif0320160301104585bills-114pih-to.jpg)
![[DISCUSSION DRAFT] TH D CONGRESS SESSION H. R. ll · 2020-05-11 · [Discussion Draft] [DISCUSSION DRAFT] 116TH CONGRESS ... resume pricing of such in-10 surance, and build capacity](https://img.pdfslide.net/doc/110x75/60252a8b561d7044d15e2baf/discussion-draft-th-d-congress-session-h-r-ll-2020-05-11-discussion-draft.jpg)