Embed Size (px)
DESCRIPTION
traceability, measurement, uncertainty, validation, chemistry, philip taylor, nineta majcen
Citation preview

PR
AC
TIC
AL
EX
AM
PL
ES
ON
TR
AC
EA
BIL
ITY
, ME
AS
UR
EM
EN
T U
NC
ER
TA
INT
Y A
ND
VA
LID
AT
ION
IN C
HE
MIS
TR
Y
ISBN 978-92-79-12021-3
Practical Examples on
Traceability,Measurement Uncertainty and Validation in ChemistryVolume 1
Edited by
Nineta Majcen, Philip Taylor
Authors:Ljudmila Benedik
Steluta Duta
Koit Herodes
Monika Inkret
Veselin Kmetov
Allan Künnapas
Ivo Leito
Bertil Magnusson
Urška Repinc
Philip Taylor
Emilia Vassileva
The mission of the JRC is to provide customer-driven scientific and technical support for the conception, development, implementation and monitoring of EU policies. As a service of the European Commission, the JRC functions as a reference centre of science and technology for the Union. Close to the policy-making process, it serves the common interest of the Member States, while being independent of special interests, whether private or national.
Producing reliable measurements in analytical chemistry can be rather demanding.Some would say an uphill struggle. Comparable to mountain walking. Hard work, but then the satisfaction of reaching the top is absolutely great. And so is the view.
As with all human endeavour, it always helps to know what you are doing, thus theoretical knowledge forms the basis. Likewise in analytical chemistry. Understanding the measurement science, the metrology, is important. That is why in the international standard ISO/IEC-17025 “General requirements for the competence of testing and calibration laboratories” section five deals with technical requirements such as traceability, validation and uncertainty. The European Life Long Learning Programme TrainMiC®, created in 2001, produced material for teaching the theory.As excellence in theory does not necessarily mean mastering practice, a need for developing practical examples later arose. This is what you can find in this book, which is intended as a first of a series of such compilations.
Inspired by the NORDTEST “Trollbook”, we also decided to have a mascot. For each volume, a different one, which would be taken from the treasure of European fairy tales and legends.
For this first volume, the fairy tale character of Kekec (pronounced as Kekets) was chosen. Kekec is a brave, clever and cheerful shepherd boy who lives in Slovenian mountains. He always brings good to the people that surround him and he helps those that are in trouble. And in that sense, that is what is the intention of this book.
We hope it succeeds in doing so.
Nineta MajcenPhilip Taylor
EUR22791/2 EN - 2010

Practical Examples on
Traceability,
Measurement Uncertainty
and Validation
in Chemistry
Volume 1
Second edition
Edited by
Nineta Majcen, Philip Taylor
Authors:Ljudmila Benedik
Steluta Duta
Koit Herodes
Monika Inkret
Veselin Kmetov
Allan Künnapas
Ivo Leito
Bertil Magnusson
Urška Repinc
Philip Taylor
Emilia Vassileva

The mission of the JRC-IRMM is to promote a common and reliable European measurement system in support of EU policies.
European CommissionJoint Research CentreInstitute for Reference Materials and Measurements
Contact informationAddress: Retieseweg 111, B-2440 Geel, BelgiumE-mail: [email protected].: +32 (0)14 571 605Fax: +32 (0)14 571 863
http://irmm.jrc.ec.europa.eu/http://www.jrc.ec.europa.eu/
Legal NoticeNeither the European Commission nor any person acting on behalf of the Commission is responsible for the use which might be made of this publication.
Freephone number (*):00 800 6 7 8 9 10 11
(*) Certain mobile telephone operators do not allow access to 00 800 numbers or these calls may be billed.
More information on the European Union is available on the Internet (http://europa.eu).
Cataloguing data can be found at the end of this publication.
JRC 59026
EUR 22791/2 ENISBN 978-92-79-12021-3ISSN 1018-5593doi: 10.2787/10402
© European Union, 2010
Reproduction is authorised provided the source is acknowledged
Printed in
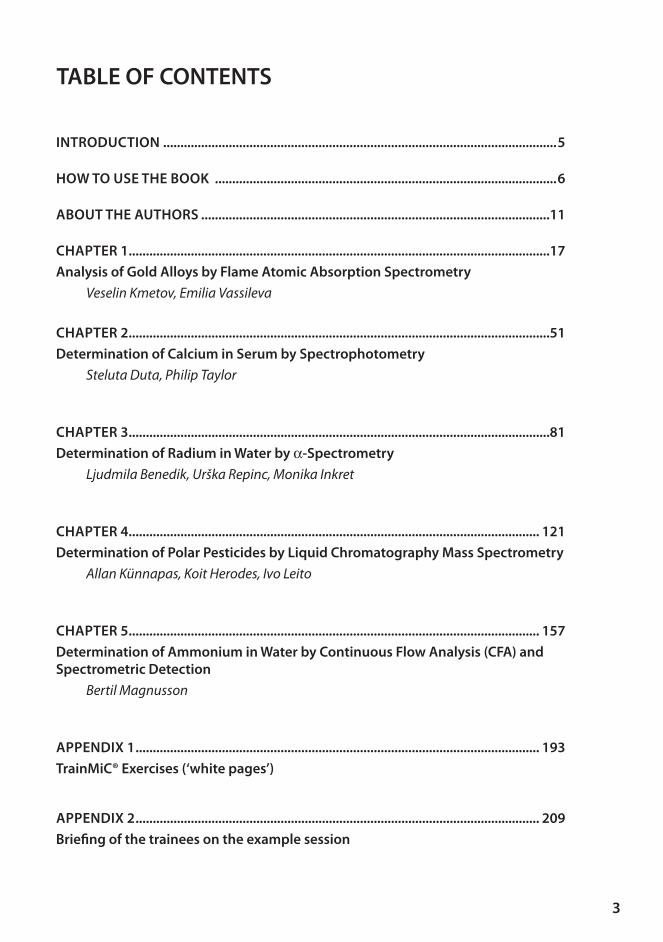
3
INTRODUCTION ..................................................................................................................5
HOW TO USE THE BOOK ...................................................................................................6
ABOUT THE AUTHORS .....................................................................................................11
CHAPTER 1 ..........................................................................................................................17
Analysis of Gold Alloys by Flame Atomic Absorption Spectrometry
Veselin Kmetov, Emilia Vassileva
CHAPTER 2 ..........................................................................................................................51
Determination of Calcium in Serum by Spectrophotometry
Steluta Duta, Philip Taylor
CHAPTER 3 ..........................................................................................................................81
Determination of Radium in Water by α-Spectrometry
Ljudmila Benedik, Urška Repinc, Monika Inkret
CHAPTER 4 ....................................................................................................................... 121
Determination of Polar Pesticides by Liquid Chromatography Mass Spectrometry
Allan Künnapas, Koit Herodes, Ivo Leito
CHAPTER 5 ....................................................................................................................... 157
Determination of Ammonium in Water by Continuous Flow Analysis (CFA) and Spectrometric Detection
Bertil Magnusson
APPENDIX 1 ..................................................................................................................... 193
TrainMiC® Exercises (‘white pages’)
APPENDIX 2 ..................................................................................................................... 209
Briefing of the trainees on the example session
TABLE OF CONTENTS

4
Practical examples on traceability, measurement uncertainty and validation in chemistry
Abbreviations
CRM C
RM R
QC Q
PT P
ILC I

5
If you will tell it to me, I will forgetIf you will show it to me, I will forget
If you involve me, I will remember.
Xun ZiChinese philosopher
310-237 BC
C
ITI I C I
T
T I I CR
P
IT
T T M C® TI R M M
C R CR
T M C®T M C®
T M C® LL L T M C®
Introduction

6
T M C®T M C®
T T M C®T M C®
T M C®
How does a standardised TrainMiC® example look like?
T M C®
exercises TM
T
T
‘yellow pages’ T M C®
T ‘white pages’
How to use the Book

7
How to use the Book
Traceability
Validation
Measurementuncertainty Traceability
Validation
Measurementuncertainty
Figure 1. Harmonised TrainMiC® example
T ‘green pages’I
‘blue page’I
What is a recommended approach of conducting a TrainMiC®
example session?
T T M C® T M C®T M C®
8
Practical examples on traceability, measurement uncertainty and validation in chemistry
I T M C® T M C®
MM
M
T
nominate a rapporteur
IT
T M C®
About the structure of this handbook
I T M C®
P P
T
Nineta Majcen and Philip Taylor
AcknowledgmentT M I R

9
How to use the Book
Figu
re 2
. A p
roce
ss o
f con
duct
ing
a co
mpl
eteT
rain
MiC
® e
xam
ple


11
Introduction
Philip Taylor
P P T PR
C I RM M R C
TC C
C CCQMT M C®
T
T M C® T M C®M
Nineta Majcen
M LP
I
MT M C® T M C®MT M C®
M R
Chapter 1
Veselin Kmetov
PC C
C P
About the Authors

12
Practical examples on traceability, measurement uncertainty and validation in chemistry
ICP ICP MT
IC Q
T M C®T M C®
Emilia Vassileva
I L MP
ICP M
II R M M
I MQ QC
T M C® T M C® MT M C®
Chapter 2
Steluta Duta
I M R LM R I M RMLR M P C MP I RI M RML
I IRT ICP M
CRMT M C® M T M C®
R

About the Authors
13
Philip Taylor
Chapter 3
Ljudmila Benedik
LC I
L P CC T L
I R M MR C C
IM P I MP
IT M C®
Urška Repinc
RI L
R
I P
M C
I I TR C C
14
Practical examples on traceability, measurement uncertainty and validation in chemistry
Monika Inkret
M I M I RL P M
I R MM R C C T
ML
L
M C C C R
C
T M C®
Chapter 4
Allan Künnapas
M T I MQ C R LC M
C L T P PL C M
TLC M
Q C R
LC LC M I M
Koit Herodes
P T
T

About the Authors
15
T TLC M
M
LC MT T C
Ivo Leito
P I L P T
T
IR C M LC M M
RI I
P MP M
M C M
M C
Chapter 5
Bertil Magnusson
MP C
LR R ICP
I P T R IM C
I Q QCI M
L I

16
Practical examples on traceability, measurement uncertainty and validation in chemistry
Q C LI ICP M RT M C®
T M C®

Chapter 1
Analysis of Gold Alloys by Flame Atomic Absorption Spectrometry
Veselin Kmetov, Emilia Vassileva
TrainMiC example summary form (‘blue page’) A short introduction to the analytical procedure (‘slides’) All input needed to do the three exercises (‘yellow pages’) The solved exercises (‘green pages’)
17
18
Practical examples on traceability, measurement uncertainty and validation in chemistry
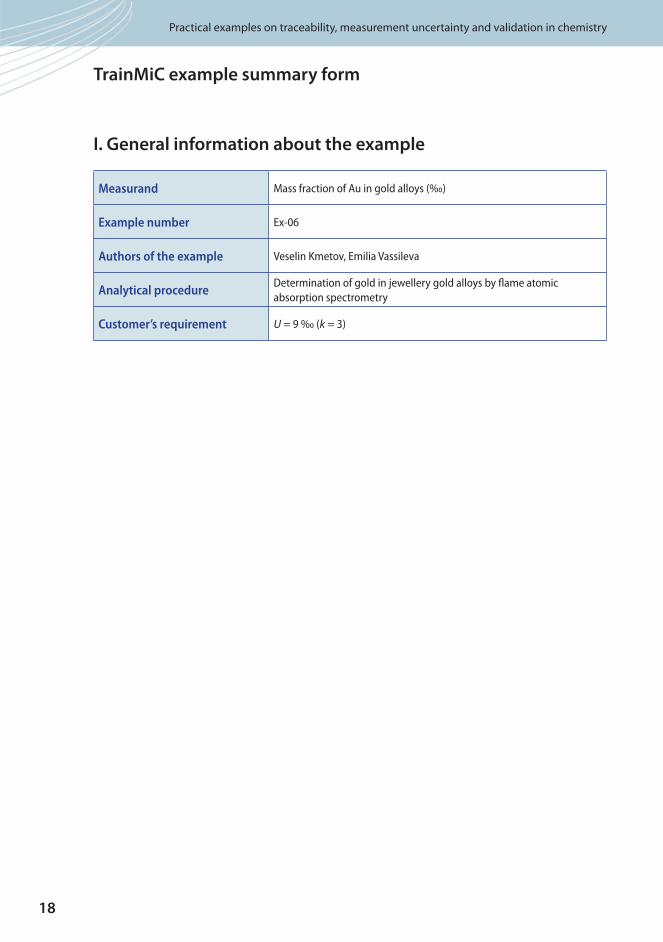
TrainMiC example summary form
I. General information about the example
Measurand Mass fraction of Au in gold alloys (‰)
Example number Ex-06
Authors of the example Veselin Kmetov, Emilia Vassileva
Analytical procedureDetermination of gold in jewellery gold alloys by flame atomic
absorption spectrometry
Customer’s requirement U = 9 ‰ (k = 3)

19
Analysis of Gold Alloys by Flame Atomic Absorption Spectrometry
II. Attached files
File number, type
and nameContent of the file
File is
attached Remark
Yes No
1 -
I
Ex-06-1-I-Au-
alloys-FAAS-2006-
Ver1.ppt
About the analytical procedure: short introductionGiven by the
lecturer
2 -
Yel
low Ex-06-2-Y-Au-
alloys-FAAS-2006-
Ver1.doc
PART I Description of the analytical procedure
Each
participant
receives own
copy and
may keep it
PART II
The customer’s requirements
concerning the quality of the
measurement result
PART III
Validation of the measurement
procedure – relevant equations and
measurement data
PART IV
Measurement uncertainty of the result
– relevant equations and measurement
data
3 -
Gre
en
EX-06-3-G-Au-
alloys-FAAS-2006-
Ver1.doc
PART IEstablishing traceability in analytical
chemistry
PART IISingle laboratory validation of
measurement procedures
PART III
Building an uncertainty budget
Addendum 1: By spreadsheet approach
Addendum 2: By dedicated software
III. History of the example
Version Uploaded on the webhotel Short description of the change
0 April 2007 -
1
2
20
Practical examples on traceability, measurement uncertainty and validation in chemistryPractical examples on traceability, measurement uncertainty and validation in chemistry
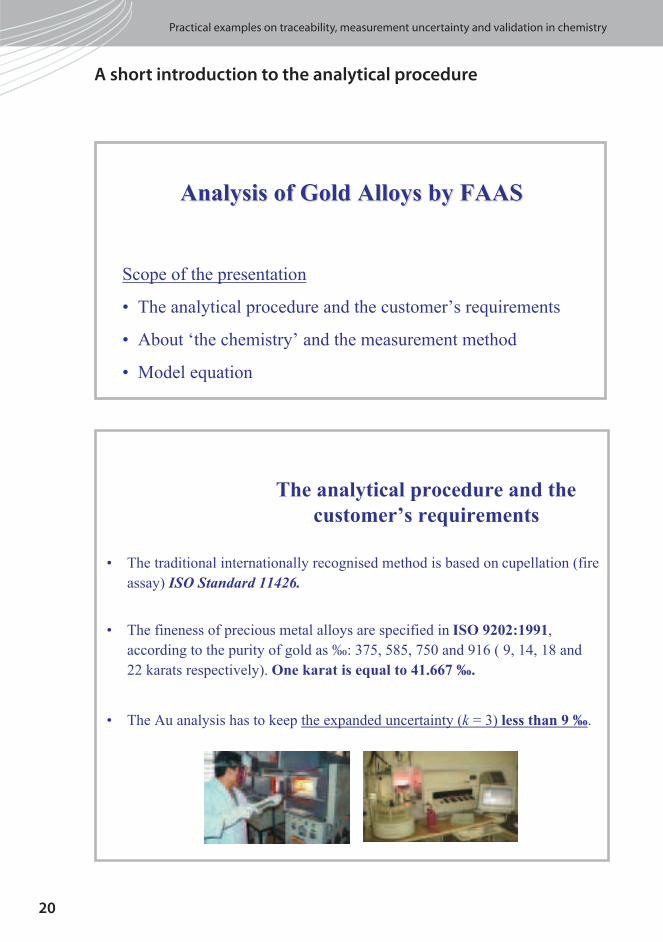
A short introduction to the analytical procedure

Analysis of Gold Alloys by Flame Atomic Absorption Spectrometry
21
Analysis of Gold Alloys by Flame Atomic Absorption Spectrometry
×

22
Practical examples on traceability, measurement uncertainty and validation in chemistryPractical examples on traceability, measurement uncertainty and validation in chemistry

Analysis of Gold Alloys by Flame Atomic Absorption Spectrometry
23
Analysis of Gold Alloys by Flame Atomic Absorption Spectrometry

24
Practical examples on traceability, measurement uncertainty and validation in chemistry
Analytical procedure
Determination of gold in jewellery gold alloys by Flame Atomic
Absorption Spectrometry
PART I ...................................................................................................................................25
Description of the analytical procedure
PART II .................................................................................................................................33
The customer’s requirements concerning the quality of the measurement result
PART III ................................................................................................................................34
Validation of the measurement procedure – relevant equations and measurement data
PART IV ................................................................................................................................35
Measurement uncertainty of the result – relevant equations and measurement data
All input needed to do the three exercises ‘yellow pages’

25
Analysis of Gold Alloys by Flame Atomic Absorption Spectrometry
Task description
TT M
TISO 9202:1991 m m
I
I
T
T than k
Tk
TI . R
1. ISO/TC 174. rev.N71. Gouda 1992 Determination of gold in gold jewelry allows – ICP solution spectrometric method using yttrium as internal standard
2. CNR-PRO Art Project (1998) Tecniche spettrometriche alternative alla copellazione per il saggio delle leghe dioro
Scope
T aqua regiaT
TI
T
PART I. Description of the analytical procedure

26
Practical examples on traceability, measurement uncertainty and validation in chemistry
−
Figure 3. Flow chart of the analytical procedure for determination of gold in gold alloys

27
Analysis of Gold Alloys by Flame Atomic Absorption Spectrometry
Reagents
M − aqua regia CP M P P
Apparatus
Id
P − L d −L
L d LC
L d LC
P I
Description of the analytical procedure
Sample preparation procedure
− T
L L aqua regia
TC C C
L C
TC
P
Calibration
L aqua regia C T

28
Practical examples on traceability, measurement uncertainty and validation in chemistry
T
TT
Atomic absorption measurement
I I
I L I−
R
I T
T

29
Analysis of Gold Alloys by Flame Atomic Absorption Spectrometry
Table 1. Instrumental parameters for ASDI-FAAS determination of Au
FAAS parameters Values ASDI parameters
Au spectral line [nm]
Au spectral slit [nm]
242.8
0.7
Ql-
aspiration rate 6.4 mL min-1 checked by BDW
Injection time 5 s; Injection volume ≈ 0.530 μL
Au hollow cathode lamp current [mA] 10 Washing time 10 s; Total replicate time 15 s
Air/C2H
2 units
Observation high [mm]
50/18
6
Smoothing Savitzky-Golay 24 points
Ensemble summation N signal profiles
Working range μg g-1
Deuterium BG corrector
37−43
OFF
Pseudo plateau 3 s
Sampling mode (St1 _ sample _ St
2 ) × N
Readings – points [s] 50 Total time for one set 66 s

30
Practical examples on traceability, measurement uncertainty and validation in chemistry
Calculations
Concentration of initial standard solution made up from pure gold
Cm Au
GAupureAu purity
_ ._ _
_9100
99 9410=
××
C Au_ 999.9 μ
m pureAu_
G CAu purity−
C
Concentration of calibration standard solutions
C CG
GSt Au__1 = ×_999.9_0.37
100 C C
G
GSt Au__2 = ×_999.9_0.43
100
C St_ 1
C St_ 2
CC St C St
CAu _999.9C
G_0.37
G_0.43
MC St C St
G_100M
C

31
Analysis of Gold Alloys by Flame Atomic Absorption Spectrometry
Bracketing calibration
CxC A A C A A
A Ast St X St x St
St St
=− + −
−− − − −
− −
1 2 2 1
2 1
( _ ) ( )_
Cx C
C St− 1
C
C St− 2
C
A St− 1C
A St_ 2C
A X_
Calculation of Au mass fraction (W_‰) in analysed sample
WV
m R
G
GCvials
Px
__
_ . _ ,
= × × ×1
1000
150
0 1
12
0 4
W
V_ 50
L
m_ .0 1
Gvials _12
GP _ .0 4V
R
Combined model equation for calculation of Au content (‰)
W V
m
G
G
C
G
Gvials
P
P_
_ _.
_
.
Au_999.9
_10
_= ×⎛⎝⎜
⎞⎠⎟
× ×1
100050
0 1
12
0 4
00.37 _0.43( _ ) ( )_A A G A A
A A RSt X P X St
St St
2 1
2 1
1− + −( )−
×− −
− −

32
Practical examples on traceability, measurement uncertainty and validation in chemistry
Calculation of signal standard uncertainty estimated as standard deviation
uu
NA
A one set_
_ __=
u A_N
u A one set_ __
N

33
Analysis of Gold Alloys by Flame Atomic Absorption Spectrometry
k
PART II. The customer’s requirements concerning quality of the
measurement result
34
Practical examples on traceability, measurement uncertainty and validation in chemistry
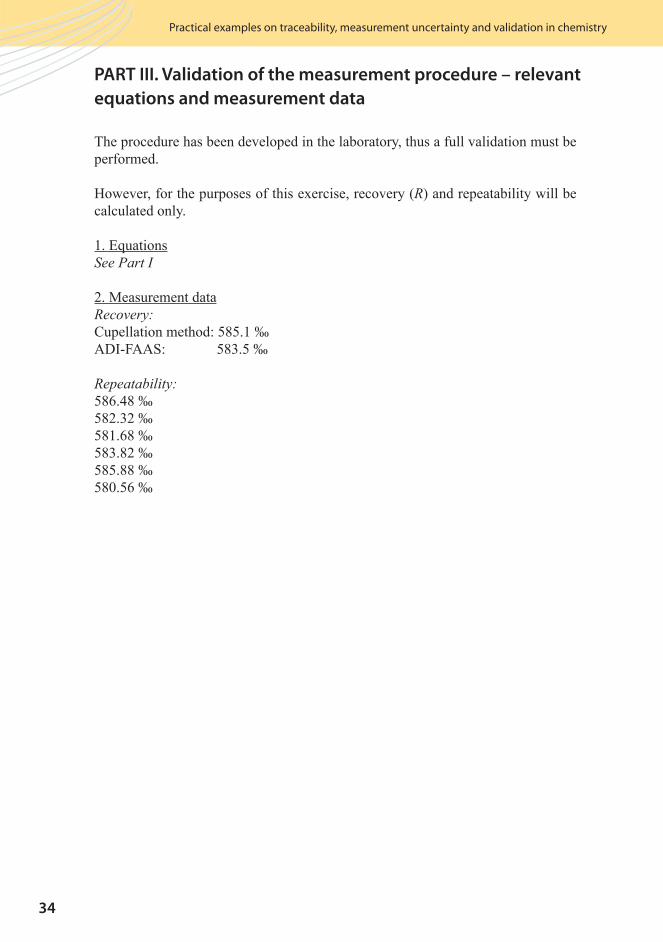
T
R
See Part I
MRecovery:CI
Repeatability:
PART III. Validation of the measurement procedure – relevant
equations and measurement data

35
Analysis of Gold Alloys by Flame Atomic Absorption Spectrometry
C k
Input
quantityValue Unit
Standard
uncertaintyRemark
V_ 50 50 mL 0.0379 Volume of analysed solution
V_100 100 mL 0.0697 Volume of stock standard solution
m_0.1
0.1001 g 0.0002 Mass of analysed alloy sample
Gvials _12 12.0030 g 0.0008 Mass of sample solution prepared in vials
GP_ .0 4 0.4015 g 0.0009Mass of Au sample solution taken from V
_50
flask
m pureAu_ 0.1004 g 0.0002 Mass weighed of pure gold
Au purity_ 99.99 % 0.0058 The purity of gold stated in the certificate
Gp _0.37
Gp _0.43
0.3701
0.4302g 0.0006
Masses of the stock Au standard solution
transferred for the preparation of calibration
solutions C_St1
and C_St2
G_10 10.0321 g 0.0008 Mass of calibration standard solutions
A St− 1
A St_ 2
0.5203
0.6041AU
0.0010
0.0011
Absorbance measured for calibration
standard solutions
AX 0.5488 AU 0.0011Absorbance measured for the analysed
sample solution
R 1.002 - 0.0025 Recovery
PART IV. Measurement uncertainty of the result – relevant
equations and measurement data

36
Practical examples on traceability, measurement uncertainty and validation in chemistry
TrainMiC Exercises
Analytical procedure
Determination of gold in jewellery gold alloys by flame atomic
absorption spectrometry
EXERCISE 1:
Establishing traceability in analytical chemistry
EXERCISE 2:
Single laboratory validation of measurement procedures
Part I: General issues
Part II: Parameters to be validated
Part III: Some calculations and conclusions
EXERCISE 3:
Building an uncertainty budget
Addendum I: By spreadsheet approach
Addendum II: By dedicated software
The solved exercises ‘green pages’

37
Analysis of Gold Alloys by Flame Atomic Absorption Spectrometry
1. Specifying the analyte and measurand
Analyte Gold
Measurand Gold mass fraction in jewellery alloys after aqua regia dissolution
Units ‰ (g/1000 g)
2. Choosing a suitable measurement procedure with associated model equation
Measurement
procedure
Type of calibration standard curve standard addition internal standard
Model equation
1. Standard solutions
1.1. Stock standard solution - prepared from pure gold
Cm Au
GAupureAu purity
_999.9100
=×
×− _
_104
1.2. Calibration standard solutions
C CG
GSt Aup__
1100
= ×_999.9_0.37
C C
G
GSt Aup__
2100
= ×_999.9_0.43
2. Bracketing calibration
CxC A A C A A
A ASt St X St x St
St St
=− + −
−− − − −
− −
1 2 2 1
2 1
( ) ( )_ _
3. Calculation of Au content (W_‰) in analysed sample
WV
m
G
GC
Rvials
Px_
__
_ . _ .
0 = × × ×1
1000
150
0 1
12
0 4
4. Calculation of signal standard uncertainty u
u
NA
A one set_
_ __=
ESTABLISHING TRACEABILITY IN ANALYTICAL CHEMISTRY
EXERCISE

38
Practical examples on traceability, measurement uncertainty and validation in chemistry
5. Calculation of recovery
RW
Wobserved
ref
=
6. Combined model equation for calculation of Au mass fraction (‰)
WV
m
G
G
m Auvials
P
pureAu purity_
_ .
_
_ .
= ×⎛
⎝⎜
⎞
⎠⎟ ×
×−1
100050
0 1
12
0 4 GG V_100 100×× ×
_104
G A A G A A
AP St X P X St_0.37 _0.43×
− + −( )− −
−
( _ ) ( )_ 2 1
SSt StA R2 1
1
−×
−
V _50 L
V _100 L
m_ .0 1
Gvials _12
GP _ .0 4 V
m pureAu_
Au purity_
G or Gp p_0.37 _0.43
G_100
A St− 1 A St_ 2
AX
R
3. List the input quantities according to their influence on the uncertainty of the result of the measurement (first the most important ones). At this point, your judgement should be based on your previous experience only.
1 Recovery – 28.5 % to the expanded uncertainty
2 Absorption of analysed gold sample − contributing 19.8 % to the expanded uncertainty
3 Mass of analysed gold sample − contributing 11.8 % to the expanded uncertainty

39
Analysis of Gold Alloys by Flame Atomic Absorption Spectrometry
4Mass of stock solution taken for the preparation of first standard solution − contributing 12.1 % to the
expanded uncertainty
5 Volume of the analysed solution – contributing 3.4 % to the expanded uncertainty
4. List the reference standards needed and give also the information regarding traceability of the reference value
For the analyte
1 Name/Chemical Formula/Producer:Pure Gold − certified by Non-Ferrous Metallurgical
Plant Plovdiv − Bulgaria
2 Name/Chemical Formula/Producer:
For the other input quantities
1Quantity/Equipment/Calibration:
e.g. mass/balance/calibrated by NMI, U = xx
(k = 2), see also data yellow sheet
Balance – calibrated by NMI
2 Quantity/Equipment/Calibration: Volumetric flask − class A quality
3 Quantity/Equipment/Calibration:Absorbance − relative measurement. Not direct part of
the traceability chain.
5. Estimating uncertainty associated with the measurement
Are all important parameters included in the
measurement equation?Yes No
Other important parameters are: Within-lab reproducibility
6. How would you prove traceability of your result?
1 Comparing the results with independent method (cupellation)

40
Practical examples on traceability, measurement uncertainty and validation in chemistry
7. Any other comments, questions…

41
Analysis of Gold Alloys by Flame Atomic Absorption Spectrometry
PART I: GENERAL ISSUES
1. Specify the measurement procedure, analyte, measurand and units
The measurement procedure Analysis of gold alloys by AAS
Analyte Gold
The measurandGold in jewellery alloys containing gold 14 ± 0.5 carats after aqua
regia dissolution
Unit ‰
2. Specify the Scope
Matrix Gold in 5 % NH4Cl
Measuring range 37-43 μg g-1
3. Requirement on the measurement procedure
Intended use of the results: Quality of products from precious metals alloys
Mark the customer’s requirements
and give their values
LOD
LOQ
Repeatability
Within-lab reproducibility
Measurement uncertainty 9 ‰
Trueness
Other-state
4. Origin of the measurement procedure
VALIDATION
New in-house method Full
Modified validated method Partial
Official standard method Confirmation/Verification
SINGLE LABORATORY VALIDATION
OF MEASUREMENT PROCEDURES
EXERCISE

42
Practical examples on traceability, measurement uncertainty and validation in chemistry
PART II: PARAMETERS TO BE VALIDATED
5. Selectivity/Interference/Recovery
Where yes, please give further information e.g. which CRM, reference method
CRM/RM: analysis of available CRM or RM
Further information:
Spike of pure substance
Pure gold 99.99 % certified from non-ferrous metallurgical plant Plovdiv, Bulgaria
Compare with a reference method
Comparison with cupellation method
Selectivity, interferences
Test with different matrices
Other – please specify
Test for recovery with RM jewellery gold alloy marked 585
6. Measuring range
Linearity
Upper limit
LOD
LOQ
7. Spread – precision
Repeatability
Reproducibility (within lab)
Reproducibility (between lab)
8. Robustness
Variation of parameters

43
Analysis of Gold Alloys by Flame Atomic Absorption Spectrometry
9. Quality control
Control charts
Participation in PT schemes
10. Other parameters to be tested
Working range and testing of homogeneity of variances
Recovery
Residual standard deviation
Standard deviation of the method
Coefficient of variation of the method

44
Practical examples on traceability, measurement uncertainty and validation in chemistry
11. Calculation of parameters requested by the customer
Parameters requested to be
validatedCalculations
LOD
LOQ
Repeatability 2.4 ‰
Within-lab reproducibilty
Trueness
Measurement uncertainty 8.3 ‰ (k = 3)
Other - please state
Recovery1.0002 ± 0.0025
12. Does the analytical procedure fulfil the requirement(s) for the intended use?
ParameterValue requested by the
customer(the same as stated in question 3)
Value obtained
during
validation
The requirement
is fulfilled
Yes/No
LOD
LOQ
Repeatability
Within-lab
reproducibility
Trueness
Measurement
uncertainty9 ‰ (k = 3) 8.3 ‰ (k = 3) yes
Other
The analytical procedure is fit for the intended use:
Yes No
For measurement uncertainty and traceability refer to the corresponding report-sheets
PART III: SOME CALCULATIONS AND CONCLUSIONS

45
Analysis of Gold Alloys by Flame Atomic Absorption Spectrometry
BUILDING AN UNCERTAINTY BUDGET
EXERCISE
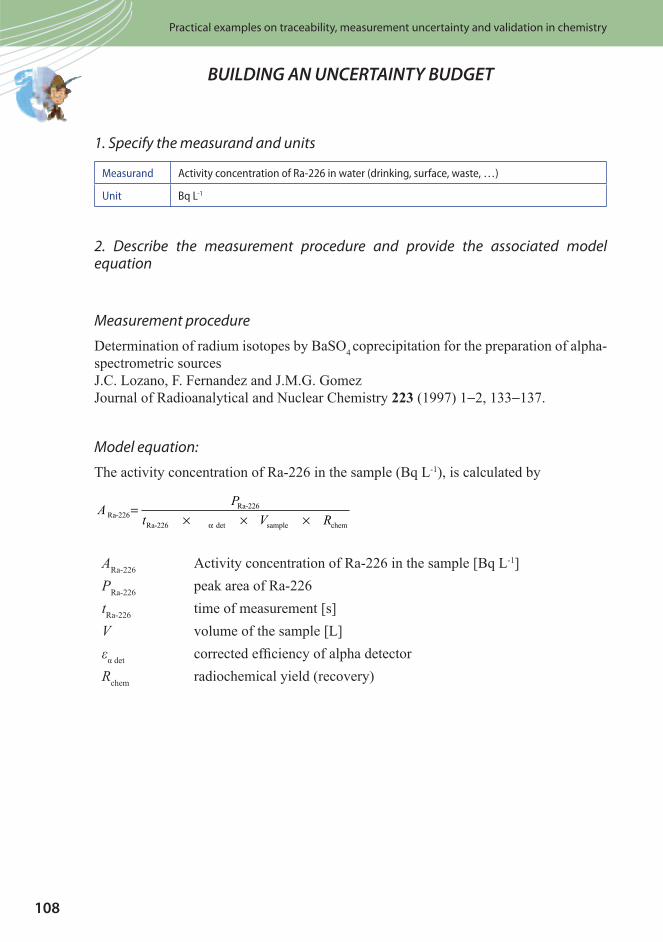
1. Specify the measurand and units
Measurand Gold mass fraction in jewellery alloys after aqua regia dissolution
Unit ‰ (g/1000 g)
2. Describe the measurement procedure and provide the associated model equation
Measurement procedure:
− T
L L aqua regia
TC C C
L C
T LC
P
Model equation:
1. Concentration of initial standard solution made up from pure gold
Cm Au
GAupureAu purity
9100
99 9410. _
=×
×
C CG
GSt Au__2 = ×_999.9_0.43
100
2. Concentration of calibration standard solutions
C CG
GSt Au__1 = ×_999.9_0.37
100
3. Bracketing calibration
CC A A C A A
A AxSt St X St x St
St St
=− + −
−− − − −
− −
1 2 2 1
2 1
( ) ( )_ _
4. Calculation of Au mass fraction (W_‰) in analysed sample
WV
m R
G
GCvials
Px
_
_ .
_
_ .
= × × ×1
1000
150
0 1
12
0 4

46
Practical examples on traceability, measurement uncertainty and validation in chemistry
5. Calculation of signal standard uncertaintyu
u
NA
A one set_
_ __=
6. Calculation of recovery
RW
Wobserved
ref
=
7. Combined model equation for calculation of Au mass fraction (‰)
W V
m
G
G
C
G
Gvials
P
P_
_ _.
_
.
Au_999.9
_100
= ×⎛⎝⎜
⎞⎠⎟
× ×1
100050
0 1
12
0 4
__0.37 _0.43( _ ) ( )_A A G A A
A A RSt X P X St
St St
2 1
2 1
1− + −( )−
×− −
− −
3. Identify (all possible) sources of uncertainty
Uncertainty of concentration of reference solutions
Uncertainty of measurements of absorption of standard and sample solutions
Mass of analysed gold sample
Volume of the analysed solution
Recovery
Other:
Other:
4. Evaluate values of each input quantity
Input quantity Value Unit Remark
V _5050 mL Volume of analysed solution
V _100100 mL Volume of stock standard solution
m_ .0 10.1001 g Mass of analysed alloy sample
Gvials _1212.0030 g Mass of sample solution prepared in vials
GP _ .0 40.4015 g Mass of Au sample solution taken from V
_50 flask
m pureAu−0.1004 g Mass weighed of pure gold
Au purity_99.99 % The purity of gold stated in the certificate
G Gp p_0.37 _0.43; 0.3701; 0.4302 g
Masses of the stock Au standard solution
transferred for the preparation of calibration
solutions C_St1
and C_St2

47
Analysis of Gold Alloys by Flame Atomic Absorption Spectrometry
G_100 10.0321 AU Mass of calibration standard solutions
A St− 1 ; A St_ 2 0.5203; 0.6041 AU
Absorbance measured for calibration standard
solutions
AX 0.5488 AUAbsorbance measured for the analysed sample
solution
R 1.002 - Recovery
5. Evaluate the standard uncertainty of each input quantity
Input quantityStandard
uncertaintyUnit Remark
V _50 0.0379 mL Volume of analysed solution
V _100 0.0697 mL Volume of stock standard solution
m_ .0 1 0.0002 g Mass of analysed alloy sample
Gvials _12 0.0008 g Mass of sample solution prepared in vials
GP _ .0 4 0.0009 g Mass of Au sample solution taken from V_50
flask
m pureAu− 0.0002 g Mass weighed of pure gold
Au purity_ 0.0058 % The purity of gold stated in the certificate
G Gp p_0.37 _0.43; 0.0006; 0.0006 g
Masses of the stock Au standard solution
transferred for the preparation of calibration
solutions C_St1
and C_St2
G_10 0.0008 g Mass of calibration standard solutions
A St− 1; A St_ 2 0.0010; 0.0011 AU
Absorbance measured for calibration standard
solutions
AX 0.0011 AUAbsorbance measured for the analysed sample
solution
R 0.0025 Recovery
6. Calculate the value of the measurand, using the model equation
7. Calculate the combined standard uncertainty (uc) of the result and specify units
Using: M C

48
Practical examples on traceability, measurement uncertainty and validation in chemistry
Input
quantityValue
Standard
uncertaintyUnit Remark
W_‰ 583.5 2.8 ‰ Au mass fraction in jewellery alloys
8. Calculate expanded uncertainty (Uc) and specify the coverage factor k and the
units
k
9. Analyse the uncertainty contribution and specify the main three input quantities contributing the most to U
c
1 Recovery – contributing 37.6 % to the expanded uncertainty
2 Absorption of analysed gold sample − contributing 26.1 % to the expanded uncertainty
3 Mass of analysed gold sample − contributing 14.9 % to the expanded uncertainty
10. Prepare your uncertainty budget report
k
k

49
Analysis of Gold Alloys by Flame Atomic Absorption Spectrometry
Further readings
I
CI P The Precious Metals Book
I C
I
ICP
R M MFresenius J. Anal. Chem. −
M M L P C P RTM M −
I MI
Protect. Metals −
C L T
Spectrochim. Acta B Atom. Spectrosc. −
M C M R M ICPAtom. Spectrosc. −
LJ. Anal. Atom. Spectrom.
−
T L C
P P Scienti c Works-Chem. −
LICP M Forth
National Conference of Chemistry So a − P
CAnalyst −

50
Practical examples on traceability, measurement uncertainty and validation in chemistry
Addendum I. Measurement uncertainty calculation:
spreadsheet approach (Excel)
51
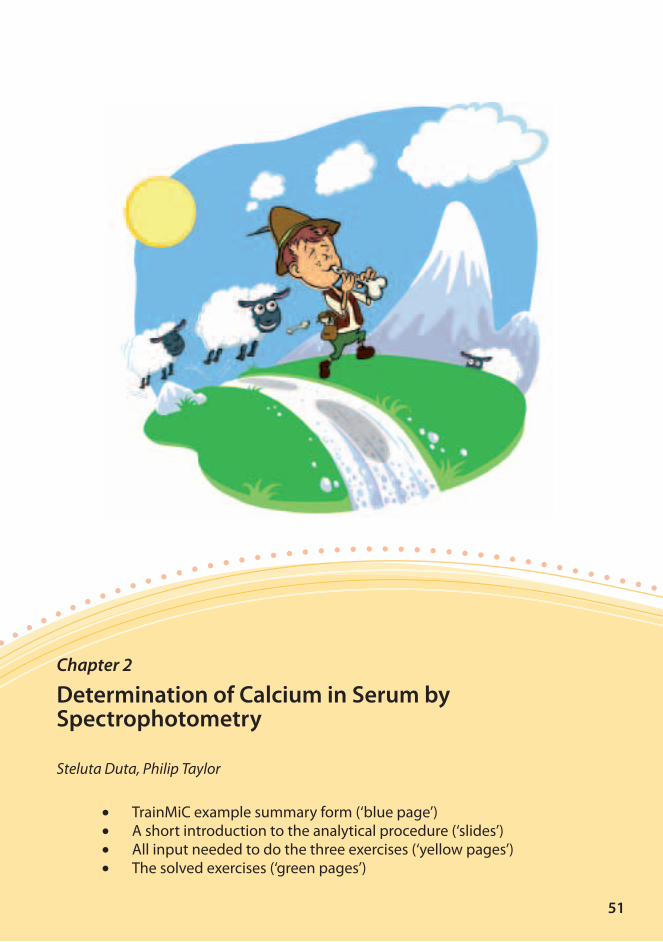
Chapter 2
Determination of Calcium in Serum by Spectrophotometry
Steluta Duta, Philip Taylor
TrainMiC example summary form (‘blue page’) A short introduction to the analytical procedure (‘slides’) All input needed to do the three exercises (‘yellow pages’) The solved exercises (‘green pages’)

52
Practical examples on traceability, measurement uncertainty and validation in chemistry
I. General information about the example
Measurand Concentration of calcium in human serum (mg dL-1)
Example number Ex-10
Authors of the example Steluta Duta, Philip Taylor
Analytical procedure Standard WHO procedure
Customer’s requirement Standard WHO procedure
TrainMiC example summary form

53
Determination of Calcium in Serum by Spectrophotometry
II. Attached files
File number, type
and nameContent of the file
File is
attached Remark
Yes No
1 -
I
Ex-10-1-I-
Ca-serum-
Photometry-
2006-Ver1.ppt
About the analytical procedure: short introductionGiven by the
lecturer
2 -
Yel
low Ex-10-2-Y-
Ca-serum-
Photometry-
2006-Ver1.doc
PART I Description of the analytical procedure
Each
participant
receives own
copy and
may keep it
PART IIThe customer’s requirements concerning
the quality of the measurement result
PART
III
Validation of the measurement procedure –
relevant equations and measurement data
PART
IV
Measurement uncertainty of the result –
relevant equations and measurement data
3 -
Gre
en Ex-10-3-G-
Ca-serum-
Photometry-
2006-Ver1.doc
PART IEstablishing traceability in analytical
chemistry
PART IISingle laboratory validation of
measurement procedures
PART
III
Bulding an uncertainty budget
Addendum 1: By spreadsheet approach
Addendum 2: By dedicated software
III. History of the example
Version Uploaded on the webhotel Short description of the change
0 April 2007
1

54
Practical examples on traceability, measurement uncertainty and validation in chemistryPractical examples on traceability, measurement uncertainty and validation in chemistry
A short introduction to the analytical procedure

Analysis of Gold Alloys by Flame Atomic Absorption Spectrometry
55
Determination of Calcium in Serum by Spectrophotometry

56
Practical examples on traceability, measurement uncertainty and validation in chemistry
Analytical procedure
Determination of concentration of calcium in serum by
molecular absorption spectrometry.
The quality of the results should comply with the requirements
in the WHO procedure
PART I ...................................................................................................................................57
Description of the analytical procedure
PART II .................................................................................................................................60
The customer’s requirements concerning the quality of the measurement result
PART III ................................................................................................................................61
Validation of the measurement procedure – relevant equations and measurement data
PART IV ................................................................................................................................62
Measurement uncertainty of the result – relevant equations and measurement data
All input needed to do the three exercises ‘yellow pages’

57
Determination of Calcium in Serum by Spectrophotometry
PART I. Description of the analytical procedure
Laboratory task
CI
TT
L
Principle of the measurement method
T − PC C
CT C
MPT
Analytical procedure
Serum sample preparation and storage
C − °C − °C− °C
Reagents
MPI L MP L
C L

58
Practical examples on traceability, measurement uncertainty and validation in chemistry
CL C L L
TT
L −°C
CStock calcium standard solution C °C
L LL C M L
− °C TL
Calibration calcium standard solutionsT
L LL T
L− °C
Instrumentation
T −T
Experimental protocol
TL
L M L
Blank S5 S7.5 S10 S12.5 Serum QC
Distilled water (mL) 0.1 - - - - - -
Standard (mL) - 0.1 0.1 0.1 0.1 - -
Serum/QC (mL) - - - - - 0.1 0.1

59
Determination of Calcium in Serum by Spectrophotometry
Colour reagent (mL) 2.0 2.0 2.0 2.0 2.0 2.0 2.0
Mix well
Buffer solution (mL) 2.0 2.0 2.0 2.0 2.0 2.0 2.0
Mix well
− °C
L
T L I
Calculation of result
T
c A ACa x= ( ) ×−10 10 L
cC −Ax −A− − L
Analytical reliability
I QC
QCQC
C
QC QC

60
Practical examples on traceability, measurement uncertainty and validation in chemistry
Clinical interpretation:1
C − L −C − L −
PART II. The customer’s requirements concerning quality of the
measurement result according to WHO*
61
Determination of Calcium in Serum by Spectrophotometry
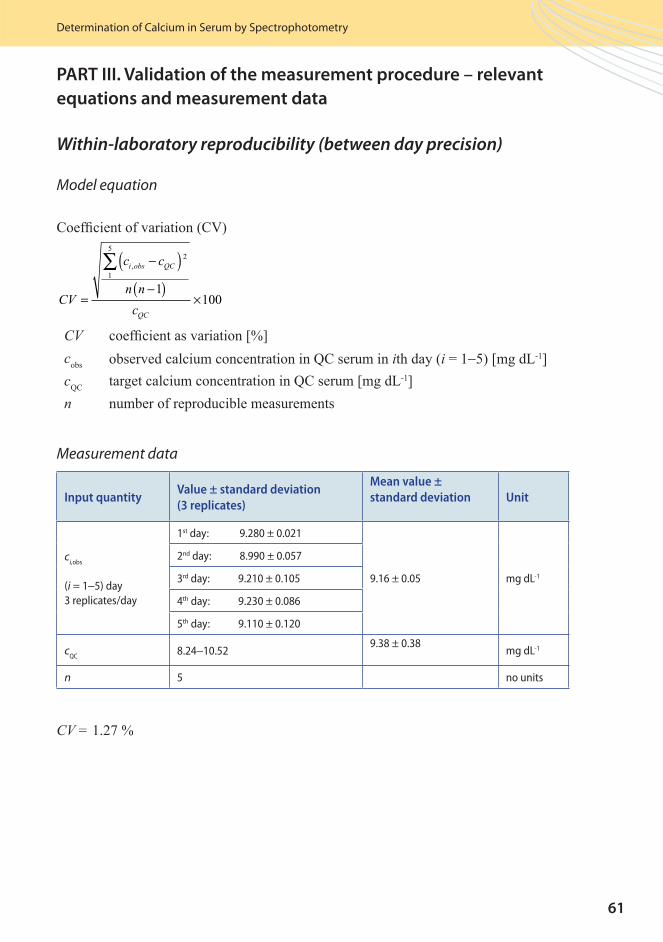
Within-laboratory reproducibility (between day precision)
Model equation
C C
CV
c c
n n
c
i obs QC
QC
=
−( )−( )
×
∑ ,2
1
5
1100
CVc QC i i − LcQC QC Ln
Measurement data
Input quantityValue ± standard deviation
(3 replicates)
Mean value ±
standard deviation Unit
ci,obs
(i = 1−5) day
3 replicates/day
1st day: 9.280 ± 0.021
9.16 ± 0.05 mg dL-1
2nd day: 8.990 ± 0.057
3rd day: 9.210 ± 0.105
4th day: 9.230 ± 0.086
5th day: 9.110 ± 0.120
cQC
8.24−10.529.38 ± 0.38
mg dL-1
n 5 no units
CV =
PART III. Validation of the measurement procedure – relevant
equations and measurement data

62
Practical examples on traceability, measurement uncertainty and validation in chemistry
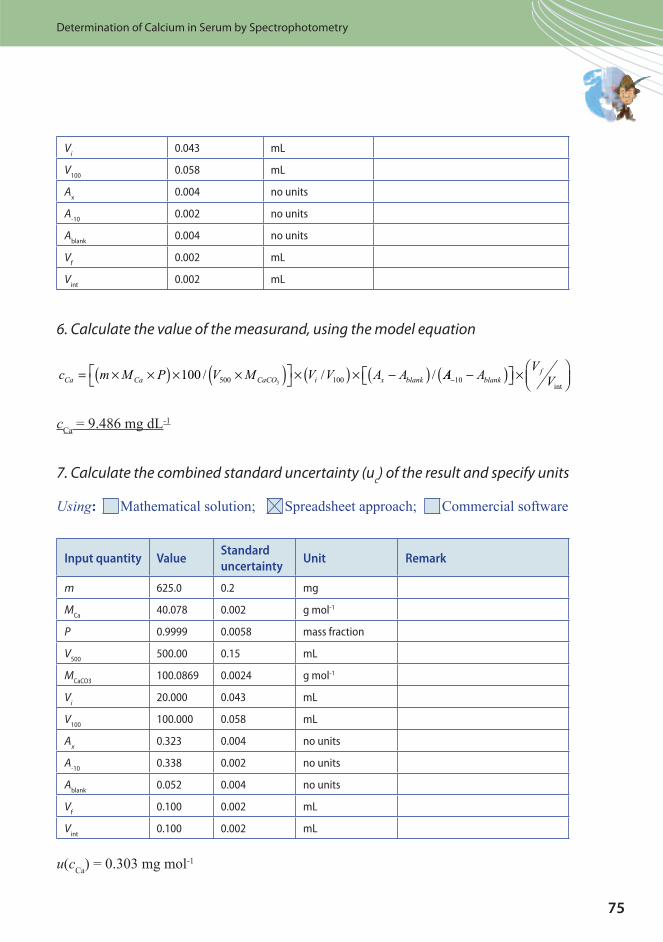
IV.1. Preparation of standard solutions2
IV.1.1 Preparation of calcium stock standard solution, cstock
c m M P V Mstock Ca CaCO= × ×( ) × ×( )100 500 3/
c Lm C CMC
P C CV LMC C C C
MInput quantity Value Standard uncertainty Unit
m 625.0 0.2 mg
MCa
40.078 0.002 g mol-1
P 0.9999 0.0058 mass fraction
V500
500.00 0.15 mL
MCaCO3
100.0869 0.0024 g mol-1
IV.1.2 Preparation of calibration standard solutions, ci:
c cV
Vi stocki= ×
⎛⎝⎜
⎞⎠⎟100
c C LVi I Vi V c LV L
Vi V V V V ci = c c c c
PART IV. Measurement uncertainty of the result: relevant
equations and measurement data2

63
Determination of Calcium in Serum by Spectrophotometry
MInput quantity Value Standard uncertainty Unit
cstock
50.05 0.02 mg dL-1
Vi
20.000 0.043 mL
V100
100.000 0.058 mL
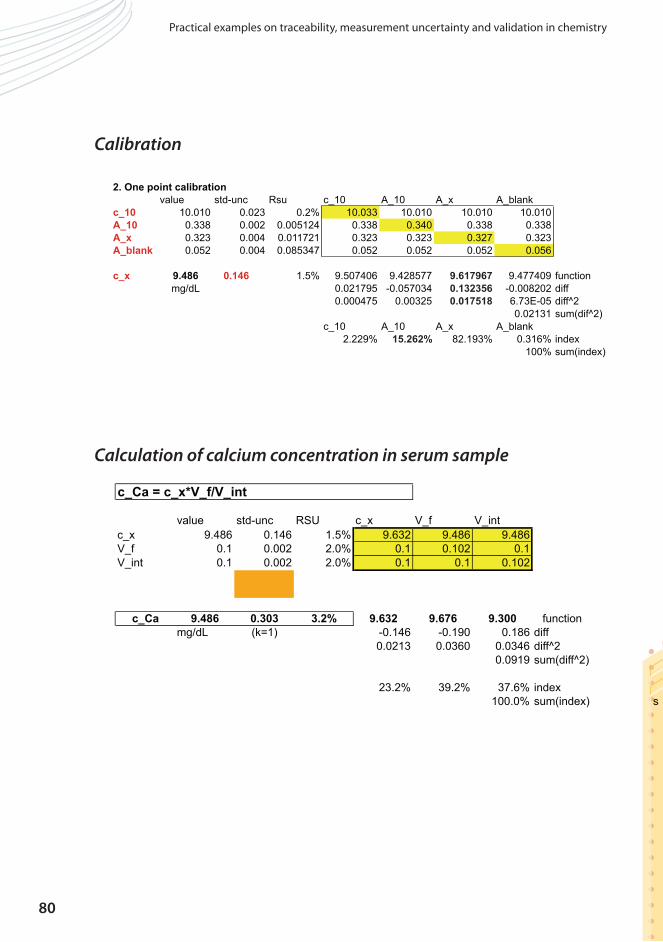
IV.2 Calibration – one point calibration
M c
c c A A A Ax x blank blank= −( ) −( )− −10 10/
cx C Lc C L LAx
A LA
MInput quantity Value Standard uncertainty Unit
c_10
10.000 0.023 mg dL-1
Ax
0.323 0.004 no units
A-10
0.338 0.002 no units
Ablank
0.052 0.004 no units
IV.3 Calculation of calcium concentration in serum sample
c cV
VCa xf= × ⎛
⎝⎜⎞⎠⎟int
cC Lcx LV LV L
MInput quantity Value Standard uncertainty Unit
cx
9.486 0.303 mg dL-1
Vf
0.100 0.002 mL
Vint
0.100 0.002 mL

64
Practical examples on traceability, measurement uncertainty and validation in chemistry
TrainMiC Exercises
Analytical procedure
Determination of calcium concentration in human serum by
molecular absorbtion (spectro)photometry
The quality of results should comply with WHO procedure
requirements
EXERCISE 1:
Establishing traceability in analytical chemistry
EXERCISE 2:
Single laboratory validation of measurement procedures
Part I: General issues
Part II: Parameters to be validated
Part III: Some calculations and conclusions
EXERCISE 3:
Building an uncertainty budget
Addendum I: By spreadsheet approach
Addendum II: By dedicated software
The solved exercises ‘green pages’

65
Determination of Calcium in Serum by Spectrophotometry
1. Specifying the analyte and measurand
Analyte Calcium
Measurand Total concentration of calcium in human serum
Units mg dL-1
2. Choosing a suitable measurement procedure with associated model equation
Measurement
procedure
To determine the calcium concentration in human serum, a serum sub-sample is
mixed with reagent colour and buffer solution, according to WHO standard operation
procedure. The absorbance of calcium calibration solutions and serum sample are
measured by visible spectrophotometry at 540 nm. From the calibration data the
concentration of calcium in human serum is calculated.
Type of calibration standard curve standard addition internal standard
Model equation: calcium concentration in serum
c m M P V M V V A ACa Ca CaCO i x blank= × ×( ) × ×( )⎡⎣
⎤⎦ × ( ) × −( )100 500 1003
/ / / AA AV
Vblankf
− −( )⎡⎣ ⎤⎦ × ⎛⎝⎜
⎞⎠⎟10
int
cC LM C CMC
P C CV LMC C C CVi Vi = V c- LV LAx
A LAV LV L
ESTABLISHING TRACEABILITY IN ANALYTICAL CHEMISTRY

66
Practical examples on traceability, measurement uncertainty and validation in chemistry
3. List the input quantities according to their influence on the uncertainty of the result of the measurement (first the most important ones). At this point, your judgement should be based on your previous experience only.
1 Matrix effect - recovery
2 Instrumental signal (absorbance)
3 Concentration of standard solutions - purity of CaCO3
4 Volume of the glassware (pipettes, volumetric flasks)
5 Mass
4. List the reference standards needed and state the information regarding traceability of the reference value
For the analyte
1 Name/Chemical Formula/Producer: CaCO3 purity, Merck, min. 99.99 %
2 Name/Chemical Formula/Producer: CaCO3 molar masses/IUPAC
For the other input quantities
1Quantity/Equipment/Calibration:
e.g. mass/balance/calibrated by NMI, U = xx
(k = 2), see also data yellow sheet
Absorbance/(Spectro)photometer/Calibrated against
traceable optical standard (i.e. PTB)
2 Quantity/Equipment/Calibration:
Volume/Laboratory glassware (pipettes, volumetric
flasks/calibrated by manufacturer (i.e. Hirschmann
Laborgerate )
3 Quantity/Equipment/Calibration:Mass/Analytical balance/calibrated by manufacturer
against traceable mass standards
5. Estimating uncertainty associated with the measurement
Are all important parameters included
in the model equation?Yes No
Other important parameters are: Matrix effect

67
Determination of Calcium in Serum by Spectrophotometry
6. How would you prove traceability of your result?
1 Via traceable calibration data
2 Via traceable volumetric measurements
3 Via traceable mass measurements
7. Any other comments, questions…

68
Practical examples on traceability, measurement uncertainty and validation in chemistry
SINGLE LABORATORY VALIDATION
OF MEASUREMENT PROCEDURES
PART I: GENERAL ISSUES
1. Specify the measurement procedure, analyte, measurand and units
The measurement procedure
To determine the calcium concentration in human serum, a serum
sub-sample is mixed with reagent colour and buffer solution,
according to WHO standard operation procedure. The absorbance
of calcium calibration solutions and serum sample are measured by
visible spectrophotometry at 540 nm. From the calibration data the
concentration of calcium in human serum is calculated.
Analyte Calcium
The measurand Total calcium concentration in human serum
Unit mg dL-1
2. Specify the scope
Matrix Human serum
Measuring range 1.0−12.0 mg dL-1
3. Requirement on the measurement procedure
Intended use of the results Calcium concentration in serum result is intended to be used for clinical
interpretation
Mark the customer’s
requirements and give
their values
Parameters to be validated Value requested by the customer
LOD
LOQ
Repeatability
Within-lab reproducibility8 % as CV, by WHO procedure
2 % as CV, the actual state-of-art
Trueness
Measurement
uncertainty
Other-state

69
Determination of Calcium in Serum by Spectrophotometry
4. Origin of the measurement procedure
VALIDATION
New in-house method Full
Modified validated method Partial
Official standard method Confirmation/Verification
70
Practical examples on traceability, measurement uncertainty and validation in chemistry
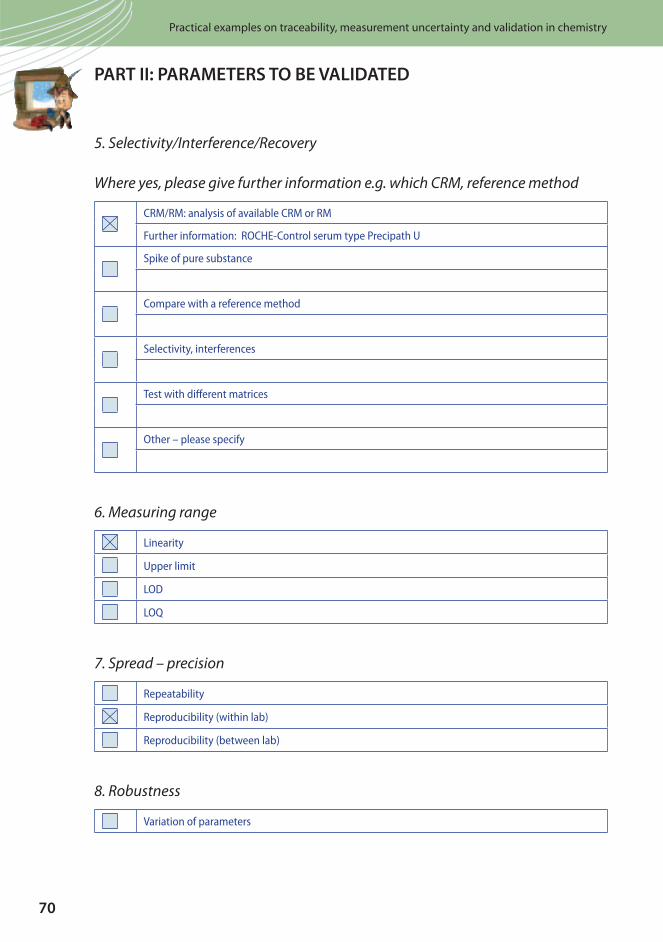
5. Selectivity/Interference/Recovery
Where yes, please give further information e.g. which CRM, reference method
CRM/RM: analysis of available CRM or RM
Further information: ROCHE-Control serum type Precipath U
Spike of pure substance
Compare with a reference method
Selectivity, interferences
Test with different matrices
Other – please specify
6. Measuring range
Linearity
Upper limit
LOD
LOQ
7. Spread – precision
Repeatability
Reproducibility (within lab)
Reproducibility (between lab)
8. Robustness
Variation of parameters
PART II: PARAMETERS TO BE VALIDATED

71
Determination of Calcium in Serum by Spectrophotometry
9. Quality control
Control charts
Participation in PT schemes
10. Other parameters to be tested
Working range and testing of homogeneity of variances
R squared
Residual standard deviation
Standard deviation of the analytical procedure
Coefficient of variation of the analytical procedure
Measurement uncertainty

72
Practical examples on traceability, measurement uncertainty and validation in chemistry
11. Calculation of parameters requested by the customer
Parameters requested to be
validatedCalculations
LOD
LOQ
Repeatability
Within-lab reproducibilty
CV
c c
n n
c
i obs QC
QC
=
−( )−( )
×
∑ ,2
1
5
1100 = 1.27 %
Trueness
Measurement uncertainty
Other - please state
12. Does the analytical procedure fulfil the requirement(s) for the intended use?
ParameterValue requested by
the customer(the same as stated in question 3)
Value obtained
during validation
The requirement
is fulfilled
Yes/No
LOD
LOQ
Repeatability
Within-lab
reproducibility
8 % as CV, by WHO procedure
2% as CV, the actual state-of-art 1.27 % YES
Trueness
Measurement
uncertainty
Other
The analytical procedure is fit for the intended use:
Yes No
For measurement uncertainty and traceability refer to the corresponding sheets
PART III: SOME CALCULATIONS AND CONCLUSIONS

73
Determination of Calcium in Serum by Spectrophotometry
1. Specify the measurand and units
Measurand Total calcium concentration in human serum
Unit mg dL-1
2. Describe the measurement procedure and provide the associated model equation
Measurement procedure
T
T
Model equation: calcium concentration in serum
c m M P V M V V A ACa Ca CaCO i x blank= × ×( ) × ×( )⎡⎣
⎤⎦ × ( ) × −( )100 500 1003
/ / / AA AV
Vblankf
− −( )⎡⎣ ⎤⎦ × ⎛⎝⎜
⎞⎠⎟10
int
cC Lm C CMC
P C CV LMC C C CVi Vi = V c LV LAx
A LAV LV L
BUILDING AN UNCERTAINTY BUDGET

74
Practical examples on traceability, measurement uncertainty and validation in chemistry
3. Identify (all possible) sources of uncertainty
Uncertainty of concentration of reference solutions
Uncertainty of measurements of peak area
Method bias
Matrix effect
Other: Uncertainty of absorbance measurements
Other: Uncertainty of volume measurements
4. Evaluate values of each input quantity
Input quantity Value Unit Remark
m 625.0 mg
MCa
40.078 g mol-1
P 0.9999 mass fraction
V500
500.00 mL
MCaCO3
100.0869 g mol-1
Vi
20.000 mL
V100
100.000 mL
Ax
0.323 no units
A-10
0.338 no units
Ablank
0.052 no units
Vf
0.100 mL
Vint
0.100 mL
5. Evaluate the standard uncertainty of each input quantity
Input quantityStandard
uncertaintyUnit Remark
m 0.2 mg
MCa
0.002 g mol-1
P 0.0058 mass fraction
V500
0.15 mL
MCaCO3
0.0024 g mol-1
75
Determination of Calcium in Serum by Spectrophotometry
Vi
0.043 mL
V100
0.058 mL
Ax
0.004 no units
A-10
0.002 no units
Ablank
0.004 no units
Vf
0.002 mL
Vint
0.002 mL
6. Calculate the value of the measurand, using the model equation
c m M P V M V V A ACa Ca CaCO i x blank= × ×( ) × ×( )⎡⎣
⎤⎦ × ( ) × −( )100 500 1003
/ / / AA AV
Vblankf
− −( )⎡⎣ ⎤⎦ × ⎛⎝⎜
⎞⎠⎟10
int
cC L
7. Calculate the combined standard uncertainty (uc) of the result and specify units
Using: M C
Input quantity ValueStandard
uncertaintyUnit Remark
m 625.0 0.2 mg
MCa
40.078 0.002 g mol-1
P 0.9999 0.0058 mass fraction
V500
500.00 0.15 mL
MCaCO3
100.0869 0.0024 g mol-1
Vi
20.000 0.043 mL
V100
100.000 0.058 mL
Ax
0.323 0.004 no units
A-10
0.338 0.002 no units
Ablank
0.052 0.004 no units
Vf
0.100 0.002 mL
Vint
0.100 0.002 mL
u cC

76
Practical examples on traceability, measurement uncertainty and validation in chemistry
8. Calculate expanded uncertainty (Uc) and specify the coverage factor k and the
units
U(cCa) = k u (cCa) = 0.606 [mg dL-1], k = 2
9. Analyse the uncertainty contribution and specify the main three input quantities contributing the most to U
c
1 Volume serum measurements
2 Concentration of serum sample from calibration data
10. Prepare your uncertainty budget report

77
Determination of Calcium in Serum by Spectrophotometry
Guide to the Expression of Uncertainty in Measurement M
Eurachem Citac Guide C Qualtifying Uncertainty in Analytical Measurement
C
L RR IM IRMM
CAnalyst −
Further readings

78
Practical examples on traceability, measurement uncertainty and validation in chemistry
Preparation of the standard solution
Addendum I: Measurement uncertainty calculation:
spreadsheet approach (Excel)

79
Determination of Calcium in Serum by Spectrophotometry
80
Practical examples on traceability, measurement uncertainty and validation in chemistry
Calibration
Calculation of calcium concentration in serum sample

Chapter 3
Determination of Radium in Water by a-Spectrometry
Ljudmila Benedik, Urška Repinc, Monika Inkret
TrainMiC example summary form (‘blue page’) A short introduction to the analytical procedure (‘slides’) All input needed to do the three exercises (‘yellow pages’) The solved exercises (‘green pages’)
81
82
Practical examples on traceability, measurement uncertainty and validation in chemistry
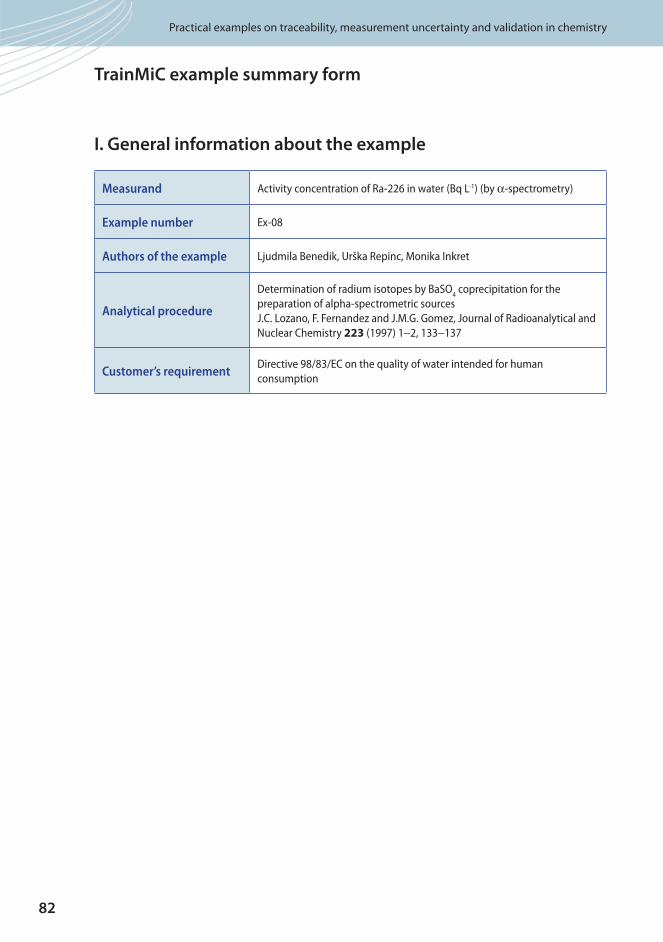
I. General information about the example
Measurand Activity concentration of Ra-226 in water (Bq L-1) (by α-spectrometry)
Example number Ex-08
Authors of the example Ljudmila Benedik, Urška Repinc, Monika Inkret
Analytical procedure
Determination of radium isotopes by BaSO4 coprecipitation for the
preparation of alpha-spectrometric sources
J.C. Lozano, F. Fernandez and J.M.G. Gomez, Journal of Radioanalytical and
Nuclear Chemistry 223 (1997) 1−2, 133−137
Customer’s requirementDirective 98/83/EC on the quality of water intended for human
consumption
TrainMiC example summary form
83
Determination of Radium in Water by α-Spectrometry
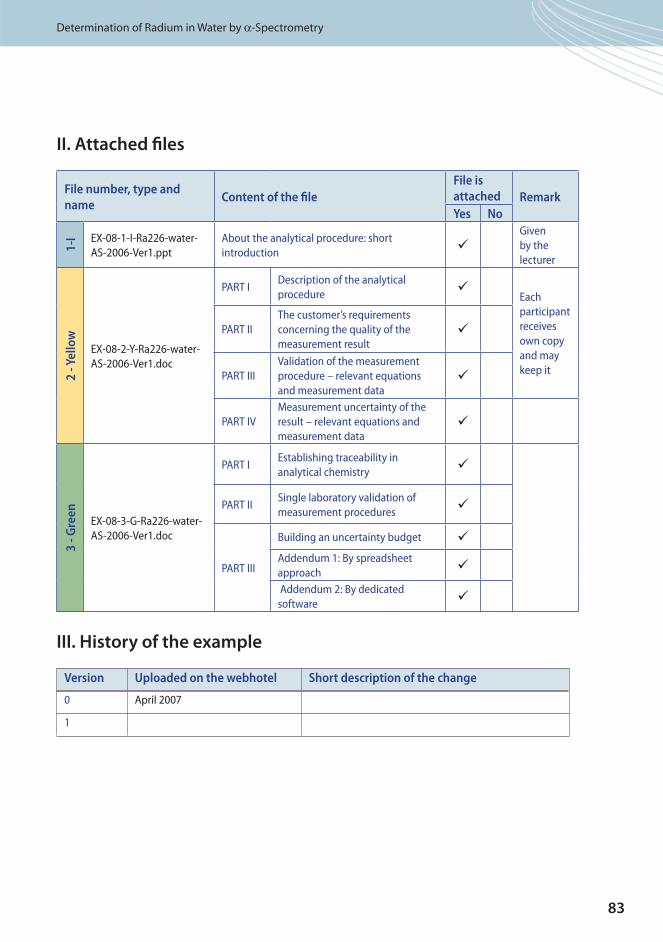
II. Attached files
File number, type and
nameContent of the file
File is
attached Remark
Yes No
1-I EX-08-1-I-Ra226-water-
AS-2006-Ver1.ppt
About the analytical procedure: short
introduction
Given
by the
lecturer
2 -
Yel
low
EX-08-2-Y-Ra226-water-
AS-2006-Ver1.doc
PART IDescription of the analytical
procedure Each
participant
receives
own copy
and may
keep it
PART II
The customer’s requirements
concerning the quality of the
measurement result
PART III
Validation of the measurement
procedure – relevant equations
and measurement data
PART IV
Measurement uncertainty of the
result – relevant equations and
measurement data
3 -
Gre
en
EX-08-3-G-Ra226-water-
AS-2006-Ver1.doc
PART IEstablishing traceability in
analytical chemistry
PART IISingle laboratory validation of
measurement procedures
PART III
Building an uncertainty budget
Addendum 1: By spreadsheet
approach
Addendum 2: By dedicated
software
III. History of the example
Version Uploaded on the webhotel Short description of the change
0 April 2007
1

84
Practical examples on traceability, measurement uncertainty and validation in chemistryPractical examples on traceability, measurement uncertainty and validation in chemistry
A short introduction to the analytical procedure

Analysis of Gold Alloys by Flame Atomic Absorption Spectrometry
85
Determination of Radium in Water by α-Spectrometry

86
Practical examples on traceability, measurement uncertainty and validation in chemistryPractical examples on traceability, measurement uncertainty and validation in chemistry

Analysis of Gold Alloys by Flame Atomic Absorption Spectrometry
87
Determination of Radium in Water by α-Spectrometry
88
Practical examples on traceability, measurement uncertainty and validation in chemistry
Analytical procedure
Determination of activity concentration of Ra-226 in drinking
water.
The quality of the results should comply with the requirements
in the revised Directive 98/83/EC on the quality of water
intended for human consumption
PART I ..................................................................................................................... 89
Description of the analytical procedure
PART II .................................................................................................................... 96
The customer’s requirements concerning the quality of the measurement result
PART III ................................................................................................................... 97
Validation of the measurement procedure – relevant equations and measurement data
PART IV ................................................................................................................... 98
Measurement uncertainty of the result – relevant equations and measurement data
All input needed to do the three exercises ‘yellow pages’
89
Determination of Radium in Water by α-Spectrometry
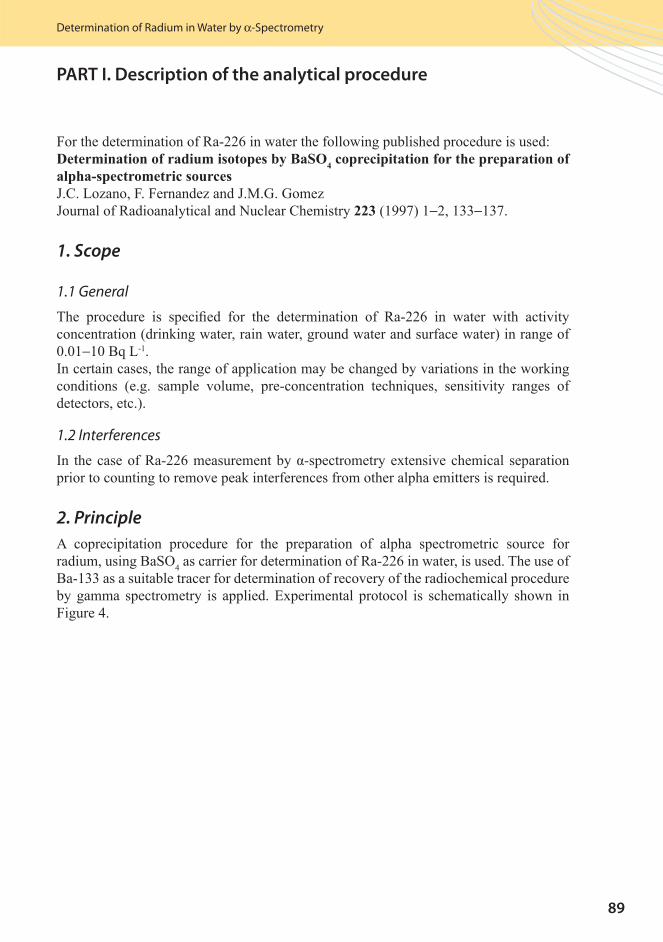
RDetermination of radium isotopes by BaSO4 coprecipitation for the preparation of alpha-spectrometric sourcesC L M
R C 223 − −
1. Scope
1.1 General
T R
− LI
1.2 Interferences
I R
2. Principle
R T
PART I. Description of the analytical procedure

90
Practical examples on traceability, measurement uncertainty and validation in chemistry
Figure 4. Experimental protocol for determination Ra-226 in water
3. Apparatus
Pd = 0.001
C L
M
P
P
91
Determination of Radium in Water by α-Spectrometry
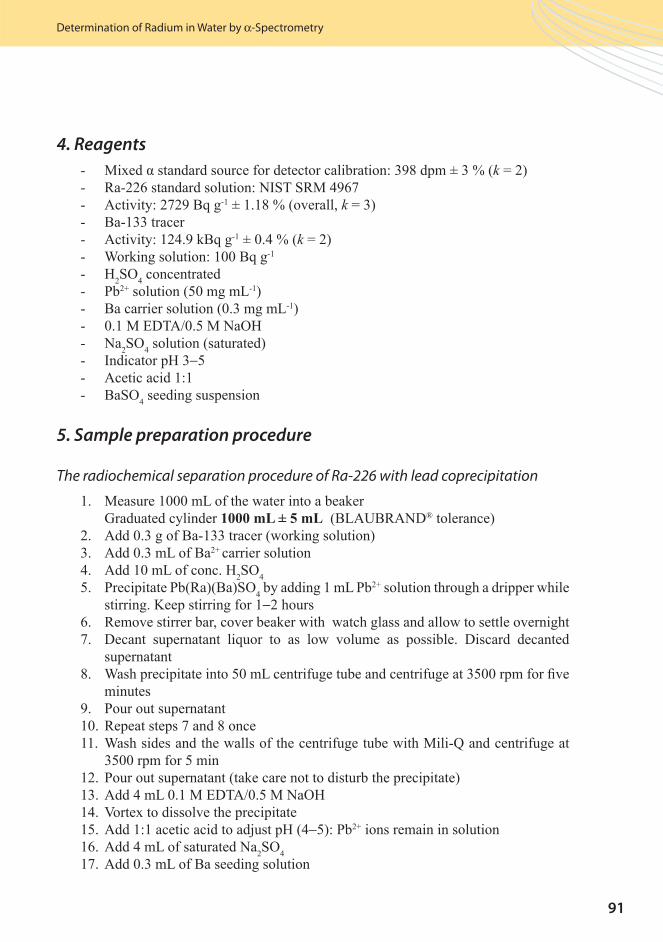
4. Reagents
M kR I T RM
k
k
P LL
M T M
I −
5. Sample preparation procedure
The radiochemical separation procedure of Ra-226 with lead coprecipitation
M L1000 mL ± 5 mL L R ®
LL
P P R LP−
R
L
PR
M Q
PL M T M
− PLL

92
Practical examples on traceability, measurement uncertainty and validation in chemistry
R
RM
6. Preparation of standard discs
6.1 Preparation of a Ba-133 standard disc
I
M L
L
L PCP
PL M T M
−LL
M
M
T
T

93
Determination of Radium in Water by α-Spectrometry
6.2 Preparation of a Ra-226 standard disc
RT
R
M L R
L
L PCP
PL M T M
−LL
M
M
7. Preparation of blank filters
7.1 Preparation of blank filter
RM
7.2 Making a reagent blank filter
R
−

94
Practical examples on traceability, measurement uncertainty and validation in chemistry
8. Gamma and alpha counting
GammaMMM
AlphaMMMM RM R
9. Calculation
9.1 Sample recovery calculation
RP
t m
tchem
Ba-133sample
Ba-133sample Ba-133sample
Ba-133St
=
×× dd Ba-133Std
Ba-133Std
× m
P
RPtmPtm
P
t m A RRa-226Std
Ra-226Std Ra-226SS Ra-226SS Ra-226Std
=× × ×
9.2 Alpha spectrometer efficiency determination
RRPR RtRmR RAR R
95
Determination of Radium in Water by α-Spectrometry
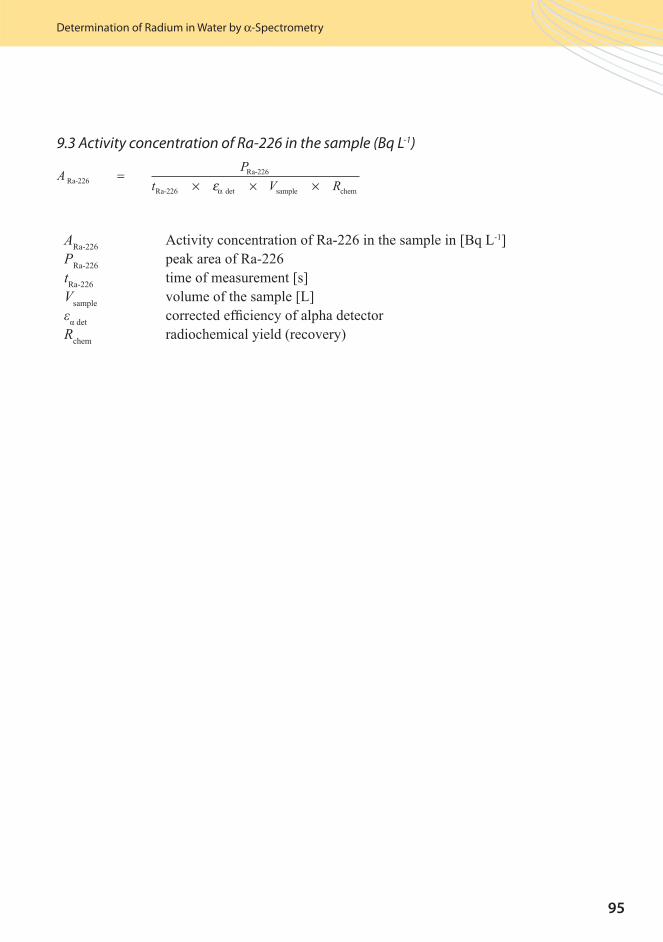
9.3 Activity concentration of Ra-226 in the sample (Bq L-1)
AP
t e V RRa-226Ra-226
Ra-226 det sample chem
=× × ×α
AR R LPR RtRV L
R

96
Practical examples on traceability, measurement uncertainty and validation in chemistry
Extract from the Directive 98/83/EC, Draft annex 2005/04/20 on the
quality of water intended for human consumption
Reference concentration for radioactivity in drinking water*
Origin Nuclide Reference concentration
Natural Ra-226 0.5 Bq L-1
This table includes the most common natural and arti cial radionuclide Reference concentrations for other radionuclides can be calculated using the dose coef cients for adults laid down in Annex III Table A of Directive 96/29/Euratom or more recent information recognised by the competent authorities in the Member State, and by assuming an intake of 730 litres per year.
Performance characteristics and methods of analysis
Parameter Limit of detection Notes
Ra-226 0.04 Bq L-1Note 1
Note 2
Note 1: the limit of detection should be calculated according to ISO 11929-7, Determination of the detection limit and decision thresholds for ionizing radiation measurements - Part 7: Fundamentals and general applications, with probabilities of errors of 1st and 2nd kind of 0.05 eachNote 2: measurement uncertainties should be calculated and reported as complete standard uncertainties, or as expanded standard uncertainties with an expansion factor of 1.96, according to the ISO Guide for the Expression of Uncertainty in Measurement (ISO, Geneva 1993, corrected reprint Geneva, 1995)
PART II. The customer’s requirements concerning quality of the
measurement result
97
Determination of Radium in Water by α-Spectrometry
IR
I
L
L LL
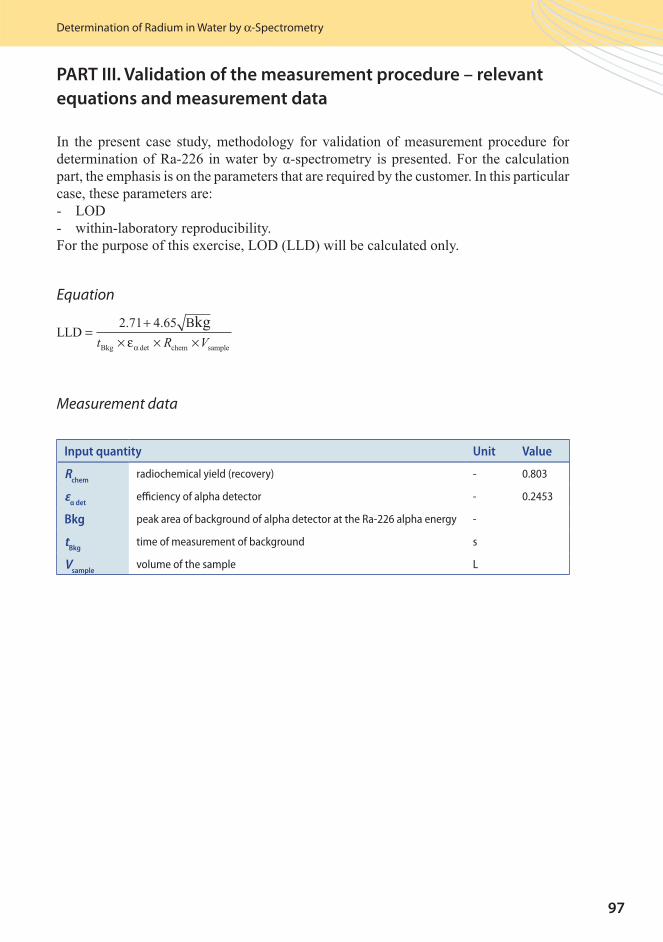
Equation
LLDBkg
Bkg chem sample
=+
× × ×2 71 4 65. .
dett R Vεα
Measurement data
Input quantity Unit Value
Rchem
radiochemical yield (recovery) - 0.803
εα det
efficiency of alpha detector - 0.2453
Bkg peak area of background of alpha detector at the Ra-226 alpha energy -
tBkg
time of measurement of background s
Vsample
volume of the sample L
PART III. Validation of the measurement procedure – relevant
equations and measurement data

98
Practical examples on traceability, measurement uncertainty and validation in chemistry
IR R
TT
T
I
Equations
( )u A
A
u P
P
u ee
Ra-226
Ra-226
Ra-226
Ra-226
2
det
αdet
( )( )=
⎛⎝⎜
⎞⎠⎟
+⎛
⎝α
⎜⎜⎞
⎠⎟+
⎛
⎝⎜
⎞
⎠⎟ +
⎛⎝⎜
⎞⎠⎟
2
sample
sample
2
chem
chem
2( ) ( )u V
V
u R
R
u R
R
u P
P
u mchem
chem
Ba-133Std
Ba-133Std
2
Ba-133Std( ) ( )( )=
⎛
⎝⎜
⎞
⎠⎟ +
mm
u P
PBa-133Std
2
Ba-133sample
Ba-133sample
2
⎛
⎝⎜
⎞
⎠⎟ +
( )⎛
⎝⎜⎜
⎞
⎠⎟⎟
+uu m
m
Ba-133sample
Ba-133sample
2( )⎛
⎝⎜⎜
⎞
⎠⎟⎟
u ee
u P
P
u m
mα
α
det
det
Ra-226Std
Ra-226Std
2
Ra-226SS( ) ( )( )=
⎛⎝⎜
⎞⎠⎟
+RRa-226SS
2
Ra-226SS
Ra-226SS
2
Ra-226Std( )⎛⎝⎜
⎞⎠⎟
+⎛⎝⎜
⎞⎠⎟
+u A
A
u R( ))
RRa-226Std
2⎛⎝⎜
⎞⎠⎟
u A k A( ) ( )Ra-226 Ra-226= ×
PART IV. Measurement uncertainty of the result – relevant
equations and measurement data

99
Determination of Radium in Water by α-Spectrometry
Mea
sure
men
t d
ata
Inp
ut
qu
anti
tyU
nit
Val
ue
Stan
dar
d
un
cert
ain
ty
Typ
e o
f
un
cert
ain
tyTy
pe
of
dis
trib
uti
on
(u)
no
rmal
rect
ang
ula
rtr
ian
gu
lar
V sam
ple
volu
me
of t
he
sam
ple
L1.
00.
002
BX
mB
a-1
33
sam
ple
mas
s o
f ad
ded
Ba-
133
in t
he
sam
ple
g0.
301
0.00
1B
X
mB
a-1
33
Std
mas
s o
f ad
ded
Ba-
133
in b
ariu
m
stan
dar
d d
isc
g0.
112
0.00
1B
X
mR
a-2
26
SS
mas
s o
f ad
ded
Ra-
226
in s
tan
dar
d
solu
tio
ng
0.01
00.
001
BX
A Ra-
22
6 S
Sac
tivi
ty c
on
cen
trat
ion
of R
a-22
6 in
stan
dar
d s
olu
tio
nB
q g
-127
29-
BX
t Ra-
22
6ti
me
of m
easu
rem
ent
s30
0 00
0-
--
t Ba-
13
3 s
amp
leti
me
of t
he
sam
ple
mea
sure
men
t (s
)s
3000
--
-
t Ba-
13
3St
dti
me
of m
easu
rem
ent
of B
a-13
3 in
bar
ium
sta
nd
ard
dis
cs
3000
--
-
P Ra-
22
6p
eak
area
of R
a-22
6-
7516
87A
X
P Ba-
13
3 s
amp
lep
eak
area
of B
a-13
3 in
th
e sa
mp
le-
10 9
1410
4A
X
P Ba-
13
3 S
tdp
eak
area
of B
a-13
3 in
bar
ium
stan
dar
d d
isc
-50
9071
AX
P Ra-
22
6 S
tdp
eak
area
of R
a-22
6 in
sta
nd
ard
dis
c-
12 7
8511
3A
X
R chem
rad
ioch
emic
al y
ield
(rec
ove
ry)
--
-A
X
ε α d
eteffi
cien
cy o
f alp
ha
det
ecto
r-
--
AX
R Ra
-22
6S
td
rad
ium
sta
nd
ard
dis
c re
cove
ry-
--
A
X

100
Practical examples on traceability, measurement uncertainty and validation in chemistry
TrainMiC Exercises
Analytical procedure
Determination of activity concentration of Ra-226 in drinking
water.
The quality of the results should comply with the requirement
in the revised Directive 98/83/EC on the quality of water
intended for human consumption
EXERCISE 1:
Establishing traceability in analytical chemistry
EXERCISE 2:
Single laboratory validation of measurement procedures
Part I: General issues
Part II: Parameters to be validated
Part III: Some calculations and conclusions
EXERCISE 3:
Building an uncertainty budget
Addendum I: By spreadsheet approach
Addendum II: By dedicated software
The solved exercises ‘green pages’
101
Determination of Radium in Water by α-Spectrometry
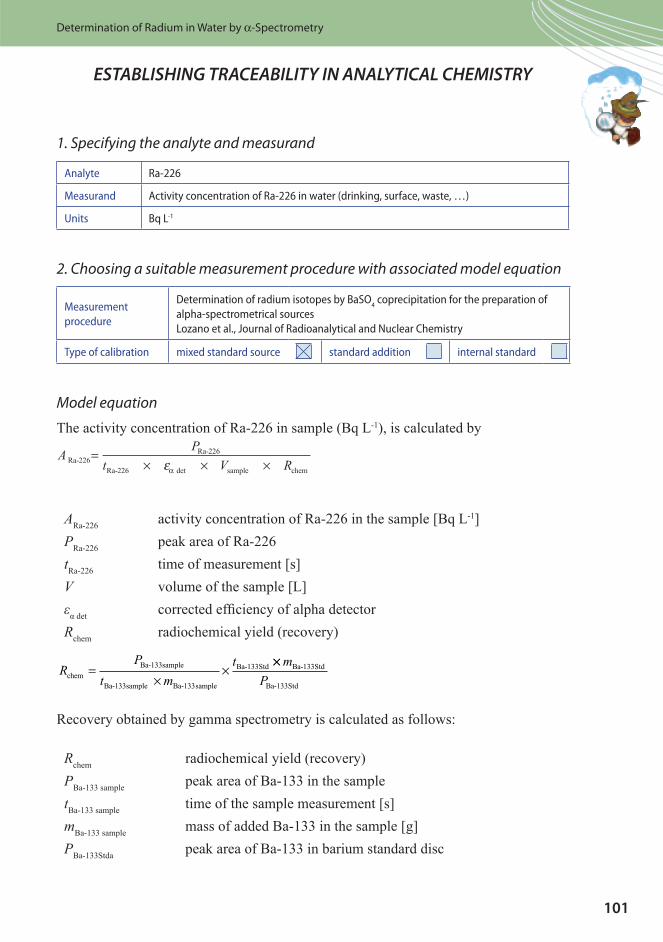
ESTABLISHING TRACEABILITY IN ANALYTICAL CHEMISTRY
1. Specifying the analyte and measurand
Analyte Ra-226
Measurand Activity concentration of Ra-226 in water (drinking, surface, waste, …)
Units Bq L-1
2. Choosing a suitable measurement procedure with associated model equation
Measurement
procedure
Determination of radium isotopes by BaSO4 coprecipitation for the preparation of
alpha-spectrometrical sources
Lozano et al., Journal of Radioanalytical and Nuclear Chemistry
Type of calibration mixed standard source standard addition internal standard
Model equation
T R L
AP
t e V RRa-226Ra-226
Ra-226 det sample chem
=× × ×α
AR R LPR RtRV L
R
RP
t m
tchem
Ba-133sample
Ba-133sample Ba-133sample
Ba-133Std=×
××× m
PBa-133Std
Ba-133Std
R
RPtmP
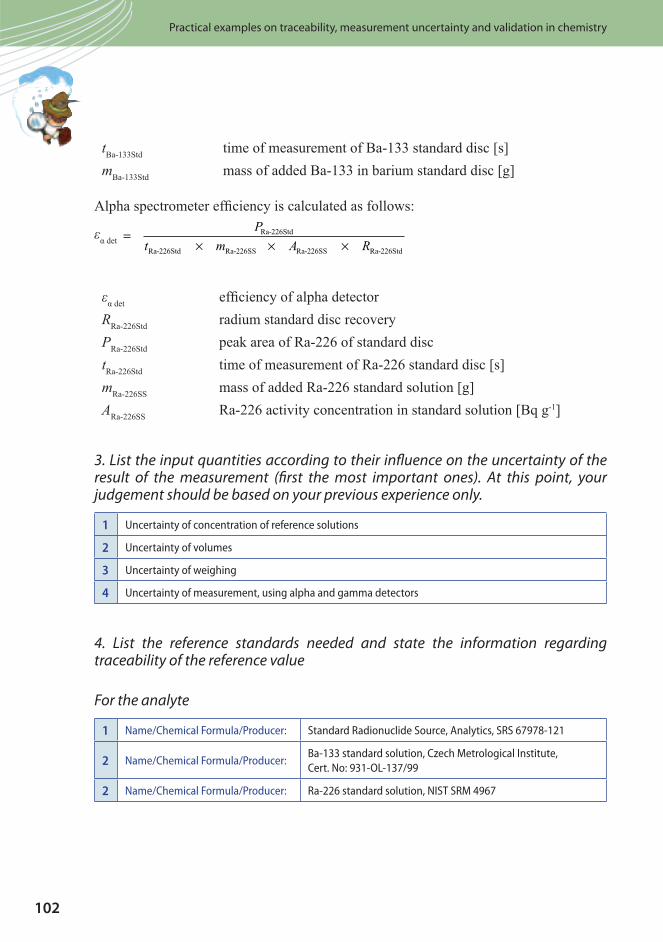
102
Practical examples on traceability, measurement uncertainty and validation in chemistry
tm
P
t m A RRa-226Std
Ra-226Std Ra-226SS Ra-226SS Ra-226Std
=× × ×
RRPR RtR RmR RAR R
3. List the input quantities according to their influence on the uncertainty of the result of the measurement (first the most important ones). At this point, your judgement should be based on your previous experience only.
1 Uncertainty of concentration of reference solutions
2 Uncertainty of volumes
3 Uncertainty of weighing
4 Uncertainty of measurement, using alpha and gamma detectors
4. List the reference standards needed and state the information regarding traceability of the reference value
For the analyte
1 Name/Chemical Formula/Producer: Standard Radionuclide Source, Analytics, SRS 67978-121
2 Name/Chemical Formula/Producer:Ba-133 standard solution, Czech Metrological Institute,
Cert. No: 931-OL-137/99
2 Name/Chemical Formula/Producer: Ra-226 standard solution, NIST SRM 4967
103
Determination of Radium in Water by α-Spectrometry
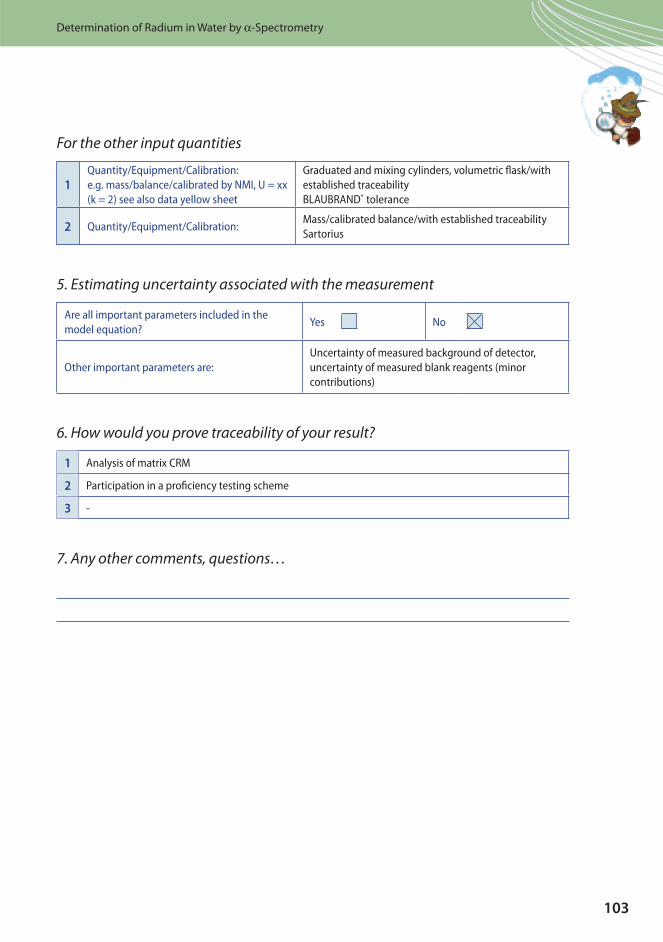
For the other input quantities
1Quantity/Equipment/Calibration:
e.g. mass/balance/calibrated by NMI, U = xx
(k = 2) see also data yellow sheet
Graduated and mixing cylinders, volumetric flask/with
established traceability
BLAUBRAND® tolerance
2 Quantity/Equipment/Calibration:Mass/calibrated balance/with established traceability
Sartorius
5. Estimating uncertainty associated with the measurement
Are all important parameters included in the
model equation?Yes No
Other important parameters are:
Uncertainty of measured background of detector,
uncertainty of measured blank reagents (minor
contributions)
6. How would you prove traceability of your result?
1 Analysis of matrix CRM
2 Participation in a proficiency testing scheme
3 -
7. Any other comments, questions…

104
Practical examples on traceability, measurement uncertainty and validation in chemistry
PART I: GENERAL ISSUES
1. Specify the measurement procedure, analyte, measurand and units
The measurement
procedure
Determination of radium isotopes by BaSO4 coprecipitation for the preparation of
alpha-spectrometric sources
J.C. Lozano, F. Fernandez and J.M.G. Gomez
Journal of Radioanalytical and Nuclear Chemistry 223 (1997) 1−2, 133−137.
Analyte Ra-226
The measurand Activity concentration of Ra-226 in drinking water
Unit Bq L-1
2. Specify the scope
Matrix Drinking water
Measuring range 0.01–10 Bq L-1
3. Requirement on the measurement procedure
Intended use of the results Compliance to the requirements in the revised water directive 98/83/EC on
the quality of water intended for human consumption
Mark the customer’s
requirements and give
their values
Parameters to be validated Value requested by the customer
LOD 0.04 Bq L-1
LOQ
Repeatability
Within-lab reproducibility
Trueness
Measurement uncertainty
Other-state
4. Origin of the measurement procedure
VALIDATION
New in-house method Full
Modified validated method Partial
Official standard method Confirmation/Verification
SINGLE LABORATORY VALIDATION
OF MEASUREMENT PROCEDURES

105
Determination of Radium in Water by α-Spectrometry
5. Selectivity/Interference/Recovery
Where yes, please give further information e.g. which CRM, reference method
CRM/RM: analysis of available CRM or RM
Further information:
Spike of pure substance
spiking of samples with pure substances and calculation of recovery
Compare with a reference method
Selectivity, interferences
Test with different matrices
Other – please specify
6. Measuring range
Linearity
Upper limit
LOD
LOQ
7. Spread – precision
Repeatability
Reproducibility (within lab)
Reproducibility (between lab)
PART II: PARAMETERS TO BE VALIDATED

106
Practical examples on traceability, measurement uncertainty and validation in chemistry
8. Robustness
Variation of parameters
9. Quality control
Control charts
Participation in PT schemes
10. Other parameters to be tested
Working range and testing of homogeneity of variances
R square
Residual standard deviation
Standard deviation of the analytical procedure
Coefficient of variation of the analytical procedure
Measurement uncertainty

107
Determination of Radium in Water by α-Spectrometry
11. Calculation of parameters requested by the customer
Parameters requested to
be validatedCalculations
LODLLD =
+× × ×
=2 71 4 65 14 26092744
420 730 0 2453 0 803 10 000245
. . .
. ..
Bq L-1
LOQ
Repeatability
Within-lab reproducibilty
Trueness
Measurement uncertainty
Other - please state
12. Does the analytical procedure fulfil the requirement(s) for the intended use?
ParameterValue requested by the
customer(the same as stated in question 3)
Value obtained
during validation
The requirement
is fulfilled
Yes/No
LOD 0.04 Bq L-1 0.00025 Bq L-1 YES
LOQ
Repeatability
Within-lab
reproducibility
Trueness
Measurement
uncertainty
Other
The analytical procedure is fit for the intended use:
Yes No
For measurement uncertainty and traceability refer to the corresponding sheets
PART III: SOME CALCULATIONS AND CONCLUSIONS
108
Practical examples on traceability, measurement uncertainty and validation in chemistry
1. Specify the measurand and units
Measurand Activity concentration of Ra-226 in water (drinking, surface, waste, …)
Unit Bq L-1
2. Describe the measurement procedure and provide the associated model equation
Measurement procedure
C L MR C 223 − −
Model equation:
T R L
AP
t V RRa-226Ra-226
Ra-226 det sample chem
=× × ×α
AR R LPR RtRV L
R
BUILDING AN UNCERTAINTY BUDGET

109
Determination of Radium in Water by α-Spectrometry
R
RP
t m
tchem
Ba-133sample
Ba-133sample Ba-133sample
Ba-133Std=×
×× mm
PBa-133Std
Ba-133Std
RP PtmPtm
P
t m A RRa-226Std
Ra-226Std Ra-226SS Ra-226SS Ra-226Std
=× × ×
RRPR RtR RmR RAR R
3. Identify (all possible) sources of uncertainty
Uncertainty of concentration of reference solutions
Uncertainty of measurements of peak area (alpha and gamma detectors)
Method bias
Matrix effect
Other: Uncertainty of volume measurements
Other: Uncertainty of weighing
Other: Uncertainty of measured background of alpha and gamma detectors
Other: Uncertainty of measured blank reagents, filters, discs

110
Practical examples on traceability, measurement uncertainty and validation in chemistry
4. Evaluate values of each input quantity
Input quantity Value Unit Remark
PRa-226
7516 -
tRa-226
300 000 s
εαdet
0.2453 -
Vsample
1.0 L
Rchem
0.803 -
5. Evaluate the standard uncertainty of each input quantity
Input quantityStandard
uncertaintyUnit Remark
PRa-226
87 -
tRa-226
0 s Constant
εαdet
0.01392 -
Vsample
0.0020 L
Rchem
0.0142 -
6. Calculate the value of the measurand, using the model equation
AP
t e V RRa-226Ra-226
Ra 226 det sample chem
1=
× ××
− α
A Ra-226-17516
300 000 0.2453 1
1
0.803Bq L=
× ×× = 0 127.
7. Calculate the combined standard uncertainty (uc ) of the result and specify units
Using: M C
Input quantity ValueStandard
uncertaintyUnit Remark
PRa-226
7516 87 -
tRa-226
300 000 0 s
εαdet
0.2453 0.01392 -
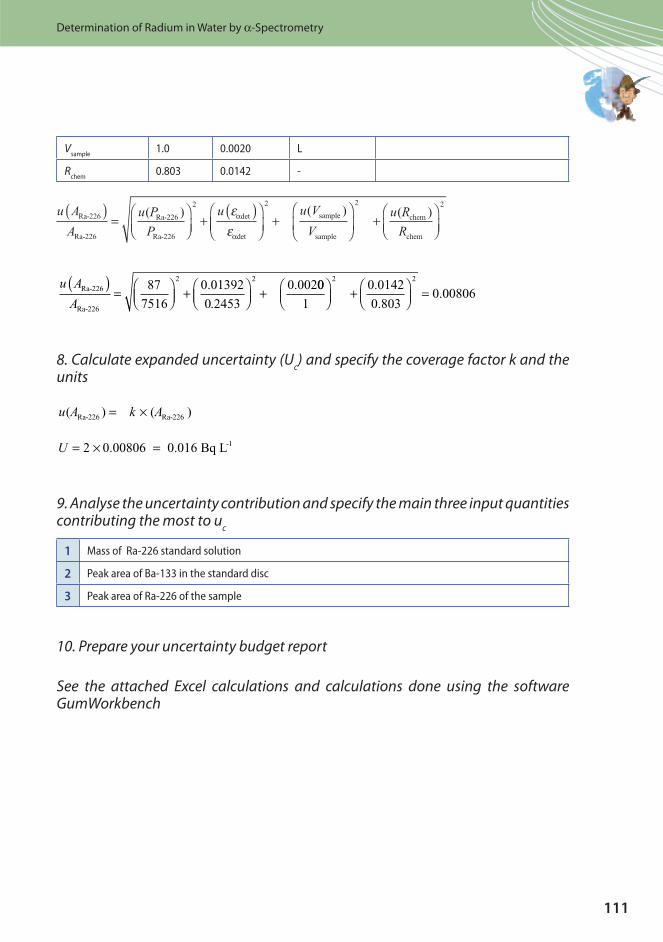
111
Determination of Radium in Water by α-Spectrometry
Vsample
1.0 0.0020 L
Rchem
0.803 0.0142 -
( )u A
A
u P
P
u ee
Ra-226
Ra-226
Ra-226
Ra-226
2
det
αdet
( )( )=
⎛⎝⎜
⎞⎠⎟
+⎛
⎝α
⎜⎜⎞
⎠⎟+
⎛
⎝⎜
⎞
⎠⎟ +
⎛⎝⎜
⎞⎠⎟
2
sample
sample
2
chem
chem
2( ( )u V
V
u R
R
)
u A
ARa-226
Ra-226
2 287
7516
0.01392
0
0.002( )= ⎛
⎝⎜⎞⎠⎟
+ ⎛⎝⎜
⎞⎠⎟
+.2453
00
1
0.0142
0.803
2 2⎛⎝⎜
⎞⎠⎟
+ ⎛⎝⎜
⎞⎠⎟
= 0 00806.
8. Calculate expanded uncertainty (Uc) and specify the coverage factor k and the
units
u A k A( ) ( )Ra-226 Ra-226= ×
U = × =2 0.00806 0.016 Bq L-1
9. Analyse the uncertainty contribution and specify the main three input quantities contributing the most to u
c
1 Mass of Ra-226 standard solution
2 Peak area of Ba-133 in the standard disc
3 Peak area of Ra-226 of the sample
10. Prepare your uncertainty budget report
See the attached Excel calculations and calculations done using the software GumWorkbench

112
Practical examples on traceability, measurement uncertainty and validation in chemistry
C COf c. J. Eur. Commun. L
C C C TOf c. J. Eur. Commun. L
R T M C RR
Of c. J. Eur. Commun. L
R T M C R R T MOf c. J. Eur. Commun. L
Guidelines for Drinking Water Quality, Recommendation
Guidelines for Drinking Water Quality, Recommendation
C L MJ. Radioanalyt.
Nucl. Chem. − −
P L RActa. Chim. Slov.
−
L MR C Proceedings of the 7th
International Conference on Nuclear and Radiochemistry RC
Further readings

113
Determination of Radium in Water by α-Spectrometry
Ad
de
nd
um
I: M
ea
sure
me
nt
un
cert
ain
ty c
alc
ula
tio
n, s
pre
ad
she
et
ap
pro
ach
(E
xce
l)
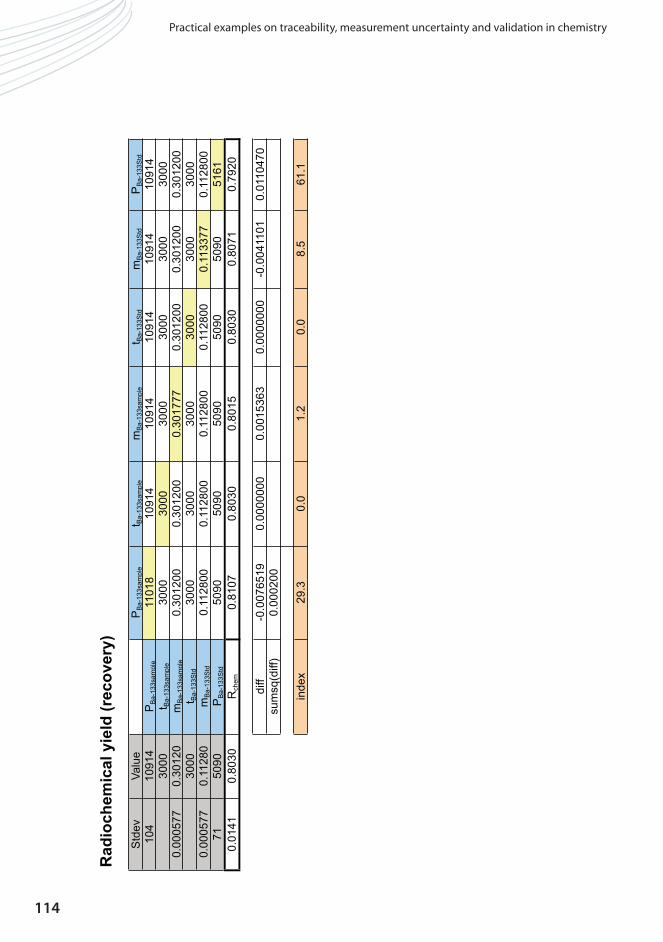
114
Practical examples on traceability, measurement uncertainty and validation in chemistry

115
Determination of Radium in Water by α-Spectrometry
e α

116
Practical examples on traceability, measurement uncertainty and validation in chemistry

117
Determination of Radium in Water by α-Spectrometry
Model equation:
AR = PR tR × εα × V × RR P × m × t × m Pεα = PR tR × mR × AR × RR
List of quantities:
Quantity Unit Definition
ARa-266
Bq L-1 Activity of Ra-266 in sample
PRa-266
Area of Ra-266
tRa-266
s Time of measurement
eαdetEfficiency for alfa detector
Vsample
L Volume of the sample
Rchem
Radiochemical yield (recovery)
PBa-133sample
Area of Ba-133 in sample
tBa-133sample
s Time of measurement of the sample
mBa-133sample
g Mass of Ba-133 in the sample
tBa-133Std
s Time of measurement of Ba-133 standard disc
mBa-133Std
g Mass of Ba-133 standard disc
PBa-133Std
Area of Ba-133 in standard disc
PRa-226Std
Area of Ra-266 in standard disc
tRa-226Std
s Time of measurement of the standard disc
mRa-226SS
g Mass of Ra-226 standard solution
ARa-226SS
Activity of Ra-226 in standard solution
RRa-226Std
Radium standard disc recovery
PRa-266:TM
tRa-266:C
Addendum II: Measurement uncertainty calculation –
GumWorkbench

118
Practical examples on traceability, measurement uncertainty and validation in chemistry
Vsample:T
LL
PBa-133sample:TM
tBa-133sample:C
mBa-133sample:T
tBa-133Std:C
mBa-133Std:T
PBa-133Std:TM
PRa-226Std:TM
tRa-226Std:C

119
Determination of Radium in Water by α-Spectrometry
mRa-226SS:T
ARa-226SS:TM
RRa-226Std:TM
Uncertainty budgets:
ARa-266: Activity of Ra-266 in sample
Quantity ValueStandard
UncertaintyDistribution
Sensitivity
Coefficient
Uncertainty
ContributionIndex
PRa-266
7516.0 86.0 normal 17 × 10-6 1.5 × 10⁻³ Bq L-1 3.3 %
tRa-266
300.0 × 10³ s
Vsample
1.00000 L 2.04 × 10⁻³ L triangular -0.13 -260 × 10-6 Bq L-1 0.1 %
PBa-133sample
10 914 104 normal -12 × 10-6 -1.2 × 10⁻³ Bq L-1 2.3 %
tBa-133sample
3000.0 s
mBa-133sample
0.301200 g 577 × 10-6 g rectangular 0.42 240 × 10-6 Bq L-1 0.0 %
tBa-133Std
3000.0 s
mBa-133Std
0.112800 g 577 × 10-6 g rectangular -1.1 -650 × 10-6 Bq L-1 0.7 %
PBa-133Std
5090.0 71.0 normal 25 × 10-6 1.8 × 10⁻³ Bq L-1 4.9 %
PRa-226Std
12785 113 normal -9.9 × 10⁻⁶ -1.1 × 10⁻³ Bq L-1 2.0 %
tRa-226Std
2000.0 s
mRa-226SS
0.010220 g 577 × 10-6 g rectangular 12 7.2 × 10⁻³ Bq L-1 79.9 %
ARa-226SS
2729.0 10.7 normal 47 × 10-6 500 × 10-6 Bq L-1 0.4 %
RRa-226Std
0.9344 0.0150 normal 0.14 2.0 × 10⁻³ Bq L-1 6.5 %
ARa-266
0.12719 Bq L-1 8.04 × 10⁻³ Bq L-1

120
Practical examples on traceability, measurement uncertainty and validation in chemistry
εαdet: Ef ciency of alfa detector
Quantity ValueStandard
UncertaintyDistribution
Sensitivity
Coefficient
Uncertainty
ContributionIndex
PRa-226Std
12 785 113 normal 19 × 10-6 2.2 × 10⁻³ 2.2 %
tRa-226Std
2000.0 s
mRa-226SS
0.010220 g 577 × 10-6 g rectangular not valid! -0.014 90.1 %
ARa-226SS
2729.0 10.7 normal -90 × 10-6 -960 × 10-6 0.4 %
RRa-226Std
0.9344 0.0150 normal -0.26 -3.9 × 10⁻³ 7.2 %
eαdet0.2453 0.0146
Rchem: Radiochemical yield (recovery)
Quantity ValueStandard
UncertaintyDistribution
Sensitivity
Coefficient
Uncertainty
ContributionIndex
PBa-133sample
10 914 104 normal 74 × 10-6 7.7 × 10⁻³ 28.8 %
tBa-133sample
3000.0 s
mBa-133sample
0.301200 g 577 × 10-6 g rectangular -2.7 -1.5 × 10⁻³ 1.2 %
tBa-133Std
3000.0 s
mBa-133Std
0.112800 g 577 × 10-6 g rectangular 7.1 4.1 × 10⁻³ 8.3 %
PBa-133Std
5090.0 71.0 normal -160 × 10-6 -0.011 61.7 %
Rchem
0.8030 0.0143
Result:
Quantity ValueExpanded
UncertaintyCoverage factor Coverage
ARa-266
0.127 Bq L-1 0.016 Bq L-1 2.00 95 %

121
Chapter 4
Determination of Polar Pesticides by Liquid Chromatography Mass Spectrometry
Allan Künnapas, Koit Herodes, Ivo Leito
TrainMiC example summary form (’blue page’) A short introduction to the analytical procedure (’slides’) All input needed to do the three exercises (’yellow pages’) The solved exercises (’green pages’)

122
Practical examples on traceability, measurement uncertainty and validation in chemistry
TrainMiC example summary form
I. General information about the example
MeasurandConcentration of imazalil and thiabendazole in tangerines by liquid
chromatography-mass spectrometry
Example number Ex-04
Authors of the example Allan Künnapas, Koit Herodes, Ivo Leito
Analytical procedure
Determination of concentration of imazalil and thiabendazole in
tangerines by liquid chromatography-mass spectrometry. The sample
preparation procedure is modified AOAC 985.22 procedure. The
measurement procedure is an in-house developed procedure.
Customer’s requirementThe quality of the results should comply with the requirements given
in the EU Directives 93/58/EEC and 00/42/EEC on pesticide residues
analysis

123
Determination of Polar Pesticides by Liquid Chromatography Mass Spectrometry
File number,
type and nameContent of the file
File is
attached Remark
Yes No
1 -
I
Ex-04-1-I-
Pesticides-
Food-LCMS-
2006-Ver1.ppt
About the analytical procedure: short introductionGiven by the
leacturer
2 -
Yel
low Ex-04-2-Y-
Pesticides-
Food-LCMS-
2006-Ver1.doc
PART I Description of the analytical procedureEach
participant
receives own
copy and may
keep it
PART IIThe customer’s requirements concerning
the quality of the measurement result
PART III
Validation of the measurement
procedure – relevant equations and
measurement data
PART IV
Measurement uncertainty of the result
– relevant equations and measurement
data
3 -
Gre
en Ex-04-3-G-
Pesticides-
Food-LCMS-
2006-Ver1.doc
PART IEstablishing traceability in analytical
chemistry
PART IISingle laboratory validation of
measurement procedures
PART III
Bulding an uncertainty budget
Addendum 1: By spreadsheet approach
Addendum 2: By dedicated software
III. History of the example
Version Uploaded on the webhotel Short description of the change
0 April 2007 -
1
II. Attached files
Determination of Polar Pesticides by Liquid

124
Practical examples on traceability, measurement uncertainty and validation in chemistryPractical examples on traceability, measurement uncertainty and validation in chemistry
A short introduction to the analytical procedure

Determination of Polar Pesticides by Liquid Chromatography Mass Spectrometry
125
Determination of Polar Pesticides by Liquid Chromatography Mass Spectrometry

126
Practical examples on traceability, measurement uncertainty and validation in chemistryPractical examples on traceability, measurement uncertainty and validation in chemistry

Determination of Polar Pesticides by Liquid Chromatography Mass Spectrometry
127
Determination of Polar Pesticides by Liquid Chromatography Mass Spectrometry

128
Practical examples on traceability, measurement uncertainty and validation in chemistry
All input needed to do the three exercises ‘yellow pages’
Analytical procedure
Determination of concentration of imazalil and thiabendazole
in tangerines by liquid chromatography mass spectrometry.
The quality of the results should comply with the requirements
in the EU directives 93/58/EEC and 00/42/EEC/ on pesticide
residues analysis
PART I ............................................................................................................................... 129
Description of the analytical procedure
PART II .............................................................................................................................. 133
The customer’s requirement concerning quality of the measurement result
PART III ............................................................................................................................. 135
Validation of the measurement procedure – relevant equations and measurement data
PART IV ............................................................................................................................ 137
Measurement uncertainty of the result – relevant equations and measurement data

129
Determination of Polar Pesticides by Liquid Chromatography Mass Spectrometry
PART I. Description of the analytical procedure
TM R L MRL
C C
CLC M
1. Scope
C LC MM T
P I LC M M
I
2. Principle
CC
TT LC M
I LC MM
TL I
M MC
T

130
Practical examples on traceability, measurement uncertainty and validation in chemistry
Laboratory sample is homogenized using appropriate equipment
50 g aliquot of homogenized sample is extracted with 100 mL of acetone using high speed blender. Before the extraction standard solution can be added for recovery studies
Mixture is vacuum filtered through filter paper, the extraction vessel is rinsed and filter cake is washed with approximately 30 mL of acetone
The volume of the extract is measured and a 50 mL aliquot is taken for further purification through liquid-liquid extraction
In a separatory funnel the aliquot is extracted for 1 min with 100 mL of petroleum ether and dichloromethane mixture (1:1)
The lower (water) phase is drained into volumetric cylinder, the upper organic layer is filtered/dried through approximately 3 cm layer of anhydrous Na2SO4 in a funnel
The water phase is saturated in the separatory funnel with NaCl and extracted twice for 1 min with 50 mL of dichloromethane. The lower (organic) layer is also
filtered/dried through the same Na2SO4 layer
The combined extract is brought down to couple of millilitres using rotary evaporator, taking care not to evaporate to dryness
The extract is brought to almost complete dryness in slow flow of N2, then the residue is reconstituted with 10 mL of methanol
If necessary the extracts are diluted in order to fit in the calibration range
Figure 5. Flow chart of the analytical procedure

131
Determination of Polar Pesticides by Liquid Chromatography Mass Spectrometry
3. Interferences
I TT
I
T
4. Reagents
1000 mg kg-1 individual pesticide standard solutionsP
L
20 mg kg-1 combined pesticide standard solutionL
Calibration solutions
Solvents/eluent:
LC MC PLC
Other:C
5. Sampling and pre-treatment
CC
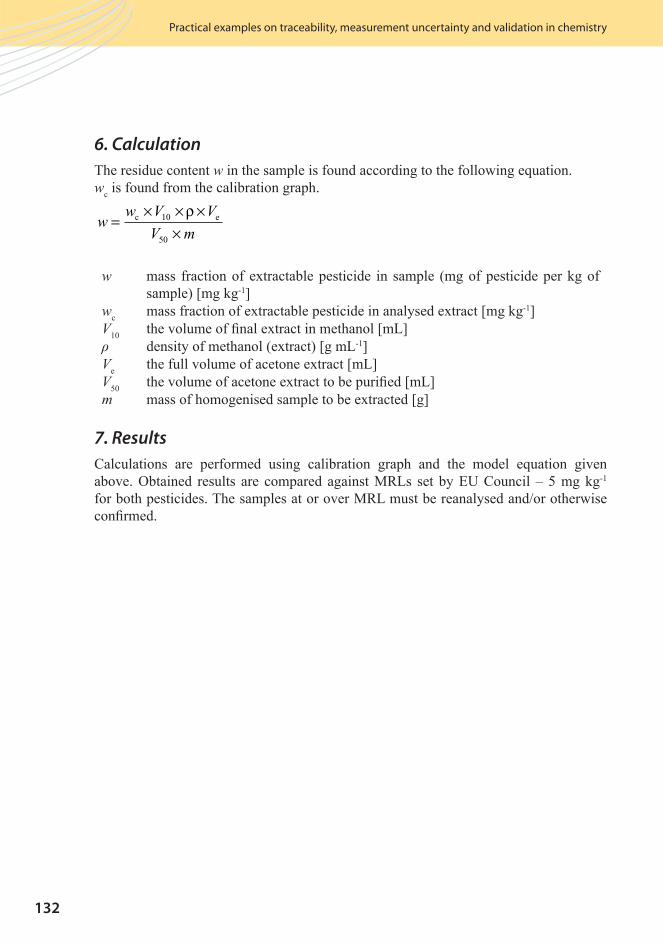
132
Practical examples on traceability, measurement uncertainty and validation in chemistry
6. Calculation
T ww
ww V V
V m=
× × ××
c e10
50
ρ
w
wV L
LVe e e e e e LV e e e e e e e Lm e e e e e e
7. Results
C e e e e e e ee e e e e MRL e C
e e T e e e MRL e e e e ee
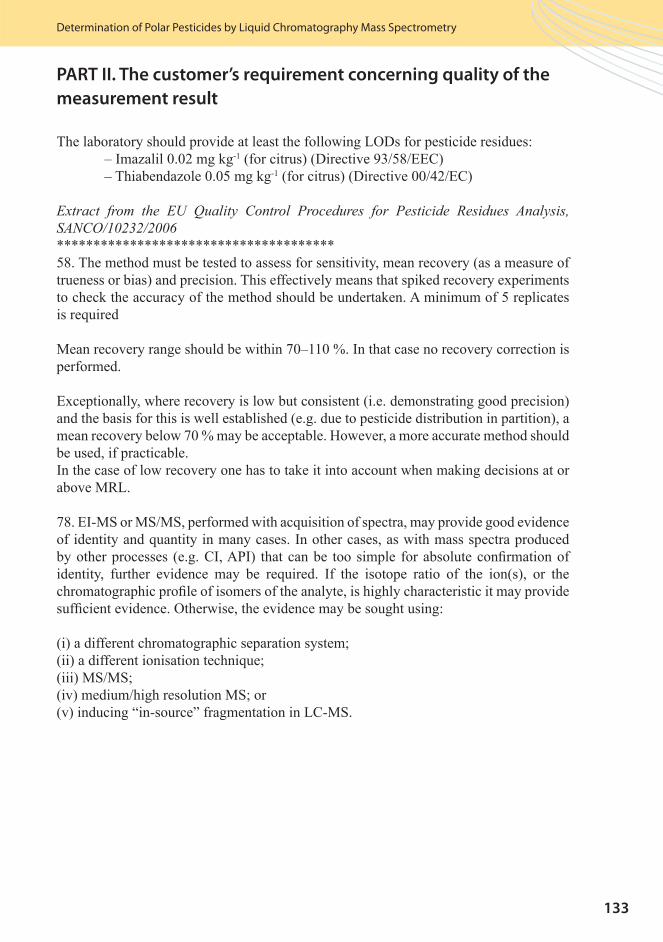
133
Determination of Polar Pesticides by Liquid Chromatography Mass Spectrometry
PART II. The customer’s requirement concerning quality of the
measurement result
T e e e e L e e e eI e e CT e e e e C
Extract from the EU Quality Control Procedures for Pesticide Residues Analysis, SANCO/10232/2006
T e e e e e e e e e e e ee e e T e e e e e e e e e ee e e e e e e e ee e
Me e e e e I e e e ee e
e e e e e e e e ee e e e e e e e
e e e e e e e e e e e ee e eI e e e e e e e e
e MRL
I M M M e e e e e e ee e I e e e ee e e e CI PI e e e
e e e e e e e e I e e e ee e e e e e
e e e e e e e e e e e
e e e ee e e e
M Me e M
e e LC M

134
Practical examples on traceability, measurement uncertainty and validation in chemistry
Table 3. Recommended maximum permitted tolerances for relative ion intensities using a range of spectrometric techniques
Relative intensity
(% of base peak)
EI-GC-MS
(relative)
CI-GC-MS, GC-MSn, LC-MS, LC-MSn
(relative)
>50 % ±10 % ±20 %
>20−50 % ±15 % ±25 %
>10−20 % ±20 % ±30 %
≤ 10 % ±50 % ±50 %

135
Determination of Polar Pesticides by Liquid Chromatography Mass Spectrometry
PART III. Validation of the measurement procedure – relevant
equations and measurement data
Equations
Rw
w
STDEVn x x
n n
AVERAGEx
n
RSDSTD
= ×
=− ( )−
=
=
∑ ∑
∑
exp %
( )
theor
100
1
2 2
EEV
AVERAGE×100 %
we e e e e e e e e e e ee e e e e e e e e e ee e
w e e e e e e e e e ee e
n e e e e
x I e x e e R e e
STDEV e
AVERAGE e e e e e
RSD e e e

136
Practical examples on traceability, measurement uncertainty and validation in chemistry
Measurement data
Imazalil Thiabendazole ImazalilThiaben-
dazole
wexp
(mg kg-1)
wtheor
(mg kg-1)
R
(%)
wexp
(mg kg-1)
wtheor
(mg kg-1)
R
(%)Peak area Peak area
0.06427 0.05597 0.03120 0.04244 3 996 669 300 802
0.07516 0.05871 0.03281 0.04452 3 459 066 281 164
0.04812 0.05821 0.03181 0.04413 3 838 651 230 775
0.10238 0.07342 0.04095 0.05567 3 727 188 274 366
0.04201 0.06088 0.03400 0.04616 3 414 893 296 724
0.05741 0.06241 0.03331 0.04732 3 553 740 258 916
AVERAGE recovery AVERAGE recovery AVERAGE mass fraction
STDEV of recovery STDEV of recovery STDEV of mass fraction
RSD of recovery (urel_rec
) RSD of recovery (urel_rec
) RSD of mass fraction
(urel_meth
)
* The recovery determinations were carried out two per day on three consecutive days.

137
Determination of Polar Pesticides by Liquid Chromatography Mass Spectrometry
PART IV. Measurement uncertainty of the result – relevant
equations and measurement data
Equations
u u u
uu u
w
d w w
u
w
= +
=+
×
= −
sys rnd
rnd
rel_rec rel_meth
ref
ref
2 2
2 2
100 %
==
=
= +
s
n
ud
n
u u u
1
2
2 2
dev
sys ref dev
u e e eu e e eu e eu e e e e e e eu e e e e e ew e e e e e e e e
e ed e e e e ee e e e e e
w e e e e e e e e e e e e e
s e e e e e e e
n e e e eILC
n e e e ILC
u e e e e e e e e ee e e e e
u e e e e e e e e

138
Practical examples on traceability, measurement uncertainty and validation in chemistry
Measurement data
Imazalil Thiabendazole Comments
urel_rec
27 % 2 %
The relative standard deviation of recovery
calculated from parallel measurement results (two
measurements per day on three consecutive days)
urel_meth
10 % 6 %
The relative standard deviation of results obtained
for the same solution from repeated injections of
the same solution
w 1.3350 mg kg-1 3.5230 mg kg-1
wref
1.2975 mg kg-1 3.2863 mg kg-1 consensus value of interlaboratory comparison
measurement
s 0.0530 mg kg-1 0.5571 mg kg-1
nl
2 3
n 1 1
139
Determination of Polar Pesticides by Liquid Chromatography Mass Spectrometry
The solved exercises ‘green pages’
TrainMiC Exercises
Analytical procedure
Determination of concentration of imazalil and thiabendazole
in tangerines by liquid chromatography-mass spectrometry.
The quality of the results should comply with the requirements
in pesticide residues analysis directives and guidelines
EXERCISE 1:
Establishing traceability in analytical chemistry
EXERCISE 2:
Single laboratory validation of measurement procedures
Part I: General issues
Part II: Parameters to be validated
Part III: Some calculations and conclusions
EXERCISE 3:
Building an uncertainty budget
Addendum I. By spreadsheet approach
Addendum II. By dedicated software

140
Practical examples on traceability, measurement uncertainty and validation in chemistry
ESTABLISHING TRACEABILITY IN ANALYTICAL CHEMISTRY
1. Specifying the analyte and measurand
Analyte Residues of imazalil and thiabendazole
Measurand Acetone-extractable imazalil and thiabendazole residues in tangerines
Units mg kg-1 (ppm)
2. Choosing a suitable measurement procedure with associated model equation
Measurement
procedure
50 g of homogenized sample is extracted with 100 mL of acetone using high speed
blender. Mixture is filtered and the volume of extract is measured.
50 mL of the extract is extracted with 100 mL dichloromethane petroleum ether
mixture (1:1), the organic layer is filtered through a layer of sodium sulphate (for
drying purpose). Water phase is saturated with NaCl and extracted twice with 50
mL of dichloromethane. Organic extracts are dried as before. Solvent is evaporated
to almost dryness and the sample is dissolved in 10−20 mL of methanol. Sample is
filtered through a syringe filter and analysed using LC-MS system.
Sample preparation procedure is based on the AOAC official method 985.22
‘Organochlorine and Organophosphorus Pesticide Residues Gas Chromatographic
Method’. The modifications were made in order to cut down sample size and thus
solvent consumption. Also changes were made in the solvent of final extract to suite
LC-MS system. LC-MS analysis method was developed within laboratory.
Type of calibration standard curve Standard addition internal standard
Model equation
ww V V
V m=
× × ××
c e10
50
ρ
w e e e e e e e ee
w e e e e e ee e
V e e e e Lρ e e LVe e e e e e LV e e e e e e e Lm e e e e e e
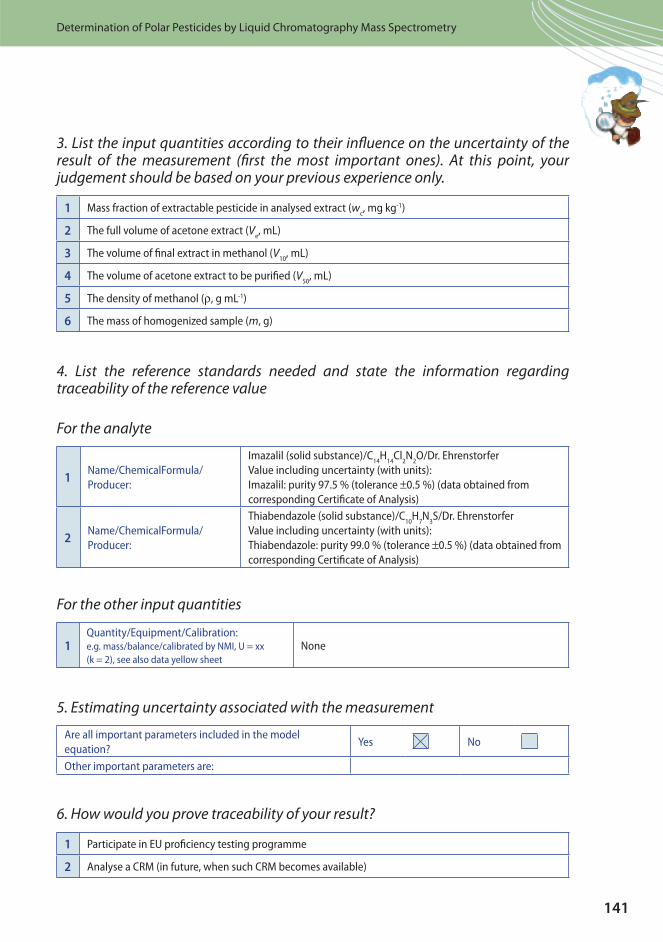
141
Determination of Polar Pesticides by Liquid Chromatography Mass Spectrometry
3. List the input quantities according to their influence on the uncertainty of the result of the measurement (first the most important ones). At this point, your judgement should be based on your previous experience only.
1 Mass fraction of extractable pesticide in analysed extract (wc, mg kg-1)
2 The full volume of acetone extract (Ve, mL)
3 The volume of final extract in methanol (V10
, mL)
4 The volume of acetone extract to be purified (V50
, mL)
5 The density of methanol (ρ, g mL-1)
6 The mass of homogenized sample (m, g)
4. List the reference standards needed and state the information regarding traceability of the reference value
For the analyte
1Name/ChemicalFormula/
Producer:
Imazalil (solid substance)/C14
H14
Cl2N
2O/Dr. Ehrenstorfer
Value including uncertainty (with units):
Imazalil: purity 97.5 % (tolerance ±0.5 %) (data obtained from
corresponding Certificate of Analysis)
2Name/ChemicalFormula/
Producer:
Thiabendazole (solid substance)/C10
H7N
3S/Dr. Ehrenstorfer
Value including uncertainty (with units):
Thiabendazole: purity 99.0 % (tolerance ±0.5 %) (data obtained from
corresponding Certificate of Analysis)
For the other input quantities
1Quantity/Equipment/Calibration:e.g. mass/balance/calibrated by NMI, U = xx
(k = 2), see also data yellow sheet
None
5. Estimating uncertainty associated with the measurement
Are all important parameters included in the model
equation?Yes No
Other important parameters are:
6. How would you prove traceability of your result?
1 Participate in EU proficiency testing programme
2 Analyse a CRM (in future, when such CRM becomes available)
142
Practical examples on traceability, measurement uncertainty and validation in chemistry
7. Any other comments, questions…

143
Determination of Polar Pesticides by Liquid Chromatography Mass Spectrometry
SINGLE LABORATORY VALIDATION OF
MEASUREMENT PROCEDURES
PART I: GENERAL ISSUES
1. Specify the measurement procedure, analyte, measurand and units
The measurement
procedure
Sample preparation procedure is modified AOAC official method 985.22. Analysis
was carried out on an LC-MS system using a self-developed chromatographic
method.
Analyte Residues of imazalil and thiabendazole (polar basic pesticides)
The measurand
Acetone-extractable pesticides in tangerines.
Results are not recovery corrected, thus extractable pesticides are determined, not
total amounts.
Unit mg kg-1 (ppm)
2. Specify the scope
Matrix Tangerines
Measuring rangeimazalil 0.004–0.9 mg kg-1
thiabendazole 0.003–0.7 mg kg-1
3. Requirement on the measurement procedure
Intended use of the results
Post-registration control and monitoring of pesticides based on MRLs set by
the EU Directives 93/58/EEC and 00/42/EEC for imazalil and thiabendazole
respectively.
Mark the customer’s
requirements and give their
values
Parameters to be validated Value requested by the customer
LODLOD < 0.02 mg kg-1 (imazalil), LOD < 0.05
mg kg-1 (thiabendazole)
LOQ
Repeatability
Within-lab
reproducibility
Trueness Recovery between 70–110 %
Measurement
uncertainty
Oth
er -
sta
te
Identity/confirmation: retention time (compared with
standard) + MS^2 fragmentation: imazalil (297 → 201),
thiabendazole (202 → 175) + additional qualifier ion
comparison if necessary. Guidance document refers to
sufficient confirmation when MS^2 is used and ion ratios in
standard and sample agree within the limits specified in
Table 3 (Yellow sheet, Part II).

144
Practical examples on traceability, measurement uncertainty and validation in chemistry
4. Origin of the measurement procedure
VALIDATION
New in-house method Full
Modified validated method Partial
Official standard method Confirmation/Verification

145
Determination of Polar Pesticides by Liquid Chromatography Mass Spectrometry
PART II: PARAMETERS TO BE VALIDATED
5. Selectivity/Interference/Recovery
Where yes, please give further information e.g. which CRM, reference method
CRM/RM: analysis of available CRM or RM
Further information:
Spike of pure substance
At approximate concentration level of 0.05 mg kg-1
Compare with a reference method
Selectivity, interferences
Chromatographic separation and mass-spectrometric identification (including MS^2 confirmation of
identity)
Test with different matrices
The method has been proved via ILC to perform with tangerine, orange and tomato
Other – please specify
Confirmation of identity: chromatographic retention time and MS^2 confirmation of identity
6. Measuring range
Linearity
Imazalil: 0.004–0.9 mg kg-1; Thiabendazole: 0.003–0.7 mg kg-1
Upper limit
Imazalil: 0.9 mg kg-1; Thiabendazole: 0.7 mg kg-1
LOD
Imazalil: 0.004 mg kg-1; Thiabendazole: 0.003 mg kg-1
LOQ
7. Spread – precision
Repeatability
Instrumental: standard deviation of the measurement method: 10 % for imazalil and 6 % for
thiabendazole (repeated injection of the same standard solution).
Reproducibility (within Lab)
Full procedure: standard deviation of recovery experiments carried out on three consecutive days –
27 % for imazalil, 2 % for thiabendazole (full sample preparation included )
Reproducibility (between Lab)
in ILC the difference between results were 5.6 and 4.4 % for imazalil and thiabendazole respectively

146
Practical examples on traceability, measurement uncertainty and validation in chemistry
8. Robustness
Variation of parameters
Variation of some of the parameters: during method development two different columns were used
(C18 250 ¥ 4.6 5μ, C18 150 ¥ 150 2.1), mobile phase composition and velocity were changed in
increments and obtained data analysedd, final extract volumes of 10 and 20 mL were utilized.
9. Quality control
Control charts
Participation in PT schemes
10. Other parameters to be tested
Working range and testing of homogeneity of variances
R square
Residual standard deviation
Standard deviation of the analytical procedure
Coefficient of variation of the analytical procedure
Measurement uncertainty
Other-state: Confirmation of identity: in accordance with requirements in Section 3.
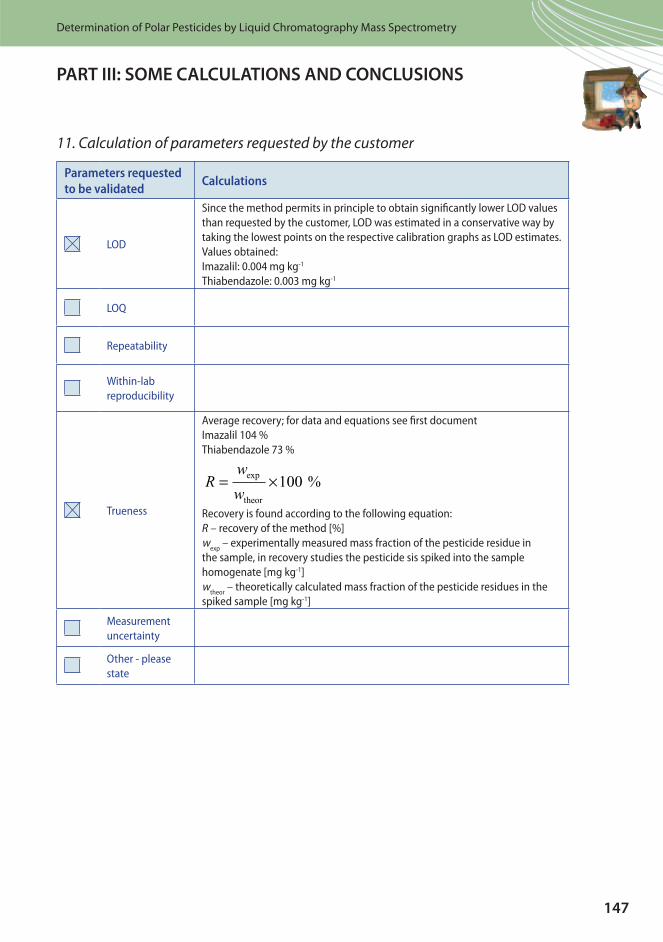
147
Determination of Polar Pesticides by Liquid Chromatography Mass Spectrometry
PART III: SOME CALCULATIONS AND CONCLUSIONS
11. Calculation of parameters requested by the customer
Parameters requested
to be validatedCalculations
LOD
Since the method permits in principle to obtain significantly lower LOD values
than requested by the customer, LOD was estimated in a conservative way by
taking the lowest points on the respective calibration graphs as LOD estimates.
Values obtained:
Imazalil: 0.004 mg kg-1
Thiabendazole: 0.003 mg kg-1
LOQ
Repeatability
Within-lab
reproducibility
Trueness
Average recovery; for data and equations see first document
Imazalil 104 %
Thiabendazole 73 %
Recovery is found according to the following equation:
Rw
w= ×exp %
theor
100
R – recovery of the method [%]
wexp
– experimentally measured mass fraction of the pesticide residue in
the sample, in recovery studies the pesticide sis spiked into the sample
homogenate [mg kg-1]
wtheor
– theoretically calculated mass fraction of the pesticide residues in the
spiked sample [mg kg-1]
Measurement
uncertainty
Other - please
state

148
Practical examples on traceability, measurement uncertainty and validation in chemistry
12. Does the analytical procedure fulfil the requirement(s) for the intended use?
ParameterValue requested by the
customer(the same as stated in question 3)
Value obtained
during validation
The requirement
is fulfilled
Yes/No
LODImazalil < 0.02 mg kg-1
Thiabendazole < 0.05 mg kg-1
0.004 mg kg-1
0.003 mg kg-1
Yes
Yes
LOQ
Repeatability
Within-lab
reproducibility
Trueness 70–110 %Imazalil 104 %
Thiabendazole 73 %
Yes
Yes
Measurement
OtherConfirmation based on similarity to
standard (MS^2 spectrum)
MS^2 spectrum in
sample is similar to
standard
Yes
The analytical procedure is fit for the intended use:
Yes No
For measurement uncertainty and traceability refer to the corresponding sheets

149
Determination of Polar Pesticides by Liquid Chromatography Mass Spectrometry
BUILDING AN UNCERTAINTY BUDGET
1. Specify the measurand and units
Measurand Extractable pesticide content in fruit/vegetable
Unit mg kg-1
2. Describe the measurement procedure and provide the associated model equation
Measurement procedure
e e e e e L e e ee e eM e e e e e e e e L e e e
L e e e e e e − C e ee e e e e e e e
C e e e L e e e ee e e e e e e e e e− L e e e e e e e e ee e e e e e e eLC M e
e e e e e C ee LC M e e e e e e
Model equation
ww V V
V m=
× × ××
c e10
50
ρ
w e e ew e e e eV e e e e Lρ e e LVe e e e e e LV e e e e e e e Lm e e e e e e
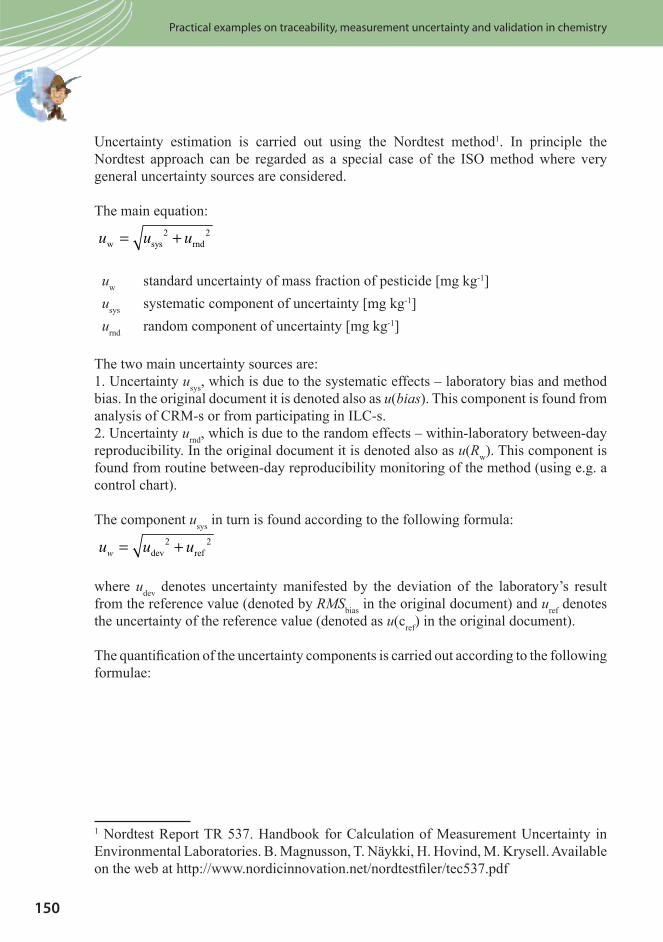
150
Practical examples on traceability, measurement uncertainty and validation in chemistry
e e e e e e I e ee e e e e e e I e e e e
e e e e e e e
T e e
u u uw sys rnd= +2 2
u e e eu e e eu e e
T e e e ee u e e e e e eI e e e e u bias T e
CRM ILCe u e e e e e ee
e I e e e e u R T ee e ee e e e e
T e e u e
u u uw = +dev ref2 2
e e u e e e e e e e e e ee e e e e e e e RMS e e u e e e
e e e e e e e e e e u e e e
T e e e e e ee
e Re TR C Me e e ee L e M T M e e
e e e e e e

151
Determination of Polar Pesticides by Liquid Chromatography Mass Spectrometry
uu u
w
d w w
us
n
ud
n
rnd
rel_rec rel_meth
ref
ref
1
dev
=+
×
= −
=
=
2 2
2
100 %
u e e e e e e e
u e e e e e e
w e e e e e e e e e e ee e e e e
w e e e e e e e e e e e e e
d e e e e ee e e e e e
s e e e e e e en e e e ILC
n e e e ILC n eu e e e e e e e e e
e e e e eu e e e e e e e e
3. Identify (all possible) sources of uncertainty
Uncertainty of concentration of reference solutions
Uncertainty of measurements of peak area
Method bias
Matrix effect: matrix effects on ionisation of pesticides (repeatability)
Other: repeatability of extraction of the pesticides
Other: stability of standard solutions, integration
Other: calibration graph linearity

152
Practical examples on traceability, measurement uncertainty and validation in chemistry
4. Evaluate values of each input quantity
Input
quantity
ValueUnit Remark
Imazalil Thiabendazole
wc
2.801 7.398 mg kg-1 Mass fraction of residue in extract, calculated based
on calibration
V10
10 10 mL Volume of final methanol extract
ρ 0.791 0.791 g mL-1 Density of methanol
Ve
150 150 mL Volume of extract after filtration
V50
50 50 mL Volume of extract taken for further cleaning
m 49.8003 49.8003 g Sample amount taken for extraction
5. Evaluate the standard uncertainty of each input quantity2
Standard uncertaintyUnit Remark
Imazalil Thiabendazole
uref
0.0375 0.3216 mg kg-1 systematic uncertainty component evaluated based
on the results of ILC
udev
0.0375 0.2367 mg kg-1
random component of uncertainty, calculated using
relative uncertainty (repeatability) of recovery and
method
urel_rec
27 2 %relative standard deviation of recoveries calculated
using addition experiments
urel_meth
10 6 %relative standard deviation of measuring method
(repeated analysis of the same solution)
6. Calculate the value of the measurand, using the model equation
ww V V
V m=
× × ××
c e10
50
ρ
w e e ew e e e eV e e e e Lρ e e LVe e e e e e LV e e e e e e e Lm e e e e e e
T e e e e e e e e e e e
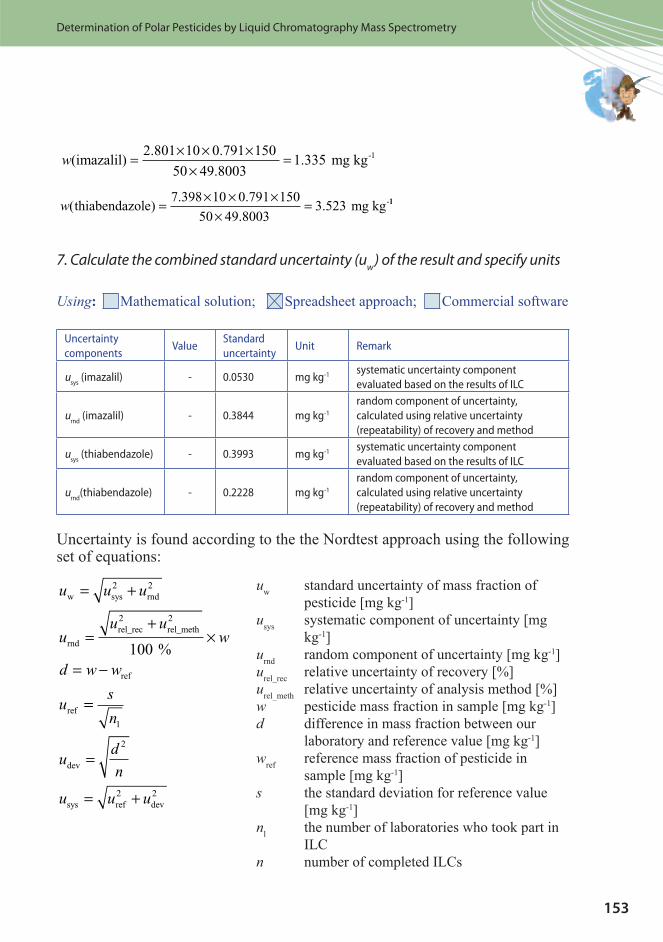
153
Determination of Polar Pesticides by Liquid Chromatography Mass Spectrometry
w( ). .
..imazalil mg kg-1=
× × ××
=2 801 10 0 791 150
50 49 80031 335
w( ). .
..thiabendazole mg kg-=
× × ××
=7 398 10 0 791 150
50 49 80033 523 11
7. Calculate the combined standard uncertainty (uw
) of the result and specify units
Using: M e e ee C e e
Uncertainty
componentsValue
Standard
uncertaintyUnit Remark
usys
(imazalil) - 0.0530 mg kg-1 systematic uncertainty component
evaluated based on the results of ILC
urnd
(imazalil) - 0.3844 mg kg-1
random component of uncertainty,
calculated using relative uncertainty
(repeatability) of recovery and method
usys
(thiabendazole) - 0.3993 mg kg-1 systematic uncertainty component
evaluated based on the results of ILC
urnd
(thiabendazole) - 0.2228 mg kg-1
random component of uncertainty,
calculated using relative uncertainty
(repeatability) of recovery and method
e e e e ee e
u u u
uu u
w
d w w
u
w sys rnd
rnd
rel_rec rel_meth
ref
ref
= +
=+
×
= −
2 2
2 2
100 %
==
=
= +
s
n
ud
n
u u u
1
dev
sys ref dev
2
2 2
u ee e
u e e e
u e eu e e e e e e eu e e e e e ew e e ed e e e e ee
e e e e ew e e e e e e e
es e e e e e e e
n e e eILC
n e e e ILC

154
Practical examples on traceability, measurement uncertainty and validation in chemistry
u e e e e e ee e e e e e ee
u e e e e e e e e
8. Calculate expanded uncertainty (Uw
) and specify the coverage factor k and the units
Imazalil
u
u
w-1 mg kg
= + =
=+
×
0 05303 0 3844 0 388
27 10
1001
2 2
2 2
. . .
% %
%.rnd 33350 0 3844
1 3350 1 2975 0 0375
0
=
= − =
=
.
. . .
mg kg
mg kg
-1
-1d
uref
...
..
0530
20 0375
0 0375
10 0375
0
2
=
= =
=
mg kg
mg kg
-1
-1u
u
dev
sys .. . .0375 0 0375 0 053032 2+ = mg kg-1
Thiabendazole
u
u
w
rnd
= + =
=+
× =
0 3993 0 2228 0 457
2 6
1003 860 0
2 2
2 2
. . .
% %
%. .
mg kg
-1
22228
3 5230 3 2863 0 2367
0 5571
20 32
mg kg
mg kg
-1
-1d
u
= − =
= =
. . .
..ref 116
0 2367
10 2367
0 3216 0 2367
2
2 2
mg kg
mg kg
-1
-1u
u
dev
sys
= =
= + =
..
. . 00 3993. mg kg-1
U ¥ u ¥ k
U e e ¥ u e e ¥ k

155
Determination of Polar Pesticides by Liquid Chromatography Mass Spectrometry
9. Analyse the uncertainty contribution and specify the main three input quantities contributing the most to u
w
1 urnd
contribution: 98.13 % (imazalil), 23.74 % (thiabendazole)
2 usys
contribution: 1.87 % (imazalil), 76.27 % (thiabendazole)
10. Prepare your uncertainty budget report
T e e e e e ee e I M T e e e ee e e e e e e ee e e e e e
I e e e e e e e e ee e e e e e e e e e
e e e e e ee e e e e T
e e e e e e T e e e e e ee e e e e
e e e e e e e e e e ee e e e e e e e e e e e ILC e e
e e e e e e e e e ee ee e e e e e
ILC e e e e e e e ee e e e e e e e e e
e e e e e e e e e e e ee e

156
Practical examples on traceability, measurement uncertainty and validation in chemistry
Further readings
C Me e e ee e e
e C Q e e e e e ee e e e e e
C Me e e e ee e ee e
M T M e Handbook for Calculation of Measurement Uncertainty in Environmental Laboratories e I
e e e e e e e

157
Chapter 5
Determination of Ammonium in Water by Continuous Flow Analysis (CFA) and Spectrometric Detection
Bertil Magnusson
The summary form (‘blue page’) A short introduction to the analytical procedure (‘slides’) All input needed to do the three exercises (‘yellow pages’) The solved exercises (‘green pages’)
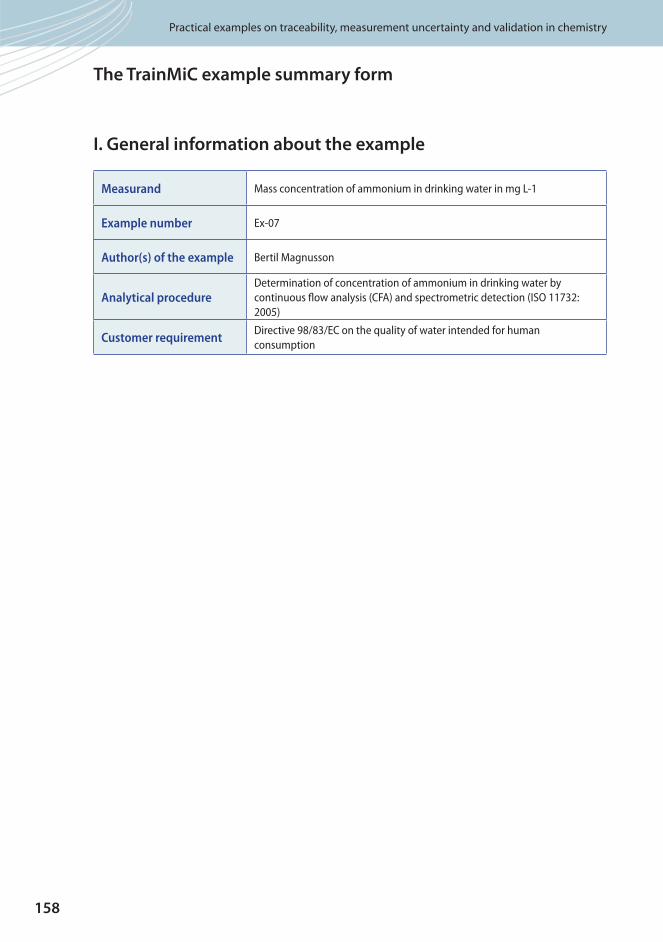
158
Practical examples on traceability, measurement uncertainty and validation in chemistry
The TrainMiC example summary form
I. General information about the example
Measurand Mass concentration of ammonium in drinking water in mg L-1
Example number Ex-07
Author(s) of the example Bertil Magnusson
Analytical procedureDetermination of concentration of ammonium in drinking water by
continuous flow analysis (CFA) and spectrometric detection (ISO 11732:
2005)
Customer requirementDirective 98/83/EC on the quality of water intended for human
consumption
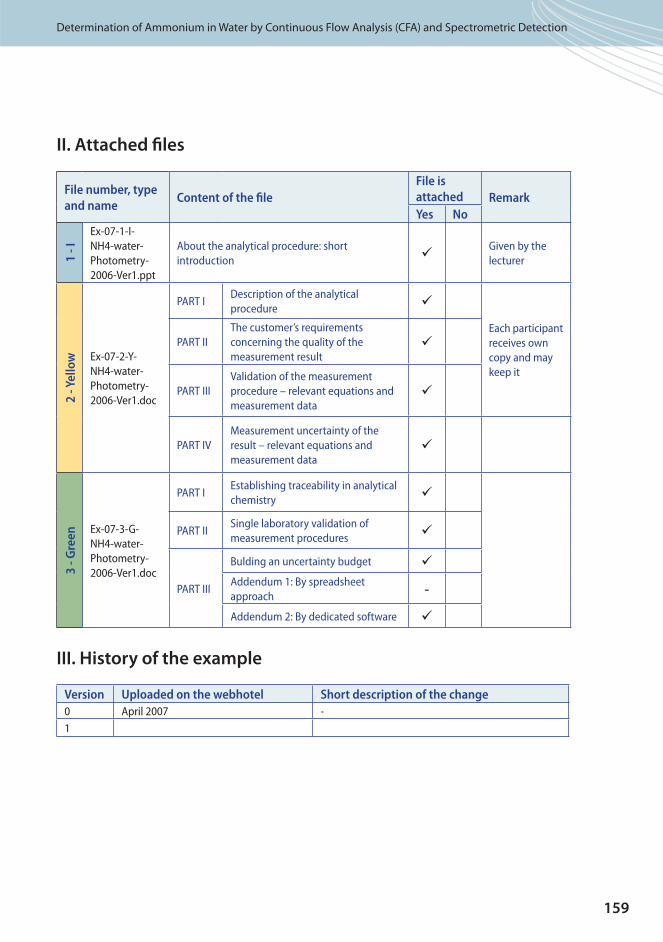
159
Determination of Ammonium in Water by Continuous Flow Analysis (CFA) and Spectrometric Detection
II. Attached files
File number, type
and nameContent of the file
File is
attached Remark
Yes No
1 -
I
Ex-07-1-I-
NH4-water-
Photometry-
2006-Ver1.ppt
About the analytical procedure: short
introduction
Given by the
lecturer
2 -
Yel
low Ex-07-2-Y-
NH4-water-
Photometry-
2006-Ver1.doc
PART IDescription of the analytical
procedure
Each participant
receives own
copy and may
keep it
PART II
The customer’s requirements
concerning the quality of the
measurement result
PART III
Validation of the measurement
procedure – relevant equations and
measurement data
PART IV
Measurement uncertainty of the
result – relevant equations and
measurement data
3 -
Gre
en Ex-07-3-G-
NH4-water-
Photometry-
2006-Ver1.doc
PART IEstablishing traceability in analytical
chemistry
PART IISingle laboratory validation of
measurement procedures
PART III
Bulding an uncertainty budget
Addendum 1: By spreadsheet
approach
Addendum 2: By dedicated software
III. History of the example
Version Uploaded on the webhotel Short description of the change
0 April 2007 -
1
Determination of Ammonium in Water by Continuous Flow Analysis (CFA) and
Spectrometric Detection

160
Practical examples on traceability, measurement uncertainty and validation in chemistryPractical examples on traceability, measurement uncertainty and validation in chemistry
A short introduction to the analytical procedure

Determination of Ammonium in Water by Continuous Flow Analysis (CFA) and Spectrometric Detection
161
Determination of Ammonium in Water by Continuous Flow Analysis (CFA) and Spectrometric Detection

162
Practical examples on traceability, measurement uncertainty and validation in chemistryPractical examples on traceability, measurement uncertainty and validation in chemistry

Determination of Ammonium in Water by Continuous Flow Analysis (CFA) and Spectrometric Detection
163
Determination of Ammonium in Water by Continuous Flow Analysis (CFA) and Spectrometric Detection

164
Practical examples on traceability, measurement uncertainty and validation in chemistry
All input needed to do the three exercises ‘yellow pages’
Analytical procedure
Determination of concentration of ammonium in drinking water
by flow analysis (CFA and FIA) and spectrometric detection.
The quality of the results should comply with the requirements
in the Directive 98/83/EC on the quality intended for human
consumption
PART I ................................................................................................................................ 165
Description of the analytical procedure
PART II .............................................................................................................................. 168
The customer’s requirement concerning quality of the measurement result
PART III ............................................................................................................................. 169
Validation of the measurement procedure – relevant equations and measurement data
PART IV ................................................................................................................. 171
Measurement uncertainty of the result – relevant equations and measurement data

165
Determination of Ammonium in Water by Continuous Flow Analysis (CFA) and Spectrometric Detection
1. Scope
T I e e e e e e e ee e e e e ee L e e e e e I
C e C C e e e e C e e e
2. Principle CFA – Continuous Flow Analysis
I e e e e e e e ee e e e e ee e e
e
T e e e e e e ee e e − C e ee e e ee e e e −
3. Interferences – CFA method
L e e e e e e e e ee e e e I e e e ee e e e e e e e
e e e
PART I. Description of the analytical procedure

166
Practical examples on traceability, measurement uncertainty and validation in chemistry
4. Reagents – here only calibrant is described
Ammonium stock solution, CN
= 1000 mg L-1
e L e ee C C e L e
e e e e e
Standard solutions, 10 mg L-1
P e e L e L ee L e e e
e e e
Calibration solutions
P e e e ee e e e e e e e e
e e ee e e − L
Working solutions 0.1−1.0 mg L-1
P e e e e L e L e e e eL e e e
P e e e e e e
e e ee e ee I
5. Sampling and pre-treatment
e e e I I IC e P PP PT e e e e C e e
C M M e e e e e e e ee e e e e
− C e
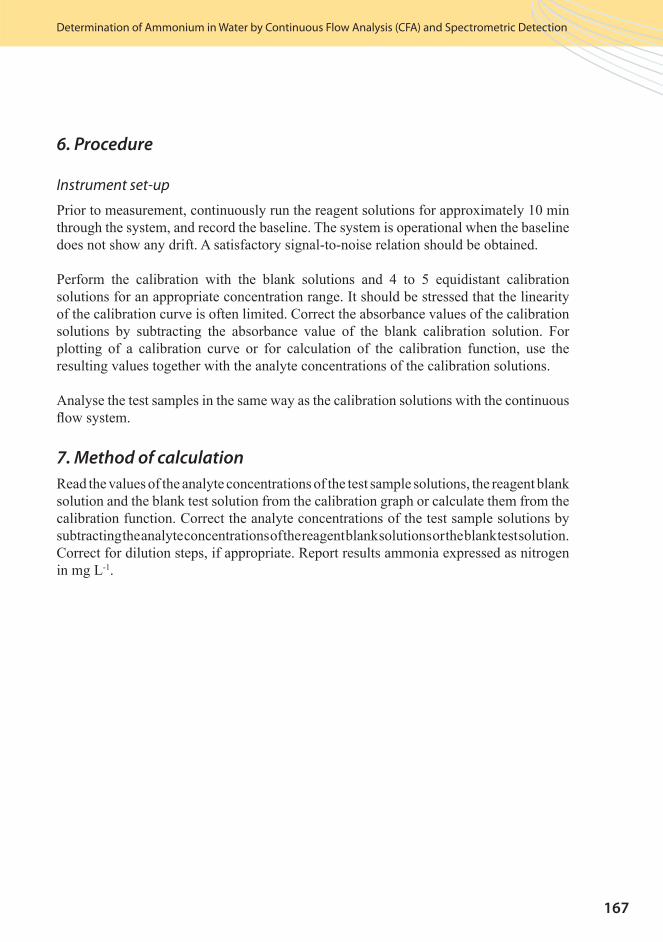
167
Determination of Ammonium in Water by Continuous Flow Analysis (CFA) and Spectrometric Detection
6. Procedure
Instrument set-up
P e e e e e e ee e e e e e T e e e e e e e
e e e e e
Pe e e ee e e I e e e e e
e e e e C e e e e ee e e ee e e e
e e e e e e e e
e e e e e e e ee
7. Method of calculation
Re e e e e e e e e e e ee e e e e e
C e e e e e e ee e e e e e e e
C e e e Re e e e e eL
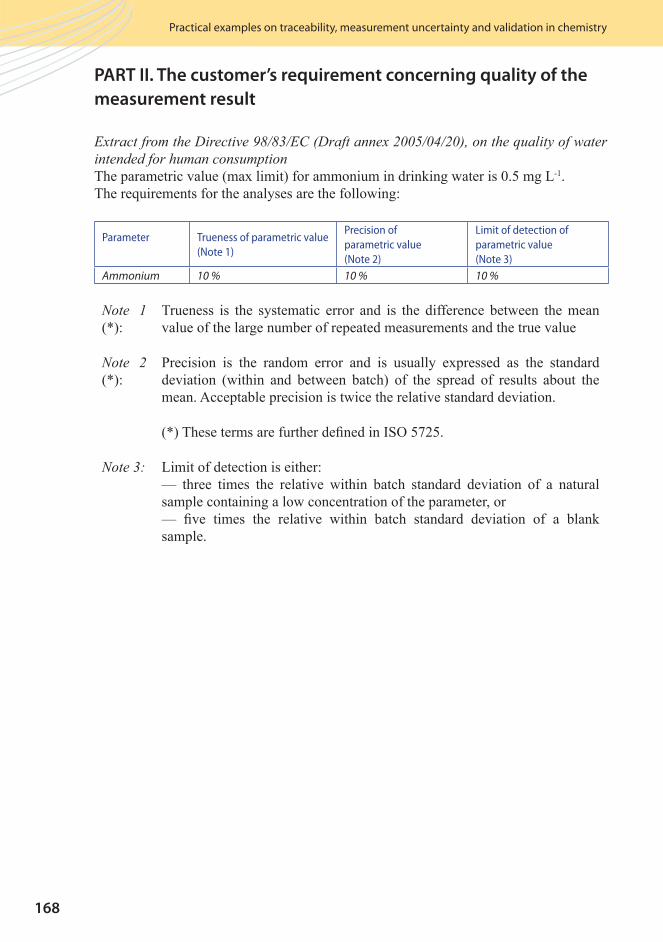
168
Practical examples on traceability, measurement uncertainty and validation in chemistry
Extract from the Directive 98/83/EC (Draft annex 2005/04/20), on the quality of water intended for human consumption
T e e e e LT e e e e e e e e
Parameter Trueness of parametric value
(Note 1)
Precision of
parametric value
(Note 2)
Limit of detection of
parametric value
(Note 3)
Ammonium 10 % 10 % 10 %
Note 1 T e e e e e e e e e e ee e ee e e e e e e e e e e e e
Note 2 P e e e e e e ee e ee e e e ee e e e e e e e e
T e e e e e e e I
Note 3: L e e e eee e e e e ee e e e ee e e e e ee
PART II. The customer’s requirement concerning quality of the
measurement result

169
Determination of Ammonium in Water by Continuous Flow Analysis (CFA) and Spectrometric Detection
Limit of Detection
Equation
C e e e e ee e e C
Measurement data
e e e e L ee e eT e e L e e e e e
Internal quality control
T e e e e e e e e e ee
Measurement data
Re e e e e e e
Unit QC1 QC2
Mean value mg L-1 0.114 0.605
s mg L-1 0.005 0.021
n - 27 28
Time period months 7 7
Nominal value mg L-1 0.100 0.600
PART III. Validation of the measurement procedure – relevant
equations and measurement data

170
Practical examples on traceability, measurement uncertainty and validation in chemistry
External quality control – participating in PT studies
Year/Exercise
Nominal value
xref
[Mg l-1]
laboratory result xi
[mg L-1]
Bias
[%]
sR
[%]
Number of
labs
1999/1 81 83 2.4 10 31
1999/2 73 75 2.7 7 36
2000/1 264 269 1.9 8 32
2000/2 210 213 1.4 10 35
2001/1 110 112 1.8 7 36
2001/2 140 144 2.9 11 34
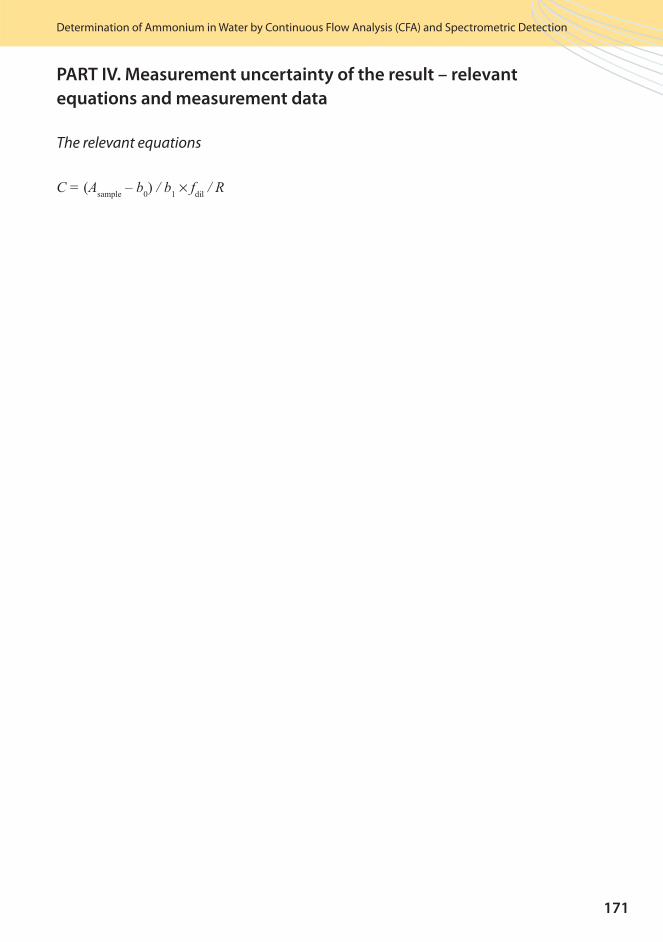
171
Determination of Ammonium in Water by Continuous Flow Analysis (CFA) and Spectrometric Detection
The relevant equations
C = A e – b / b ¥ f / R
PART IV. Measurement uncertainty of the result – relevant
equations and measurement data
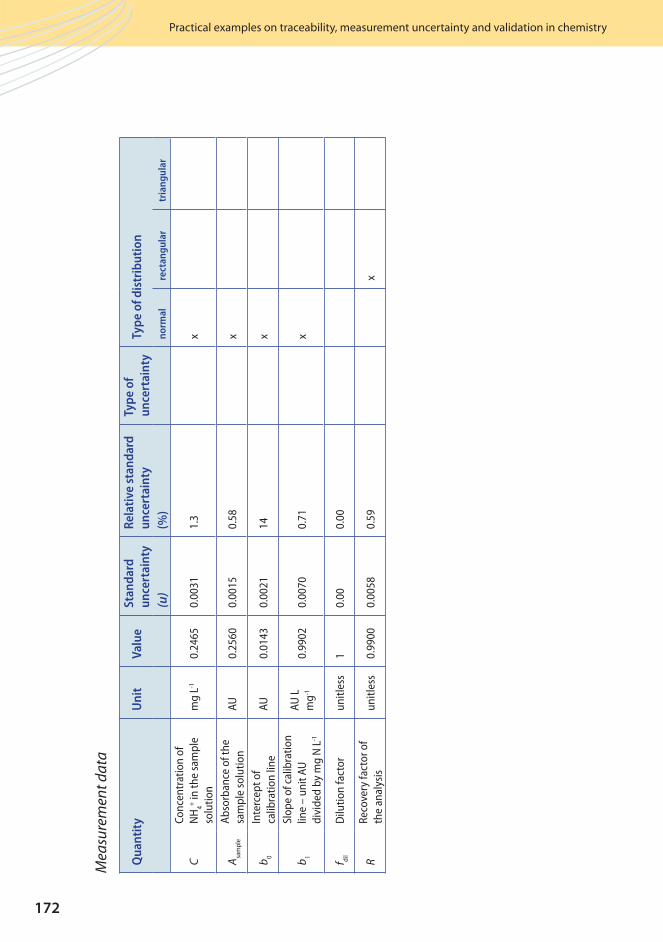
172
Practical examples on traceability, measurement uncertainty and validation in chemistry
Mea
sure
men
t d
ata
Qu
anti
tyU
nit
Val
ue
Stan
dar
d
un
cert
ain
ty
Rel
ativ
e st
and
ard
un
cert
ain
ty
Typ
e o
f
un
cert
ain
tyTy
pe
of
dis
trib
uti
on
(u)
(%)
no
rmal
rect
ang
ula
rtr
ian
gu
lar
C
Co
nce
ntr
atio
n o
f
NH
4+ in
th
e sa
mp
le
solu
tio
n
mg
L-1
0.24
650.
0031
1.3
x
Asa
mp
le
Ab
sorb
ance
of t
he
sam
ple
so
luti
on
AU
0.25
600.
0015
0.58
x
b0
Inte
rcep
t o
f
calib
rati
on
lin
eA
U0.
0143
0.00
2114
x
b1
Slo
pe
of c
alib
rati
on
line
– u
nit
AU
div
ided
by
mg
N L
-1
AU
L
mg
-10.
9902
0.00
700.
71x
f dil
Dilu
tio
n fa
cto
ru
nit
less
10.
000.
00
RR
eco
very
fact
or
of
the
anal
ysis
un
itle
ss0.
9900
0.00
580.
59x
173
Determination of Ammonium in Water by Continuous Flow Analysis (CFA) and Spectrometric Detection
TrainMiC Exercises
Analytical procedure
Determination of concentration of ammonium in drinking
water by continuous flow analysis (CFA) and spectrometric
detection
The quality of the results should comply with the requirements
in the Directive 98/83/EC on the quality of water intended for
human consumption
EXERCISE 1:
Establishing traceability in analytical chemistry
EXERCISE 2:
Single laboratory validation of measurement procedures
Part I: General issues
Part II: Parameters to be validated
Part III: Some calculations and conclusions
EXERCISE 3:
Building an uncertainty budget
Addendum I: By spreadsheet solution
Addendum II: By dedicated software
The solved exercises ‘green pages’

174
Practical examples on traceability, measurement uncertainty and validation in chemistry
1. Specifying the analyte and measurand
Analyte Ammonium
Measurand Dissolved ammonium in water sample arriving in the laboratory
Units mg L-1
2. Choosing a suitable measurement procedure with associated model equation
Measurement
procedureISO 11732:2005 using the continuous flow analysis and photometric detection
Type of calibration standard curve standard addition internal standard
Model equation
C A e ¥ f R
C C e e e L
A e e e e
b I e e e
b e e e L
f
R Re e e
T e e e e e e e e e e e− L
T e e L e eL T e e e
3. List the input quantities according to their influence on the uncertainty of the result of the measurement (first the most important ones). At this point, your judgement should be based on your previous experience only.
1 Recovery factor – contributing 30 % to the expanded uncertainty
2 Absorbance of the sample - here the main source is the drift contributing about 20%
3 Calibration – standard solution – purity of ammonium chloride
4 Calibration – volumetric flasks and pipettes
ESTABLISHING TRACEABILITY IN ANALYTICAL CHEMISTRY
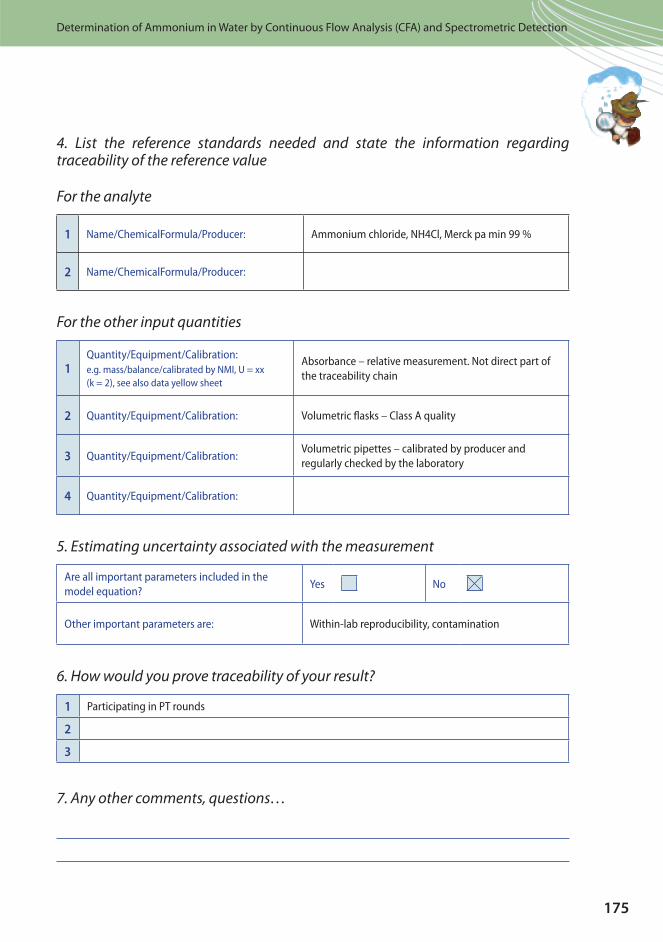
175
Determination of Ammonium in Water by Continuous Flow Analysis (CFA) and Spectrometric Detection
4. List the reference standards needed and state the information regarding traceability of the reference value
For the analyte
1 Name/ChemicalFormula/Producer: Ammonium chloride, NH4Cl, Merck pa min 99 %
2 Name/ChemicalFormula/Producer:
For the other input quantities
1Quantity/Equipment/Calibration:
e.g. mass/balance/calibrated by NMI, U = xx (k = 2), see also data yellow sheet
Absorbance – relative measurement. Not direct part of
the traceability chain
2 Quantity/Equipment/Calibration: Volumetric flasks – Class A quality
3 Quantity/Equipment/Calibration:Volumetric pipettes – calibrated by producer and
regularly checked by the laboratory
4 Quantity/Equipment/Calibration:
5. Estimating uncertainty associated with the measurement
Are all important parameters included in the
model equation?Yes No
Other important parameters are: Within-lab reproducibility, contamination
6. How would you prove traceability of your result?
1 Participating in PT rounds
2
3
7. Any other comments, questions…

176
Practical examples on traceability, measurement uncertainty and validation in chemistry
PART I: GENERAL ISSUES
1. Specify the measurement procedure, analyte, measurand and units
The measurement procedure Measurement procedure is based on EN/ISO11732
Analyte Ammonium
The measurand Dissolved ammonium in water sample arriving in the laboratory
Unit mg L-1
2. Specify the Scope
Matrix Drinking water
Measuring range up to 1 mg L-1 for undiluted samples
3. Requirement on the measurement procedure
Intended use of the results To analyse drinking water according to the EU requirements in the EU directive
Mark the customer’s
requirements and give
their values
Parameters to be validated Value requested by the customer
LODLOD 0.05 mg L-1: - 3s on a natural sample,
5s on a blank: s is repeatability
LOQ
Repeatability
Within-lab
reproducibility
at 0.5 mg L-1, s = 0.025 mg L-1:
at 0.2 mg L-1, s the demand estimated to be
s = 0.010 mg L-1 or 5 %
Truenessat 0.5 mg L-1 less than 0.05 mg L-1 or less than
10 % relative
Measurement
uncertainty
Other-state
4. Origin of the measurement procedure
VALIDATION
New in-house method Full
Modified validated method Partial
Official standard method Confirmation/Verification
SINGLE LABORATORY VALIDATION
OF MEASUREMENT PROCEDURES
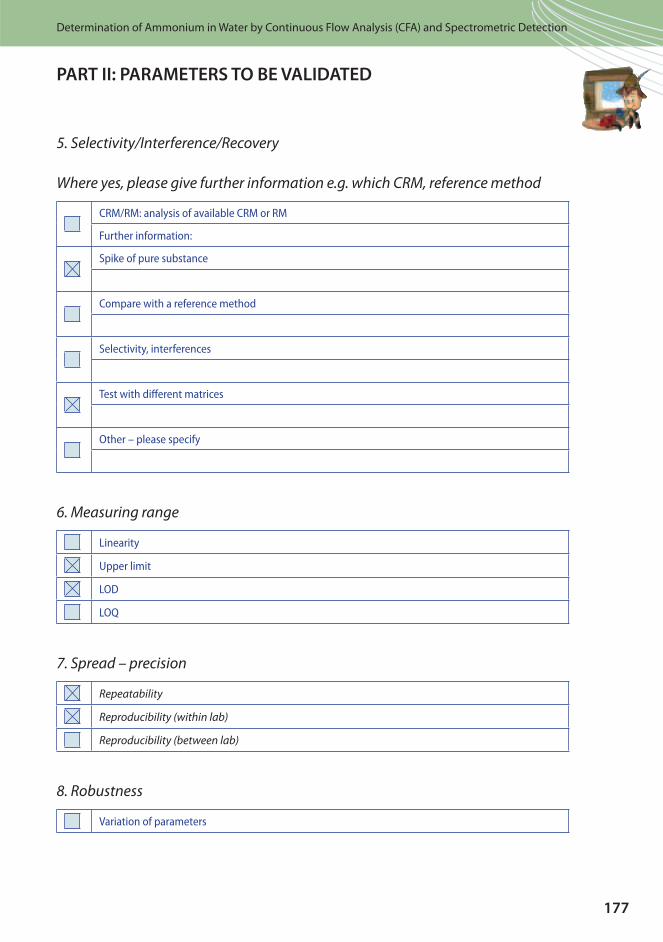
177
Determination of Ammonium in Water by Continuous Flow Analysis (CFA) and Spectrometric Detection
5. Selectivity/Interference/Recovery
Where yes, please give further information e.g. which CRM, reference method
CRM/RM: analysis of available CRM or RM
Further information:
Spike of pure substance
Compare with a reference method
Selectivity, interferences
Test with different matrices
Other – please specify
6. Measuring range
Linearity
Upper limit
LOD
LOQ
7. Spread – precision
Repeatability
Reproducibility (within lab)
Reproducibility (between lab)
8. Robustness
Variation of parameters
PART II: PARAMETERS TO BE VALIDATED

178
Practical examples on traceability, measurement uncertainty and validation in chemistry
9. Quality control
Control charts
Participation in PT schemes
10. Other parameters to be tested
Working range and testing of homogeneity of variances
R square
Residual standard deviation
Standard deviation of the analytical procedure
Coefficient of variation of the analytical procedure
Measurement uncertainty

179
Determination of Ammonium in Water by Continuous Flow Analysis (CFA) and Spectrometric Detection
PART III: SOME CALCULATIONS AND CONCLUSIONS
11. Calculation of parameters requested by the customer 3
Parameters requested
to be validatedCalculations
LOD
s = 0.004 mg L-1
LOD = 5s = 0.02 mg L-1
LOQ
Repeatability
Within-lab reproducibiltyAt a level of 0.1 mg L-1 s
Rw is 4.4 % and at a level of
0.6 mg L-1 sRw
is 3.5 %.
Trueness
From PT results the trueneness is estimated to be less than
3 %. The trueness is probably around 2 % - then mean value of
the PT results for levels over 0.08 mg L-1.
Measurement uncertainty
The measurement uncertainty at a level of 0.2 mg L-1 is estimated
to be 2.5 %. According to EA guideline this value should be
rounded off to 3 %.3
Other - please state
Comment T e e e ee e e e e e e ee e e ee e e e e e e
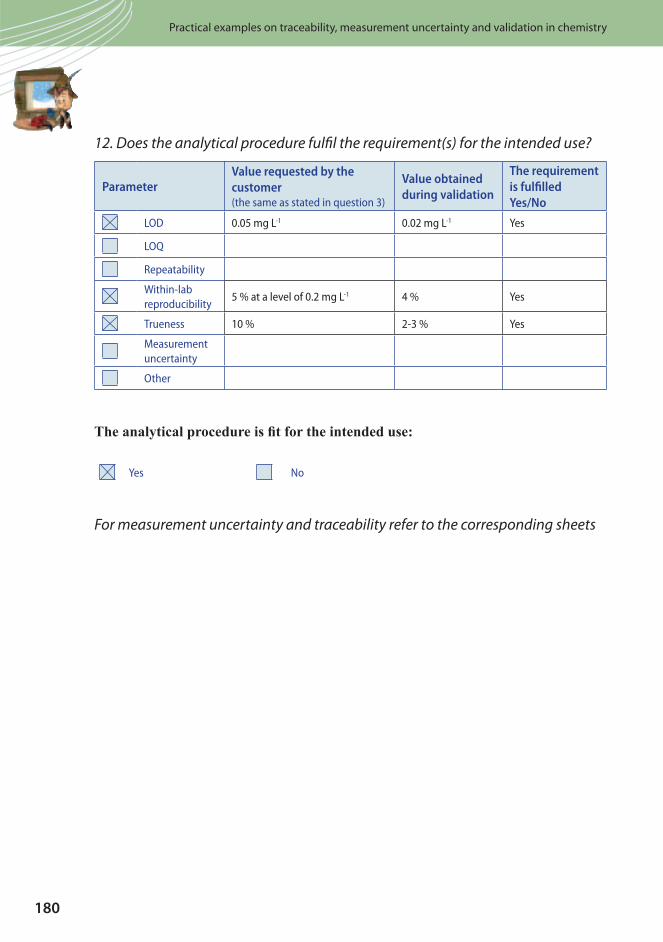
180
Practical examples on traceability, measurement uncertainty and validation in chemistry
12. Does the analytical procedure fulfil the requirement(s) for the intended use?
ParameterValue requested by the
customer(the same as stated in question 3)
Value obtained
during validation
The requirement
is fulfilled
Yes/No
LOD 0.05 mg L-1 0.02 mg L-1 Yes
LOQ
Repeatability
Within-lab
reproducibility5 % at a level of 0.2 mg L-1 4 % Yes
Trueness 10 % 2-3 % Yes
Measurement
uncertainty
Other
The analytical procedure is t for the intended use:
Yes No
For measurement uncertainty and traceability refer to the corresponding sheets
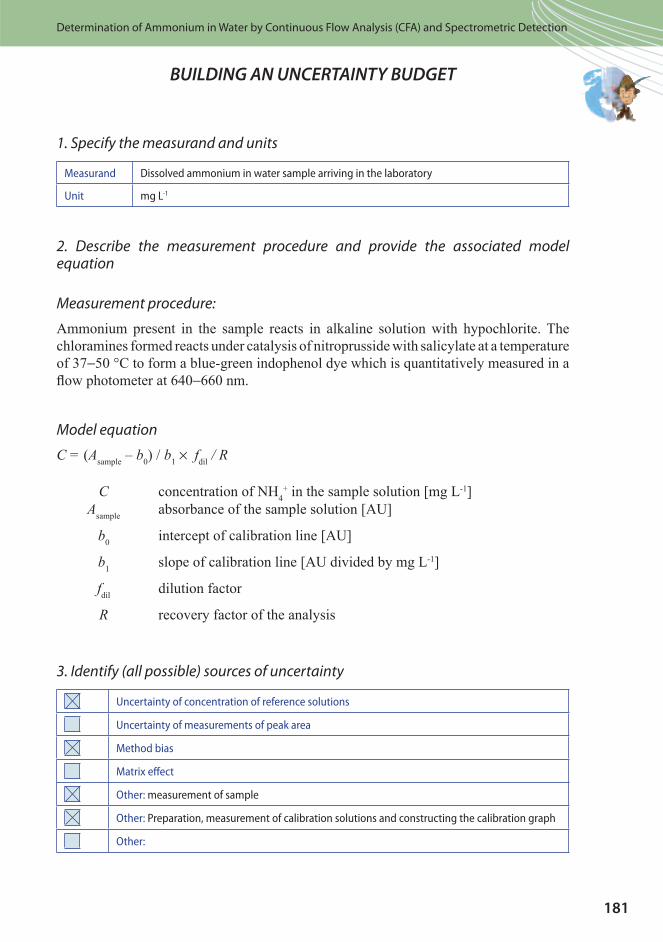
181
Determination of Ammonium in Water by Continuous Flow Analysis (CFA) and Spectrometric Detection
BUILDING AN UNCERTAINTY BUDGET
1. Specify the measurand and units
Measurand Dissolved ammonium in water sample arriving in the laboratory
Unit mg L-1
2. Describe the measurement procedure and provide the associated model equation
Measurement procedure:
e e e e e e e T ee e e e e e e e e
− C e ee e e e e ee e −
Model equation
C = A e – b b ¥ f / R
C e e e LA e e e e
b e e e
b e e e L
f
R e e e
3. Identify (all possible) sources of uncertainty
Uncertainty of concentration of reference solutions
Uncertainty of measurements of peak area
Method bias
Matrix effect
Other: measurement of sample
Other: Preparation, measurement of calibration solutions and constructing the calibration graph
Other:

182
Practical examples on traceability, measurement uncertainty and validation in chemistry
4. Evaluate values of each input quantity
Input quantity Value Unit Remark
Asample
0.256 AU
b0
0.01734 AU
b1
986.3 AU L mg-1
fdil
1 unitless
R 0.99 unitless
5. Evaluate the standard uncertainty of each input quantity
Input
quantity
Standard
uncertaintyUnit Remark
Asample
1.49 ¥ 10-3 AU Takes into account repeatability, drift and rounding
b0
0.00207 AU
b1
0.0070 AU L mg-1
Takes into account reference solution (0.3 % relative
uncertainty, preparation and measurement of calibration
standards and constructing the calibration graph
fdil
0 unitlessDilution of sample – in this case the sample was not
diluted
R 0.0058 unitless A rough estimate of recovery of 99 ± 1 %
6. Calculate the value of the measurand, using the model equation.
C = A e – b / b ¥ f / R
C =−
× × =0 256 0 01734
986 31 0 99 0 247
. .
.. . mg L-1
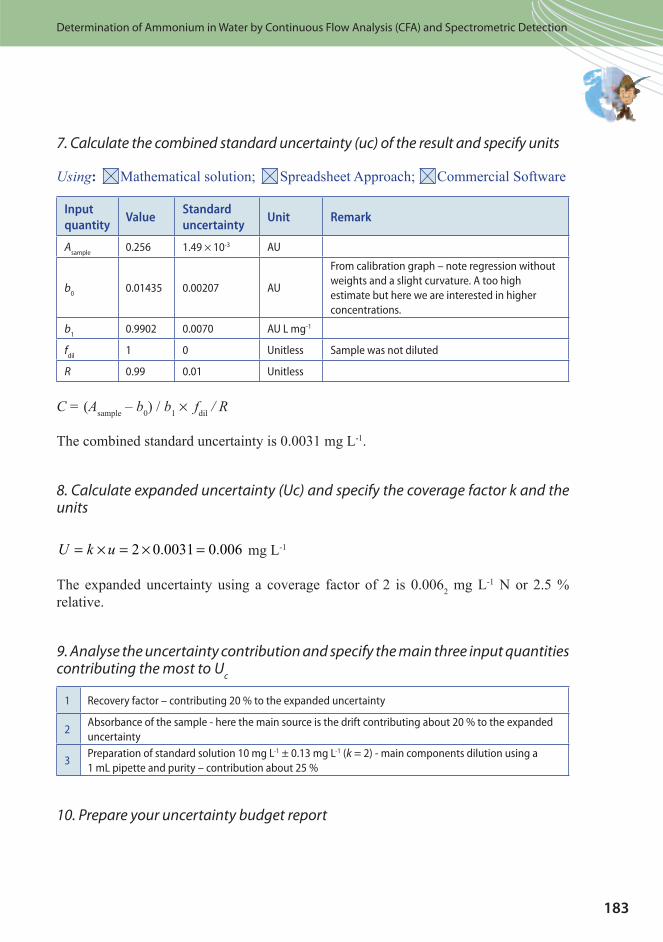
183
Determination of Ammonium in Water by Continuous Flow Analysis (CFA) and Spectrometric Detection
7. Calculate the combined standard uncertainty (uc) of the result and specify units
Using: M e e ee C e e
Input
quantityValue
Standard
uncertaintyUnit Remark
Asample
0.256 1.49 ¥ 10-3 AU
b0
0.01435 0.00207 AU
From calibration graph – note regression without
weights and a slight curvature. A too high
estimate but here we are interested in higher
concentrations.
b1
0.9902 0.0070 AU L mg-1
fdil
1 0 Unitless Sample was not diluted
R 0.99 0.01 Unitless
C = A e – b b ¥ f / R
T e e e L
8. Calculate expanded uncertainty (Uc) and specify the coverage factor k and the units
U k u= × = × =2 0 0031 0 006. . L
T e e e e e e Le e
9. Analyse the uncertainty contribution and specify the main three input quantities contributing the most to U
c
1 Recovery factor – contributing 20 % to the expanded uncertainty
2Absorbance of the sample - here the main source is the drift contributing about 20 % to the expanded
uncertainty
3Preparation of standard solution 10 mg L-1 ± 0.13 mg L-1 (k = 2) - main components dilution using a
1 mL pipette and purity – contribution about 25 %
10. Prepare your uncertainty budget report

184
Practical examples on traceability, measurement uncertainty and validation in chemistry
Further readings
I
C C e e C e e T e e e eOf c. J. Eur. Commun. L
M T M e Handbook for Calculation of Measurement Uncertainty in Environmental Laboratories e I
e e e e e e e

185
Determination of Ammonium in Water by Continuous Flow Analysis (CFA) and Spectrometric Detection
Addendum: Measurement uncertainty calculation -
GumWorkbench
T e e e e e e e e ee e e e e e e e e e ee e e T e e e e e ee e e e e e e ee
Model equation:
{ The main equation }C = (Asample - b0) / b1 ¥ fdil / R;
{ Nitrogen- Ammonium ion stock solution - 1000 mg N L-1. Prepared from ammonium chloride.}Cst_0 = mNH4Cl / V1000 ¥ PNH4Cl ¥ fNH4Clconv ¥ 1000;
{ Ammonium standard solution - 10 mg N/L. Prepared from ammonium stock solution. The standard solution is further used for preparation of the calibration standard solutions. }Cst = Cst_0 ¥ V1 / V100;
{ Concentrations of calibration standard solutions 0.1 to 1 mg N L-1. 1 to 10 mL of the standard solution is transferred to 100 mL volumetric asks.The reagents are added and the solution is made up to the mark. The solution is left to stand for 60 min and then the absorbance at 655 nm is measured. }C1 = Cst ¥ (V1_st / V1_100);C2 = Cst ¥ (V2_st / V2_100);C3 = Cst ¥ (V3_st / V3_100);C4 = Cst ¥ (V4_st / V4_100);C5 = Cst ¥ (V5_st / V5_100);fdil = 1;{in this case the sample was not diluted}{ Photometric measurementsIt is assumed that the uncertainty of all photometric measurements consists of three components (on the example Asample): – Repeatability uncertainty (included in Asample_rep); – Uncertainty due to drift (Asample_drift) – Uncertainty due to rounding of the reading (Asample_round) (The photometer use din this example has three decimal places)The absorbance of blank is not subtracted but all the measurements are made against blank}{ Absorbance of sample solution }Asample = Asample_rep+Asample_drift+Asample_round;
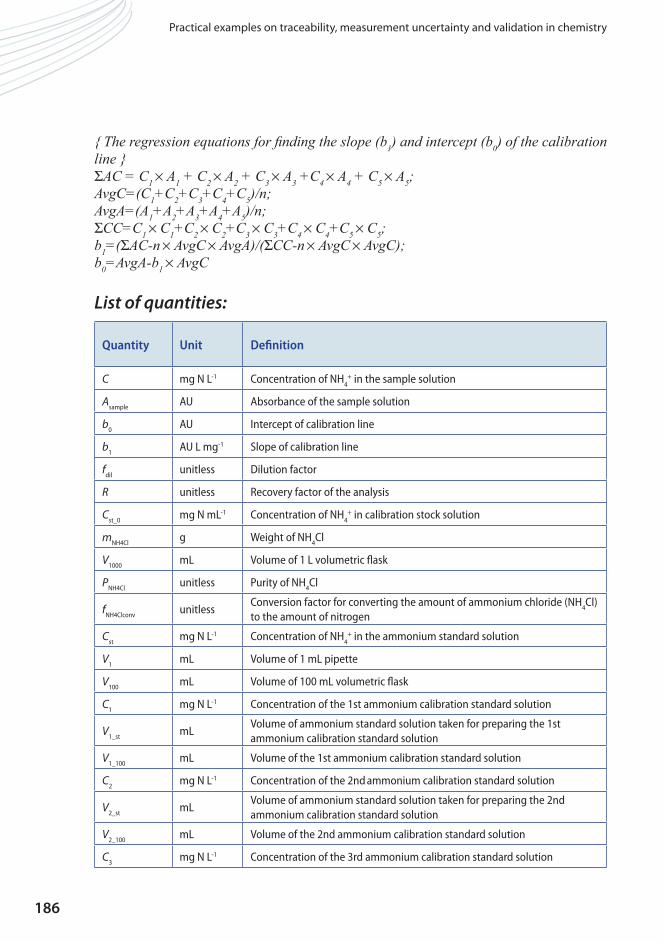
186
Practical examples on traceability, measurement uncertainty and validation in chemistry
{ The regression equations for nding the slope (b1) and intercept (b0) of the calibration line }ΣAC = C1 ¥ A1 + C2 ¥ A2 + C3 ¥ A3 +C4 ¥ A4 + C5 ¥ A5;AvgC=(C1+C2+C3+C4+C5)/n;AvgA=(A1+A2+A3+A4+A5)/n;ΣCC=C1 ¥ C1+C2 ¥ C2+C3 ¥ C3+C4 ¥ C4+C5 ¥ C5;b1=(ΣAC-n ¥ AvgC ¥ AvgA)/(ΣCC-n ¥ AvgC ¥ AvgC);b0=AvgA-b1 ¥ AvgC
List of quantities:
Quantity Unit Definition
C mg N L-1 Concentration of NH4
+ in the sample solution
Asample
AU Absorbance of the sample solution
b0
AU Intercept of calibration line
b1
AU L mg-1 Slope of calibration line
fdil
unitless Dilution factor
R unitless Recovery factor of the analysis
Cst_0
mg N mL-1 Concentration of NH4
+ in calibration stock solution
mNH4Cl
g Weight of NH4Cl
V1000
mL Volume of 1 L volumetric flask
PNH4Cl
unitless Purity of NH4Cl
fNH4Clconv
unitlessConversion factor for converting the amount of ammonium chloride (NH
4Cl)
to the amount of nitrogen
Cst
mg N L-1 Concentration of NH4
+ in the ammonium standard solution
V1
mL Volume of 1 mL pipette
V100
mL Volume of 100 mL volumetric flask
C1
mg N L-1 Concentration of the 1st ammonium calibration standard solution
V1_st
mLVolume of ammonium standard solution taken for preparing the 1st
ammonium calibration standard solution
V1_100
mL Volume of the 1st ammonium calibration standard solution
C2
mg N L-1 Concentration of the 2nd ammonium calibration standard solution
V2_st
mLVolume of ammonium standard solution taken for preparing the 2nd
ammonium calibration standard solution
V2_100
mL Volume of the 2nd ammonium calibration standard solution
C3
mg N L-1 Concentration of the 3rd ammonium calibration standard solution
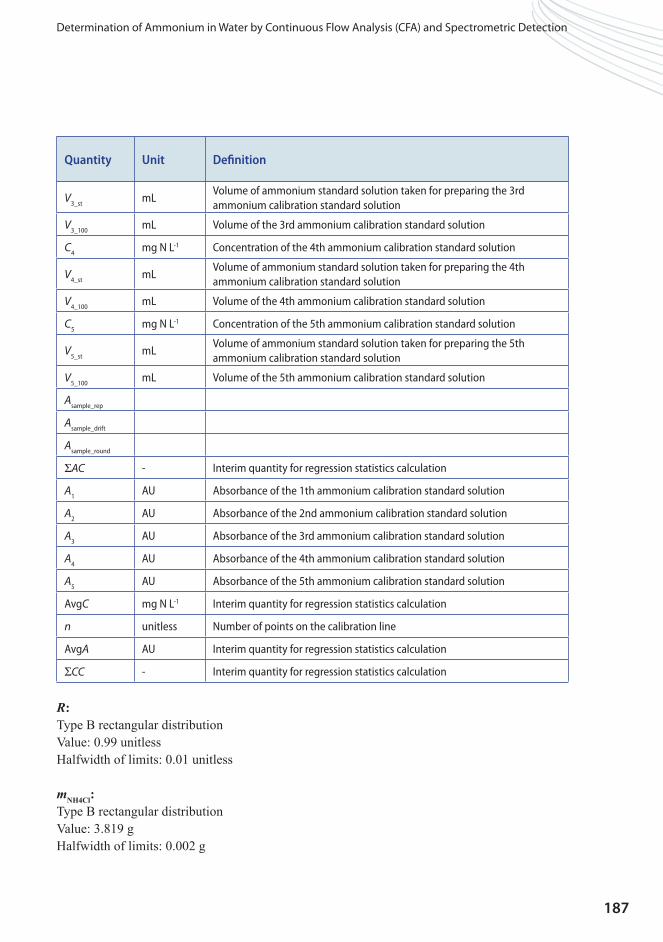
187
Determination of Ammonium in Water by Continuous Flow Analysis (CFA) and Spectrometric Detection
Quantity Unit Definition
V3_st
mLVolume of ammonium standard solution taken for preparing the 3rd
ammonium calibration standard solution
V3_100
mL Volume of the 3rd ammonium calibration standard solution
C4
mg N L-1 Concentration of the 4th ammonium calibration standard solution
V4_st
mLVolume of ammonium standard solution taken for preparing the 4th
ammonium calibration standard solution
V4_100
mL Volume of the 4th ammonium calibration standard solution
C5
mg N L-1 Concentration of the 5th ammonium calibration standard solution
V5_st
mLVolume of ammonium standard solution taken for preparing the 5th
ammonium calibration standard solution
V5_100
mL Volume of the 5th ammonium calibration standard solution
Asample_rep
Asample_drift
Asample_round
ΣAC - Interim quantity for regression statistics calculation
A1
AU Absorbance of the 1th ammonium calibration standard solution
A2
AU Absorbance of the 2nd ammonium calibration standard solution
A3
AU Absorbance of the 3rd ammonium calibration standard solution
A4
AU Absorbance of the 4th ammonium calibration standard solution
A5
AU Absorbance of the 5th ammonium calibration standard solution
AvgC mg N L-1 Interim quantity for regression statistics calculation
n unitless Number of points on the calibration line
AvgA AU Interim quantity for regression statistics calculation
ΣCC - Interim quantity for regression statistics calculation
R:T e e
e ee
mNH4Cl:T e e
e

188
Practical examples on traceability, measurement uncertainty and validation in chemistry
V1000:T e e
e LL
PNH4Cl:T e e
e ee
fNH4Clconv:C
e ¥
V1:T e e
e LL
V100:T e e
e LL
V1_st:T e e
e LL
V1_100:T e e
e LL
V2_st:T e e
e LL
V2_100:T e e
e LL
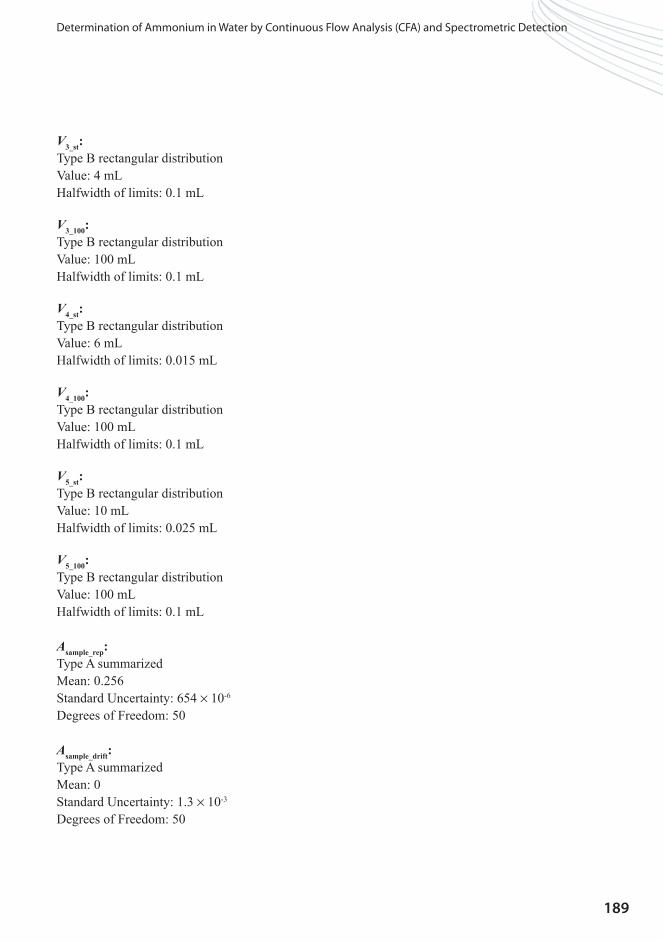
189
Determination of Ammonium in Water by Continuous Flow Analysis (CFA) and Spectrometric Detection
V3_st:T e e
e LL
V3_100:T e e
e LL
V4_st:T e e
e LL
V4_100:T e e
e LL
V5_st:T e e
e LL
V5_100:T e e
e LL
Asample_rep:T e eMe
e ¥e ee ee
Asample_drift:T e eMe
e ¥e ee ee

190
Practical examples on traceability, measurement uncertainty and validation in chemistry
Asample_round:T e e
e
A1:T e e
e
A2:T e e
e
A3:T e e
e
A4:T e e
e
A5:T e e
e
n:C
e e

191
Determination of Ammonium in Water by Continuous Flow Analysis (CFA) and Spectrometric Detection
Uncertainty budgets:
C C e e e
Quantity ValueStandard
uncertaintyDistribution
Sensitivity
coefficient
Uncertainty
contributionIndex
Asample
0.25600 AU 1.48 ¥ 10-3 AU
b0
0.01435 AU 2.07 ¥ 10-3 AU
b1
0.99023
AU L mg-1
7.01 ¥ 10-3
AU L mg-1
fdil
1.0 unitless 0.0 unitless
R 0.99000 unitless5.77 ¥ 10-3
unitlessrectangular -0.25 -1.4 ¥ 10-3 mg L-1 21.3 %
Cst_0
995.01 mg mL-1 2.96 mg mL-1
mNH4Cl
3.81900 g 1.15 ¥ 10-3 g rectangular 0.065 75 ¥ 10-6 mg L-1 0.0 %
V1000
1.000000 mL 577 ¥ 10-6 mL rectangular -0.25 -140 ¥ 10-6 mg L-1 0.2 %
PNH4Cl
0.99500 unitless2.89 ¥ 10-3
unitlessrectangular 0.25 720 ¥ 10-6 mg L-1 5.3 %
fNH4Clconv
0.26185152642501
unitless
Cst
9.9501 mg L-1 0.0649 mg L-1
V1
1.00000 mL 5.77 ¥ 10-3 mL rectangular 0.25 1.4 ¥ 10-3 mg L-1 20.9 %
V100
100.0000 mL 0.0577 mL rectangular -2.5 ¥ 10-3 -140 ¥ 10-6 mg L-1 0.2 %
C1
0.099501 mg L-1 868 ¥ 10-6 mg L-1
V1_st
1.00000 mL 5.77 ¥ 10-3 mL rectangular 0.035 200 ¥ 10-6 mg L-1 0.4 %
V1_100
100.0000 mL 0.0577 mL rectangular -350 ¥ 10-6 -20 ¥ 10-6 mg L-1 0.0 %
C2
0.19900 mg L-1 3.15 ¥ 10-3 mg L-1
V2_st
2.0000 mL 0.0289 mL rectangular 0.031 900 ¥ 10-6 mg L-1 8.4 %
V2_100
100.0000 mL 0.0577 mL rectangular -620 ¥ 10-6 -36 ¥ 10-6 mg L-1 0.0 %
C3
0.39800 mg L-1 6.31 ¥ 10-3 mg L-1
V3_st
4.0000 mL 0.0577 mL rectangular 0.023 1.3 ¥ 10-3 mg L-1 17.9 %
V3_100
100.0000 mL 0.0577 mL rectangular -910 ¥ 10-6 -53 ¥ 10-6 mg L-1 0.0 %

192
Practical examples on traceability, measurement uncertainty and validation in chemistry
Quantity ValueStandard
uncertaintyDistribution
Sensitivity
coefficient
Uncertainty
contributionIndex
C4
0.59701 mg L-1 4.00 ¥ 10-3 mg L-1
V4_st
6.00000 mL 8.66 ¥ 10-3 mL rectangular 0.014 120 ¥ 10-6 mg L-1 0.2 %
V4_100
100.0000 mL 0.0577 mL rectangular -850 ¥ 10-6 -49 ¥ 10-6 mg L-1 0.0 %
C5
0.99501 mg L-1 6.67 ¥ 10-3 mg L-1
V5_st
10.0000 mL 0.0144 mL rectangular -2.7 ¥ 10-3 -39 ¥ 10-6 mg L-1 0.0 %
V5_100
100.0000 mL 0.0577 mL rectangular 270 ¥ 10-6 16 ¥ 10-6 mg L-1 0.0 %
Asample_rep
0.256000 654 ¥ 10-6 normal 1.0 670 ¥ 10-6 mg L-1 4.6 %
Asample_drift
0.0 1.30 ¥ 10-3 normal 1.0 1.3 ¥ 10-3 mg L-1 18.2 %
Asample_round
0.0 289 ¥ 10-6 rectangular 1.0 290 ¥ 10-6 mg L-1 0.9 %
ΣAC 1.5720 - 0.0108 -
A1
0.108000 AU 577 ¥ 10-6 AU rectangular -0.36 -210 ¥ 10-6 mg L-1 0.4 %
A2
0.214000 AU 577 ¥ 10-6 AU rectangular -0.32 -180 ¥ 10-6 mg L-1 0.3 %
A3
0.412000 AU 866 ¥ 10-6 AU rectangular -0.23 -200 ¥ 10-6 mg L-1 0.4 %
A4
0.60600 AU 1.15 ¥ 10-3 AU rectangular -0.14 -170 ¥ 10-6 mg L-1 0.3 %
A5
0.99790 AU 1.15 ¥ 10-3 AU rectangular 0.027 31 ¥ 10-6 mg L-1 0.0 %
AvgC 0.45771 mg L-1 3.27 ¥ 10-3 mg L-1
n 5.0 unitless
AvgA 0.467580 AU 404 ¥ 10-6 AU
ΣCC 1.5544 - 0.0211 -
C 0.24650 mg L-1 3.11 ¥ 10-3 mg L-1
Results:
Quantity ValueExpanded
uncertaintyCoverage factor Coverage
C 0.2465 mg L-1 2.5 % (relative) 2.00 manual
193
Appendix 1
TrainMiC® Exercises (‘white pages’)


TrainMiC Exercises (‘white pages’)
195
TrainMiC Exercises
Analytical procedure:
EXERCISE 1:
Establishing traceability in analytical chemistry
EXERCISE 2:
Single laboratory validation of measurement procedures
Part I: General issues
Part II: Parameters to be validated
Part III: Some calculations and conclusions
EXERCISE 3:
Building an uncertainty budget
Addendum I: By spreadsheet approach
Addendum II: By dedicated software

196
Practical examples on traceability, measurement uncertainty and validation in chemistry
e e T MPL T e T MeP e e T M C
e M e P TI e M
e e T M C e

TrainMiC Exercises (‘white pages’)
197
ESTABLISHING TRACEABILITY IN ANALYTICAL CHEMISTRY
1. Specifying the analyte and measurand
Analyte
Measurand
Units
2. Choosing a suitable measurement procedure with associated model equation
Measurement
procedure
Type of calibration standard curve Standard addition internal standard
Model equation

198
Practical examples on traceability, measurement uncertainty and validation in chemistry
3. List the input quantities according to their influence on the uncertainty of the result of the measurement (first the most important ones). At this point, your judgement should be based on your previous experience only
1
2
3
4
5
4. List the reference standards needed and state the information regarding traceability of the reference value
For the analyte
1 Name/ChemicalFormula/Producer:
2 Name/ChemicalFormula/Producer:
For the other input quantities
1Quantity/Equipment/Calibration:
e.g. mass/balance/calibrated by NMI, U = xx
(k = 2) see also data yellow sheet
2 Quantity/Equipment/Calibration:
3 Quantity/Equipment/Calibration:
4 Quantity/Equipment/Calibration:
5. Estimating uncertainty associated with the measurement
Are all important parameters included in the model
equation?Yes No
Other important parameters are:
6. How would you prove traceability of your result?
1
2
3

TrainMiC Exercises (‘white pages’)
199
7. Any other comments, questions…
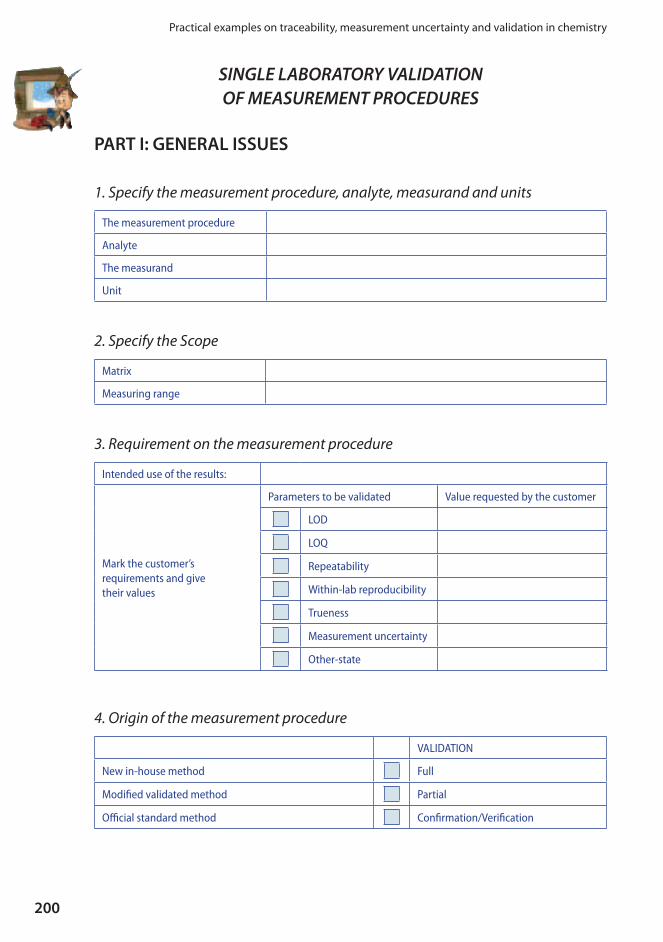
200
Practical examples on traceability, measurement uncertainty and validation in chemistry
PART I: GENERAL ISSUES
1. Specify the measurement procedure, analyte, measurand and units
The measurement procedure
Analyte
The measurand
Unit
2. Specify the Scope
Matrix
Measuring range
3. Requirement on the measurement procedure
Intended use of the results:
Mark the customer’s
requirements and give
their values
Parameters to be validated Value requested by the customer
LOD
LOQ
Repeatability
Within-lab reproducibility
Trueness
Measurement uncertainty
Other-state
4. Origin of the measurement procedure
VALIDATION
New in-house method Full
Modified validated method Partial
Official standard method Confirmation/Verification
SINGLE LABORATORY VALIDATION
OF MEASUREMENT PROCEDURES

TrainMiC Exercises (‘white pages’)
201
PART II: PARAMETERS TO BE VALIDATED
5. Selectivity/Interference/Recovery
Where yes, please give further information e.g. which CRM, reference method
CRM/RM: analysis of available CRM or RM
Further information:
Spike of pure substance
Compare with a reference method
Selectivity, interferences
Test with different matrices
Other – please specify
6. Measuring range
Linearity
Upper limit
LOD
LOQ
7. Spread – precision
Repeatability
Reproducibility (within lab)
Reproducibility (between lab)
8. Robustness
Variation of parameters

202
Practical examples on traceability, measurement uncertainty and validation in chemistry
9. Quality control
Control charts
Participation in proficiency testing schemes
10. Other parameters to be tested
Working range and testing of homogeneity of variances
R squared
Residual standard deviation
Standard deviation of the analytical procedure
Coefficient of variation of the analytical procedure
Measurement uncertainty

TrainMiC Exercises (‘white pages’)
203
PART III: SOME CALCULATIONS AND CONCLUSIONS
11. Calculation of parameters requested by the customer
Parameters requested to be
validatedCalculations
LOD
LOQ
Repeatability
Within-lab reproducibilty
Trueness
Measurement uncertainty
Other - please state
12. Does the analytical procedure fulfil the requirement(s) for the intended use?
ParameterValue requested by the
customer(the same as stated in question 3)
Value obtained
during validation
The requirement
is fulfilled
Yes/No
LOD
LOQ
Repeatability
Within-lab
reproducibility
Trueness
Measurement
Other
The analytical procedure is fit for the intended use:
Yes No
For measurement uncertainty and traceability refer to the corresponding sheets
204
Practical examples on traceability, measurement uncertainty and validation in chemistry
BUILDING AN UNCERTAINTY BUDGET
EXERCISE
1. Specify the measurand and units
Measurand
Unit
2. Describe the measurement procedure and provide the associated model equation
Measurement procedure:
Model equation:
3. Identify (all possible) sources of uncertainty
Uncertainty of concentration of reference solutions
Uncertainty of measurements of peak area
Method bias
Matrix effect
Other:
Other:
Other:

TrainMiC Exercises (‘white pages’)
205
4. Evaluate values of each input quantity
Input quantity Value Unit Remark
5. Evaluate the standard uncertainty of each input quantity
Input quantityStandard
uncertaintyUnit Remark
6. Calculate the value of the measurand, using the model equation
7. Calculate the combined standard uncertainty (uc) of the result and specify units
Using: M e e ee C e e
Input
quantityValue
Standard
uncertaintyUnit Remark
8. Calculate expanded uncertainty (Uc) and specify the coverage factor k and the
units

206
Practical examples on traceability, measurement uncertainty and validation in chemistry
9. Analyse the uncertainty contribution and specify the main three input quantities contributing the most to U
c
1
2
3
10. Prepare your uncertainty budget report
TrainMiC Exercises (‘white pages’)
207
Addendum I: Measurement uncertainty calculation:
spreadsheet approach (Excel)
Addendum II: Measurement uncertainty calculation –
GumWorkbench


209
Appendix 2
Briefing of the trainees on the example session

210
Practical examples on traceability, measurement uncertainty and validation in chemistry

Briefing of the trainees on the example session
211

212
Practical examples on traceability, measurement uncertainty and validation in chemistry

Briefing of the trainees on the example session
213

214
Practical examples on traceability, measurement uncertainty and validation in chemistry

Briefing of the trainees on the example session
215
Notes

216
Practical examples on traceability, measurement uncertainty and validation in chemistry
Notes

European Commission – Joint Research Centre – Institute for Reference Materials and Measurements
EUR 22791/2 EN – Practical examples on traceability, measurement uncertainty and validation in chemistry Vol. 1
e M e P T
L e P e e e
R e Te Re e e e IISBN 978-92-79-12021-3
RC
Abstract
C e e e e e e e e e ee e e e
e e e e e e e e ee T M C® e e e e e T M C® e e e ee e e e e e e e e e T M C® e e


HOW TO OBTAIN EU PUBLICATIONSFree publications:
obtain their contact details on the Internet (http://ec.europa.eu) or by sending a fax to +352 2929-42758.
Priced publications:
Priced subscriptions (e.g. annual series of the and reports of cases before the Court of
Justice of the European Union):
Union (http://publications.europa.eu/others/agents/index_en.htm).