Embed Size (px)
Citation preview
The Impact of TQM and information communication technology (ICT) as an enabler in the Quality Management Assessment Framework (QMAF) on business outcomes
Article (Accepted Version)
http://sro.sussex.ac.uk
Roque Lobo, Stanislaus, Samaranayake, Premaratne and Subramanian, Nachiappan (2019) The Impact of TQM and information communication technology (ICT) as an enabler in the Quality Management Assessment Framework (QMAF) on business outcomes. International Journal of Systems Science: Operations & Logistics, 6 (1). pp. 69-85. ISSN 2330-2674
This version is available from Sussex Research Online: http://sro.sussex.ac.uk/id/eprint/68815/
This document is made available in accordance with publisher policies and may differ from the published version or from the version of record. If you wish to cite this item you are advised to consult the publisher’s version. Please see the URL above for details on accessing the published version.
Copyright and reuse: Sussex Research Online is a digital repository of the research output of the University.
Copyright and all moral rights to the version of the paper presented here belong to the individual author(s) and/or other copyright owners. To the extent reasonable and practicable, the material made available in SRO has been checked for eligibility before being made available.
Copies of full text items generally can be reproduced, displayed or performed and given to third parties in any format or medium for personal research or study, educational, or not-for-profit purposes without prior permission or charge, provided that the authors, title and full bibliographic details are credited, a hyperlink and/or URL is given for the original metadata page and the content is not changed in any way.
1 of 28
The Impact of TQM and information communication technology (ICT) as an
enabler in the Quality Management Assessment Framework (QMAF) on
business outcomes
Abstract
The purpose of this study is to appraise a quality management assessment framework
(QMAF) model and establishes causal relationships between the various constructs in
the model in order to determine optimum pathways in achieving business outcomes
including information and communication technology (ICT) element as one of the
constructs. We carried out an empirical study of small, medium and large
manufacturing organizations in the Western Sydney Region of New South Wales,
Australia.
The (SEM) recursive path analysis results of the model provide empirical evidence
that establish the pathways through the various constructs considered in the model. All
these pathways ultimately lead to delivering optimum business outcomes. Further, ICT
as an enabler is confirmed as it is found to have direct one-to-one influence on all the
constructs of the model including business outcomes.
The research findings enabled developing important and practical guidelines for
managers engaged in planning and management of quality.
Keywords: Business outcomes; Information & communication technology; Path
analysis
2 of 28
Introduction
Excellence awards and management frameworks induced significant changes in the
organization’s performance. This made worldwide organization to imitate best quality
management practices to achieve competitive advantage (Dick, 2009). This has
intensified in recent times, due to increase levels of competition, globalization and
collaboration with multiple levels in the supply chain (Talib et al., 2011; Simchi-Levi
and Fine, 2010)
Among various awards noted in the literature, the Malcolm Baldrige National Quality
Award (MBQNA) has turned out to be a vital stimulus for improving the
competitiveness of US companies and increasing awareness of quality improvement
methods (Main, 1990; Garvin, 1991; Hart, 1993; Moore, 1995; ASQ, 1998). The
Baldrige criteria offer a comprehensive framework or tool for self-assessment of
quality (Garvin, 1991; Evans, 1997). In addition to various quality awards developed
and discussed in the literature, other aspects associated with the quality award include
(i) strength of relationships among various quality management constructs such as total
quality management (TQM) practices which are measured/evaluated using levels of
following key measures (leadership, strategic planning, customer focus, information
and analysis, people management and process management), quality performance and
innovation performance (Prajogo and Sohal, 2003); (ii) relationships between quality
management and organization performance (Prajogo and Sohal, 2006), and (iii)
validity of quality awards using various empirical studies. Leadership, information and
analysis are identified as significant drivers of system performance while process
management has an impact on customer satisfaction (Wilson and Collier, 2000).
Recently, Srinivasan and Kurey (2014) identified four major attributes such as
leadership emphasis, message credibility, peer involvement and employee
empowerment that would enhance the competitiveness of corporate quality culture. It
is emphasized that information and communication technologies (ICTs) are backbone
to gain the four attributes. Furthermore, it is evident from the recent literature that ICTs
play a significant role in SMEs, in particular on manufacturing processes as well as
working and management practices (Ritchie and Brindley, 2005). Although the
importance of ICTs on manufacturing processes and management practices are noted
in various empirical studies, further investigation into its impact on overall business
outcomes through a quality management framework is warranted. In addition,
contemporary business systems is entwined with ICT and its influence on business
outcomes needs validation. Therefore, this study extends the work of previous research
on the quality management framework (QMAF), in particular the proposed framework
examines ICT as an enabler (Lobo and Ramanathan, 2005; Lobo et al., 2012). In this
case, the study is considered to be the first empirical study on QMAF framework,
investigating the direct/indirect impact of ICT as enabler on business outcomes, using
data from the Western Sydney region. The holistic approach enables using QMAF for
evaluation, assessment and improvement of quality constructs leadership, quality
culture, information, knowledge, communication, human resources management,
partnering focus, strategy/improvement methods, business processes and their
collective influence towards achieving optimum business outcomes.
Furthermore, previous studies have focused on developing quality management
assessment frameworks, including an analytical network process (ANP)-based
framework for successful total quality management implementation. ANP has been

3 of 28
determined to be an effective framework for assessing readiness to adopt TQM and
facilitating TQM implementation (Bayazit and Karpak (2007) and provides guidelines
for self-assessment tool to be used by quality managers for continuous monitoring of
quality-related performance (Quazi et al., 1998) and a comprehensive framework of
twelve important elements of quality, assessing quality management practices at the
firm level, influenced by the role of information and communication technologies
(Lobo and Ramanathan, 2005; Lobo et al., 2012). In this case, the QMAF theorizes the
role and impact that leadership, quality culture, information/knowledge/communication,
strategy, human resources management, partnering focus, improvement methods, and
business processes have on the business outcomes such as business results, customer
and stakeholder value and feedback. Although the research work outlined above have
proposed some sort of assessment frameworks and/or identified roles and impacts of
various factors on quality management practices, including the QMAF model which
provides a theoretical foundation with a holistic approach for quality management
assessment, the assessment frameworks need to be supported by experimental
validation. In this research, the QMAF model is modified by combining strategy and
improvement methods into one element “strategy/improvement methods” in comparison
to the QMAF model proposed by Lobo and Ramanathan (2005) and Lobo et al. (2012)
where strategy and improvement methods are considered as two distinctly separate
elements. It was deemed that the combined influence of “strategy/improvement
methods” provided a more appropriate construct given the strong synergies in strategies
and improvement methods. This is followed by experimental validation of relationships
between constructs of the framework. In addition, this framework is further studied,
particularly with regard to strengths of relationships between constructs of the model,
using empirical data from a selected region of Australia. Overall, this research
addresses the research question of how each construct of a quality management
assessment framework is related with business outcomes and how direct and indirect
relationships between constructs contribute to overall business outcomes, in particular
with/without information/knowledge/communication (IKC) in the quality assessment
framework/model.
This research, within the broader theme of experimental validation of the QMAF
model, aims to (i) gain deeper insights and managerial implications from the direct and
indirect effects of the categories in the QMAF and (ii) to assess the overall impact of
these effects on the business outcome category, using structural equation modeling
(SEM) - recursive path analysis.
The remainder of the paper is organized as follows. The literature review is presented
next, followed by quality framework and research questions, the research methodology
outlining the approach, data source and collection, and analysis methods. In the next
section, details of data analysis and results of the study are discussed. Finally,
conclusion, limitations and future research directions are presented.
Literature Review
Quality framework

4 of 28
Among various aspects of quality in broader sense, two areas of interest in this study
include quality awards and management assessment frameworks. Many frameworks
to measure organizational quality have been discussed in quality management
literature with different foci and purposes, including identification of eight critical
factors of quality management, as the basis for producing a profile of quality practices
by Saraph et al. (1989), a framework for evaluation of quality management programs
by practitioners by Flynn et al. (1994), a framework to examine the effects of quality
management strategies on product quality by Ahire et al. (1996), guidelines for self-
assessment and monitoring of quality-related performance (Quazi et al., 1998), and
process-based framework for total quality management practices, as the basis for
measuring the impact of different factors on TQM implementation in manufacturing
industry (Bayazit and Karpak, 2007). Using a comprehensive study on the
relationships among the Baldrige categories, Pannirselvam and Ferguson (2001) states
that (i) a number of parallel measures exist between the MBNQA criteria and other
frameworks; however, substantial differences exist between the measures of these
frameworks, (ii) the MBNQA criteria are superior in terms of comprehensiveness with
less prescriptive when compared to other instruments, and (iii) the MBNQA model
places greater emphasis on continuous improvement, customer focus, and strategic
quality planning.
Quality practices and performance
The greater emphasis on continuous improvement within broader performance context
is evident from various research studies in the literature on the association between
quality and performance by several researchers. In this context, studies have
established the link between product quality, cost, market share, return on investment
and profitability (Schoeffler et al., 1974; Phillips et al., 1983; Gale and Klavans, 1985).
Roth and Miller (1989) and Rothet et al. (1990) studied the effect of various quality
practices on quality performance. Their research evidently demonstrated that quality
programs have a significant influence on manufacturing capabilities. The constructs
for quality in these two studies however did not consider infrastructures, such as
information management, that could influence the success of quality management
practices.
Pannirselvam and Ferguson (2001) conducted a comprehensive quality award study
based on the MBNQA to determine the strength of relationships between the various
quality management constructs and between quality management and organization
performance using path analysis, based on data from the Arizona Governor's Quality
Award. Pannirselvam and Ferguson (2001) established the measurement validity of
the Baldrige Criteria for Performance Excellence (CPE) by testing a confirmatory
factor analysis (CFA) model using 1993 Arizona Governor’s Quality Award (AGQA)
applicant data. Samson and Terziovski (1999) also confirmed the measurement
validity of the CPE. They analyzed data obtained from a large Australasian
manufacturing sample, using a survey instrument based on the 1994 CPE. Dellana and
Hauser (1999) and Dow et al. (1999) through their studies they arrived at similar
conclusions with regard to the validity of the CPE.
Relationships among categories in quality framework
5 of 28
Xiang et al. (2010) analyzed the causal relationships among the categories in the China
Quality Award (CQA) model based on the Malcolm Baldrige National Quality Award.
The CQA causal model is analyzed in terms of driver (i.e. leadership), direction (i.e.
strategic planning), system (i.e. human resource focus, process management, and
customer and market focus), foundation (i.e. information and analysis). SEM was used
to estimate the path coefficients among the CQA categories, using analysis of
empirical data. The study concluded that leadership has a great influence on foundation
and direction where direction affects human resources focus and customer and market
focus on system but it has no influence on process management; human resource focus
and customer and market focus both affect process management; and process
management has a significant effect on results construct. In addition, foundation
impacts direction and all the categories of the CQA causal model.
Bou-Llusar et al. (2005) conducted an exhaustive study of the European Excellence
Award (EEA) which involved assessing the interrelationships between the enablers
and result criteria in the model. The data was obtained from a sample of Spanish firms
and analyzed using canonical correlation analysis. The study concluded that the set of
enabler criteria is strongly related to the result criteria set. The enabler criteria
contribute in a similar way to result enhancements, hence a balanced approach in the
development of enablers aids correlation between enablers and results to be enhanced,
this optmizes the benefits from the EEA.
Jayamaha et al. (2008) empirically established the validity of the Baldrige CPE, using
a data set from New Zealand organizations and also determined methodological gaps
as the study was based on a small sample, the study highlighted the need to meta-
analyze past measurement and structural models as well as measurement instruments.
They used self–assessment data from 91 New Zealand organizations and conducted
the analysis with partial least squares (PLS) method of structural equation modeling.
The measurement validity of the CPE was confirmed, where 11 implied causal
relationships among 13 were found to be statistically significant. In addition, the
results inferred some key quality management aspects: dependence on measurement,
analysis and knowledge management; people involvement, and the function of
leadership in setting direction.
Organizational focus on improving quality culture
Furthermore, some studies have taken a more organizational focus of quality and
included organizational elements such as information management and human
resources management (Anderson et al., 1995; Flynn et al., 1995; Chen et al., 1997;
Poister and Harris, 1997; Lengnick-Hall and Sanders, 1997; Li, 1997; Rungtusanatham
et al., 1998; Dow et al., 1999), organizational culture, in particular identifying cultures
that determine the successful implementation of TQM practices (Prajogo and
McDermott, 2005) and need for an appropriate culture to support the scope of TQM
(Irani et al., 2004). Dow et al. (1999) surveyed a large, random sample of
manufacturing sites to establish the primary dimensions of quality management and
examined the relationship between quality practices and quality outcomes. The results
revealed that the practices can be divided into nine categories. The workforce
commitment, shared vision and customer focus categories combine to yield a positive
correlation with quality outcomes. However, other categories such as benchmarking,
use of teams, personnel training, advanced manufacturing systems, just-in-time
6 of 28
principles and co-operative supplier relations did not show any significant relationship
with quality outcomes. Based on an empirical study on the relationship between TQM
practices and organizational culture, Prajogo and McDermott (2005) provides further
evidence of supporting the established view of different subsets of TQM practices are
determined by different types of cultures, in particular a hierarchical structure is having
significant relationship with certain practices of TQM.
The holistic influence of TQM factors on business results
In most cases, path analysis using structural equation modeling has been used to
establish relationships between TQM factors and business results (Sila and
Ebraimpour, 2005; Flynn and Saladin, 2001; Prajogo and McDermott, 2005; Jayamaha
et al., 2008). Sila and Ebraimpour (2005) empirically investigated the relationships
among critical TQM factors and business results. Structural equation modeling was
used in the study which established that TQM factors are holistic namely synergies
must be created among them to achieve favorable business results e.g. leadership and
information and analysis have a strong implications for a company’s business results.
Using path analysis to assess the hypothesized linkages of the CPE framework, Flynn
and Saladin (2001) confirmed the validity of theoretical models underlying the
Baldrige criteria, through analysis of constructs and direct effects in the path model.
In this case, the data was obtained from a sample of manufacturing plants in the USA
and elsewhere. They also inferred that the path models that related to the 1992 and
1997 Baldrige criteria were a better fit to data, in comparison to the path model that
corresponded to the 1988 criteria; concluding that the frameworks have improved upon
the base established by the original 1988 framework.
It would be nice to summarize the gaps based on quality framework, quality practices
and performance, relationship among categories in quality framework and
organizational focus to improve quality culture. Among various studies on broader
quality frameworks, some studies have considered information and knowledge in their
quality frameworks using structural equation modeling to establish linkages in the
constructs of their frameworks (Sila and Ebraimpour, 2005; Flynn and Saladin,
2001;Jayamaha et al., 2008). This research adopts the QMAF, as the basis for
explicitly establishing ICT as an enabler with information/knowledge/ communication
(IKC) construct of the QMAF model. The (SEM) recursive path analysis results of the
model, using a set of data collected from a region in Australia and analyzed using
structural equation modelling provides empirical evidence that pathways in achieving
business outcomes can be established through various elements of the QMAF model.
Quality Framework and Research Questions
Based on a synthesis of the literature and quality award schema, a comprehensive
framework consisting of twelve important elements of quality (Lobo and Ramanathan,
2005; Lobo et al., 2012) is selected as the basis of this research and is referred to as
the Quality Management Assessment Framework (QMAF). Each element of the
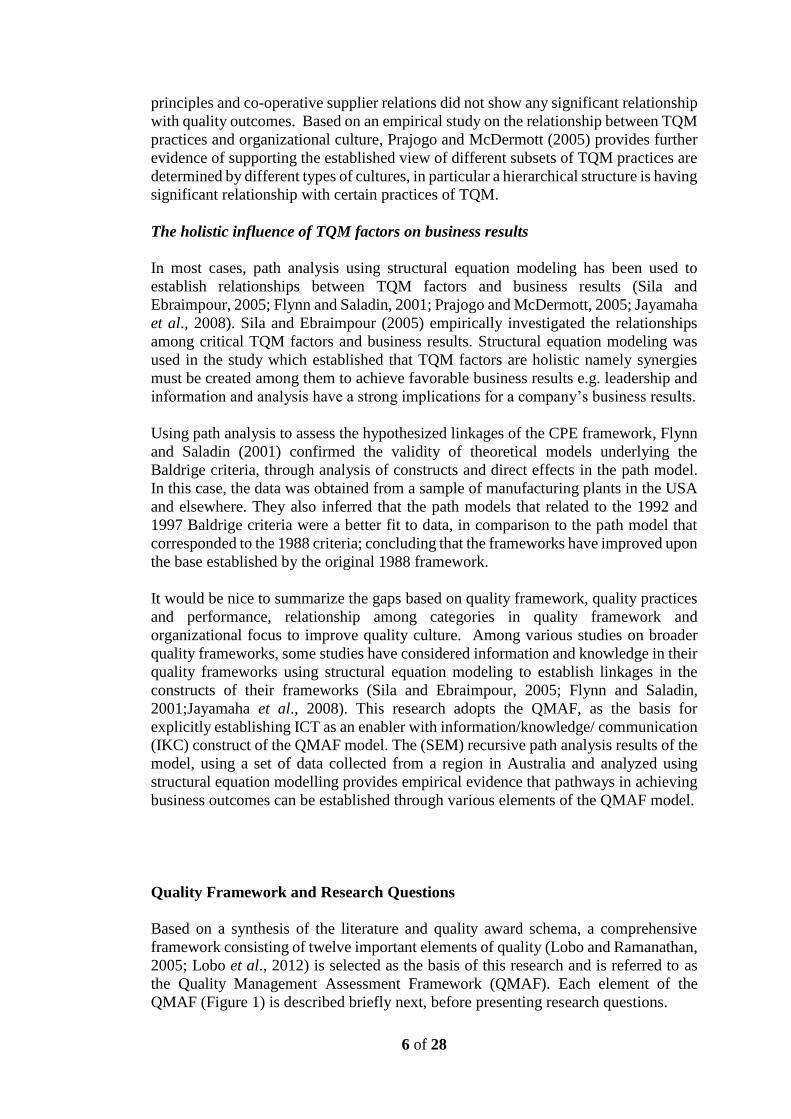
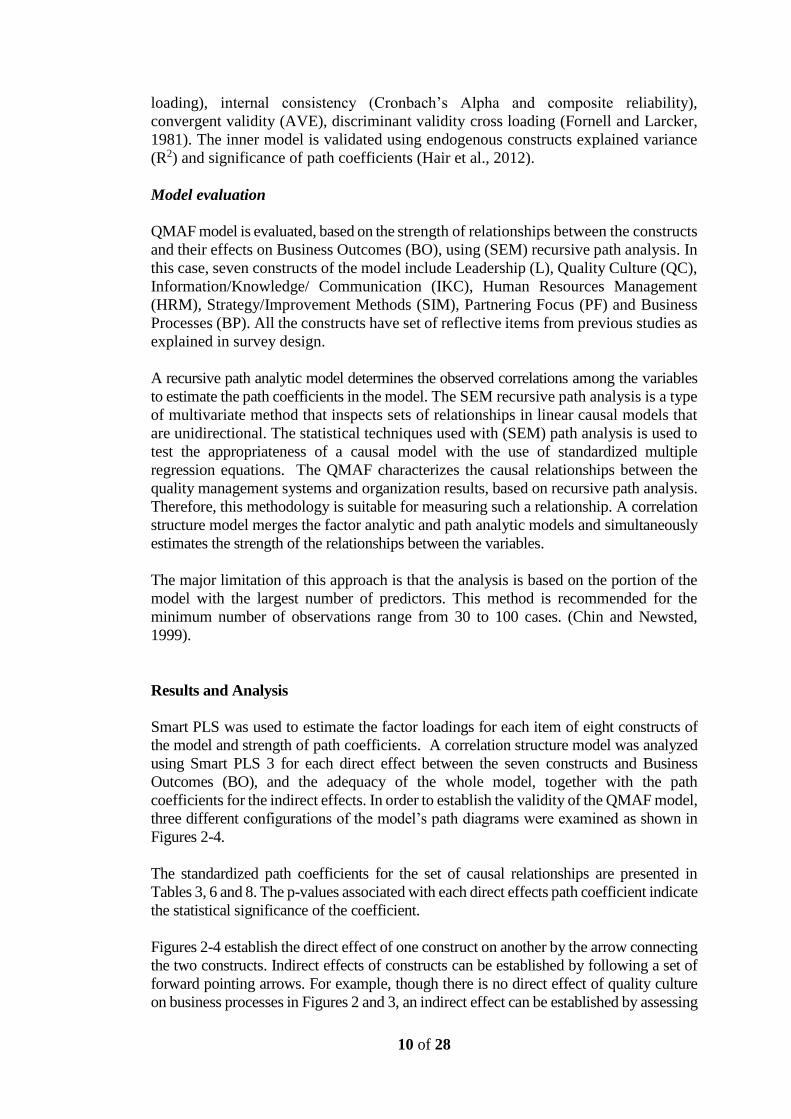
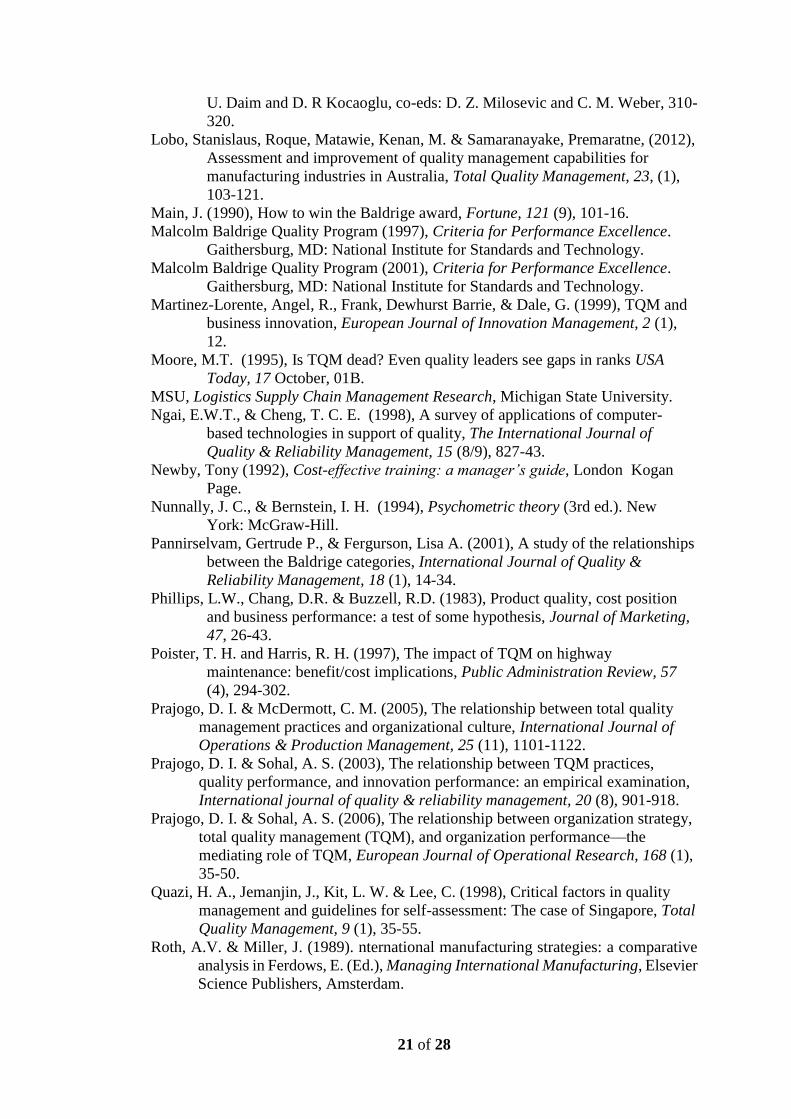
QMAF (Figure 1) is described briefly next, before presenting research questions.
7 of 28
[Insert Figure 1 here]
The elements of quality framework (leadership, quality culture,
information/knowledge/communication, employee empowerment, employee
development, supplier focus, customer focus, strategy, benchmarking, total quality
tools, continuous improvement, business processes, business results and customer and
stakeholder value) are classified into eight categories. Those eight categories are
subsequently arranged into five groups. The five basic groups include core drivers;
quality value infrastructure; roadmaps, implementation tools and techniques; processes
and performance outputs. The core drivers are leadership, quality culture and
information/knowledge and communication. Leadership focuses on how top management
accentuates quality at all levels and communicates this emphasis throughout the
organization. Quality culture encompasses the extent to which employees work as a team
accepting their responsibilities for quality with clear quality objectives and team skills
to deliver to these objectives. Information, knowledge and communication management
systems deliver an agile quality management system facilitating speedy and accurate
data collection, analysis, reporting and decision-making tools. The quality value
infrastructure is represented by human resources management and partnering focus of
an organization. Human resources management consists of employee development and
empowerment; partnering focus is made up of the level of customer and supplier focus
that an organization possesses. The roadmaps, implementation tools and techniques of
the organization are delivered by the strategy, improvement methods management
system of an organization and are dependent on the level of strategy/ improvement
methods used by an organization. Strategy/improvement methods consist of strategy,
benchmarking, total quality tools and continuous improvement programs. The
processes, identified as one group, are measured by the quality of business processes in
an organization. The performance outputs are represented by business outcomes which
include business results, customer and stakeholder value and the relevant feedback
systems. It should be noted that the proposed model/framework is a modification of
QMAF model presented by Lobo and Ramanathan (2005), which classified the elements
into nine categories and subsequently into six groups. The modification is mainly
merging of two categories: strategy and improvement methods into one category
“strategy/improvement methods”. Two categories are merged since they are logically
related, in particular strategy involves development of plans and improvement methods
and subsequently enables implementation of those plans. Henceforth, the QMAF model
presented here has seven constructs.
Since the model represents very closely connected groups with twelve major elements,
the manner in which the twelve major elements interact and influence each other will
determine the scope and extent of customer value created and the business results
achieved. Organizations that aspire at being world-class focus on infusing a few core
values such as good leadership, customer focus, respect for employees, and continuous
improvement. The QMAF criteria are devised around such core values and are
exemplified in the QMAF framework. In today’s context, where ICT plays a major role
as an enabler, the elements described in the model and their interplay will be studied,
with particular attention to whether relationships among those elements and
subsequently overall effectiveness of QMAF is enhanced through appropriate ICT
interventions.
8 of 28
In order to determine how major elements interact and influence each other, it is
proposed that strengths of relationships between constructs of the selected QMAF
model be tested. Thus, the following hypotheses are proposed and tested using data
collected through a survey questionnaire.
Research questions
The following research questions are proposed to test direct and indirect relationships
between combinations of constructs of the QMAF model. The exogenous constructs
of the model are Leadership (L), Quality Culture (QC) and
Information/Knowledge/Communication (IKC). The endogenous constructs are
Human Resources Management (HRM), Partnering Focus (PF),
Strategy/Improvement Methods (SIM), Business Processes (BP) and Business
Outcomes (BO).
RQ1. Does Leadership positively influence business outcomes through human
resources, partnering focus, strategy/improvement methods and business processes?
RQ2. Does Quality Culture positively influence business outcomes through human
resources, partnering focus, strategy/improvement methods and business processes?
RQ3. Does Information/Knowledge/Communication positively influence business
outcomes through human resources, partnering focus, strategy/improvement methods
and business processes?
RQ4. Does Human resources management positively influence business outcomes
through human resources, strategy/improvement methods and business processes?
RQ5. Does Information/Knowledge/Communication have a positive influence on
leadership, quality culture, human resources management, partnering focus,
strategy/improvement methods, business processes and business outcomes?
Research Methodology
The research involves (i) a survey questionnaire for collecting empirical data and (ii)
recursive path analysis of structural equation modelling for testing a set of hypotheses
associated with broader research questions, for overall assessment of the Quality
Management Assessment Framework (QMAF).
Survey design
The questionnaire adopted in this study is derived from previous studies (MBQP,
2001; Anderson and Sohal, 1999; Adam et al., 1997; Tan, 1997; Martinez Lorente et
al., 1999; MBQP, 1997). The QMAF questionnaire was validated by trialing it out
with five organizations. The results of the assessment were discussed with the
respective Quality Managers of these organizations and the feedback was very
complementary. Based on the feedback from quality managers of those organizations
and also considering the overall purpose of the research, the questionnaire was
finalized for mailing out for required data collection. The responses to the questions
were evaluated using a Likert scale of 1 to 5 with 1 representing strongly disagree and
5 corresponds to strongly agree.
9 of 28
Data collection
Several factors were brought into consideration in determining the data collection and
associated sample selection for this research.
1. The population was limited to only organizations engaged in manufacturing in
the Western Sydney region. This selection was for several reasons:
a. It controls for heterogeneity of quality systems across New South
Wales (NSW).
b. The Western Sydney region is the centre of industries for NSW and
provides a wide variety of both industries by size and Australian and
New Zealand Standard Industrial Classification (ANZSIC) category.
c. University of Western Sydney is based in the Western Sydney region
and the researcher was familiar with the region’s context, which
assisted in collecting valuable information for the study.
2. The following were the conditions taken into account in identifying the sample
size. First, the limitation of time and financial resources. Additionally, since it
was hard to get adequate responses to the survey in the first instance, all the four
lists generated from the population were used in order to generate the maximum
number of responses.
The samples were selected using random sampling technique for each category,
namely small, medium and large size organizations (MINITAB software).
As outlined earlier, collection of empirical data was carried out using a mail out of the
survey questionnaire with telephone follow up. In this case, a comprehensive postal
survey was carried out with a preliminary mail out to 300 firms in the Western Sydney
Region. These firms were a combination of large, medium and small organizations.
Since it was hard to achieve complete responses, from the first mail out, additional
three lists of the remaining population were made in the same ratios as the first list.
The complete population of 1236 was used up trying to get most of the companies to
participate in the study, as the best option for increasing the sample size, as this was a
major limitation to this research project.
Overall, the total responses were 73 completed survey questionnaires. This means that
it is a relatively small data sample (73 responses), making one of the limitation of this
research. This also restricted us from extending the analysis beyond the Path Analysis.
In a similar research, Jayamaha et al. (2008) used 91 responses from New Zealand
organizations and used PLS to empirically establish the validity of the Baldrige
Criteria for Performance Excellence (CPE). Table 1 shows the total population, sample
drawn for each of the four lists and response rate in each industry size (i.e. large,
medium and small). Initially all data collected were coded and entered into MINITAB
which was previously constructed and tested. Strict controls were imposed to
guarantee integrity of the data.
[Insert Table 1 here]
In order to provide better description of data in terms of key attributes, correlations
and strengths of relationships between constructs of the QMAF model, regression
analysis, and path analysis of structural equation model (SEM) are used. In the case
of path analysis using partial least square (PLS) of SEM, evaluation of reflective outer
models is carried out using the following criteria: indicator reliability (indicator
10 of 28
loading), internal consistency (Cronbach’s Alpha and composite reliability),
convergent validity (AVE), discriminant validity cross loading (Fornell and Larcker,
1981). The inner model is validated using endogenous constructs explained variance
(R2) and significance of path coefficients (Hair et al., 2012).
Model evaluation
QMAF model is evaluated, based on the strength of relationships between the constructs
and their effects on Business Outcomes (BO), using (SEM) recursive path analysis. In
this case, seven constructs of the model include Leadership (L), Quality Culture (QC),
Information/Knowledge/ Communication (IKC), Human Resources Management
(HRM), Strategy/Improvement Methods (SIM), Partnering Focus (PF) and Business
Processes (BP). All the constructs have set of reflective items from previous studies as
explained in survey design.
A recursive path analytic model determines the observed correlations among the variables
to estimate the path coefficients in the model. The SEM recursive path analysis is a type
of multivariate method that inspects sets of relationships in linear causal models that
are unidirectional. The statistical techniques used with (SEM) path analysis is used to
test the appropriateness of a causal model with the use of standardized multiple
regression equations. The QMAF characterizes the causal relationships between the
quality management systems and organization results, based on recursive path analysis.
Therefore, this methodology is suitable for measuring such a relationship. A correlation
structure model merges the factor analytic and path analytic models and simultaneously
estimates the strength of the relationships between the variables.
The major limitation of this approach is that the analysis is based on the portion of the
model with the largest number of predictors. This method is recommended for the
minimum number of observations range from 30 to 100 cases. (Chin and Newsted,
1999).
Results and Analysis
Smart PLS was used to estimate the factor loadings for each item of eight constructs of
the model and strength of path coefficients. A correlation structure model was analyzed
using Smart PLS 3 for each direct effect between the seven constructs and Business
Outcomes (BO), and the adequacy of the whole model, together with the path
coefficients for the indirect effects. In order to establish the validity of the QMAF model,
three different configurations of the model’s path diagrams were examined as shown in
Figures 2-4.
The standardized path coefficients for the set of causal relationships are presented in
Tables 3, 6 and 8. The p-values associated with each direct effects path coefficient indicate
the statistical significance of the coefficient.
Figures 2-4 establish the direct effect of one construct on another by the arrow connecting
the two constructs. Indirect effects of constructs can be established by following a set of
forward pointing arrows. For example, though there is no direct effect of quality culture
on business processes in Figures 2 and 3, an indirect effect can be established by assessing
11 of 28
the direct effects of quality culture on human resources management and
strategy/improvement methods and the direct effects of these two constructs on business
processes.
Comparative analysis of the QMAF model – with and without IKC
PLS was used given its rigorous analytical base and the relatively small sample size of
this study (Chin and Newsted, 1999). Table 2 summarizes the assessment of the QMAF
Model with IKC and Table 5 summarizes the assessment of the QMAF Model without
IKC.
The test of the measurement model includes the estimation of convergent and
discriminant validity of the instrument items. Convergent validity of the measurement
models was assessed by average variance extracted (AVE) (Fornell and Larcker,
1981). Convergent validity is adequate when constructs have an AVE of at least 0.50
(Fornell and Larcker, 1981). All the constructs have an AVE score of 1.0 for the
QMAF model with and without IKC. The Cronbach’s alpha and composite reliability
for each construct is 1.00 for both the QMAF models (with and without IKC), given
we used average of all items as a single item for a construct, to reduce number of
variables. A Cronbach’s alpha and composite reliability value of 0.70 or more is
accepted for internal consistency for established scales (Nunnally, 1967). Discriminant
validity is tested, according to method suggested by Fornell and Larcker test (1981) and
found that all our squared correlations are less than our AVE, for outer model all our
indicator loadings are above 0.5.
The inner structural model was evaluated using the R2 for the dependent constructs
and the size, t-statistics and significance level for the structural path coefficients. The
t-statistics were estimated using the bootstrap resampling procedure (1000 re-
samples). Furthermore, R2 values which are greater than 0.5 are very good, as
suggested by Fornell and Larcker (1981), for all the constructs in both models and
explains variance very well.
The global fit (GoF) for PLS path models is estimated for global validation of PLS model
(Akter et al., 2011). The global fit (GoF) (Wetzels et al., 2009) measure for PLS model is
0.64 in the case of the QMAF model with IKC and 0.68 for the model without IKC
indicating a good fit of the models to the data.
Analysis of the QMAF model incorporating IKC
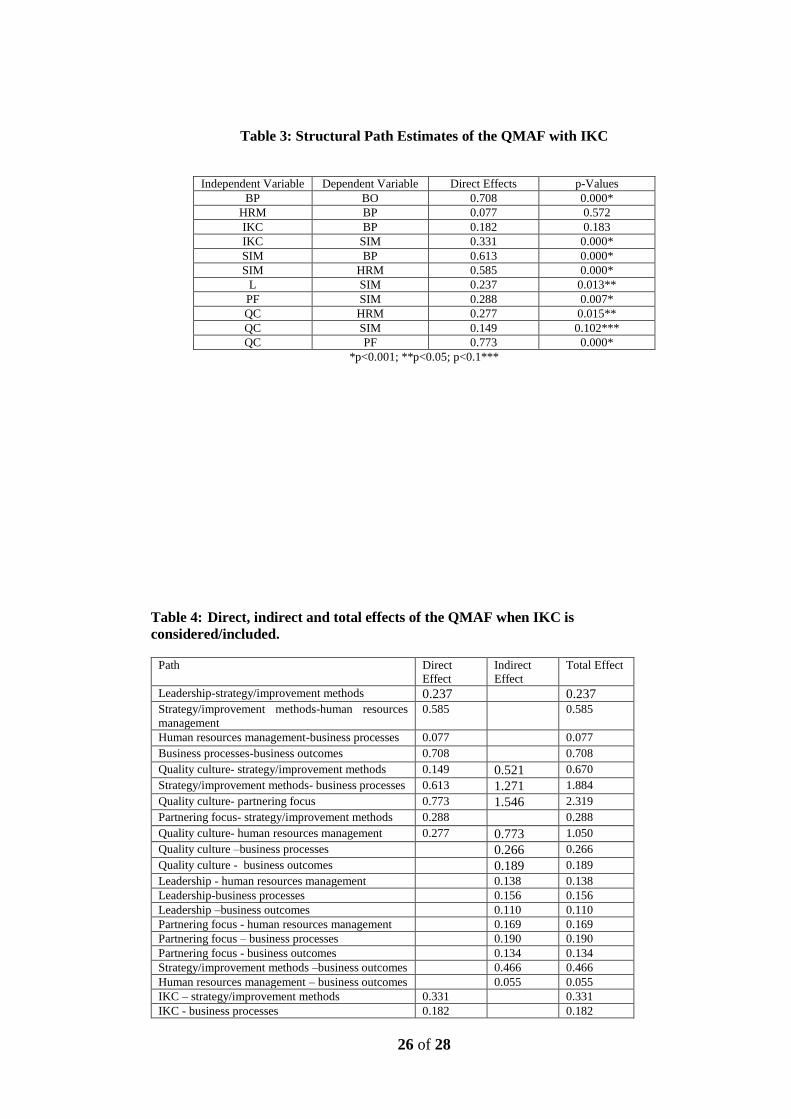
The Structural Path estimates and the t-Statistics for all direct effects in the QMAF
model with IKC are outlined in Table 3.
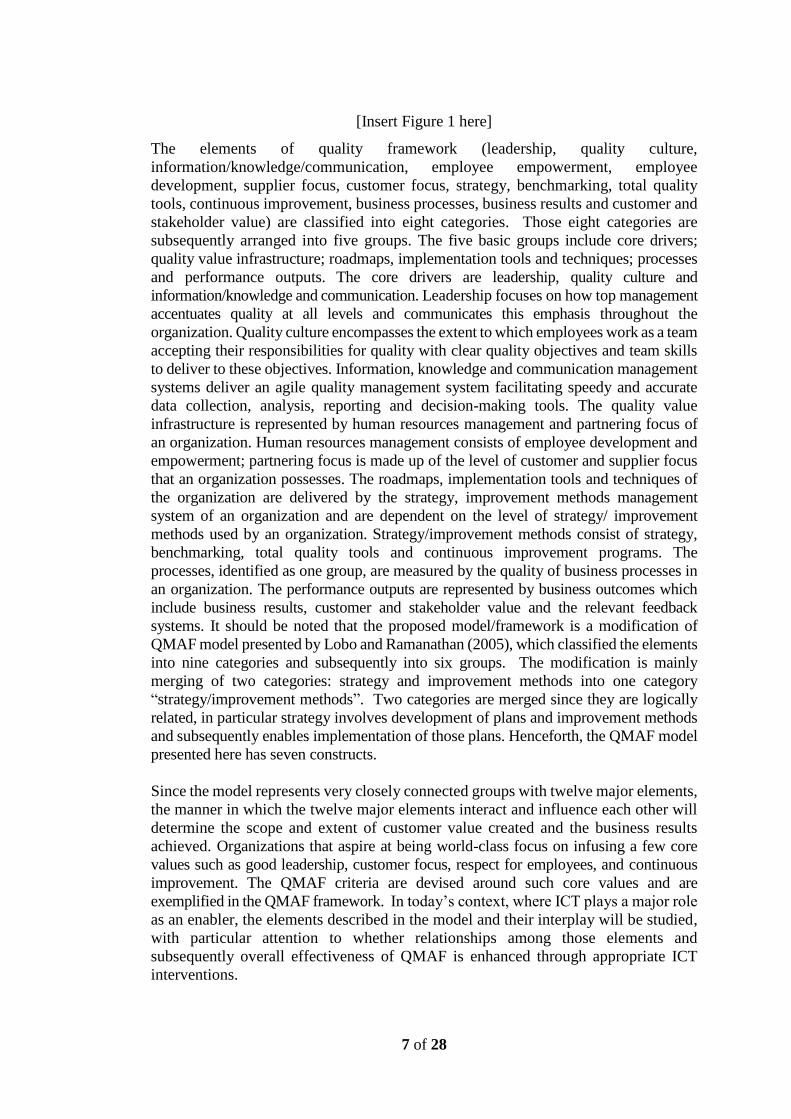
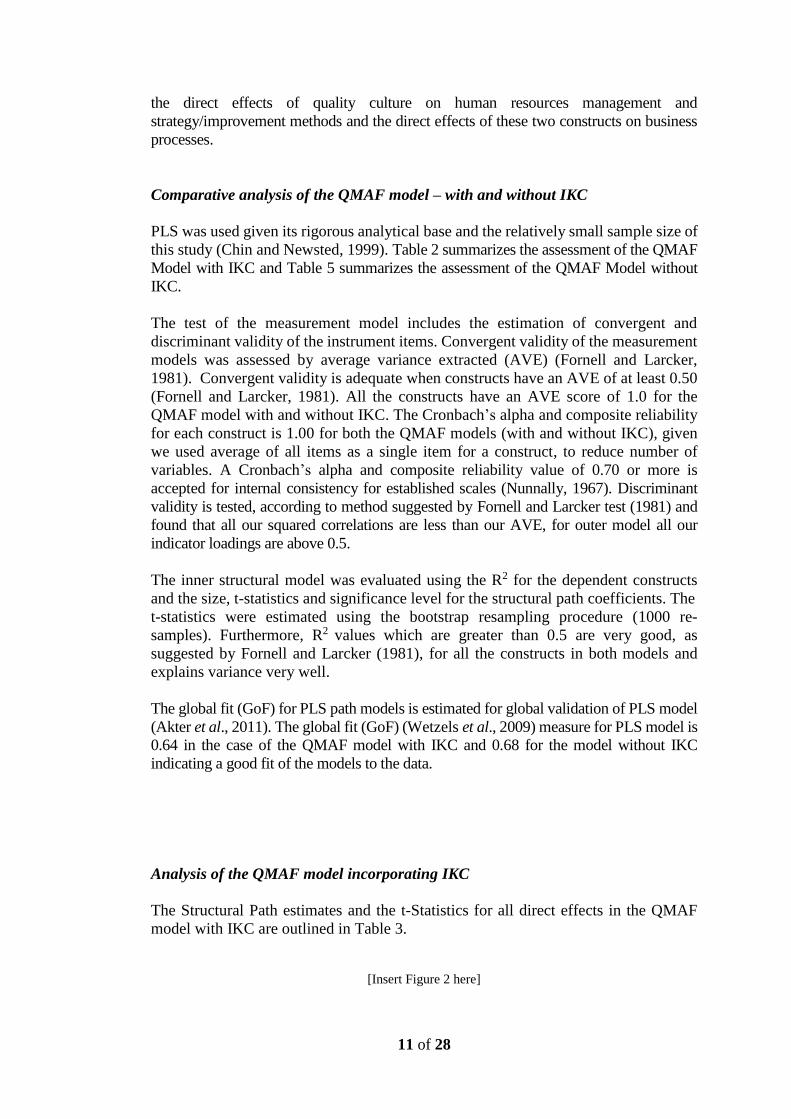
[Insert Figure 2 here]

12 of 28
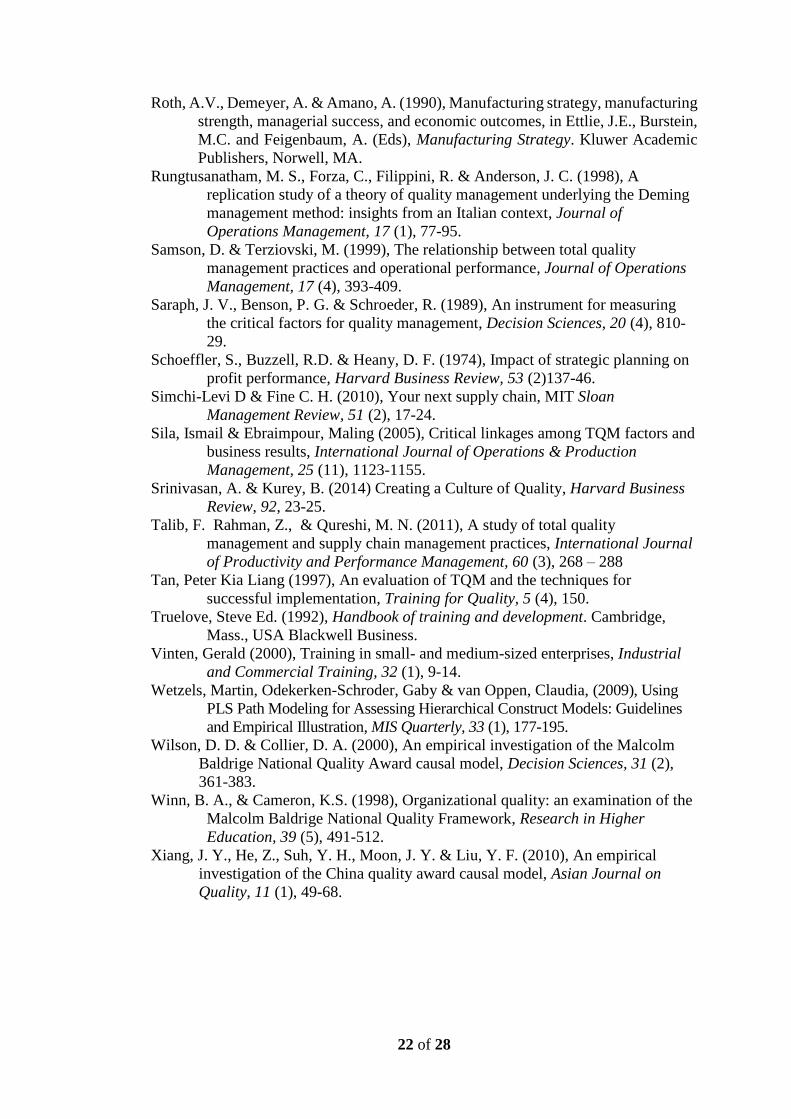
The standardized path coefficients for the QMAF model with IKC represent set of
causal relationships and are presented in Figure 2. Table 4 outlines the direct, indirect
and total effects of the constructs of the QMAF when IKC is considered and included
in the model. Most of the direct, indirect and total effects tested are found to be
significant. It can be noted from Figure 2 that direct effect of information, knowledge
and communication (IKC) on business outcome (BO) is 0.182. Similarly, indirect effect
of IKC on BO as shown in Table 4 is 0.283. It should be noted that both direct and
indirect effects shown in Table 4 are evaluated using smart PLS software. For
example, indirect effect of IKC on BO can be evaluated manually using effects of other
paths between IKC and BO and is shown below:
Indirect effect of IKC on BO = {(Direct effect of IKC on BP x direct effect of BP on
BO) + (direct effect of IKC on SIM x direct effect of
SIM on BP x direct effect of BP on BO) + (direct
effect of IKC on SIM x direct effect of SIM on HRM
x direct effect of HRM on BP x direct effect of BP on
BO)}
= {(0.182 x 0.708) + (0.331 x 0.613 x 0.708) +
(0.331 x 0.585 x 0.077 x 0.708)}
= 0.283
In this case, Leadership has a significant direct effect on strategy/improvement
methods; Strategy/improvement methods have a significant direct effect on human
resources management followed by human resources management which has a direct
effect on business processes; and a significant path coefficient indicating business
processes have a direct effect on business outcomes. Similarly quality culture has a
direct effect on strategy/improvement methods, partnering focus and human resources
management. In addition, strategy/improvement methods have direct effect on
business processes.
Significant path coefficients accentuate the following inferences: Quality culture has
an indirect positive effect on strategy/improvement methods through partnering focus;
human resources management through partnering focus followed by
strategy/improvement methods; business processes through strategy/improvement
methods; business processes through human resources management; and business
outcomes through strategy/improvement methods followed by business processes.
Leadership indirectly has a significant positive effect on human resources management
through strategy/improvement methods; business processes through
strategy/improvement methods followed by human resources management; business
outcomes through strategy/improvement methods followed by human resources
management and business processes
Strategy/improvement methods indirectly has a significant positive effect on business
processes through human resources management. Strategy/improvement methods
have an indirect effect on business outcomes through business processes.
IKC has a direct significant effect on strategy/improvement methods; however IKC
does not have a direct effect on business processes. A strong IKC program indirectly
supports good human resources management through good strategy/improvement

13 of 28
methods and indirectly supports good business processes through good
strategy/improvement methods followed by good human resources management.
Additionally a robust IKC program indirectly supports good business outcomes
through good strategy/improvement methods followed by good human resources
management and good business processes.
Human resources management does not have a direct effect on business processes.
Partnering focus has a direct effect on strategy in the QMAF model with IKC. Quality
culture does have an indirect effect on business processes through partnering focus
followed by strategy/improvement methods and human resources management;
business outcomes through human resources management followed by business
processes; and business outcomes through partnering focus followed by
strategy/improvement methods, human resources management and business processes.
Partnering focus does indirectly have a significant positive effect on human resources
management through strategy/improvement methods; business processes through
strategy/improvement methods followed by human resources management and
business outcomes through strategy/improvement methods followed by human
resources management and business processes.
Strategy/improvement methods do have a significant indirect effect on business
outcomes through human resources management followed by business processes in
the QMAF model with IKC. The path analysis also established that human resources
management has a significant positive effect on business outcomes indirectly through
business processes.
[Insert Tables 2-4 here]
Analysis of the QMAF model without IKC
The Structural Path estimates, the t-Statistics for all direct effects in the QMAF model
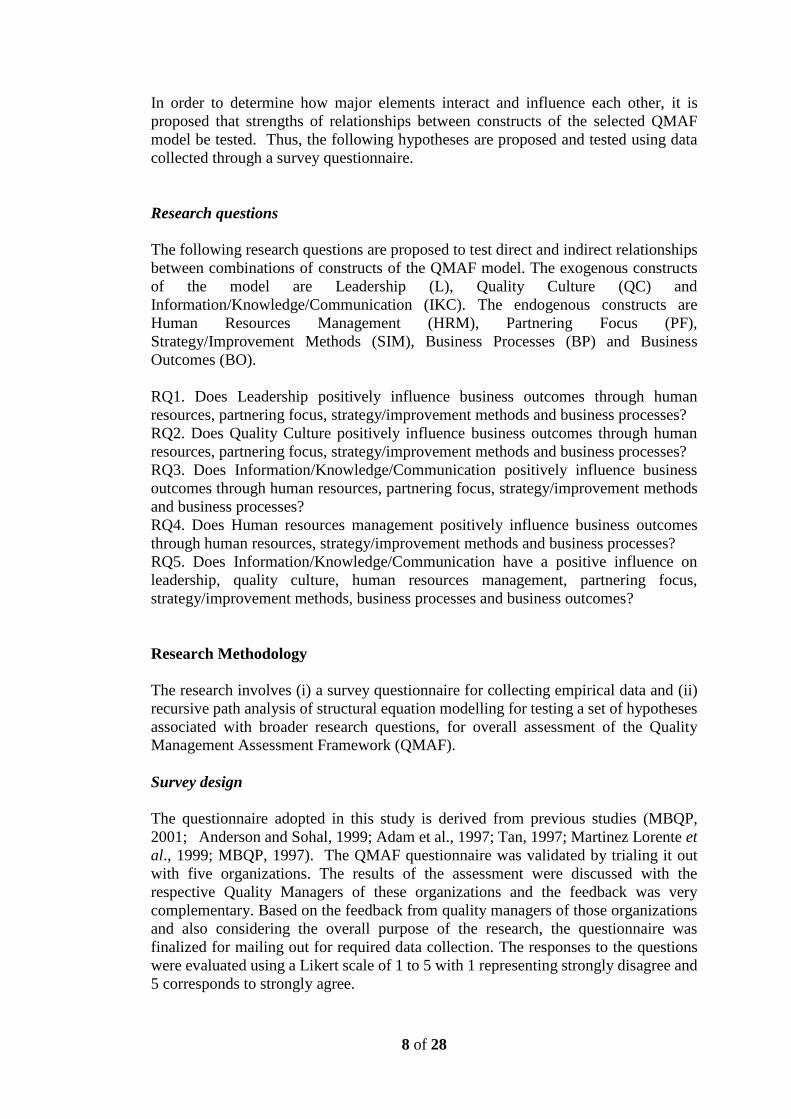
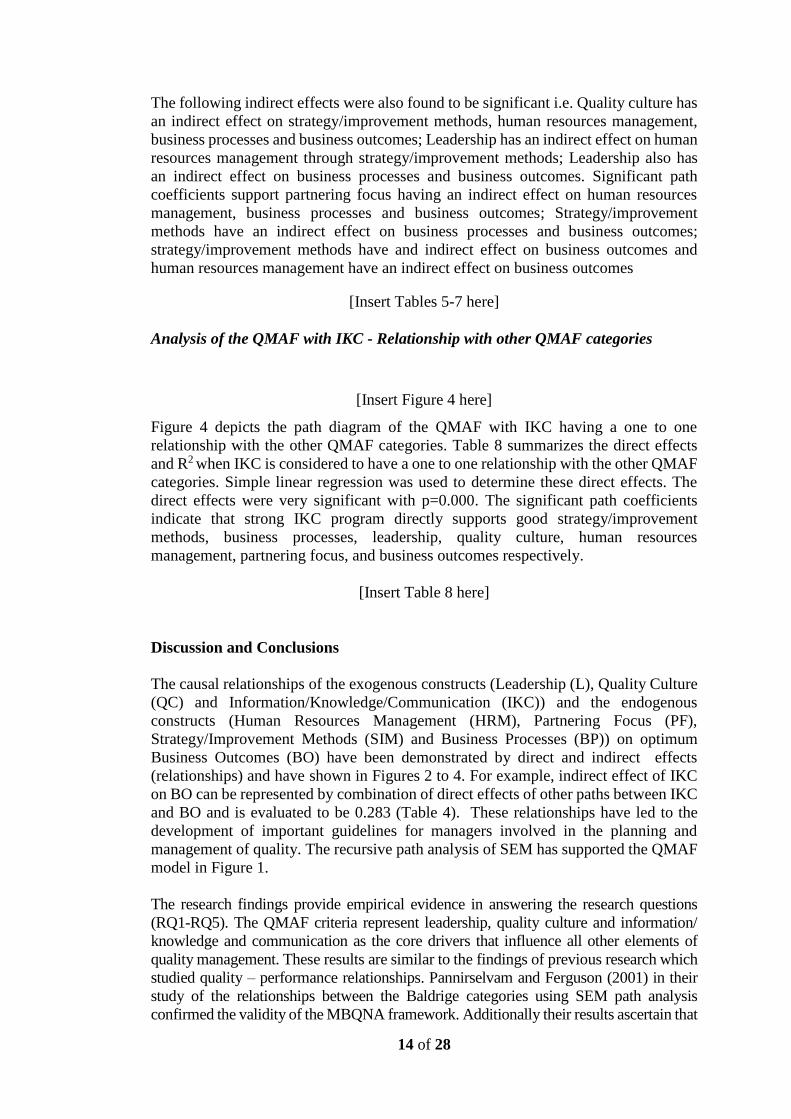
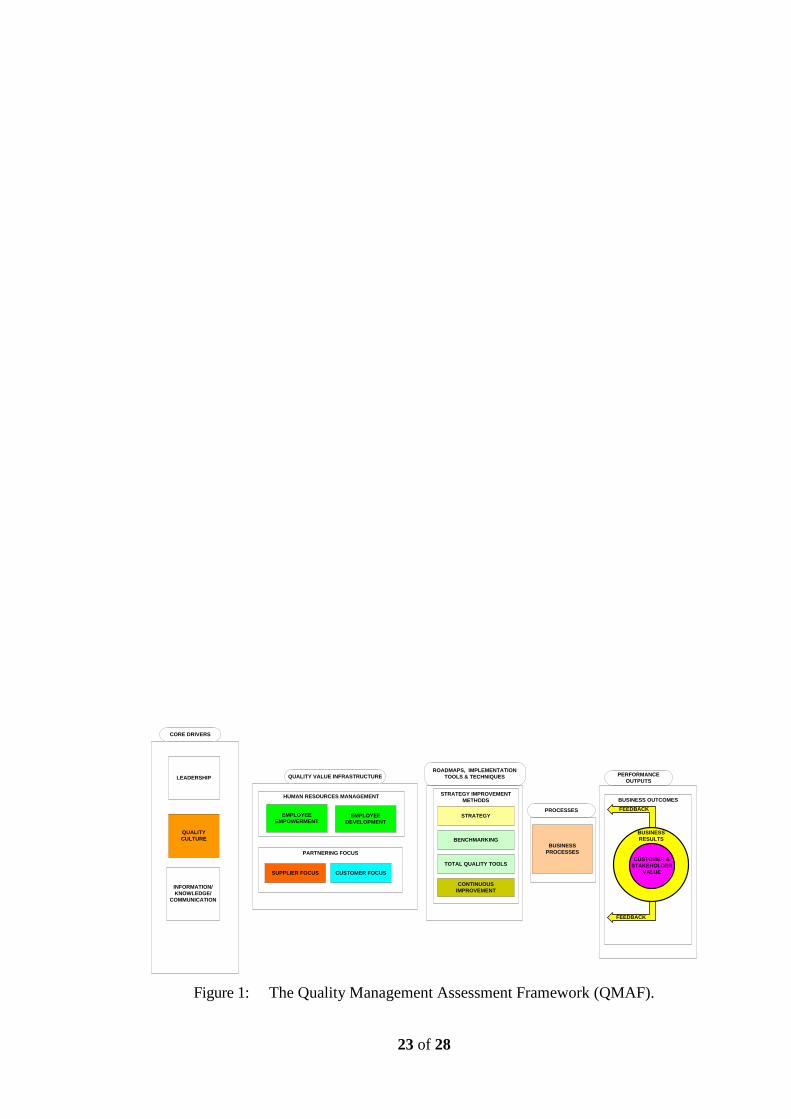
without IKC are outlined in Table 6. The standardized path coefficients of the QMAF
model without IKC for the set of causal relationships are presented in Figure 3. Table
7 outlines the direct, indirect and total effects of the constructs that were calculated for
the model without IKC.
[Insert Figure 3 here]
The direct effects were found to be very significant in the QMAF model without IKC,
except in the case of human resources management does not have a direct effect on
business processes. Therefore Leadership has a significant direct effect on
strategy/improvement methods. The significant path coefficient supports
Strategy/improvement methods having a significant direct effect on human resources
management. Similarly the significant path coefficient validates business processes
having a direct effect on business outcomes. Quality culture has a direct effect on
strategy/improvement methods, partnering focus and human resources management.
The significant supporting path coefficients confirm that strategy/improvement
methods have direct effect on business processes. Partnering focus has a direct effect
on strategy/improvement methods, this was affirmed by significant path coefficient.
14 of 28
The following indirect effects were also found to be significant i.e. Quality culture has
an indirect effect on strategy/improvement methods, human resources management,
business processes and business outcomes; Leadership has an indirect effect on human
resources management through strategy/improvement methods; Leadership also has
an indirect effect on business processes and business outcomes. Significant path
coefficients support partnering focus having an indirect effect on human resources
management, business processes and business outcomes; Strategy/improvement
methods have an indirect effect on business processes and business outcomes;
strategy/improvement methods have and indirect effect on business outcomes and
human resources management have an indirect effect on business outcomes
[Insert Tables 5-7 here]
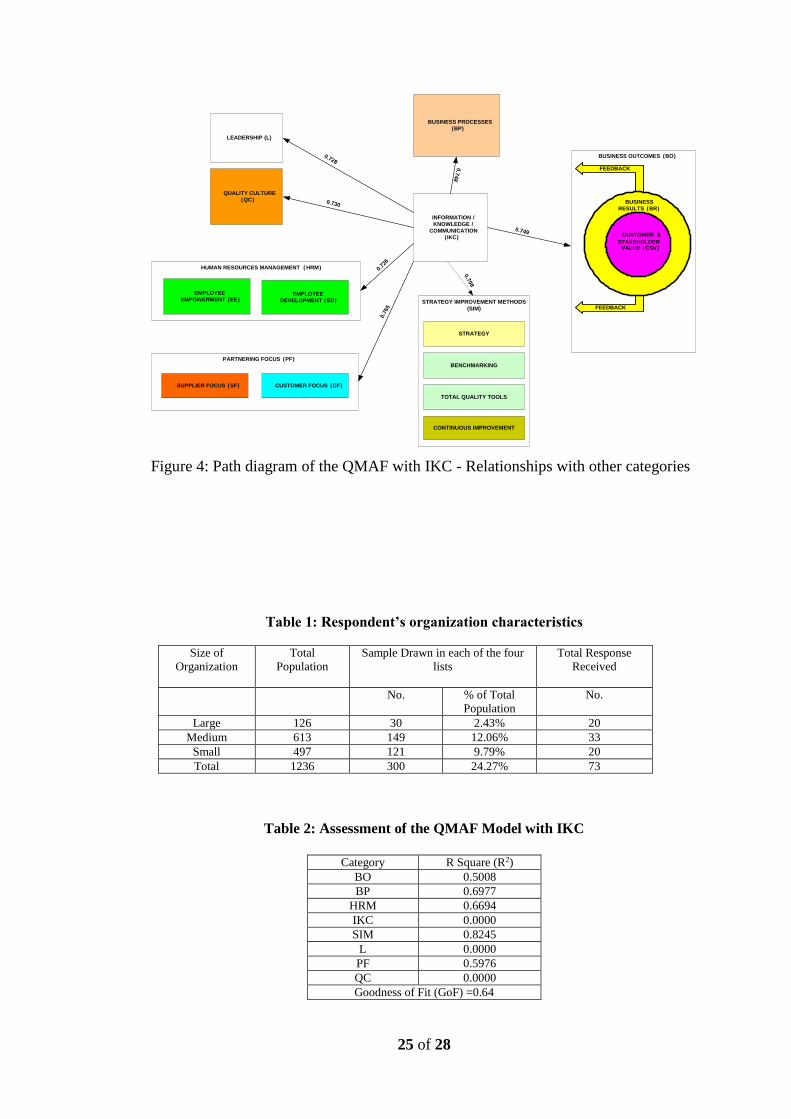
Analysis of the QMAF with IKC - Relationship with other QMAF categories
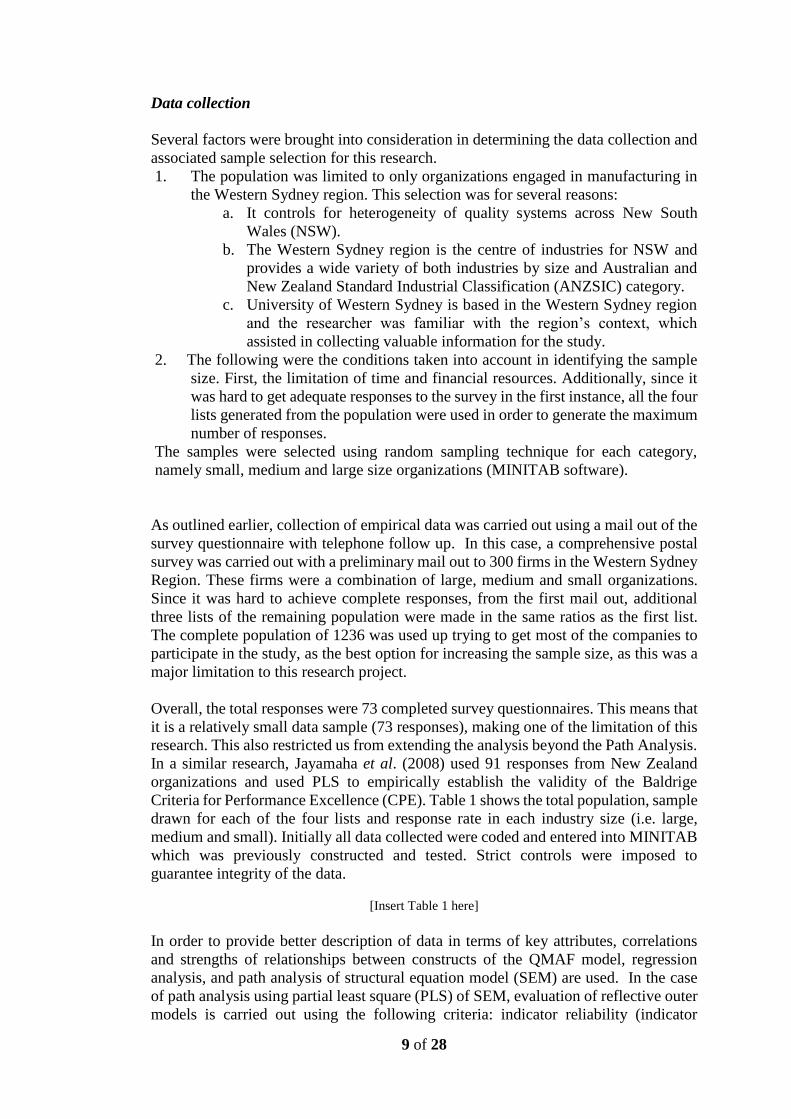
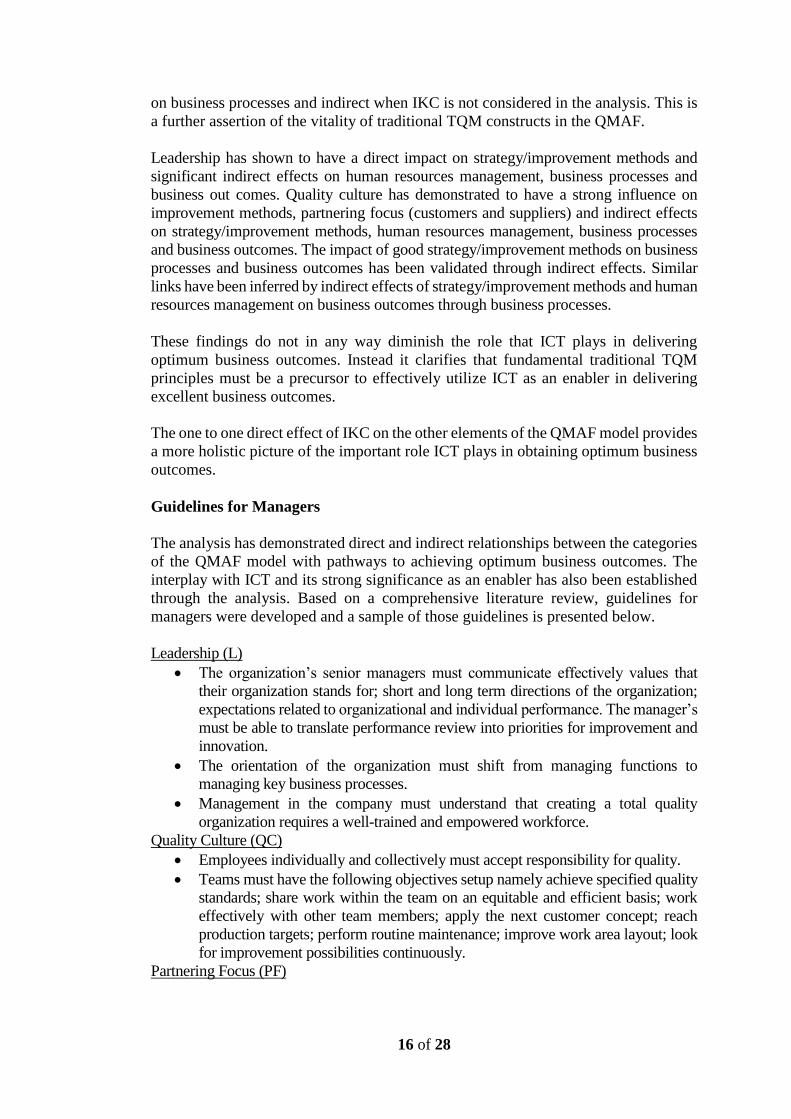
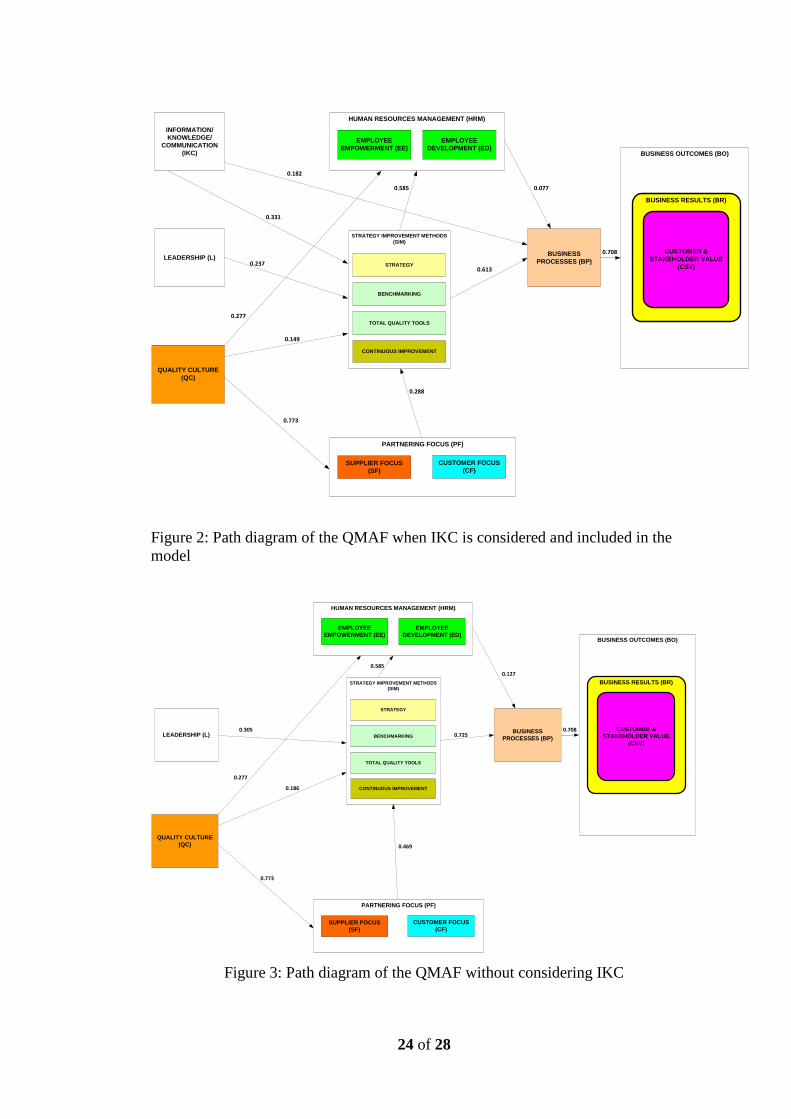
[Insert Figure 4 here]
Figure 4 depicts the path diagram of the QMAF with IKC having a one to one
relationship with the other QMAF categories. Table 8 summarizes the direct effects
and R2 when IKC is considered to have a one to one relationship with the other QMAF
categories. Simple linear regression was used to determine these direct effects. The
direct effects were very significant with p=0.000. The significant path coefficients
indicate that strong IKC program directly supports good strategy/improvement
methods, business processes, leadership, quality culture, human resources
management, partnering focus, and business outcomes respectively.
[Insert Table 8 here]
Discussion and Conclusions
The causal relationships of the exogenous constructs (Leadership (L), Quality Culture
(QC) and Information/Knowledge/Communication (IKC)) and the endogenous
constructs (Human Resources Management (HRM), Partnering Focus (PF),
Strategy/Improvement Methods (SIM) and Business Processes (BP)) on optimum
Business Outcomes (BO) have been demonstrated by direct and indirect effects
(relationships) and have shown in Figures 2 to 4. For example, indirect effect of IKC
on BO can be represented by combination of direct effects of other paths between IKC
and BO and is evaluated to be 0.283 (Table 4). These relationships have led to the
development of important guidelines for managers involved in the planning and
management of quality. The recursive path analysis of SEM has supported the QMAF
model in Figure 1.
The research findings provide empirical evidence in answering the research questions
(RQ1-RQ5). The QMAF criteria represent leadership, quality culture and information/
knowledge and communication as the core drivers that influence all other elements of
quality management. These results are similar to the findings of previous research which
studied quality – performance relationships. Pannirselvam and Ferguson (2001) in their
study of the relationships between the Baldrige categories using SEM path analysis
confirmed the validity of the MBQNA framework. Additionally their results ascertain that

15 of 28
leadership significantly directly and indirectly impacts human resources management,
product and process management, customer focus and relationship management, business
results and customer satisfaction, except for strategic quality planning and information
management as it was not tested in the model. Panirselvam and Ferguson have determined
that human resources management has a significant indirect influence on an organization’s
performance through product and process management and customer focus and
relationship management efforts. Their research also established that information
management is vital to effectively plan and to also execute those plans. The customer focus
construct in Pannirselvam and Ferguson’s model had the most significant impact on
business and customer satisfaction results.
Flynn et al., (1995) used (SEM) path analysis to study a quality framework which focused
on both core quality management practices and on the infrastructure that creates an
environment supporting their use. Flynn et al., (1995) determined that top management
support has a significant effect on human resources management. Flynn also established
that perceived quality market outcomes were chiefly related to statistical control/feedback
and the product design process. Furthermore, Flynn also determined that the percent of
product that passed final inspection without needing rework was strongly related to
process flow management and to a lesser extent to statistical control/feedback. Adam et
al., (1997) used factor analysis on their survey data - their results suggest that an
organization’s approach to quality has a stronger association with actual quality and a
lesser extent to financial performance. They further determined that the major factors
found to impact actual quality were the organization’s knowledge of quality management,
the extent of customer focus and management participation. Winn and Cameron's (1998)
model, based on exploratory factor analysis, also concluded that the main effect of
leadership was on the system dimensions, not on the outcome dimensions.
Therefore, validating the model provides useful guidelines to managers in deciding
which pathways to choose in order to devote resources towards achieving business
outcomes. Leadership has shown to have a direct impact on strategy /improvement
methods and significant indirect effects on human resources management, business
processes and business outcomes. Quality culture has demonstrated to have a strong
influence on strategy/ improvement methods, partnering focus (customers and suppliers)
and indirect effects on strategy/improvement methods, human resources management,
business processes and business outcomes. Information/knowledge/communication has
shown to have direct influence on all the constructs, namely leadership, quality culture,
partnering focus, strategy/improvement methods, human resources management,
business processes and business outcomes. Significant indirect effects of IKC were also
noted on human resources
management, business processes and business outcomes. Indirect effects of
strategy/improvement methods on business outcomes through business processes have
also been inferred.
The results of the analysis of the QMAF model without considering ICT affirm the
importance of the pathways towards meeting business outcomes with the traditional
TQM constructs, namely leadership, quality culture, strategy/improvement methods,
partnering focus, human resources management, and business processes. This is
reinforced by the increased strengths of the path coefficients and the significance with
in the (SEM) path analysis most direct effects except human resources management
16 of 28
on business processes and indirect when IKC is not considered in the analysis. This is
a further assertion of the vitality of traditional TQM constructs in the QMAF.
Leadership has shown to have a direct impact on strategy/improvement methods and
significant indirect effects on human resources management, business processes and
business out comes. Quality culture has demonstrated to have a strong influence on
improvement methods, partnering focus (customers and suppliers) and indirect effects
on strategy/improvement methods, human resources management, business processes
and business outcomes. The impact of good strategy/improvement methods on business
processes and business outcomes has been validated through indirect effects. Similar
links have been inferred by indirect effects of strategy/improvement methods and human
resources management on business outcomes through business processes.
These findings do not in any way diminish the role that ICT plays in delivering
optimum business outcomes. Instead it clarifies that fundamental traditional TQM
principles must be a precursor to effectively utilize ICT as an enabler in delivering
excellent business outcomes.
The one to one direct effect of IKC on the other elements of the QMAF model provides
a more holistic picture of the important role ICT plays in obtaining optimum business
outcomes.
Guidelines for Managers
The analysis has demonstrated direct and indirect relationships between the categories
of the QMAF model with pathways to achieving optimum business outcomes. The
interplay with ICT and its strong significance as an enabler has also been established
through the analysis. Based on a comprehensive literature review, guidelines for
managers were developed and a sample of those guidelines is presented below.
Leadership (L)
The organization’s senior managers must communicate effectively values that
their organization stands for; short and long term directions of the organization;
expectations related to organizational and individual performance. The manager’s
must be able to translate performance review into priorities for improvement and
innovation.
The orientation of the organization must shift from managing functions to
managing key business processes.
Management in the company must understand that creating a total quality
organization requires a well-trained and empowered workforce.
Quality Culture (QC)
Employees individually and collectively must accept responsibility for quality.
Teams must have the following objectives setup namely achieve specified quality
standards; share work within the team on an equitable and efficient basis; work
effectively with other team members; apply the next customer concept; reach
production targets; perform routine maintenance; improve work area layout; look
for improvement possibilities continuously.
Partnering Focus (PF)
17 of 28
Customer needs must be determined by the following means telephone surveys,
feedback from sales personnel, formal customer surveys, focus groups, competitor
analysis, data mining approaches.
Research must be conducted to project future customers and predict what their key
requirements are likely to be.
The organization must have systems which identify customer’s current needs,
future needs, level of satisfaction and customer’s loyalty.
The organization must be willing to share strategic information with selected
suppliers.
The organization must select suppliers based on formal evaluations and
assessments.
The organization must believe that the strategic direction, role and performance of
their supply chain partners are critical to achieving success.
The organization must facilitate a strong supply network fostering cooperation
with entire chain of primary and secondary suppliers. The organization must
facilitate a strong supply network fostering cooperation with entire chain of
primary and secondary suppliers.
Human Resources Management (HRM)
Training needs require to be identified based on: performance appraisals, business
requirements and staff profiles.
Organizations must have processes in place to foster the following in employee
involvement: educating, enabling and encouraging.
The organization must implement a number of innovative approaches to job and
work design such as self-directed teams throughout all areas of the organization.
The organization must implement a reliable performance assessment system that
is linked to a reward system.
The organization must utilize cross-functional work teams for managing day-to-
day operations. The organization must link significant portion of employee
performance to productivity.
Strategy (S)/ Improvement Methods (IM)
The strategic planning process must address the objectives and challenges related
to the following: customer and market needs/ expectations/ opportunities;
competitive environment and capabilities relative to competitors; technological
and other changes that might affect product/ services/ operations; strengths and
weaknesses, including human and other resources; supplier/ partner strengths and
weaknesses; financial societal, and other potential risks and environmental issues.
The organization must have well established procedures to develop and deploy
action plans, based on the strategic plan, to achieve key objectives.
Benchmarks must align with the organization’s strategic plans, ensure the quality
of data for performance measurement is high; analysis of benchmarks must be
used to determine the current competitive gap; project future performance levels;
establish functional goals; implement specific actions and monitor progress;
factors critical for improved performances must be identified post-analysis of
benchmarks; findings of analysis must be communicated to the relevant people to
plan and implement change.
Organizations must effectively apply total quality tools. The TQ tools to be
considered are flowcharts, cause and effect diagrams, multi voting, affinity
diagrams, process action teams, election grids, task lists, Deming cycle (PDCA),
sampling techniques, scatter diagrams, Pareto charts, run charts, control charts,
18 of 28
histograms, process mapping tools, FMEA (Failure Mode and Effect Analysis),
QFD (Quality Function Development), Creativity tools/ Idea generation tools,
display/ visualization tools, standardization tools, 5S and Taguchi methodology of
experimental design.
Continuous improvement (CI) processes must be strengthened through training of
personnel, monitoring of CI process, top management support for CI programs, CI
project leaders, suggestion scheme, application of PDCA, promotions through
notice boards, internal media, face to face communication; use of ISO 9000, total
productive maintenance regimes, formal policy deployment protocols and time
studies
Business Processes (BP)
Organizations require to demonstrate substantially reduced facility and operational
complexity over time.
The organization’s logistical capability must be significantly more responsive
(pull) as compared to predetermined (push) over time.
The organization must actively be involved in initiatives to standardise supply
chain practices and operations
Information, Knowledge, Communication (IKC)
Organizations can improve their Information, Knowledge and Communication systems
by:
using IT to manage its reporting systems, data collection and analysis of data and
decision making process;
ensuring logistics operating and planning databases are integrated across
applications within the organization;
ensuring the organization maintains an integrated database and access method to
facilitate information sharing;
ensuring that the organization has increased the use of integrated inventory,
transportation and warehousing planning systems and EDI standards;
ensuring the organization effectively shares operational information between
departments;
Business Outcomes (BO)
The organization must use ‘balanced scorecard’ approach to measurement.
All key business decisions and plans must be based upon an analysis of
performance data.
The implementation of change based on gaps identified through benchmarking
must lead to improvement in performance levels.
Therefore, Managers can further enhance their quality systems by developing and
deploying their business strategies using these guidelines.
References
Adam, E. E., Corbett L. M., Flores, B. E., Harrison, N. J., Lee, T. S., Rho B., Ribers,
J., Sampson, D., & Westbrook, R. (1997), An international study of quality
improvement approach and firm performance, International Journal of
Operations & Production Management, 17 (9), 842-73.
Akter, S., D’Ambra, J. & Ray, P. (2011), Trustworthiness in Health Information
Services: An Assessment of a Hierarchical Model with Mediating and
Moderating Effects using Partial Least Squares (PLS), Journal of the American
Society for Information Science and Technology, 62, 100-116.
19 of 28
Ahire, S. L., Golhar, D.Y. & Waller, M.A. (1996), Development and validation of
TQM implementation constructs, Decision Sciences, 27 (1), 23-56.
Anderson, M. & Sohal, A. S. (1999), A study of the relationship between quality
management practices and performance in small businesses, The
International Journal of Quality & Reliability Management, 16 (9), 859.
Anderson, J. C., Rungtusanatham, M. S., Schroeder, R.G. & Devaraj, S. (1995), A
path analytic model of a theory of quality management underlying the
Deming management method: preliminary empirical findings, Decision
Sciences, 26 (5), 637-58.
ASQ (1998), American Society for Quality urges expansion of Baldrige awards, PR
Newswire, 3 (26).
Bayazit, O., & Karpak, B. (2007), An analytical network process-based framework
for successful total quality management (TQM): An assessment of Turkish
manufacturing industry readiness, International Journal of Production
Economics, 105, 79-96.
Bhatt, Ganesh, D. (2001), Knowledge management in organizations: examining the
interaction between technologies, techniques, and people, Journal of
Knowledge Management, 5 (1), 68.
Bou-Llusar, J. Carlos, Escrig-Tena, Ana B., Roca-Puig, V., & Beltran-Martin,
Inmaculada (2005), To what extent do enablers explain results in the EFQM
excellence model? An empirical study, International Journal of Quality &
Reliability Management, 22 (4), 337-53.
Briggs, Senga, & Keogh, W. (1999), Integrating human resource strategy and
strategic planning to achieve business excellence, Total Quality
Management, 10 (4/5), S447-53.
Bunney, H. S., & Dale, B. G. (1997), The implementation of quality management
tools and techniques: a study, The TQM Magazine, 9 (3), 183-89.
Camp, R. C. (1989), Benchmarking: the search for industry best practices that lead
to superior performance. Milwaukee, Wisconsin: Quality Press.
Chen, I. J., Paetsch, K.A., & Paulraj, A. (1997), Quality manager involvement and
quality performance, International Journal of Operations and Production
Management, 17 (4), 399-412.
Chin, W.W., & Newsted, P. R. (1999), “Structural Equation Modeling analysis with
Small Samples Using Partial Least Squares”, in R. Hoyle (ed.), Statistical
Strategies for Small Sample Research, Thousand Oaks, CA: Sage
Publications, 307-341.
Cook, E., & Dale, B. G. (1995), Organizing for continuous improvement: an
examination, The TQM Magazine, 7 (1), 7–13.
Cronbach, L. J. (1951), Coefficient alpha and the internal structure of tests,
Psychometrika, 16, 297-334.
Dellana, Scott, A., & Hauser. R. D. (1999), Toward defining the quality culture,
Engineering Management Journal, 11 (2), 11.
Dick, G. P. M. (2009), Exploring performance attribution: The case of quality
management standards adoption and business performance, International
Journal of Productivity and Performance Management, 58 (4), 311 - 328
Dow, D., Samson, D. & Ford, S. (1999), Exploding the myth: do all quality
management practices contribute to superior quality performance?
Production and Operations Management Review, 8 (1), 1-27.
Evans, J. R. (1997), Critical linkages in the Baldrige award criteria: research models
and educational challenges, Quality Management Journal, 5 (1), 13-30.
20 of 28
Flynn, B. B., Schroeder, R.G. & Sakakibara, S. (1994), A framework for quality
management and an associated measurement instrument, Journal of
Operations Management, 11(4), 339-66.
Flynn, B. B., Schroeder, R. G., & Sakakibara, S. (1995), The impact of quality
management practices on performance and competitive advantage, Decision
Sciences, 26 (5), 659-92.
Flynn, B. B., & Saladin, B. (2001), Further evidence on the validity of the theoretical
models underlying the Baldrige criteria, Journal of Operations
Management, 19 (6), 617-52.
Fornell, Claes & Larcker, David, F. (1981), Structural equation models with
unobservable variables and measurement error: algebra and statistics,
Journal of Marketing Research, 18, 3, 39-50.
Gale, B.T., & Klavans, R. (1985), Formulating a quality improvement strategy, The
Journal of Business Strategy, 5, 21-32.
Garvin, David A. (1991), How the Baldrige Award Really Works, Harvard Business
Review, 69 (6), 80-93
Hair, J. F., Sarstedt, Pieper, T. M. & Ringle, C.M. (2012). The use of partial least
squares structural equation modeling in strategic management research: A
review of past practices and recommendations for future applications. Long
Range Planning 45, 320–340.
Hart, C.W. (1993), What's wrong - and right - with the Baldrige awards, Chief
Executive, November-December, 36-47.
Honold, Linda (1997), A review of the literature on employee empowerment,
Empowerment in Organizations, 5 (4), 202.
Howe, Vince, Richard, G. M., & Parker, J. (2000), Supporting new product
development with the Internet Industrial Management & Data Systems, 100
(6), 277.
Hyland, Paul, Mellorm Robert, O’Mara Eddie & Kondepudi Ramesh (2000), A
comparison of Australian firms and their use of continuous improvement
tools The TQM Magazine, 12 (2), 117-24.
Irani, Z., Beskese, A. & Love, P. (2004), Total quality management and corporate
culture: constructs of organisational excellence, Technovation, 24 (8), 643-
650.
Jayamaha, Nihal P., Grigg, Nigel P., & Mann, Robin S. (2008), Empirical validity
of Baldrige criteria: New Zealand evidence, International Journal of Quality
& Reliability Management, 25 (5), 477-93.
Lagorsen, Stefan (2001), Strengthening the weakest link of TQM - from customer
focus to customer understanding, The TQM Magazine, 13 (5), 348.
Lengnick-Hall, C.A., & Sanders, M.M. (1997), Designing effective learning systems
for management education: student roles, requisite variety, and practicing
what we teach, Academy of Management Journal, 40 (6), 1334-68.
Li, L.X. (1997), Relationships between the determinants of hospital quality
management and service quality performance - a path analytic model,
Omega, 25 (5), 535-45.
Lindsay, William M., & Preston, Arthur P. (2000), Maintaining quality through
evolving strategy: the TVS Partnership, Industrial Management & Data
Systems, 100 (4), 164 - 71.
Lobo, S.R. and K. Ramanathan, (2005) Information and Communication Technology
Supported Total Quality Management, in Technology Management A
Unifying Discipline For Melting The Boundaries, co-eds: T. R. Anderson, T.
21 of 28
U. Daim and D. R Kocaoglu, co-eds: D. Z. Milosevic and C. M. Weber, 310-
320.
Lobo, Stanislaus, Roque, Matawie, Kenan, M. & Samaranayake, Premaratne, (2012),
Assessment and improvement of quality management capabilities for
manufacturing industries in Australia, Total Quality Management, 23, (1),
103-121.
Main, J. (1990), How to win the Baldrige award, Fortune, 121 (9), 101-16.
Malcolm Baldrige Quality Program (1997), Criteria for Performance Excellence.
Gaithersburg, MD: National Institute for Standards and Technology.
Malcolm Baldrige Quality Program (2001), Criteria for Performance Excellence.
Gaithersburg, MD: National Institute for Standards and Technology.
Martinez-Lorente, Angel, R., Frank, Dewhurst Barrie, & Dale, G. (1999), TQM and
business innovation, European Journal of Innovation Management, 2 (1),
12.
Moore, M.T. (1995), Is TQM dead? Even quality leaders see gaps in ranks USA
Today, 17 October, 01B.
MSU, Logistics Supply Chain Management Research, Michigan State University.
Ngai, E.W.T., & Cheng, T. C. E. (1998), A survey of applications of computer-
based technologies in support of quality, The International Journal of
Quality & Reliability Management, 15 (8/9), 827-43.
Newby, Tony (1992), Cost-effective training: a manager’s guide, London Kogan
Page.
Nunnally, J. C., & Bernstein, I. H. (1994), Psychometric theory (3rd ed.). New
York: McGraw-Hill.
Pannirselvam, Gertrude P., & Fergurson, Lisa A. (2001), A study of the relationships
between the Baldrige categories, International Journal of Quality &
Reliability Management, 18 (1), 14-34.
Phillips, L.W., Chang, D.R. & Buzzell, R.D. (1983), Product quality, cost position
and business performance: a test of some hypothesis, Journal of Marketing,
47, 26-43.
Poister, T. H. and Harris, R. H. (1997), The impact of TQM on highway
maintenance: benefit/cost implications, Public Administration Review, 57
(4), 294-302.
Prajogo, D. I. & McDermott, C. M. (2005), The relationship between total quality
management practices and organizational culture, International Journal of
Operations & Production Management, 25 (11), 1101-1122.
Prajogo, D. I. & Sohal, A. S. (2003), The relationship between TQM practices,
quality performance, and innovation performance: an empirical examination,
International journal of quality & reliability management, 20 (8), 901-918.
Prajogo, D. I. & Sohal, A. S. (2006), The relationship between organization strategy,
total quality management (TQM), and organization performance––the
mediating role of TQM, European Journal of Operational Research, 168 (1),
35-50.
Quazi, H. A., Jemanjin, J., Kit, L. W. & Lee, C. (1998), Critical factors in quality
management and guidelines for self-assessment: The case of Singapore, Total
Quality Management, 9 (1), 35-55.
Roth, A.V. & Miller, J. (1989). nternational manufacturing strategies: a comparative
analysis in Ferdows, E. (Ed.), Managing International Manufacturing, Elsevier
Science Publishers, Amsterdam.
22 of 28
Roth, A.V., Demeyer, A. & Amano, A. (1990), Manufacturing strategy, manufacturing
strength, managerial success, and economic outcomes, in Ettlie, J.E., Burstein,
M.C. and Feigenbaum, A. (Eds), Manufacturing Strategy. Kluwer Academic
Publishers, Norwell, MA.
Rungtusanatham, M. S., Forza, C., Filippini, R. & Anderson, J. C. (1998), A
replication study of a theory of quality management underlying the Deming
management method: insights from an Italian context, Journal of
Operations Management, 17 (1), 77-95.
Samson, D. & Terziovski, M. (1999), The relationship between total quality
management practices and operational performance, Journal of Operations
Management, 17 (4), 393-409.
Saraph, J. V., Benson, P. G. & Schroeder, R. (1989), An instrument for measuring
the critical factors for quality management, Decision Sciences, 20 (4), 810-
29.
Schoeffler, S., Buzzell, R.D. & Heany, D. F. (1974), Impact of strategic planning on
profit performance, Harvard Business Review, 53 (2)137-46.
Simchi-Levi D & Fine C. H. (2010), Your next supply chain, MIT Sloan
Management Review, 51 (2), 17-24.
Sila, Ismail & Ebraimpour, Maling (2005), Critical linkages among TQM factors and
business results, International Journal of Operations & Production
Management, 25 (11), 1123-1155.
Srinivasan, A. & Kurey, B. (2014) Creating a Culture of Quality, Harvard Business
Review, 92, 23-25.
Talib, F. Rahman, Z., & Qureshi, M. N. (2011), A study of total quality
management and supply chain management practices, International Journal
of Productivity and Performance Management, 60 (3), 268 – 288
Tan, Peter Kia Liang (1997), An evaluation of TQM and the techniques for
successful implementation, Training for Quality, 5 (4), 150.
Truelove, Steve Ed. (1992), Handbook of training and development. Cambridge,
Mass., USA Blackwell Business.
Vinten, Gerald (2000), Training in small- and medium-sized enterprises, Industrial
and Commercial Training, 32 (1), 9-14.
Wetzels, Martin, Odekerken-Schroder, Gaby & van Oppen, Claudia, (2009), Using
PLS Path Modeling for Assessing Hierarchical Construct Models: Guidelines
and Empirical Illustration, MIS Quarterly, 33 (1), 177-195.
Wilson, D. D. & Collier, D. A. (2000), An empirical investigation of the Malcolm
Baldrige National Quality Award causal model, Decision Sciences, 31 (2),
361-383.
Winn, B. A., & Cameron, K.S. (1998), Organizational quality: an examination of the
Malcolm Baldrige National Quality Framework, Research in Higher
Education, 39 (5), 491-512.
Xiang, J. Y., He, Z., Suh, Y. H., Moon, J. Y. & Liu, Y. F. (2010), An empirical
investigation of the China quality award causal model, Asian Journal on
Quality, 11 (1), 49-68.
23 of 28
QUALITY
CULTURE
LEADERSHIP
INFORMATION/
KNOWLEDGE/
COMMUNICATION
CORE DRIVERS
HUMAN RESOURCES MANAGEMENT
EMPLOYEE
EMPOWERMENTEMPLOYEE
DEVELOPMENT
PARTNERING FOCUS
CUSTOMER FOCUSSUPPLIER FOCUS
QUALITY VALUE INFRASTRUCTURE
STRATEGY IMPROVEMENT
METHODS
BENCHMARKING
TOTAL QUALITY TOOLS
CONTINUOUS
IMPROVEMENT
ROADMAPS, IMPLEMENTATION
TOOLS & TECHNIQUES
PROCESSES
BUSINESS
PROCESSES
PERFORMANCE
OUTPUTS
BUSINESS OUTCOMES
FEEDBACK
FEEDBACK
CUSTOMER &
STAKEHOLDER
VALUE
BUSINESS
RESULTS
STRATEGY
Figure 1: The Quality Management Assessment Framework (QMAF).
24 of 28
LEADERSHIP (L)
INFORMATION/
KNOWLEDGE/
COMMUNICATION
(IKC)
QUALITY CULTURE
(QC)
HUMAN RESOURCES MANAGEMENT (HRM)
EMPLOYEE
EMPOWERMENT (EE)
EMPLOYEE
DEVELOPMENT (ED)
PARTNERING FOCUS (PF)
CUSTOMER FOCUS
(CF)SUPPLIER FOCUS
(SF)
BUSINESS
PROCESSES (BP)
BUSINESS OUTCOMES (BO)
0.708
BUSINESS RESULTS (BR)
CUSTOMER &
STAKEHOLDER VALUE
(CSV)
STRATEGY IMPROVEMENT METHODS
(SIM)
BENCHMARKING
TOTAL QUALITY TOOLS
CONTINUOUS IMPROVEMENT
STRATEGY
0.077
0.182
0.331
0.613
0.585
0.237
0.288
0.277
0.149
0.773
Figure 2: Path diagram of the QMAF when IKC is considered and included in the
model
LEADERSHIP (L)
QUALITY CULTURE
(QC)
HUMAN RESOURCES MANAGEMENT (HRM)
EMPLOYEE
EMPOWERMENT (EE)
EMPLOYEE
DEVELOPMENT (ED)
PARTNERING FOCUS (PF)
CUSTOMER FOCUS
(CF)SUPPLIER FOCUS
(SF)
BUSINESS
PROCESSES (BP)
BUSINESS OUTCOMES (BO)
0.708
BUSINESS RESULTS (BR)
CUSTOMER &
STAKEHOLDER VALUE
(CSV)
STRATEGY IMPROVEMENT METHODS
(SIM)
BENCHMARKING
TOTAL QUALITY TOOLS
CONTINUOUS IMPROVEMENT
STRATEGY
0.127
0.725
0.585
0.305
0.469
0.277
0.186
0.773
Figure 3: Path diagram of the QMAF without considering IKC
25 of 28
LEADERSHIP (L)
INFORMATION /
KNOWLEDGE /
COMMUNICATION
( IKC)
QUALITY CULTURE
(QC)
HUMAN RESOURCES MANAGEMENT ( HRM)
EMPLOYEE
EMPOWERMENT (EE)EMPLOYEE
DEVELOPMENT (ED)
PARTNERING FOCUS (PF)
CUSTOMER FOCUS (CF)SUPPLIER FOCUS (SF)
BUSINESS PROCESSES
(BP)
BUSINESS OUTCOMES (BO)
FEEDBACK
FEEDBACK
CUSTOMER &
STAKEHOLDER VALUE ( CSV)
BUSINESS
RESULTS (BR)
0.728
0.730
0.72
6
0.7
65
0.7
08
0.7
48
0.749
STRATEGY IMPROVEMENT METHODS
(SIM)
BENCHMARKING
TOTAL QUALITY TOOLS
CONTINUOUS IMPROVEMENT
STRATEGY
Figure 4: Path diagram of the QMAF with IKC - Relationships with other categories
Table 1: Respondent’s organization characteristics
Size of
Organization
Total
Population
Sample Drawn in each of the four
lists
Total Response
Received
No. % of Total
Population
No.
Large 126 30 2.43% 20
Medium 613 149 12.06% 33
Small 497 121 9.79% 20
Total 1236 300 24.27% 73
Table 2: Assessment of the QMAF Model with IKC
Category R Square (R2)
BO 0.5008
BP 0.6977
HRM 0.6694
IKC 0.0000
SIM 0.8245
L 0.0000
PF 0.5976
QC 0.0000
Goodness of Fit (GoF) =0.64
26 of 28
Table 3: Structural Path Estimates of the QMAF with IKC
Independent Variable Dependent Variable Direct Effects p-Values
BP BO 0.708 0.000*
HRM BP 0.077 0.572
IKC BP 0.182 0.183
IKC SIM 0.331 0.000*
SIM BP 0.613 0.000*
SIM HRM 0.585 0.000*
L SIM 0.237 0.013**
PF SIM 0.288 0.007*
QC HRM 0.277 0.015**
QC SIM 0.149 0.102***
QC PF 0.773 0.000*
*p<0.001; **p<0.05; p<0.1***
Table 4: Direct, indirect and total effects of the QMAF when IKC is
considered/included.
Path Direct
Effect Indirect
Effect Total Effect
Leadership-strategy/improvement methods 0.237 0.237 Strategy/improvement methods-human resources
management
0.585 0.585
Human resources management-business processes 0.077 0.077
Business processes-business outcomes 0.708 0.708
Quality culture- strategy/improvement methods 0.149 0.521 0.670
Strategy/improvement methods- business processes 0.613 1.271 1.884
Quality culture- partnering focus 0.773 1.546 2.319
Partnering focus- strategy/improvement methods 0.288 0.288
Quality culture- human resources management 0.277 0.773 1.050
Quality culture –business processes 0.266 0.266
Quality culture - business outcomes 0.189 0.189
Leadership - human resources management 0.138 0.138
Leadership-business processes 0.156 0.156
Leadership –business outcomes 0.110 0.110
Partnering focus - human resources management 0.169 0.169
Partnering focus – business processes 0.190 0.190
Partnering focus - business outcomes 0.134 0.134
Strategy/improvement methods –business outcomes 0.466 0.466
Human resources management – business outcomes 0.055 0.055
IKC – strategy/improvement methods 0.331 0.331
IKC - business processes 0.182 0.182
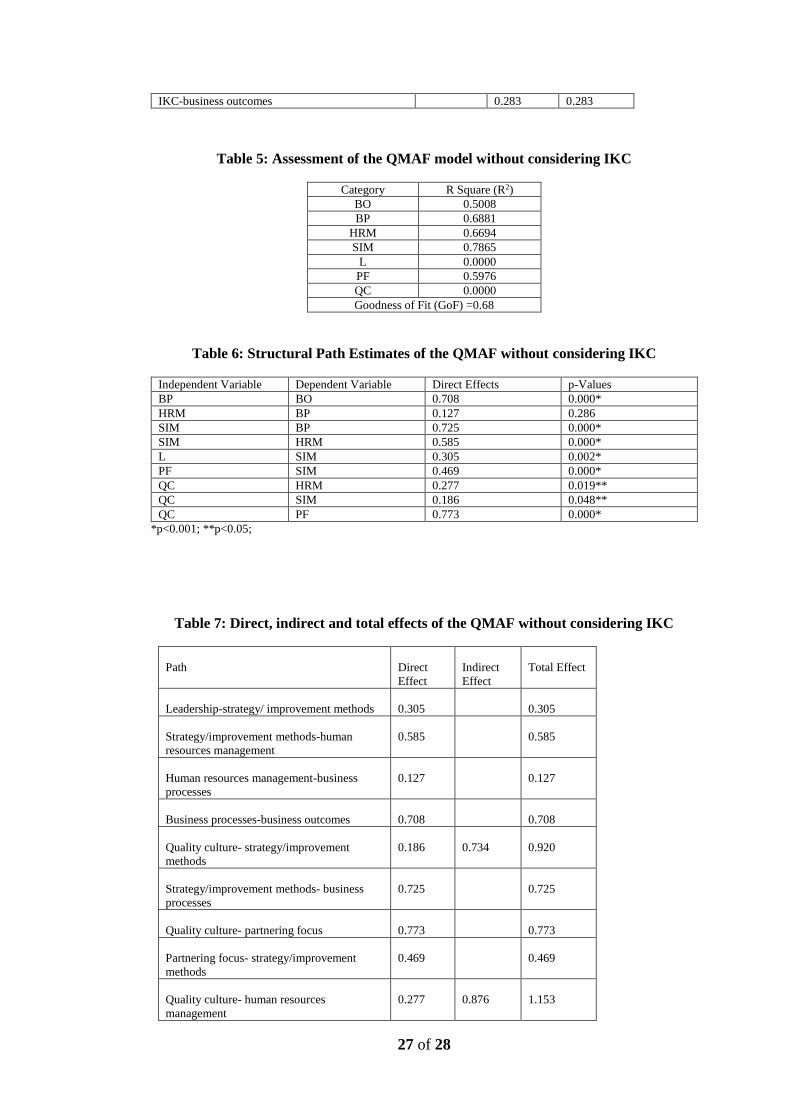
27 of 28
IKC-business outcomes 0.283 0.283
Table 5: Assessment of the QMAF model without considering IKC
Category R Square (R2)
BO 0.5008
BP 0.6881
HRM 0.6694
SIM 0.7865
L 0.0000
PF 0.5976
QC 0.0000
Goodness of Fit (GoF) =0.68
Table 6: Structural Path Estimates of the QMAF without considering IKC
Independent Variable Dependent Variable Direct Effects p-Values
BP BO 0.708 0.000*
HRM BP 0.127 0.286
SIM BP 0.725 0.000*
SIM HRM 0.585 0.000*
L SIM 0.305 0.002*
PF SIM 0.469 0.000*
QC HRM 0.277 0.019**
QC SIM 0.186 0.048**
QC PF 0.773 0.000*
*p<0.001; **p<0.05;
Table 7: Direct, indirect and total effects of the QMAF without considering IKC
Path Direct
Effect
Indirect
Effect
Total Effect
Leadership-strategy/ improvement methods 0.305 0.305
Strategy/improvement methods-human
resources management
0.585 0.585
Human resources management-business
processes
0.127 0.127
Business processes-business outcomes 0.708 0.708
Quality culture- strategy/improvement
methods
0.186 0.734 0.920
Strategy/improvement methods- business
processes
0.725 0.725
Quality culture- partnering focus 0.773 0.773
Partnering focus- strategy/improvement
methods
0.469 0.469
Quality culture- human resources
management
0.277 0.876 1.153
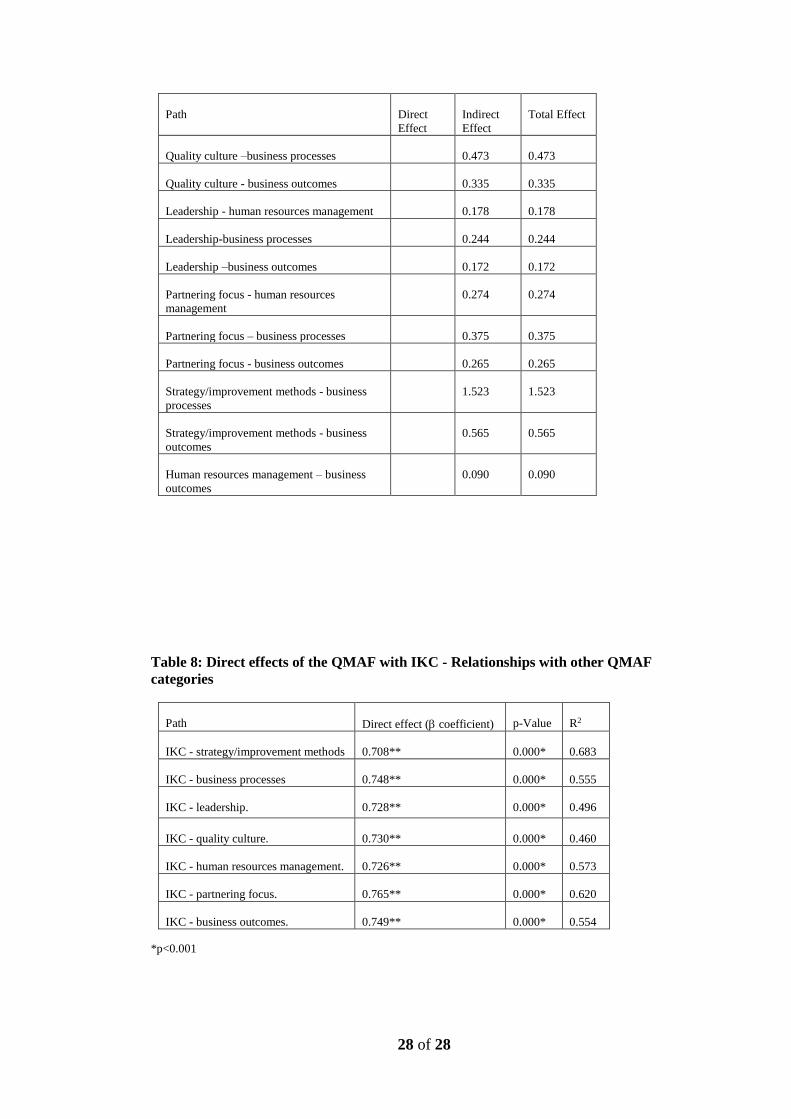
28 of 28
Path Direct
Effect
Indirect
Effect
Total Effect
Quality culture –business processes 0.473 0.473
Quality culture - business outcomes 0.335 0.335
Leadership - human resources management 0.178 0.178
Leadership-business processes 0.244 0.244
Leadership –business outcomes 0.172 0.172
Partnering focus - human resources
management
0.274 0.274
Partnering focus – business processes 0.375 0.375
Partnering focus - business outcomes 0.265 0.265
Strategy/improvement methods - business
processes
1.523
1.523
Strategy/improvement methods - business
outcomes
0.565 0.565
Human resources management – business
outcomes
0.090 0.090
Table 8: Direct effects of the QMAF with IKC - Relationships with other QMAF
categories
Path Direct effect ( coefficient) p-Value R2
IKC - strategy/improvement methods 0.708** 0.000* 0.683
IKC - business processes 0.748** 0.000* 0.555
IKC - leadership. 0.728** 0.000* 0.496
IKC - quality culture. 0.730** 0.000* 0.460
IKC - human resources management. 0.726** 0.000* 0.573
IKC - partnering focus. 0.765** 0.000* 0.620
IKC - business outcomes. 0.749** 0.000* 0.554
*p<0.001