Embed Size (px)
Citation preview
2010Copyright @ American Society of Regional Anesthesia and Pain Medicine. Unauthorized reproduction of this article is prohibited.
Practical Knobology for Ultrasound-GuidedRegional Anesthesia
Richard Brull, MD, FRCPC,* Alan J.R. Macfarlane, MBChB, MRCP, FRCA,Þ and Cyrus C.H. Tse, BSc*
Abstract: This article provides an instructive review of the essentialfunctions universal to modern ultrasound machines in use for regionalanesthesia practice. An understanding of machine knobology is integralto performing safe and successful ultrasound-guided regional anesthesia.
(Reg Anesth Pain Med 2010;35: S68YS73)
A thorough understanding of machine Bknobology[ is essen-tial to the safe and successful practice of ultrasound (US)-
guided regional anesthesia. Much like the basic functions ofour television sets (eg, volume, brightness, contrast, sharpness),all US machines share the same operative features that can andshould be manipulated to optimize imaging. These basic fea-tures are frequency, gain, depth, focus, time gain compensation(TGC), color Doppler, power Doppler, compound imaging, and,on some models, tissue harmonic imaging. A brief descriptionof each is provided below. Additional information and com-plementary figures relating to this article can be found in 2previously published review articles,1,2 which are reprinted asresource material in the present special supplement issue ofRegional Anesthesia and Pain Medicine.1,2
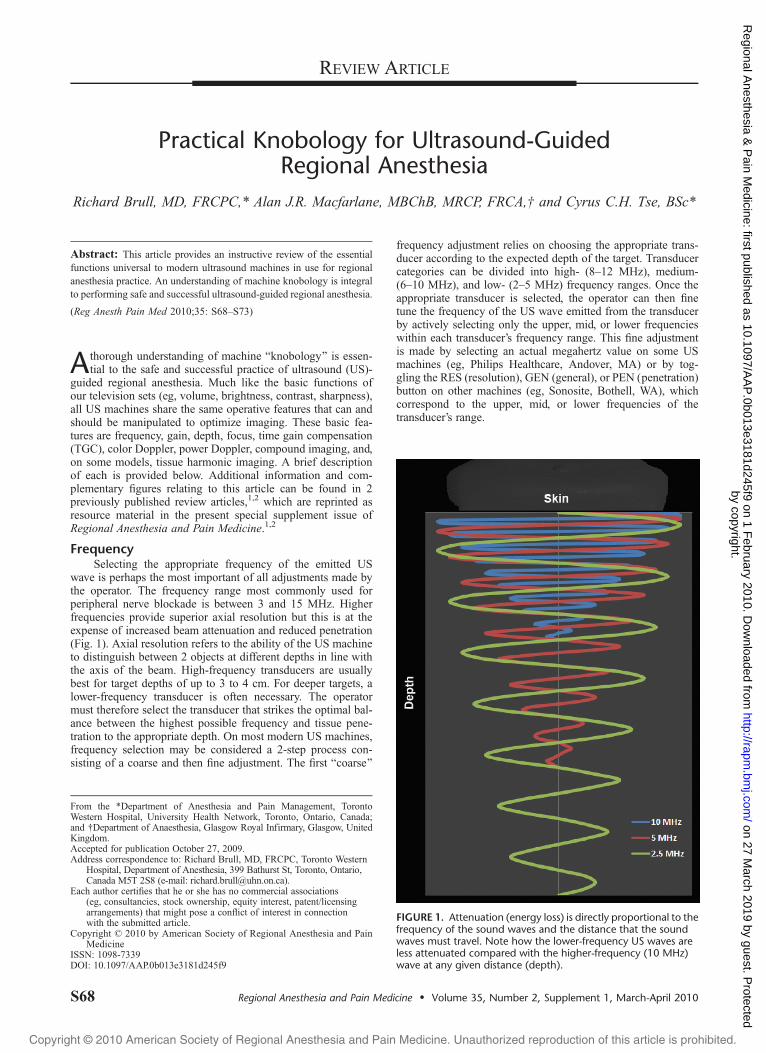
FrequencySelecting the appropriate frequency of the emitted US
wave is perhaps the most important of all adjustments made bythe operator. The frequency range most commonly used forperipheral nerve blockade is between 3 and 15 MHz. Higherfrequencies provide superior axial resolution but this is at theexpense of increased beam attenuation and reduced penetration(Fig. 1). Axial resolution refers to the ability of the US machineto distinguish between 2 objects at different depths in line withthe axis of the beam. High-frequency transducers are usuallybest for target depths of up to 3 to 4 cm. For deeper targets, alower-frequency transducer is often necessary. The operatormust therefore select the transducer that strikes the optimal bal-ance between the highest possible frequency and tissue pene-tration to the appropriate depth. On most modern US machines,frequency selection may be considered a 2-step process con-sisting of a coarse and then fine adjustment. The first Bcoarse[
frequency adjustment relies on choosing the appropriate trans-ducer according to the expected depth of the target. Transducercategories can be divided into high- (8Y12 MHz), medium-(6Y10 MHz), and low- (2Y5 MHz) frequency ranges. Once theappropriate transducer is selected, the operator can then finetune the frequency of the US wave emitted from the transducerby actively selecting only the upper, mid, or lower frequencieswithin each transducer’s frequency range. This fine adjustmentis made by selecting an actual megahertz value on some USmachines (eg, Philips Healthcare, Andover, MA) or by tog-gling the RES (resolution), GEN (general), or PEN (penetration)button on other machines (eg, Sonosite, Bothell, WA), whichcorrespond to the upper, mid, or lower frequencies of thetransducer’s range.
FIGURE 1. Attenuation (energy loss) is directly proportional to thefrequency of the sound waves and the distance that the soundwaves must travel. Note how the lower-frequency US waves areless attenuated compared with the higher-frequency (10 MHz)wave at any given distance (depth).
REVIEW ARTICLE
S68 Regional Anesthesia and Pain Medicine & Volume 35, Number 2, Supplement 1, March-April 2010
From the *Department of Anesthesia and Pain Management, TorontoWestern Hospital, University Health Network, Toronto, Ontario, Canada;and †Department of Anaesthesia, Glasgow Royal Infirmary, Glasgow, UnitedKingdom.Accepted for publication October 27, 2009.Address correspondence to: Richard Brull, MD, FRCPC, Toronto Western
Hospital, Department of Anesthesia, 399 Bathurst St, Toronto, Ontario,Canada M5T 2S8 (e-mail: [email protected]).
Each author certifies that he or she has no commercial associations(eg, consultancies, stock ownership, equity interest, patent/licensingarrangements) that might pose a conflict of interest in connectionwith the submitted article.
Copyright * 2010 by American Society of Regional Anesthesia and PainMedicine
ISSN: 1098-7339DOI: 10.1097/AAP.0b013e3181d245f9
by copyright. on 27 M
arch 2019 by guest. Protected
http://rapm.bm
j.com/
Regional A
nesthesia & P
ain Medicine: first published as 10.1097/A
AP
.0b013e3181d245f9 on 1 February 2010. D
ownloaded from
2010Copyright @ American Society of Regional Anesthesia and Pain Medicine. Unauthorized reproduction of this article is prohibited.
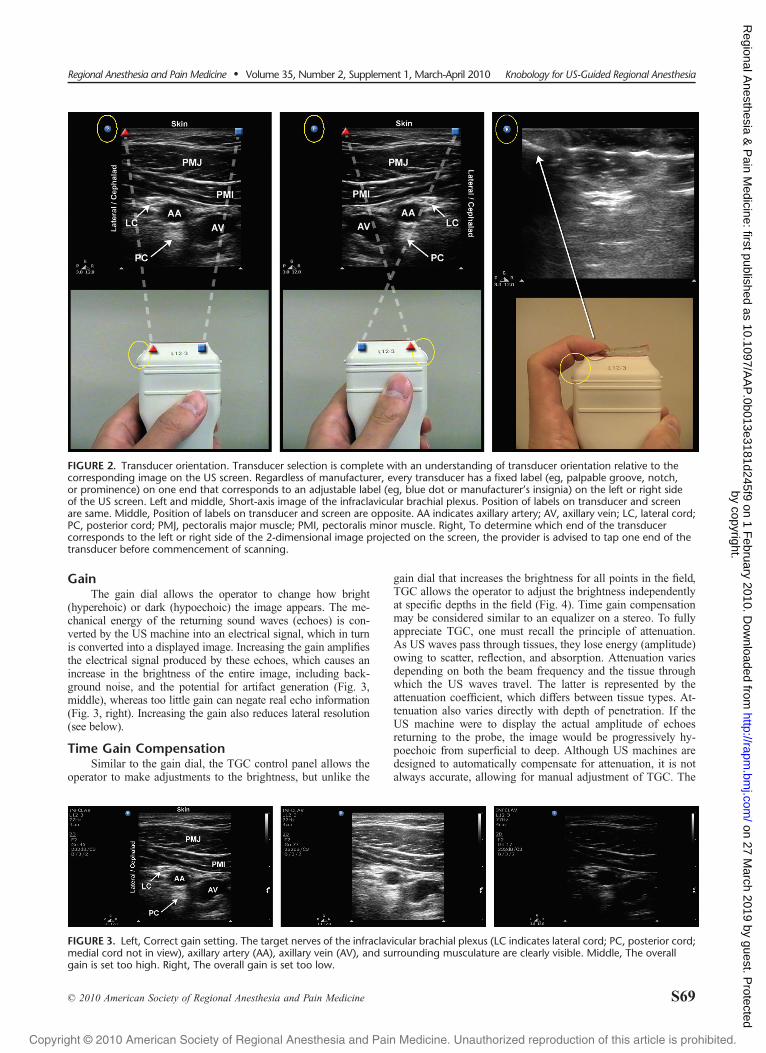
GainThe gain dial allows the operator to change how bright
(hyperehoic) or dark (hypoechoic) the image appears. The me-chanical energy of the returning sound waves (echoes) is con-verted by the US machine into an electrical signal, which in turnis converted into a displayed image. Increasing the gain amplifiesthe electrical signal produced by these echoes, which causes anincrease in the brightness of the entire image, including back-ground noise, and the potential for artifact generation (Fig. 3,middle), whereas too little gain can negate real echo information(Fig. 3, right). Increasing the gain also reduces lateral resolution(see below).
Time Gain CompensationSimilar to the gain dial, the TGC control panel allows the
operator to make adjustments to the brightness, but unlike the
gain dial that increases the brightness for all points in the field,TGC allows the operator to adjust the brightness independentlyat specific depths in the field (Fig. 4). Time gain compensationmay be considered similar to an equalizer on a stereo. To fullyappreciate TGC, one must recall the principle of attenuation.As US waves pass through tissues, they lose energy (amplitude)owing to scatter, reflection, and absorption. Attenuation variesdepending on both the beam frequency and the tissue throughwhich the US waves travel. The latter is represented by theattenuation coefficient, which differs between tissue types. At-tenuation also varies directly with depth of penetration. If theUS machine were to display the actual amplitude of echoesreturning to the probe, the image would be progressively hy-poechoic from superficial to deep. Although US machines aredesigned to automatically compensate for attenuation, it is notalways accurate, allowing for manual adjustment of TGC. The
FIGURE 2. Transducer orientation. Transducer selection is complete with an understanding of transducer orientation relative to thecorresponding image on the US screen. Regardless of manufacturer, every transducer has a fixed label (eg, palpable groove, notch,or prominence) on one end that corresponds to an adjustable label (eg, blue dot or manufacturer’s insignia) on the left or right sideof the US screen. Left and middle, Short-axis image of the infraclavicular brachial plexus. Position of labels on transducer and screenare same. Middle, Position of labels on transducer and screen are opposite. AA indicates axillary artery; AV, axillary vein; LC, lateral cord;PC, posterior cord; PMJ, pectoralis major muscle; PMI, pectoralis minor muscle. Right, To determine which end of the transducercorresponds to the left or right side of the 2-dimensional image projected on the screen, the provider is advised to tap one end of thetransducer before commencement of scanning.
FIGURE 3. Left, Correct gain setting. The target nerves of the infraclavicular brachial plexus (LC indicates lateral cord; PC, posterior cord;medial cord not in view), axillary artery (AA), axillary vein (AV), and surrounding musculature are clearly visible. Middle, The overallgain is set too high. Right, The overall gain is set too low.
Regional Anesthesia and Pain Medicine & Volume 35, Number 2, Supplement 1, March-April 2010 Knobology for US-Guided Regional Anesthesia
* 2010 American Society of Regional Anesthesia and Pain Medicine S69
by copyright. on 27 M
arch 2019 by guest. Protected
http://rapm.bm
j.com/
Regional A
nesthesia & P
ain Medicine: first published as 10.1097/A
AP
.0b013e3181d245f9 on 1 February 2010. D
ownloaded from
2010Copyright @ American Society of Regional Anesthesia and Pain Medicine. Unauthorized reproduction of this article is prohibited.
TGC panel is most commonly used to increase the brightnessof structures in the far field (deep structures) to create a uni-form image. Some machines have individual controls (Bslidepots[) for each small segment of the display (eg, Philips, GE),whereas others simply have Bnear[ and Bfar[ gain (eg, Sonosite).
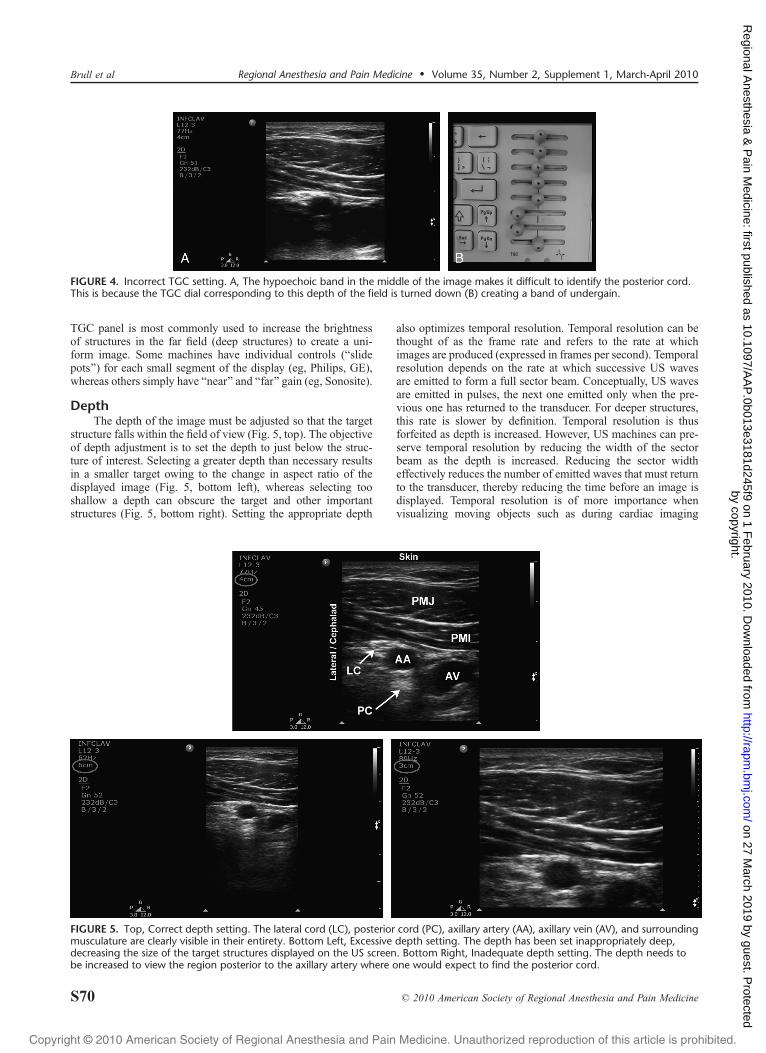
DepthThe depth of the image must be adjusted so that the target
structure falls within the field of view (Fig. 5, top). The objectiveof depth adjustment is to set the depth to just below the struc-ture of interest. Selecting a greater depth than necessary resultsin a smaller target owing to the change in aspect ratio of thedisplayed image (Fig. 5, bottom left), whereas selecting tooshallow a depth can obscure the target and other importantstructures (Fig. 5, bottom right). Setting the appropriate depth
also optimizes temporal resolution. Temporal resolution can bethought of as the frame rate and refers to the rate at whichimages are produced (expressed in frames per second). Temporalresolution depends on the rate at which successive US wavesare emitted to form a full sector beam. Conceptually, US wavesare emitted in pulses, the next one emitted only when the pre-vious one has returned to the transducer. For deeper structures,this rate is slower by definition. Temporal resolution is thusforfeited as depth is increased. However, US machines can pre-serve temporal resolution by reducing the width of the sectorbeam as the depth is increased. Reducing the sector widtheffectively reduces the number of emitted waves that must returnto the transducer, thereby reducing the time before an image isdisplayed. Temporal resolution is of more importance whenvisualizing moving objects such as during cardiac imaging
FIGURE 4. Incorrect TGC setting. A, The hypoechoic band in the middle of the image makes it difficult to identify the posterior cord.This is because the TGC dial corresponding to this depth of the field is turned down (B) creating a band of undergain.
FIGURE 5. Top, Correct depth setting. The lateral cord (LC), posterior cord (PC), axillary artery (AA), axillary vein (AV), and surroundingmusculature are clearly visible in their entirety. Bottom Left, Excessive depth setting. The depth has been set inappropriately deep,decreasing the size of the target structures displayed on the US screen. Bottom Right, Inadequate depth setting. The depth needs tobe increased to view the region posterior to the axillary artery where one would expect to find the posterior cord.
Brull et al Regional Anesthesia and Pain Medicine & Volume 35, Number 2, Supplement 1, March-April 2010
S70 * 2010 American Society of Regional Anesthesia and Pain Medicine
by copyright. on 27 M
arch 2019 by guest. Protected
http://rapm.bm
j.com/
Regional A
nesthesia & P
ain Medicine: first published as 10.1097/A
AP
.0b013e3181d245f9 on 1 February 2010. D
ownloaded from
2010Copyright @ American Society of Regional Anesthesia and Pain Medicine. Unauthorized reproduction of this article is prohibited.
and arguably less important in regional anesthesia. A low framerate, however, could create a blurred image during needle move-ment or rapid injection of local anesthetic.
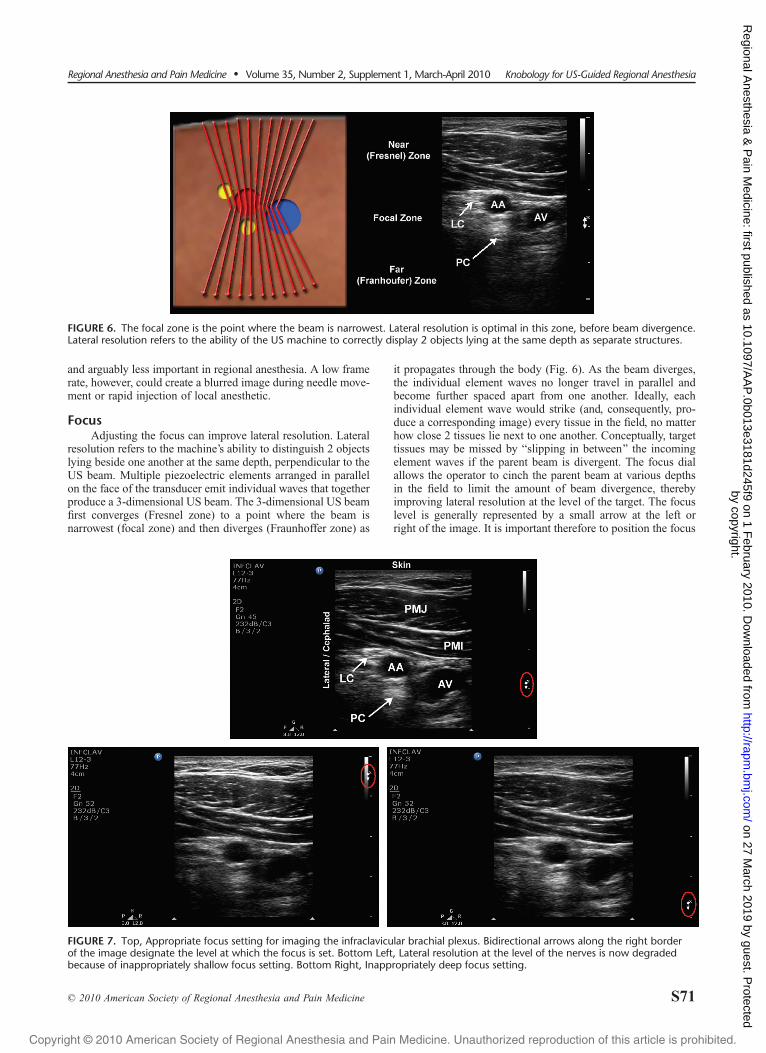
FocusAdjusting the focus can improve lateral resolution. Lateral
resolution refers to the machine’s ability to distinguish 2 objectslying beside one another at the same depth, perpendicular to theUS beam. Multiple piezoelectric elements arranged in parallelon the face of the transducer emit individual waves that togetherproduce a 3-dimensional US beam. The 3-dimensional US beamfirst converges (Fresnel zone) to a point where the beam isnarrowest (focal zone) and then diverges (Fraunhoffer zone) as
it propagates through the body (Fig. 6). As the beam diverges,the individual element waves no longer travel in parallel andbecome further spaced apart from one another. Ideally, eachindividual element wave would strike (and, consequently, pro-duce a corresponding image) every tissue in the field, no matterhow close 2 tissues lie next to one another. Conceptually, targettissues may be missed by Bslipping in between[ the incomingelement waves if the parent beam is divergent. The focus dialallows the operator to cinch the parent beam at various depthsin the field to limit the amount of beam divergence, therebyimproving lateral resolution at the level of the target. The focuslevel is generally represented by a small arrow at the left orright of the image. It is important therefore to position the focus
FIGURE 7. Top, Appropriate focus setting for imaging the infraclavicular brachial plexus. Bidirectional arrows along the right borderof the image designate the level at which the focus is set. Bottom Left, Lateral resolution at the level of the nerves is now degradedbecause of inappropriately shallow focus setting. Bottom Right, Inappropriately deep focus setting.
FIGURE 6. The focal zone is the point where the beam is narrowest. Lateral resolution is optimal in this zone, before beam divergence.Lateral resolution refers to the ability of the US machine to correctly display 2 objects lying at the same depth as separate structures.
Regional Anesthesia and Pain Medicine & Volume 35, Number 2, Supplement 1, March-April 2010 Knobology for US-Guided Regional Anesthesia
* 2010 American Society of Regional Anesthesia and Pain Medicine S71
by copyright. on 27 M
arch 2019 by guest. Protected
http://rapm.bm
j.com/
Regional A
nesthesia & P
ain Medicine: first published as 10.1097/A
AP
.0b013e3181d245f9 on 1 February 2010. D
ownloaded from
2010Copyright @ American Society of Regional Anesthesia and Pain Medicine. Unauthorized reproduction of this article is prohibited.
of the beam at the same level as the target(s) of interest (Fig. 7).Some machines offer the ability to set multiple focus zones.However, increasing the number of focal zones occurs at theexpense of temporal resolution as the machine spends moretime listening for returning echoes and processing each image.
Color DopplerColor Doppler technology superimposes Doppler informa-
tion on the real-time image and allows for the identification andquantification (velocity, direction) of blood flow. The Dopplerprinciple states that if a sound wave is emitted (or reflected) by amoving object, the frequency of that sound wave will change asthe object moves toward or away from a stationary listener. Thisis the same principle that explains why the pitch (frequency)from a siren on an approaching ambulance sounds high and thenlow once the ambulance passes and speeds away.
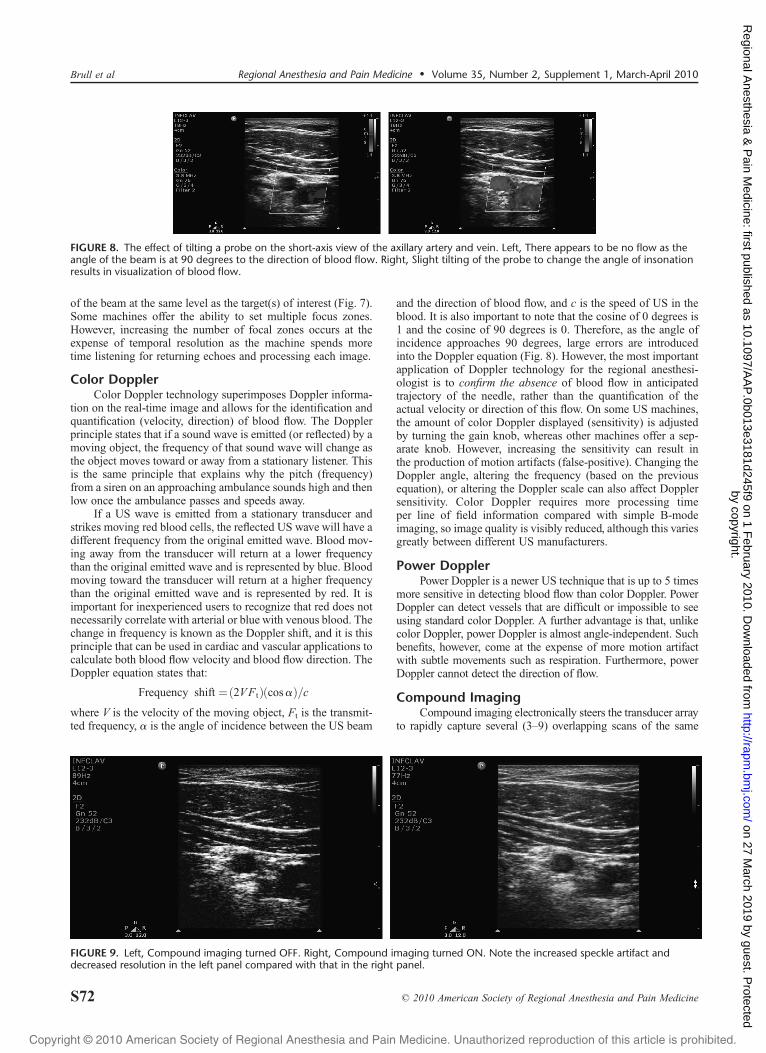
If a US wave is emitted from a stationary transducer andstrikes moving red blood cells, the reflected US wave will have adifferent frequency from the original emitted wave. Blood mov-ing away from the transducer will return at a lower frequencythan the original emitted wave and is represented by blue. Bloodmoving toward the transducer will return at a higher frequencythan the original emitted wave and is represented by red. It isimportant for inexperienced users to recognize that red does notnecessarily correlate with arterial or blue with venous blood. Thechange in frequency is known as the Doppler shift, and it is thisprinciple that can be used in cardiac and vascular applications tocalculate both blood flow velocity and blood flow direction. TheDoppler equation states that:
Frequency shift ¼ð2VFtÞðcos>Þ=cwhere V is the velocity of the moving object, Ft is the transmit-ted frequency, > is the angle of incidence between the US beam
and the direction of blood flow, and c is the speed of US in theblood. It is also important to note that the cosine of 0 degrees is1 and the cosine of 90 degrees is 0. Therefore, as the angle ofincidence approaches 90 degrees, large errors are introducedinto the Doppler equation (Fig. 8). However, the most importantapplication of Doppler technology for the regional anesthesi-ologist is to confirm the absence of blood flow in anticipatedtrajectory of the needle, rather than the quantification of theactual velocity or direction of this flow. On some US machines,the amount of color Doppler displayed (sensitivity) is adjustedby turning the gain knob, whereas other machines offer a sep-arate knob. However, increasing the sensitivity can result inthe production of motion artifacts (false-positive). Changing theDoppler angle, altering the frequency (based on the previousequation), or altering the Doppler scale can also affect Dopplersensitivity. Color Doppler requires more processing timeper line of field information compared with simple B-modeimaging, so image quality is visibly reduced, although this variesgreatly between different US manufacturers.
Power DopplerPower Doppler is a newer US technique that is up to 5 times
more sensitive in detecting blood flow than color Doppler. PowerDoppler can detect vessels that are difficult or impossible to seeusing standard color Doppler. A further advantage is that, unlikecolor Doppler, power Doppler is almost angle-independent. Suchbenefits, however, come at the expense of more motion artifactwith subtle movements such as respiration. Furthermore, powerDoppler cannot detect the direction of flow.
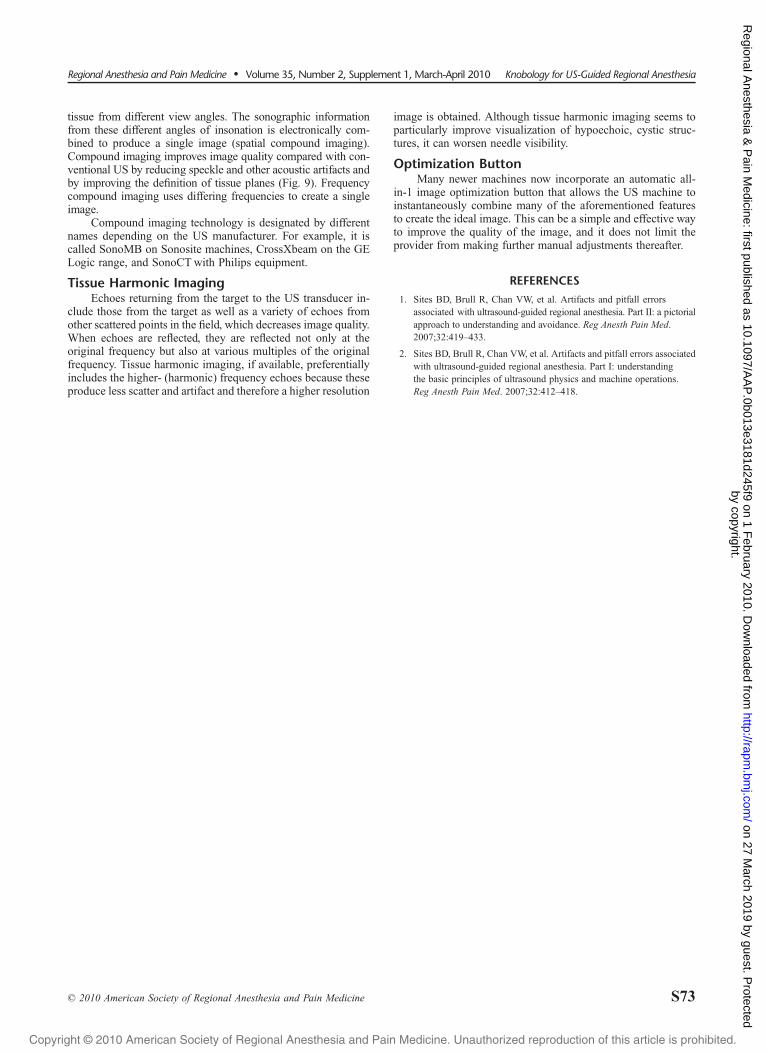
Compound ImagingCompound imaging electronically steers the transducer array
to rapidly capture several (3Y9) overlapping scans of the same
FIGURE 9. Left, Compound imaging turned OFF. Right, Compound imaging turned ON. Note the increased speckle artifact anddecreased resolution in the left panel compared with that in the right panel.
FIGURE 8. The effect of tilting a probe on the short-axis view of the axillary artery and vein. Left, There appears to be no flow as theangle of the beam is at 90 degrees to the direction of blood flow. Right, Slight tilting of the probe to change the angle of insonationresults in visualization of blood flow.
Brull et al Regional Anesthesia and Pain Medicine & Volume 35, Number 2, Supplement 1, March-April 2010
S72 * 2010 American Society of Regional Anesthesia and Pain Medicine
by copyright. on 27 M
arch 2019 by guest. Protected
http://rapm.bm
j.com/
Regional A
nesthesia & P
ain Medicine: first published as 10.1097/A
AP
.0b013e3181d245f9 on 1 February 2010. D
ownloaded from
2010Copyright @ American Society of Regional Anesthesia and Pain Medicine. Unauthorized reproduction of this article is prohibited.
tissue from different view angles. The sonographic informationfrom these different angles of insonation is electronically com-bined to produce a single image (spatial compound imaging).Compound imaging improves image quality compared with con-ventional US by reducing speckle and other acoustic artifacts andby improving the definition of tissue planes (Fig. 9). Frequencycompound imaging uses differing frequencies to create a singleimage.
Compound imaging technology is designated by differentnames depending on the US manufacturer. For example, it iscalled SonoMB on Sonosite machines, CrossXbeam on the GELogic range, and SonoCTwith Philips equipment.
Tissue Harmonic ImagingEchoes returning from the target to the US transducer in-
clude those from the target as well as a variety of echoes fromother scattered points in the field, which decreases image quality.When echoes are reflected, they are reflected not only at theoriginal frequency but also at various multiples of the originalfrequency. Tissue harmonic imaging, if available, preferentiallyincludes the higher- (harmonic) frequency echoes because theseproduce less scatter and artifact and therefore a higher resolution
image is obtained. Although tissue harmonic imaging seems toparticularly improve visualization of hypoechoic, cystic struc-tures, it can worsen needle visibility.
Optimization ButtonMany newer machines now incorporate an automatic all-
in-1 image optimization button that allows the US machine toinstantaneously combine many of the aforementioned featuresto create the ideal image. This can be a simple and effective wayto improve the quality of the image, and it does not limit theprovider from making further manual adjustments thereafter.
REFERENCES
1. Sites BD, Brull R, Chan VW, et al. Artifacts and pitfall errorsassociated with ultrasound-guided regional anesthesia. Part II: a pictorialapproach to understanding and avoidance. Reg Anesth Pain Med.2007;32:419Y433.
2. Sites BD, Brull R, Chan VW, et al. Artifacts and pitfall errors associatedwith ultrasound-guided regional anesthesia. Part I: understandingthe basic principles of ultrasound physics and machine operations.Reg Anesth Pain Med. 2007;32:412Y418.
Regional Anesthesia and Pain Medicine & Volume 35, Number 2, Supplement 1, March-April 2010 Knobology for US-Guided Regional Anesthesia
* 2010 American Society of Regional Anesthesia and Pain Medicine S73
by copyright. on 27 M
arch 2019 by guest. Protected
http://rapm.bm
j.com/
Regional A
nesthesia & P
ain Medicine: first published as 10.1097/A
AP
.0b013e3181d245f9 on 1 February 2010. D
ownloaded from


![Ultrasound Guided Vascular Access[2]](https://img.pdfslide.net/doc/110x75/5420582a7bef0a06088b4679/ultrasound-guided-vascular-access2.jpg)