Embed Size (px)
Citation preview

www.hsl.gov.uk An Agency of the Health and Safety Executive
www.hsl.gov.uk An Agency of the Health and Safety Executive
Practical Quality Measures for
Large-Eddy Simulation
Simon Gant
An Agency of the Health and Safety Executive
Contents
• Health and Safety Context
• LES/DES/SAS Quality
– Grid Resolution
• Application
• Conclusions

An Agency of the Health and Safety Executive
LES in Health and Safety
• Fire Dynamics Simulator (FDS) from NIST
• Used extensively in fire investigation, e.g.
collapse of World Trade Center twin towers
“ ”
• OECD Best Practice Guidelines for CFD in
Nuclear Reactor Safety Applications:
An Agency of the Health and Safety Executive
LES/DES/SAS Quality Issues
• Subgrid-scale model
• Wall treatment
• Unsteady inflow conditions
• Numerical schemes
• Grid dependence
• Temporal treatment
Differences compared to RANS quality issues:

An Agency of the Health and Safety Executive
Grid Resolution
• Complex issue: dynamic interaction of model and discretization errors
• In the limit: – Overly coarse grids produce poor results
– Very fine grid, LES results tend to DNS
• What practical guidance exists on grid resolution?
1. Rules of thumb
2. Measures based on prior RANS
3. Single-grid estimators
4. Multi-grid estimators
e.g. 20 cells across characteristic fire diameter

An Agency of the Health and Safety Executive
2. Measures based on RANS
• Ratio of integral turbulence length scale to
grid cell size: 10
/2/3
k
• Ratio of grid cell size to Kolmogorov length
scale:
25
/4/13
• Near-wall spacing, for wall-resolving LES:
(x+, y+, z+) < (100, 2, 20)
“Young person’s guide to DES Grids”, Spalart 2001

An Agency of the Health and Safety Executive
3. Single-grid estimators
• Viscosity ratio, νeff/ν
< 20 for Ret ~ 1200
< 5 for Ret ~ 300
• Relative effective viscosity index
• Subgrid activity parameter
• Proportion of resolved turbulent kinetic energy:
8.0 numsgsres
res
kkk
k
• Power spectral density (-5/3 slope)
An Agency of the Health and Safety Executive
4. Multi-grid estimators
• “Index of Quality” of Celik et al. (2005)
• Grid and Model variation of Klein (2005)
• Both based on Richardson extrapolation using
multiple LES solutions

An Agency of the Health and Safety Executive
Known Limitations
• Accuracy of RANS model, esp. in transitional or massively separated flows.
• Subgrid activity parameter close to 1.0 in most industrial LES
• Resolved TKE can be higher on coarse grid than on fine grid
• Magnitude of numerical dissipation?
• Multi-grid methods: resolution not in asymptotic range for RE, interaction of errors
• Spectra: modified by buoyancy, only found at points and in low-Re flows?
An Agency of the Health and Safety Executive
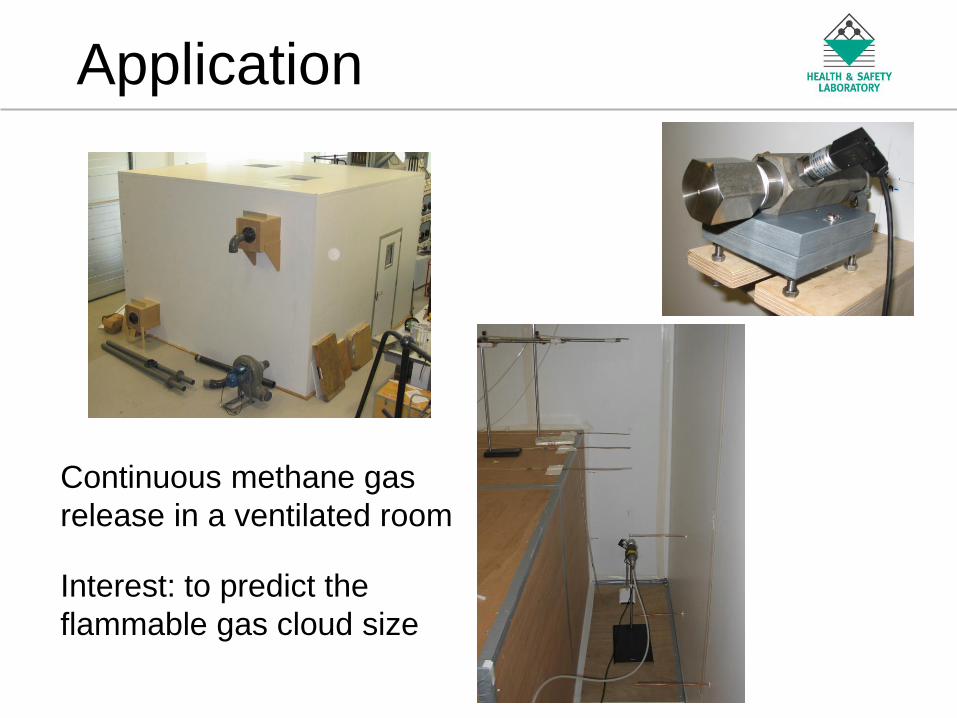
Application
Continuous methane gas
release in a ventilated room
Interest: to predict the
flammable gas cloud size

An Agency of the Health and Safety Executive
Flow Behaviour

An Agency of the Health and Safety Executive
Grids Coarse (0.2M nodes) Medium (0.4M nodes)
Fine
(0.7M nodes)
An Agency of the Health and Safety Executive
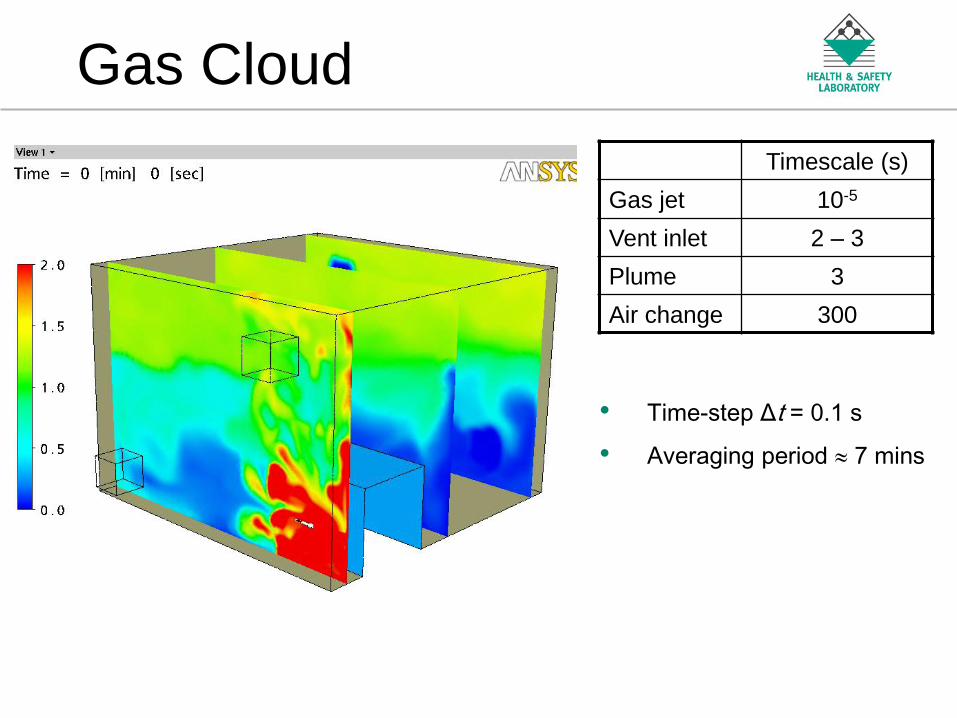
Gas Cloud
Timescale (s)
Gas jet 10-5
Vent inlet 2 – 3
Plume 3
Air change 300
• Time-step Δt = 0.1 s
• Averaging period 7 mins

An Agency of the Health and Safety Executive
Grid Resolution
10/2/3 k
25
kres/(kres + ksgs) > 0.8
LES_IQk > 0.8

An Agency of the Health and Safety Executive
Results
0
0.2
0.4
0.6
0.8
1
1.2
DES
Coarse
DES
Medium
DES
Fine
SAS
Coarse
SAS
Medium
SAS
Fine
URANS
Coarse
URANS
Medium
URANS
Fine
RANS
Coarse
RANS
Medium
RANS
Fine
Av
era
ge
Err
or
in P
red
icte
d G
as
Co
nc
en
tra
tio
n
(% v
ol/v
ol)
Average error between CFD and experiments

An Agency of the Health and Safety Executive
Results
0.00
0.10
0.20
0.30
0.40
0.50
0.60
0.70
0.80
0.90
DES
Coarse
DES
Medium
DES
Fine
SAS
Coarse
SAS
Medium
SAS
Fine
URANS
Coarse
URANS
Medium
URANS
Fine
RANS
Coarse
RANS
Medium
RANS
Fine
Vz V
olu
me (
m3)
Predicted mean gas cloud size and 95% confidence intervals

An Agency of the Health and Safety Executive
Computing Time
0
20
40
60
80
100
120
140
DES
Coarse
DES
Medium
DES
Fine
SAS
Coarse
SAS
Medium
SAS
Fine
URANS
Coarse
URANS
Medium
URANS
Fine
RANS
Coarse
RANS
Medium
RANS
Fine
Co
mp
uti
ng
Tim
e (
CP
U d
ay
s)
Computing time in CPU days

An Agency of the Health and Safety Executive
Conclusions
• Number of grid resolution indices in literature.
• Each has advantages/limitations, none ideal.
• Results for test case show that DES/SAS can be worse than SST if grid resolution marginal.
• SAS appears sensitive to grid resolution.
• Confidence Intervals useful to identify statistical uncertainty and define duration of simulation.
• Further research in LES/DES/SAS/URANS quality and trust required: cohort studies?
• Suggestion: document grid resolution and statistical uncertainty in future results.

An Agency of the Health and Safety Executive
Acknowledgements
• Gildas Augin (Efectis) for FDS animations
• Andrew Patton (Oxford)
• Raf Theunissen (VKI)
• M. L. Riethmuller (VKI)
• Adrian Kelsey (HSL)
for assistance with
bootstrapping

An Agency of the Health and Safety Executive
Questions?

An Agency of the Health and Safety Executive

An Agency of the Health and Safety Executive
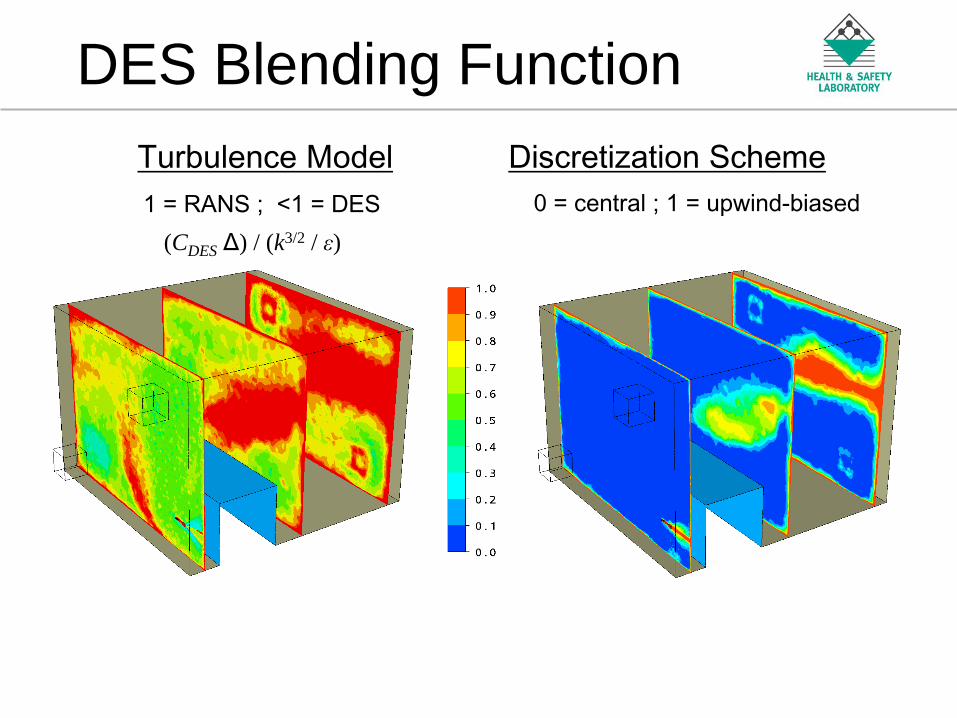
DES Blending Function
Turbulence Model Discretization Scheme
DESFk *
1,1
/max
2/3
SST
DES
DES FC
kF
Set to zero to recover Strelets
(2001) model
CipUipip ,, 1
3tanh A
0,5.0max max
gL
CA
turb
DES
c
kLturb
104 10,tanhmax Bg
1022
10,2
max
,max2
S
SB
1,
5min1,maxlim
CFL
CDES = 0.61
An Agency of the Health and Safety Executive
DES Blending Function
Turbulence Model Discretization Scheme
0 = central ; 1 = upwind-biased 1 = RANS ; <1 = DES
(CDES Δ) / (k3/2 / ε)
An Agency of the Health and Safety Executive
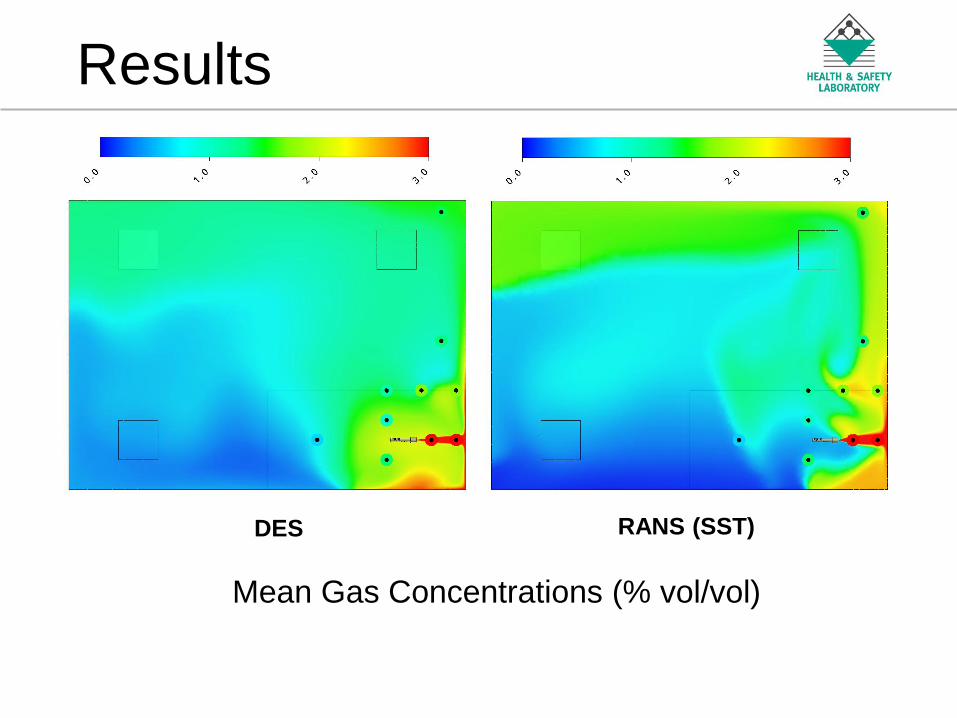
Results
DES RANS (SST)
Mean Gas Concentrations (% vol/vol)

An Agency of the Health and Safety Executive
Results

An Agency of the Health and Safety Executive
LES “Index of Quality”
pkrestot hakk
2
122
21
hh
kka resres
k
21 resres kk
p = 2
Cell size
ak << 0
ktot < 0
tot
restot
kk
kkIQ
1LES_
Subscript: 1= Medium, 2 = fine
Problems when: or when:
LES_IQk > 1
21 resres kk
ak < 0
kres + akhp < | akh
p |
LES_IQk < 0
1
tot
restot
k
kk
An Agency of the Health and Safety Executive
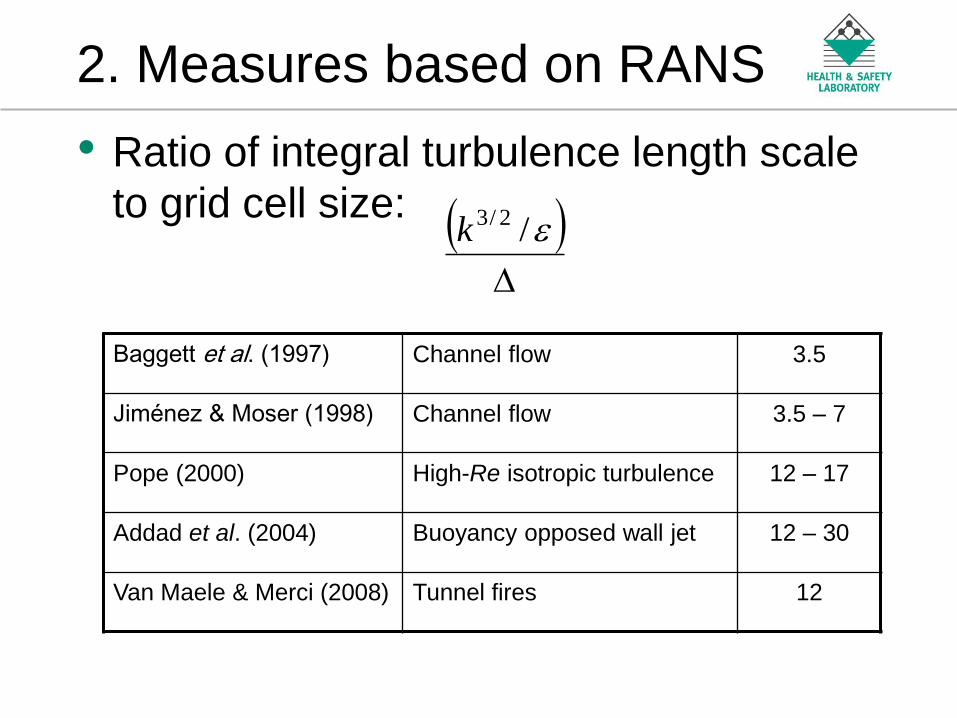
2. Measures based on RANS
• Ratio of integral turbulence length scale
to grid cell size:
/2/3k
Baggett et al. (1997) Channel flow 3.5
Jiménez & Moser (1998) Channel flow 3.5 – 7
Pope (2000) High-Re isotropic turbulence 12 – 17
Addad et al. (2004) Buoyancy opposed wall jet 12 – 30
Van Maele & Merci (2008) Tunnel fires 12
An Agency of the Health and Safety Executive
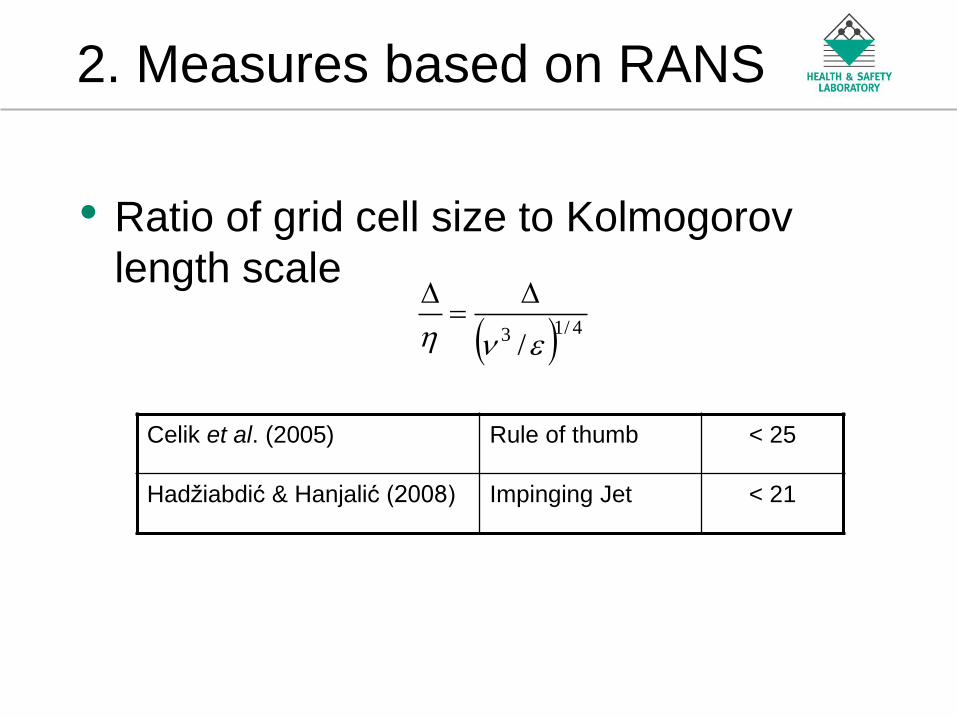
2. Measures based on RANS
• Ratio of grid cell size to Kolmogorov
length scale
4/13 /
Celik et al. (2005) Rule of thumb < 25
Hadžiabdić & Hanjalić (2008) Impinging Jet < 21

An Agency of the Health and Safety Executive
3. Single-grid estimators
• Subgrid activity parameter (Geurts & Fröhlich, 2002)
2
2
S
S
t
t
t
ts
= 0 for DNS
= 1 for high-Re LES
An Agency of the Health and Safety Executive
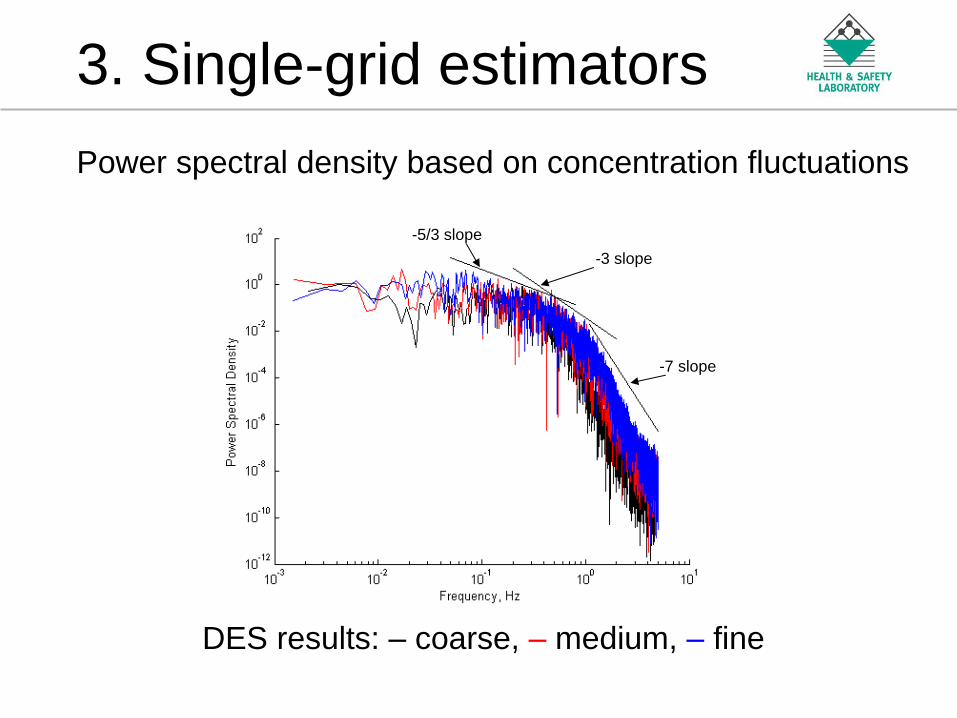
3. Single-grid estimators
Power spectral density based on concentration fluctuations
-5/3 slope
-3 slope
-7 slope
DES results: – coarse, – medium, – fine

An Agency of the Health and Safety Executive
Error in Percentage Terms
0
10
20
30
40
50
60
DES
Coarse
DES
Medium
DES
Fine
SAS
Coarse
SAS
Medium
SAS
Fine
URANS
Coarse
URANS
Medium
URANS
Fine
RANS
Coarse
RANS
Medium
RANS
Fine
Av
era
ge
Pe
rce
nta
ge
Err
or
(%)

An Agency of the Health and Safety Executive
Statistical Uncertainty
0
1
2
3
4
5
6
7
8
9
0 1000 2000 3000 4000 5000
Time, t (s)
Ve
loc
ity
, U(t
) (m
/s)
velocity signal uncorrelated samples
• How long should the LES calculation be continued?
• Assess uncertainty in mean values using
Confidence Intervals
• “95% confident that mean lies between x and y m/s”
• Fractional error:
U
nukes
2
Variance
Number of
uncorrelated
samples
An Agency of the Health and Safety Executive
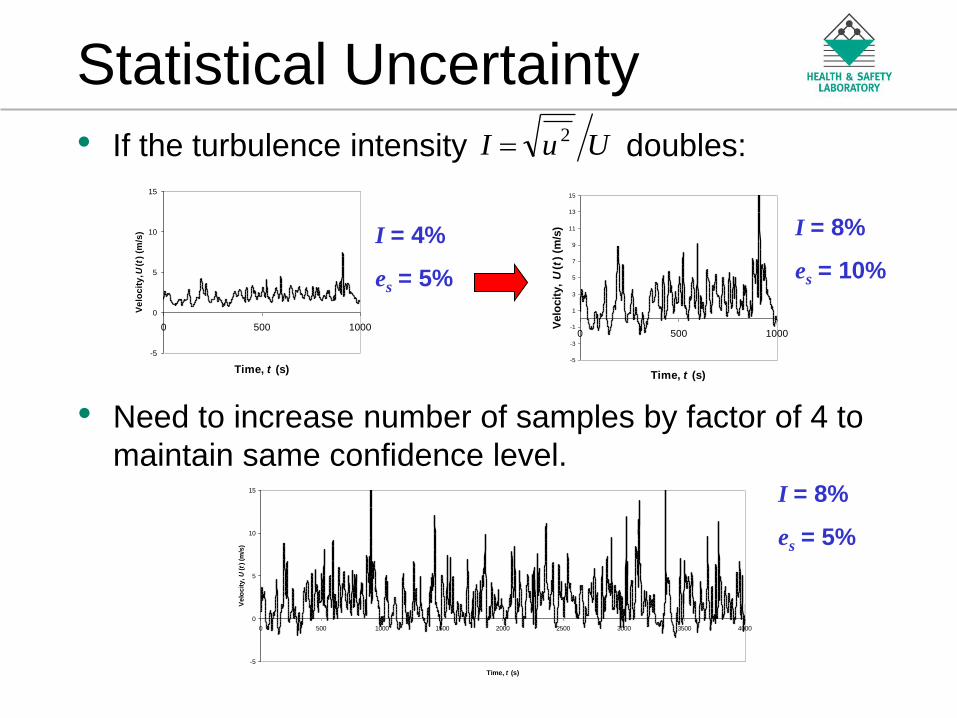
Statistical Uncertainty
• If the turbulence intensity doubles: UuI 2
• Need to increase number of samples by factor of 4 to
maintain same confidence level.
-5
0
5
10
15
0 500 1000
Time, t (s)
Ve
loc
ity
, U(t
) (m
/s)
-5
-3
-1
1
3
5
7
9
11
13
15
0 500 1000
Time, t (s)
Velo
cit
y,
U(t
) (m
/s)
-5
0
5
10
15
0 500 1000 1500 2000 2500 3000 3500 4000
Time, t (s)
Ve
loc
ity
, U
(t)
(m/s
)I = 4%
es = 5%
I = 8%
es = 10%
I = 8%
es = 5%

An Agency of the Health and Safety Executive
Statistical Uncertainty
• Classical approaches to calculate CI rely on uncorrelated data – Problem: need to sample signal at intervals spaced
τ apart
– How to calculate τ ? Various approaches possible which produce different es
• Alternative: bootstrapping – Can handle correlated data
– Automatic block length selector means no user-defined parameters
– Can also be used to calculate confidence intervals on Reynolds stresses etc.
An Agency of the Health and Safety Executive
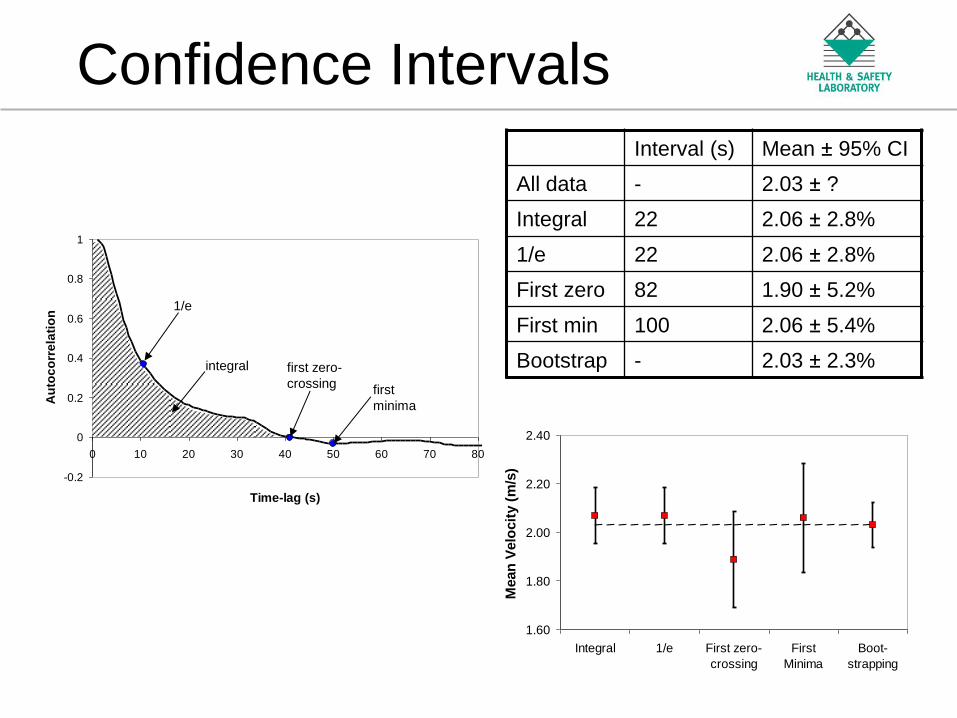
Confidence Intervals
-0.2
0
0.2
0.4
0.6
0.8
1
0 10 20 30 40 50 60 70 80
Time-lag (s)
Au
toc
orr
ela
tio
n
1/e
integral first zero-
crossing first
minima
Interval (s) Mean ± 95% CI
All data - 2.03 ± ?
Integral 22 2.06 ± 2.8%
1/e 22 2.06 ± 2.8%
First zero 82 1.90 ± 5.2%
First min 100 2.06 ± 5.4%
Bootstrap - 2.03 ± 2.3%
1.60
1.80
2.00
2.20
2.40
Integral 1/e First zero-
crossing
First
Minima
Boot-
strapping
Mean
Velo
cit
y (
m/s
)

An Agency of the Health and Safety Executive
Bootstrapping • Theunissen, R., A. Di Sante, M.L. Riethmuller, and R.A. Van den
Braembussche, Confidence estimation using dependent circular block bootstrapping: application to the statistical analysis of PIV measurements. Exp. Fluids, 2008. 44: p. 591-596.
• Garcia, C.M., P.R. Hackson, and M.H. Garcia, Confidence intervals in the determination of turbulence parameters. Exp. Fluids, 2006. 40: p. 514-522.
• Wilks, D.S., Statistical methods in the atmospheric sciences. 2nd ed. 2006: Academic Press, Elsevier.
• Politis, D.N. and H. White, Automatic block-length selection for the dependent bootstrap. Econometric Reviews, 2004. 23(1): p. 53-70.
• Patton, A., D.N. Politis, and H. White, Correction to "Automatic block-length selection for the dependent bootstrap" by D. Politis and H. White. Submitted for publication, 2008
(http://www.economics.ox.ac.uk/members/andrew.patton)